Box Theory [Interactive Zones] PyraTimeThis script combines Nicholas Darvas’s "Box Theory" with modern Supply and Demand (Premium/Discount) concepts. It automatically identifies the most recent Swing High and Swing Low to delineate the current trading range.
The purpose of this tool is to visualize market structure and help traders identify when price is relatively expensive (Premium) or cheap (Discount) within a defined range.
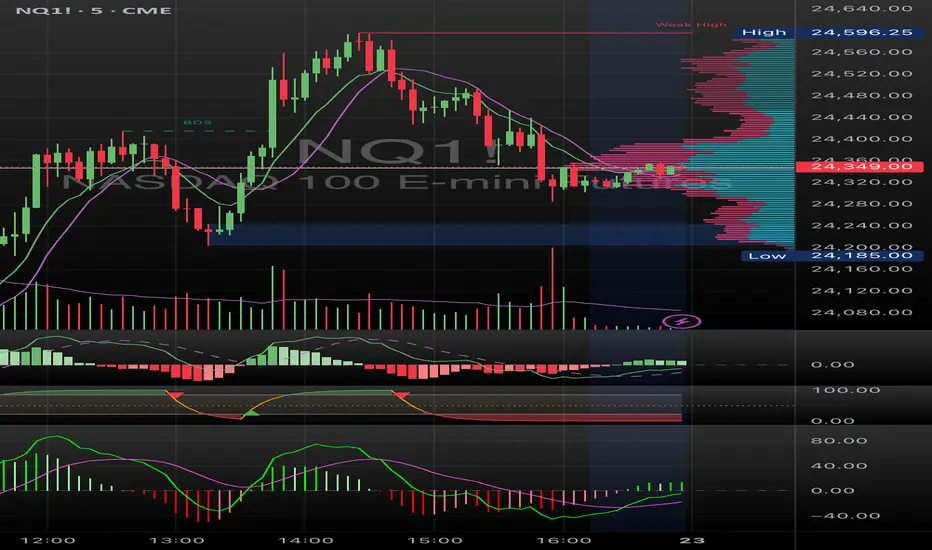
Visual Guide: What You Are Seeing
The Box: Represents the active trading range defined by the most recent significant Swing High and Swing Low.
Red Zone (Premium): The top 25% of the range. Mathematically, prices here are considered "expensive" relative to the current structure.
Green Zone (Discount): The bottom 25% of the range. Prices here are considered "cheap" relative to the current structure.
Grey Zone (Equilibrium): The middle 50% of the range. This is the area of fair value where price often consolidates.
Dashed Line (EQ): The exact 50% midpoint of the range.
Tutorial: How to Trade Using This Indicator
Method 1: Mean Reversion (Range Trading) This method applies when the market is moving sideways.
Identify Structure: Wait for a box to form.
Wait for Extremes: Do not trade when price is in the middle (Grey/White area). Wait for price to enter the Red or Green zones.
Entry Trigger:
Shorts: When price enters the Red Zone, look for a rejection (wicks leaving the zone) or a lower timeframe breakdown. Target the EQ (Midline) as your first take profit.
Longs: When price enters the Green Zone, look for support formation. Target the EQ (Midline) as your first take profit.
Method 2: Trend Continuation (Breakouts) This method applies when the market is trending strongly.
Breakout: Monitor the alerts. A close outside the box indicates a potential shift in market structure.
Retest: After a breakout up, the old "Red Zone" (Resistance) often flips to become new Support. Wait for price to pull back to the top of the old box before entering.
Configuration Guide (Settings)
Pivot Left/Right Bars (Sensitivity):
Default (20/20): Best for Swing Trading. It filters out market noise and only draws boxes based on major structural points.
Lower (5/5): Best for Scalping. It will create smaller, more frequent boxes but increases the risk of false signals.
Zone Percentage:
Default (25%): Standard deviation for Supply/Demand zones.
Alternative (15%): Use this for "sniping" entries at the absolute extremes of the range.
Multi-Timeframe (MTF):
Enable "Use Higher Timeframe" to see Daily or Weekly ranges while trading on lower timeframes (like the 15m or 1H). This helps keep your intraday trades aligned with the major trend.
Technical Note on "Lag" This indicator uses Pivots to draw the box. A pivot is only confirmed after a certain number of bars have passed (the "Pivot Right Bars" setting).
Example: If "Pivot Right Bars" is set to 20, the box will update 20 bars after the actual high or low occurred. This is necessary to confirm that the point was indeed a Swing High/Low. Do not treat the box lines as predictive; they are reactive to confirmed structure.
Pine Script® göstergesi