BNBUSD 1 Minute Chart / 1 Hour BBand Day Trading 3Commas*** As always, this is provided for educational purposes only and I am not an investment advisor; I'm just a guy who likes to come up with novel ideas and share them with other traders so they can learn. ***
This strategy is a fun one. I took parts of 'Bollinger Awesome Alert R1 by JustUncleL' () and modified it to have enhanced day trading functionality. This version does not show source and that is by design - I want the alerts to be visible to the public and if you want to get set up with a version that integrates with 3commas, drop me a message - there's a lot more that goes into setting up automated 3commas trading but this script was written specifically with 3commas in mind.
It's possible this is one of the more interesting strategy indicators I've made. The setup I used for this is as such and you will need to set it up the same way:
One minute chart for the BNB/USD(T) pair on Binance.us (other exchanges will likely work, other coin pairs or other time frames will likely not)
This script watches the one minute chart and when price golden crosses the lower Bollinger band, a buy order is placed.
There are two sell conditions; one I set up to take profit and one I designed as a kind of stop loss. I went with a flat 7.5% for the take profit as this showed the best results in the backtester. I had planned for it to be closer to 3% but for this strategy to work it needs to be higher. According to the backtest it offers around double the return of buying and holding BNB over the sample timeframe.
The 'stop loss' condition is where the fun lies. I transposed Bollinger bands from a one hour BNBUSD Binance.us chart on top of the 1 minute chart and those are the blue lines you see. The stop loss condition happens when the current price death crosses the bottom one hour Bollinger band. Ironically, often this doesn't result in any losses as you will see in the chart and instead results in a small win. This definitely was not my intention when I created it but it's a lot better than the earlier version where I set up a variable percentage-based stop loss. Even with me optimizing the regular stop loss for this coin pair, my 1 hour bband method nets an extra 2% profit over the same two week time period, even with Binance fees factored in!
Have fun and like I said, hmu via message if you want access to the customizable indicator for 3commas!
"scalping" için komut dosyalarını ara

RSI Strategy [Nostradanis]Strategy based on an adaptation of the Relative Strength Index and slow exponential moving average.
Green lines: uptrend
Gray lines: lateral trend
Red Lines: downtrend
Use:
When RSI crosses up 40 and 50 lines can be a good long entry if ema trend is clearly bullish.
55 line confirms entry.
Designed for swing with under $20 shares but can be adapted to scalping
ChannelSlasher (1m - 3m)This is a moving average channel-based scalping strategy that is optimized for very short time-frames.
In general, the optimal settings will be for the fast channel to be several periods shorter than the slow channel and the fast HMA (hull moving average) to be a few periods shorter than the fast channel.
This strategy can offer wild swings in profitability with relatively small parameter changes, so I HIGHLY recommend you cross-validate any set of parameters across multiple exchanges AND across multiple tickers.

ES Scalper ver.1.0The strategy is scalping around my mathematical defined S/R on m1 timeframe. The secret sauce here is the formula, other parts of the strategy is quite simple. There is a hard SL to eliminate big losses, though it's 100% win rate on ES. There is no soft SL on this script, so use it with your own risk. The strategy trades two contracts per signal and the pyramid is 2. Change it to whatever you want.
The strategy works well on 1-min ES and GBPAUD but it doesn't mean it will on other assets. Trailing points, trailing offset and timeframe are three parts that you can play with. Do notice that the performance of the backtest doesn't represent the performance of live trading. I don't charge for any price on this script, so you could just give me a DM or an Email if you want to use it.

Momentum Strategy (BTC/USDT; 1h) - MACD (with source code)Good morning traders.
It's been a while from my last publication of a strategy and today I want to share with you this small piece of script that showed quite interesting result across bitcoin and other altcoins.
The macd indicator is an indicator built on the difference between a fast moving average and a slow moving average: this difference is generally plottted with a blue line while the orange line is simply a moving average computed on this difference.
Usually this indicator is used in technical analysis for getting signals of buy and sell respectively when the macd crosses above or under its moving average: it means that the distance of the fast moving average (the most responsive one) from the slower one is getting lower than what it-used-to-be in the period considered: this could anticipate a cross of the two moving averages and you want to anticipate this potential trend reversal by opening a long position
Of course the workflow is specularly the same for opening short positions (or closing long positions)
What this strategy does is simply considering the moving average computed on macd and applying a linear regression on it: in this way, even though the signal can be sligthly delayed, you reduce noise plotting a smooth curve.
Then, it simply checks the maximums and the minimums of this curve detecting whenever the changes of the values start to be negative or positive, so it opens a short position (closes long) on the maximum on this curve and it opens a long position (closes short) on the minimum.
Of course, I set an option for using this strategy in a conventional way working on the crosses between macd and its moving average. Alternatively you can use this workflow if you prefer.
In conclusion, you can use a tons of moving averages: I made a function in pine in order to allw you to use any moving average you want for the two moving averages on which the macd is based or for the moving average computed on the macd
PLEASE, BE AWARE THAT THIS TRADING STRATEGY DOES NOT GUARANTEE ANY KIND OF SUCCESS IN ADVANCE. YOU ARE THE ONE AND ONLY RESPONSIBLE OF YOUR OWN DECISIONS, I DON'T TAKE ANY RESPONSIBILITY ASSOCIATED WITH THEM. IF YOU RUN THIS STRATEGY YOU ACCEPT THE POSSIBILITY OF LOOSING MONEY, ALL OF MY PUBBLICATIONS ARE SUPPOSED TO BE JUST FOR EDUCATIONAL PURPOSES.
IT IS AT YOUR OWN RISK WHETHER TO USE IT OR NOT
But if you make money out of this, please consider to buy me a beer 😜
Happy Trading!

GG ES Scalp IBTT Momentum Strategy v1.0Script for Scalping the ES. Apply it to a 15 second chart. The Momentum Multiplier is a float input and the lower the number the less conservative the strategy is. It doesn't fire signals everyday but its pretty accurate. Send me a message to get access.
CME_MINI:ES1!

Cyatophilum Strategy BuilderAn indicator to create strategies, backtest and setup alerts.
The user can choose one or multiple TA entry conditions, if more than one the conditions are combined with a logical AND.
The entries will open up a trade, which is then handled by a risk management system including Trailing Stop, Take Profit and up to 100 Safety Orders.
This indicator can be used to backtest 3commas DCA bots who are using TA presets, RSI or ULT.
Its main goal is to create strategies by combining indicators.
Let's dive into the details of what's included:
Entry Condition: MACD
Triggers an entry when macd crosses with the signal line.
Configure the fast, slow length, signal smoothing and timeframe to trigger the condition.
Entry Condition: RSI
Triggers an entry when the RSI is higher or lower than the long/short threshold.
Configure the length, timeframe, long and short threshold to trigger the condition.
Entry Condition: ULT (Ultimate Oscillator)
Triggers an entry when the ULT is higher or lower than the long/short threshold.
Configure the 3 lengths, timeframe, long and short threshold to trigger the condition.
Entry Condition: Bollinger Bands
Triggers an entry when the price is above the upper band for long and below the lower band for short.
Configure the length, standard deviation and timeframe to trigger the condition.
Entry Condition: MFI (Money Flow Index)
Similar to RSI, it triggers an entry when the MFI is higher or lower than the long/short threshold.
Configure the length, timeframe, long and short threshold to trigger the condition.
Entry Condition: CCI (Commodity Channel Index)
Another oscillator that triggers an entry when its value is higher or lower than the long/short threshold.
Configure the length, timeframe, long and short threshold to trigger the condition.
Trend Filters
Use one or two trendlines to filter your trades: go only long/short when the trendline is bullish/bearish.
Choose between the several trendlines: ema, sma, wma, hull ma, kama, alma, rma, swma, vwma, Tilson T3, and the unique Adaptive T3 and Adaptive Hull MA.
If this is not enough, you can use the external trendline feature to plug in any other indicator for your trendline.
The second trendline can be MTF and come from another symbol if needed.
Combining Indicators
Most of the time we will not be using a single indicator at a time, but instead, combine them in order to get stronger entries.
The entry conditions are combined using a AND logical gate, meaning all conditions must be true for the entry to trigger.
Here is an example using a combination of 2 indicators: Bollinger Bands and RSI.
We can see less entries are being triggered on the bottom chart than on the top chart because the bottom chart is combining the 2 indicators while the top chart is only using Bollinger Bands.
You can combine up to all 6 indicators if you want, but keep in mind that combining too many may lead to triggering no entry at all.
Risk Management and Trade system
The indicator will not trigger more than one long or short entry in a row.
To start a new trade, the indicator will wait for either take profit, stop loss or an opposite entry if no SL and TP is set.
Stop Loss and Take Profit
Configure your stop loss and take profit for long and short trades.
You can also make a trailing stoploss and a trailing take profit.
Safety Orders
Just like 3commas bots, you can create a strategy with up to 100 safety orders.
Configure their placement and order size using the price deviation, step scale, take profit type (from base order or total volume), and volume scale settings.
Note: only the 20 first safety order steps or so will be plotted due to graphic limiations. The steps after that still trigger alerts and backtest results.
Creating Alerts
The indicator is using the newest alert system:
1. Write your alert messages in the indicator settings (alert section at the bottom)
2. Click "Create Alert" as usual, but choose "alert() function calls only"
Data Window
Since the indicator is applied on top of the price chart, the oscillator indicators cannot be plotted. You can always add them on another pane but if you want to just see their values, you can use the Data Window to see the value of each oscillator on each bar.
Backtest settings
Used to get the results below:
Initial Capital: 100 000$
Base Order Size: 0.1 contract (BTC)
Safety Order Size: 0.1 contract (BTC)
Commission: 0.1%
Slippage: 100 ticks
pyramiding: 6
The indicator settings are plotted in the main chart panel.

Bollinger Band with RSI
Using combination bollinger band and RSI indicator as guide to predict price volatility and the best entry point. The strategy logic is pretty straightforward where we're interested with close price that touches the lower bollinger band ; there are only two scenarios that will happened after the price reaches the lower band; the price might rebound from the lower bollinger band or drop lower and continue downtrend. To confirm the price movement, we use a second indicator which is the RSI to further investigate the price trend. For example, if the price reaches the lower bollinger band but the RSI value is not in the oversold region, we can conclude that the price will go lower and continue downtrend. If the RSI value is in the oversold region, we can use this price area as our entry point.
Stop loss is necessary to avoid losing too much capital if the RSI value lingers too long in the oversold region.
Best take profit area is when the price rebound above the middle bollinger band area/upper bollinger band or when the RSI reaches overbought region; whichever comes first.
Long entry:
RSI < 30 & close price < lower bollinger band
Exit entry:
RSI > 70
Default stop loss: -25%

[astropark] Trend Skywalker V1 [strategy]Dear Followers,
today another awesome Swing and Scalping Trading Strategy indicator: Trend Skywalker !
It shows a trend cloud that reacts very fast to price action, so it's perfect for trending markets: it helps a lot to find out
when a trend is going to end and a new is going to start
when to enter again within a trending market
where to put your stoploss
In this example below you can see the three points above:
In fact in a trending market it will highlight that:
price consolidation within the could is a trend weakening signal , so you can easily spot when a trend is going to end and a new is going to start
bullish/bearish trend cloud retests are nice opportunity to re-enter within a trending market, especially if cloud is thick
where to put your stoploss ( below the cloud and/or recent low in a buy scenario , above the cloud and/or recent high in a sell scenario )
This strategy/indicator has the following options:
change analysis window (the lower, the more reactive; the higher, the less reactive)
enable/disable signals on chart
enable/disable "more confirmations" signals filter
enable/disable bars and background coloring based on trend
enable/disable an automatic Trailing Stop strategy option (Automatic Stops)
enable/disable a peak profit tracker (the max percentage profit labels)
enable/disable highlights of trend cloud retests
enable/disable highlights of trend cloud price breakouts
Here below some examples how the indicator works on many markets and timeframe.
ETH/USD 4h
EUR/USD 15m
LTC/BTC 1h
This strategy only trigger 1 buy (where to start a long trade) or 1 sell (for short trade).
Keep in mind that proper risk management and money management strategies are very important to manage your trades (DM me if you need any clarification on these points).
This script will let you backtest the strategy performance over the backtesting period you set in input (it may be a lower period, depending on tradingview candles limitation related to your account).
The one for setting alarms can be found by searching for the astropark's "Trend Skywalker" and then choosing the indicator with "alarms" suffix in the name.
Strategy results are calculated on the time window from February 2018 to now, so about 3 years, using 10000$ as initial capital and working at 1x leverage (so no leverage at all! If you like to use leverage, be sure to use a safe option, like 2x or 3x at most in order to have liquidation price very far).
This is not the "Holy Grail", so use proper money and risk management strategies.
This is a premium indicator , so send me a private message in order to get access to this script.

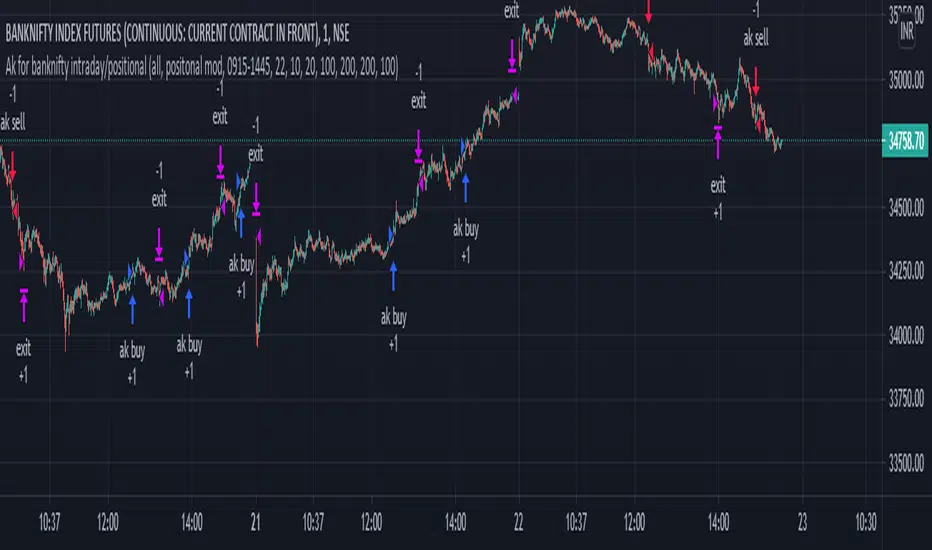
Ak for Banknifty intradayHi friends this is Ak for Banknifty Intraday
It analyse price action when price makes higher high or higher low and it scalps and take profit ..its occur in moment of time so for that algo trading require..it automatically take profit and stoploss and close trade near session end. u can also change time for close trade...it automatically calculate previous candles high and low and when it breaks it generate buy and sell signal...
PROFIT MAKER |Crypto|ETH|BTC|YFIThis is a trend-following strategy that works very well for many Crypto assets in the usd or usdt pair
It can be used for both futures and spot!
Some of the assets in which this strategy is proven are
Asset Exchange TF
BINANCE:ADAUSDT Binance 45m
BINANCE:BTCUSDT Binance 1h
BINANCE:YFIUSDT Binance 30m
BINANCE:DOTUSDT Binance 45m
BINANCE:ETHUSDT Binance 30m
BINANCE:LINKUSDT Binance 45m
BINANCE:DOGEUSDT Binance 1h
And many others..
BINANCE:BTCUSDT
BINANCE:LINKUSDT
What is this strategy based on?
It is a combination of various parameters, including
-RSI: The relative strength index (RSI) is a momentum indicator used in technical analysis that measures
the magnitude of recent price changes to evaluate overbought or oversold conditions in the price of a stock or other asset.
-MACD: Moving average convergence divergence (MACD) is a trend-following momentum indicator that shows
the relationship between two moving averages of a security’s price.
-ADX: ADX is used to quantify trend strength. ADX calculations are based on a moving average of price range expansion over a given period of time.
-DMI: DMI is a moving average of range expansion over a given period (the default is 14 days). The positive directional
movement indicator (+DMI) measures how strongly price moves upward; the negative directional movement indicator (-DMI)
measures how strongly price moves downward. The two lines reflect the respective strength of the bulls versus the bears.
Included:
Different forms of Take profit, included:
Take profit on squeeze candles
Take profit based on Risk-Benefit (RR)
Take profit a pre-determined %.
Different forms of Stop Loss, including
ATR-based stop loss
Trail stop loss (with option to use a trigger)
Stop loss a pre-determined %.
**All trades include 0.1% of fees + slippage
** The statistics displayed are for the year 01-01-2020 and the period from 2021 to the date of publication (14-01-2020)
For access you can send a message or consult in my social networks.
Links in my tradingview signature (below).

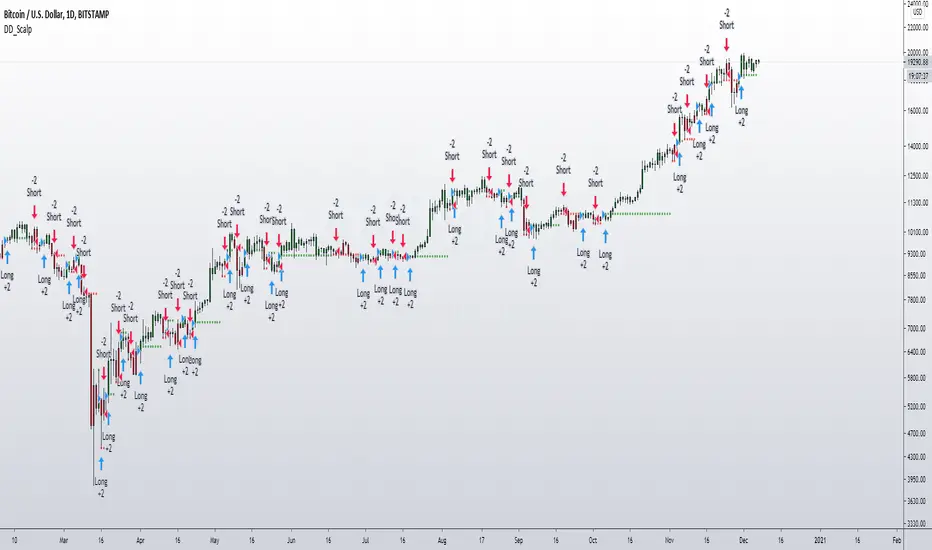
DD_ScalpDD_Scalp is a buy/sell trading strategy based on momentum from breakout levels. It works well on 1D and 4H timeframes. It is a helpful indicator for scalping short range profits on a daily basis or for booking profits in a high time frame setups such as those given by my DD_Echo indicator. It works for all major cryptos such as BTC, ETH, LINK, and other alts. It also works for forex.
If you want to access this, please DM me.
DMT 369 DRAGRONFLY STRATSuccessful traders trade with a fixed plan and without emotion, but this a lot harder than many new traders think. Many never master this skill and suffer continual drawdowns on their accounts as they overtrade high leverage positions in volatile markets.
ĐΜŦ Autobot resolves this issue by taking the human element out of the equation, allowing full automation of trades using TradingView alerts to trigger your favourite trading bot, such as Alertatron or 3Commas.
Being a Trend Reversal Indicator based on Volatility & Average True Range, ĐΜŦ Autobot is designed to identify spots in the market that offer suitable scalp and swing trade opportunities.
Due to popular demand we have expanded our ĐΜŦ Autobot product line to include the new ĐΜŦ Autobot Dragonfly 3-6-9 Edition which combines DMT with 3-6-9 Vortex mathematics, our Titan indicator and a multi-ladder scalping strategy to ensure you maintain a preferable average entry when price action moves against your position.
Indicator View
It its default state the DMT Autobot Dragonfly indicator displays key signal information, such as:
• Support & resistance range lines
• Titan Body Small & Large Time Frame lines
• Long & Short entry positions
• Long & Short position ladders
• Profit targets
Dragonfly displays a range between resistance (upper line) and support (lower line) on the chart.
Once the price is granted support in the range the lower line will turn green. As price action develops it will make repeated attempts to test support. If support holds price will attempt to test the resistance line (red).
When resistance is broken and the price is above the upper line, the line will turn blue confirming the bullish momentum and provide a potential buy opportunity.
Price action will make attempts to test the upper line as support and will keep rising while support is granted.
Once support is lost the upper line will become red once more. As price action develops it will make repeated attempts to test resistance. If resistance holds, the price will attempt to test the support line (green).
When support is broken and the price goes below the lower line, the line will turn red confirming the bearish momentum and provide a potential selling opportunity.
Price action will make attempts to test the lower line as resistance and will keep dropping while resistance is granted.
Titan Body
The Titan Body Small & Large time frame options in the indicator add additional trendlines to the chart to provide further clarity and confirmation to the Support & Resistance range indication.
Once price is granted support by the Small Time Frame trend line the line will turn green. As price action develops it will make repeated attempts to test the Small Time Frame support. Once the price is below the Small Time Frame trend line, the line will turn red and can act as resistance in a trend reversal.
When price is granted support by the Large Time Frame trend line the line will turn cyan. As price action develops it will make repeated attempts to test the Large Time Frame support. Once the price is below the Large Time Frame trend line, the line will turn orange and can act as resistance in a trend reversal.
The Titan Body enabled and customized in the indicator’s style settings,
Alert indicators
DMT Autobot Dragonfly Edition generates signals that can be used to scalp trade a volatile asset.
Signals are enabled and customized in the indicator’s input settings Additional options can be found in the options, but it is recommended that these are left at the default, as shown below. The indicator generates many
Entry and Profit levels can be disabled or customized in the indicator’s style settings,
Tradingview Alerts
Using Tradingview alerts, DMT Autobot Dragonfly signals can be used to trigger a trading bot.
To trigger a long or short position, set the Tradingview Alert Condition to DMT 369 Dragonfly and select the long or short option.
It is recommended that long or short positions are configured to trigger Once Per Bar Close
Ladders can also be triggered using alerts. To trigger a ladder order, set the Tradingview Alert Condition to DMT 369 Dragonfly and select the appropriate Long or Short ADD option that is to be triggered by the relevant values defined in the indicator’s configuration.
It is recommended that ladder orders are configured to trigger Once Per Bar,
To trigger a take profit order, set the Tradingview Alert Condition to DMT 369 Dragonfly and select the Long or Short TP option that is to be triggered by the relevant values defined in the indicator’s configuration.
Take profit orders can be configured as Once Per Bar Close or Once Per Minute.
If you wish to trigger a take profit signal immediately when the indicator’s defined take profit value is achieved, then use the Once Per Bar option.
Selecting Once Per Bar Close to generate a take profit signal is a gamble as the candle may close far away from the defined profit target – positive or negative.
While stops can be used, they are not applicable to the recommended ladder strategy.
Ladder Strategy
The DMT Autobot Dragonfly indicator always turns an underwater position into a win by utilizing a ladder strategy.
By using the recommended defaults, the indicator will trigger ladder orders at 3%, 6% & 9% using increasing order sizes,
Order sizes increase exponentially to ensure a good average price is maintained. If you are not using DMT Autobot Dragonfly signals to trigger ladder or take profit orders, please ensure your trading bot is configured to recalculate the new ladder entry and profit target based on the new average position entry price as each ladder is filled.
If you are using DMT Autobot Dragonfly on a leveraged asset, please ensure the leverage position is configured suitably so that your position is not liquidated if the price rapidly moves against you.
If u are looking for more information or access to the script please private msg me in trading view chat thx for support

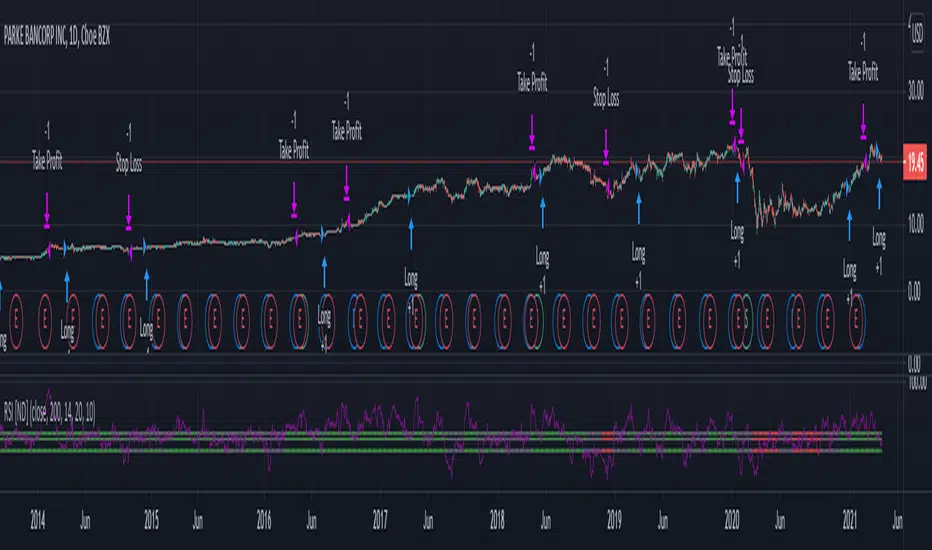
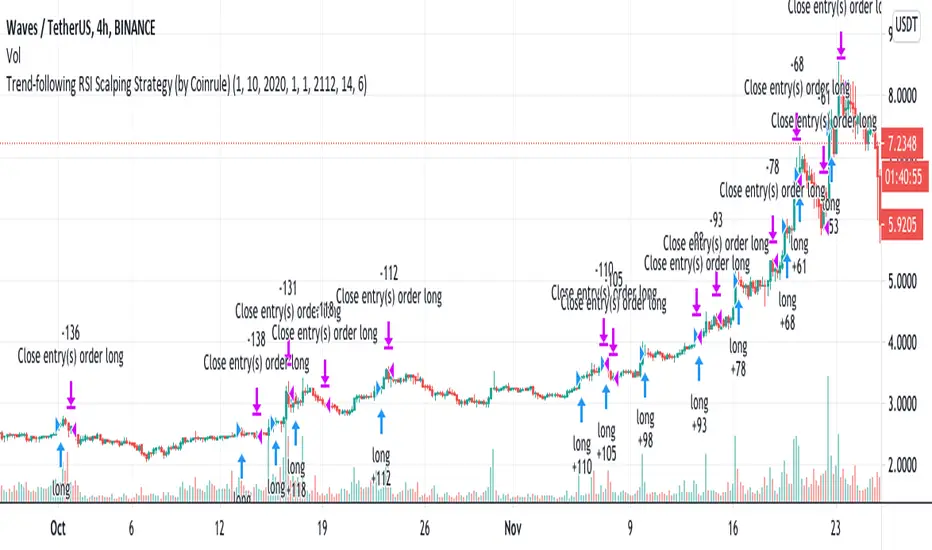
Trend-following RSI Strategy According to classical technical analysis, an RSI above 70 should signal overbought conditions and, thus, a sell-signal. Cryptocurrencies represent a whole new asset class, and they reshape the classical concepts of technical analysis. FOMO-buying can be very powerful, and coins can remain in overbought conditions enough to provide excellent opportunities for scalping trades on the upside.
Building a trend-following trading strategy based on the RSI, which is generally considered a contrarian indicator, may sound counter-intuitive. Over 200 backtests prove that this is a very interesting long-term setup.
The setup is optimized on a 4-hours time frame and trading cryptocurrencies versus USD or stable coins.
The strategy tries to catch coins on sustained uptrends to take advantage of further upside.
The strategy's buy-signal triggers when a coin has an RSI above 70 on a 4-hours time frame.
The strategy sells the coin if a profit of 6% is achieved. Alternatively, it closes the position if the RSI drops below 55, indicating a possible weakening of the trend.
The strategy assumes each order to trade 30% of the available capital. A trading fee of 0.1% is taken into account. The fee is aligned to the base fee applied on Binance, which is the largest cryptocurrency exchange.
Phenom 5.3.1This has been a private script until now. I will be sharing it in order to get some feedback until it is ready to be made "invite only"
WHAT IT IS:
This is a scalping method (mostly) that works on nearly all markets and timeframes. THIS IS A BACKTEST SCRIPT! PLAN ACCORDINGLY!
HOW IT WORKS:
This script uses common indicators (5) in non-standard ways. When combined together, they can give fairly accurate results (40-65%) with acceptable Profit Factor ratings (1.7-3+).
This uses CCI, Moving Average, Stochastic, PSAR, and Bollinger Bands.
With these we have 4 base strategies usable.
Each indicator can be disabled (one at a time).
Each indicator has a SL method (stackable).
Each indicator has a TP method (stackable).
BEST RESULTS:
I have received best results as a scalper on 5min or 1HR timeframes. Mostly used on Index CFD's and CRYPTO markets.
NOT RESPONSIBLE FOR MISUSE OR LOST FUNDS! D.Y.O.R

[astropark] DMI/ADX strategy [strategy]Dear Followers,
today I'm happy to share with you my DMI / ADX Strategy .
It provides directional trend information, so if a bullish or a bearish trend is going to start. Statistically it works better on lower timeframes (from 5 minutes to 1 hour).
It is both a Swing and Scalping Strategy indicator , based on a simple trend following theory , good for trading FOREX, Indexes, Stocks, Commodities and Cryptocurrencies.
To help in Taking Profits, the strategy integrates 2 special other than bull/bear signals:
Overbought and Oversold RSI Signals , which appear both as darker background (the darker the color, the more the price is in overbought/oversold) and green "ob"-"tp" / red "os"-"tp" labels (they optionally pop up only on a configurable stronger overbought/oversold condition) (you can enable/disable it optionally)
Peak Profit Tracker , which resets every time a new trade starts and keeps track of price fluctuation during the trade: the message is don't be too greedy and take profits or lock them with a stoploss in profit (you can enable/disable it optionally)
You can edit many options in order to
have more/less bull/bear signals
enable/disable showing bull/bear signals
enable/disable showing RSI TP signals (you can edit RSI length, overbought (OB) and oversold (OS) levels)
enable/disable showing peak profits on each trade
The user who wants to use this strategy, especially via an automated bot, must always set a stoploss (example 150$ from entry on bitcoin ) or use a proper risk management strategy .
This is not the "Holy Grail", so use it with caution. It's highly suggested to use a proper money management .
This script will let you backtest performance of the indicator based on bear/bull signals.
You can find the alarms version by searching for my DMI / ADX Strategy and choosing the "alarms" named.
Here there are some examples how this DMI / ADX strategy works on many markets:
LTC/USDT 15m
BTC/USD 15m
BNB/BTC 15m
ETH/USD 15m
GOLD (XAU/USD) 15m
GOLD (XAU/USD) 1h
FB 15m
AAPL 15m
TSLA 1h
BANKNIFTY Index 5m
NIFTY 50 Index 5m
This is a premium indicator , so send me a private message in order to get access to this script .

Algonize Pivot Strategy (APS)This study is based on several Price Action parameters of :-
• Pivot Points,
• Higher High and Lower Lows,
• High Low Index ,
• Support and Resistance.
► How To Use This Strategy?
This is a pure scalping strategy and it is advised to use this only with algo trading systems. Due to high trade frequency.
► This Strategy has inbuilt custom time frame backtester, which enables you to test for performance between any date or check for a single day.
► To Create Alerts for algo trading in this strategy simply Check "Activate Algo" from Settings then Create new alert , select your strategy in condition box, and now scroll down to message box and write
{{strategy.order.comment}}
That's it , Just Click on Create Alert Button
Backtest Values Used:-
Initial Capital : 1000000
Order Size (Lots) : 1 (Contract) Lots
Pyramiding : 0 orders
Commission : 0.003%
Sharpe Ratio : 1.741
Profit Factor : 1.174
Test Yourself and give feedback.
PM us to obtain access.

Triple EMA Scalper low lag stratHi all,
This strategy is based on the Amazing scalper for majors with risk management by SoftKill21
The change is in lines 11-20 where the sma's are replaced with Triple ema's to
lower the lag.
The original author is SoftKill21. His explanation is repeated below:
Best suited for 1M time frame and majors currency pairs.
Note that I tried it at 3M time frame.
Its made of :
Ema ( exponential moving average ) , long period 25
Ema ( exponential moving average ) Predictive, long period 50,
Ema ( exponential moving average ) Predictive, long period 100
Risk management , risking % of equity per trade using stop loss and take profits levels.
Long Entry:
When the Ema 25 cross up through the 50 Ema and 100 EMA . and we are in london or new york session( very important the session, imagine if we have only american or european currencies, its best to test it)
Short Entry:
When the Ema 25 cross down through the 50 Ema and 100 EMA , and we are in london or new york session( very important the session, imagine if we have only american or european currencies, its best to test it)
Exit:
TargetPrice: 5-10 pips
Stop loss: 9-12 pips

Amazing scalper for majors with risk managementHello,
Today I am glad to bring you an amazing simple and efficient scalper strategy.
Best suited for 1M time frame and majors currency pairs.
Its made of :
Ema (exponential moving average) , long period 25
Ema(exponential moving average) Predictive, long period 50,
Ema(exponential moving average) Predictive, long period 100
Risk management , risking % of equity per trade using stop loss and take profits levels.
Long Entry:
When the Ema 25 cross up through the 50 Ema and 100 EMA. and we are in london or new york session( very important the session, imagine if we have only american or european currencies, its best to test it)
Short Entry:
When the Ema 25 cross down through the 50 Ema and 100 EMA, and we are in london or new york session( very important the session, imagine if we have only american or european currencies, its best to test it)
Exit:
TargetPrice: 5-10 pips
Stop loss: 9-12 pips
Hope you enjoy it :)

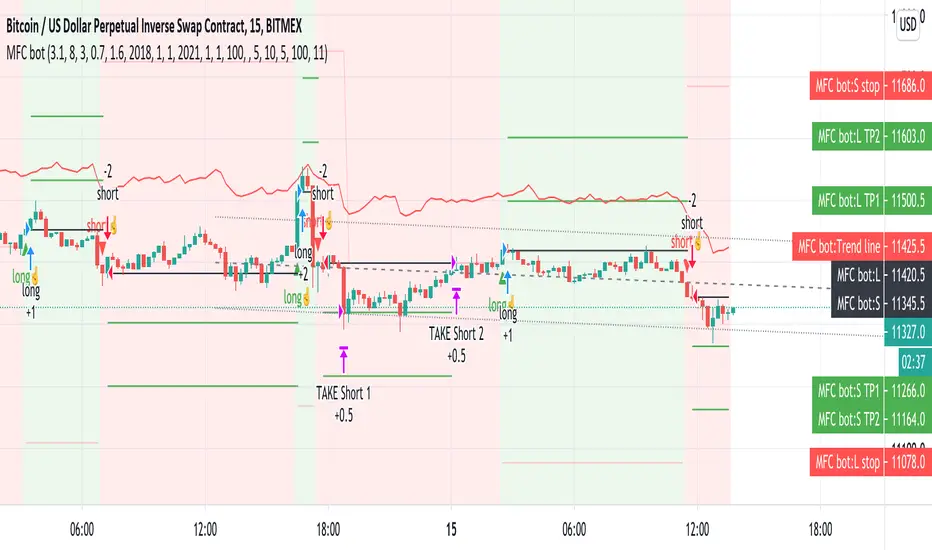
Money Flow Club Bot Strategy 1-15 min ALLENG:
Friends, in this script, there is a function that calls the closing of the candle by Heikin ASHI candles.
You can disable it in the indicator settings.
There is no redrawing of the indicator on regular candlesticks.
The indicator is easy to set up for any trading pairs and any exchanges.
It has an entry point and provides 2 take profit.
It also contains consolidation zones when the price moves for a short time in the range that is visible on the indicator.
In order to try the indicator write in your personal messages.
The strategy does not specify a condition for exiting the position when the first take is taken, the stop is moved to breakeven, so the chart in the strategy turned out to be torn.
RUS:
Друзья, в этом скрипте присутствует функция вызывающая закрытие свечи по свечам Хейкин Аши.
Её можно отключить в настройках индикатора. На обычных свечах перерисовка индикатора отсутствует.
Индикатор легко настроить на любые торговые пары и любые биржи. А нем есть точка входа и предусмотрены 2 тейк профита.
Так же в нем присутствуют зоны консолидации когда цена короткое время движется в диапазоне который виден на индикаторе.
Для того что бы попробовать индикатор напишите в личные сообщения.
В стратегии не прописано условие выхода из позиции когда первый тейк взят, то стоп переносится в безубыток, поэтому график в стратегии получился рваный.
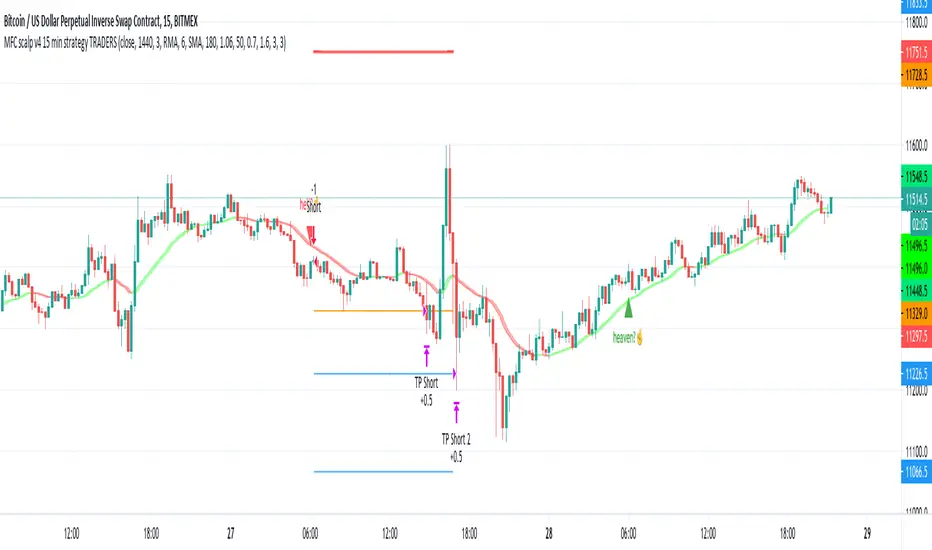
MFC scalp v4 15 min strategy TRADERSthis indicator to trade for a short time in a TF of 15 minutes.
We have created takeprofit zones for you so that you can understand where we can get to and take your profit. these points are mostly very helpful.
There are basic settings that allow you to adjust the indicator individually for each situation; because of this, this indicator can be used for any exchange and any currency pair.
For Scalp trading, we use 4 different strategies available to our clients. If you enter them correctly, you can never see the minus sign.
Use the link below to obtain access to this indicator.
Primus V1 - BybitHey everyone,
The current version its a scalping strategy for Bybit but for those that prefers swing trading algo I can do a different version as well for different exchanges.
This is the first version on my algo Primus, expect updates on the months to come.
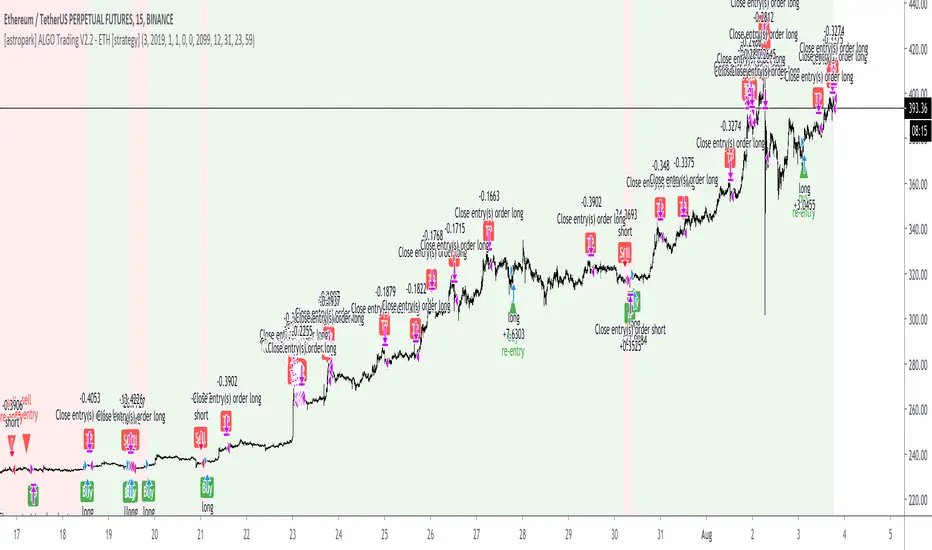
[astropark] ALGO Trading V2.2 - ETH [strategy]Dear Followers,
today another awesome Swing and Scalping Trading Strategy indicator : the upgraded version of ALGO Trading V2 for Binance Ethereum PERP on 15m timeframe!
It is runnable on a bot , just write me in order to help you do it.
If you are a scalper or you are a swing trader, you will love suggested entries for fast and long-lasting profit.
Keep in mind that a proper trailing stop strategy and risk management and money management strategies are very important (DM me if you need any clarification on these points).
This is an upgrade version of ALGO Trading V2 for Ethereum.
You can find ALGO Trading V2 indicator here below:
If you are interested in Bitcoin Trading , you will like for sure ALGO Trading V1.2, which is a customized version for Bitcoin trading:
This strategy has the following options:
enable/disable signals on chart
enable/disable bars and background coloring based on trend
enable/disable a Filter Noise option, which reduces overtrading
enable/disable a Trailing Stop option
enable/disable/config a Take Profit option, with Re-Entry
enable/disable a secret Smart Close Option which may improve profit on your chart (again, check it on you chart if it helps or not)
This strategy only trigger 1 buy (where to start a long trade) or 1 sell (for short trade). If you enable Take Profit / Stop Loss option, consider that many TP can be triggered before trend reversal, so take partial profit on every TP an eventually buy/sell back lower/higher on RE-ENTRY signal to maximize your profit.
Strategy results are calculated on the time window from December 2019 to now, so on more than 7 months, using 1000$ as initial capital and working at 1x leverage (so no leverage at all! If you like to use leverage, be sure to use a safe option, like 3x or 5x at most in order to have liquidation price very far).
This is not the "Holy Grail", so use proper money and risk management strategies.
In order to get notified when a signal is triggered, you need to use the "alarms" version of this indicator (just search for astropark's "ALGO Trading V2.2 - ETH" indicator and choose the one with "alarms" suffix).
This is a premium indicator , so send me a private message in order to get access to this script.