FlowSpike ES — BB • RSI • VWAP + AVWAP + News MuteThis indicator is purpose-built for E-mini S&P 500 (ES) futures traders, combining volatility bands, momentum filters, and session-anchored levels into a streamlined tool for intraday execution.
Key Features:
• ES-Tuned Presets
Automatically optimized settings for scalping (1–2m), daytrading (5m), and swing trading (15–60m) timeframes.
• Bollinger Band & RSI Signals
Entry signals trigger only at statistically significant extremes, with RSI filters to reduce false moves.
• VWAP & Anchored VWAPs
Session VWAP plus anchored VWAPs (RTH open, weekly, monthly, and custom) provide high-confidence reference levels used by professional order-flow traders.
• Volatility Filter (ATR in ticks)
Ensures signals are only shown when the ES is moving enough to offer tradable edges.
• News-Time Mute
Suppresses signals around scheduled economic releases (customizable windows in ET), helping traders avoid whipsaw conditions.
• Clean Alerts
Long/short alerts are generated only when all conditions align, with optional bar-close confirmation.
Why It’s Tailored for ES Futures:
• Designed around ES tick size (0.25) and volatility structure.
• Session settings respect RTH hours (09:30–16:00 ET), the period where most liquidity and institutional flows concentrate.
• ATR thresholds and RSI bands are pre-tuned for ES market behavior, reducing the need for manual optimization.
⸻
This is not a generic indicator—it’s a futures-focused tool created to align with the way ES trades day after day. Whether you scalp the open, manage intraday swings, or align to weekly/monthly anchored flows, FlowSpike ES gives you a clear, rules-based signal framework.
"scalp" için komut dosyalarını ara

Futures Playbook: VWAP + OR + Cross-Asset TellsFutures Playbook: VWAP + OR + Cross-Asset Tells (with Trade Messages + Coach Panel)
This all-in-one futures trading toolkit combines Opening Range (OR) levels, VWAP, and cross-asset signals to help traders quickly read intraday structure, manage execution, and filter noise.
Core Features
• Opening Range (OR):
• Customizable OR window with High/Low and Midpoint.
• Automatic shading of the OR zone.
• VWAP & Bands:
• Built-in or session-anchored VWAP.
• Optional standard deviation bands for context.
• Cross-Asset Tells:
• Live reads on US 10Y yield, DXY, Crude, and Gold.
• Regime detection: rates risk, USD strength, energy softness, and real-rate easing.
• Confirmations:
• Volume vs. moving average filter.
• Cumulative delta with smoothing.
• ATR-based chop filter to avoid low-quality trends.
Trade Messages + Coach Panel
• Trade Messages (labels): Automatic on-chart prompts for OR completion, VWAP reclaim/loss, long/short setups, and EU close flows.
• Coach Panel (table): Real-time dashboard with regime context, directional bias, execution notes, risk reminders, and key levels (ORH, ORL, VWAP).
Alerts
• OR breakout (long/short with confirmations).
• VWAP reclaim or loss.
• 10Y yield crossing risk threshold.
Use Case
Designed for futures traders and scalpers who rely on VWAP + OR dynamics and need cross-asset confirmation before committing to trades. Great for structuring entries, managing risk, and filtering market noise throughout the session.

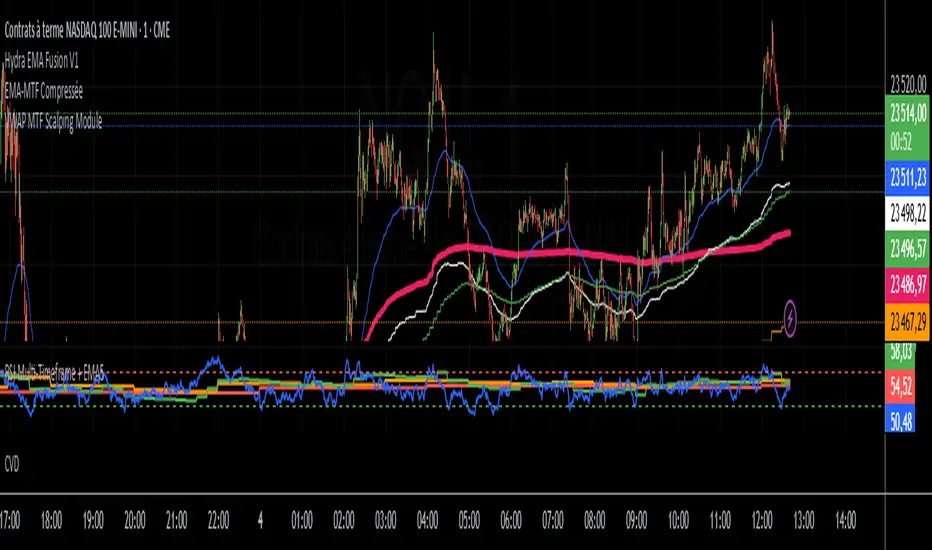
VWAP MTF Scalping ModuleThe VWAP MTF indicator allows you to visualize anchored VWAP across multiple timeframes, while maintaining a clean and responsive display.
Designed for intraday traders, scalpers, and swing traders, this module offers a clear view of volume-weighted average price zones across key timeframes (1m, 5m, 15m, 1h... customizable).
ORB Scalp setup on 15min by UnenbatThis indicator draws a 2-minute Opening Range Box (ORB) at the beginning of each 15-minute candle by combining the last minute of the previous candle and the first minute of the current one. It highlights the session high/low during this range, and extends the box for a customizable duration. TP and BE lines are also plotted above/below the range for strategic planning. Perfect for scalpers using 15-minute timeframe.

Momentum Fusion v1Momentum Fusion v1
Overview
Momentum Fusion v1 (MFusion) is a multi-oscillator indicator that combines several components to analyze market momentum and trend strength. It incorporates modified versions of classic indicators such as PVI (Positive Volume Index), NVI (Negative Volume Index), MFI (Money Flow Index), RSI, Stochastic, and Bollinger Bands Oscillator. The indicator displays a histogram that changes color based on momentum strength and includes "FUSION🔥" signal labels when extreme values are reached.
Indicator Settings
Parameters:
EMA Length – Smoothing period for the moving average (default: 255).
Smoothing Period – Internal calculation smoothing parameter (default: 15).
BB Multiplier – Standard deviation multiplier for Bollinger Bands (default: 2.0).
Show verde / marron / media lines – Toggles the display of auxiliary lines.
Show FUSION🔥 label – Enables/disables signal labels.
Indicator Components
1. PVI (Positive Volume Index)
Formula:
pvi := volume > volume ? nz(pvi ) + (close - close ) / close * sval : nz(pvi )
Description:
PVI increases when volume rises compared to the previous bar and accounts for price percentage change. The stronger the price movement with increasing volume, the higher the PVI value.
2. NVI (Negative Volume Index)
Formula:
nvi := volume < volume ? nz(nvi ) + (close - close ) / close * sval : nz(nvi )
Description:
NVI tracks price movements during declining volume. If the price rises on low volume, it may indicate a "stealth" trend.
3. Money Flow Index (MFI)
Formula:
100 - 100 / (1 + up / dn)
Description:
An oscillator measuring money flow strength. Values above 80 suggest overbought conditions, while values below 20 indicate oversold conditions.
4. Stochastic Oscillator
Formula:
k = 100 * (close - lowest(low, length)) / (highest(high, length) - lowest(low, length))
Description:
A classic stochastic oscillator showing price position relative to the selected period's range.
5. Bollinger Bands Oscillator
Formula:
(tprice - BB midline) / (upper BB - lower BB) * 100
Description:
Indicates the price position relative to Bollinger Bands in percentage terms.
Key Lines & Histogram
1. Verde (Green Line)
Calculation:
verde = marron + oscp (normalized PVI)
Interpretation:
Higher values indicate stronger bullish momentum. A FUSION🔥 signal appears when the value reaches 750+.
2. Marron (Brown Line)
Calculation:
marron = (RSI + MFI + Bollinger Osc + Stochastic / 3) / 2
Interpretation:
A composite oscillator combining multiple indicators. Higher values suggest overbought conditions.
3. Media (Red Line)
Calculation:
media = EMA of marron with smoothing period
Interpretation:
Acts as a signal line for trend confirmation.
4. Histogram
Calculation:
histo = verde - marron
Colors:
Bright green (>100) – Strong bullish momentum.
Light green (>0) – Moderate bullish momentum.
Orange (<0) – Bearish momentum.
Red (<-100) – Strong bearish momentum.
Signals & Alerts
1. FUSION🔥 (Strong Momentum)
Condition:
verde >= 750
Visualization:
A "FUSION🔥" label appears below the chart.
Alert:
Can be set to trigger notifications when the condition is met.
2. Background Aura
Condition:
verde > 850
Visualization:
The chart background turns teal, indicating extreme momentum.
Usage Recommendations
FUSION🔥 Signal – Can be used as a long entry point when confirmed by other indicators.
Histogram:
1. Green bars – Potential long entry.
2. Red/orange bars – Potential short entry.
3. Media & Marron Crossover – Can serve as an additional trend filter.
4. Suitable for a 5-15 minute time frame
Conclusion
Momentum Fusion v1 is a powerful tool for momentum analysis, combining multiple indicators into a unified system. It is suitable for:
Trend traders (catching strong movements).
Scalpers (identifying short-term impulses).
Swing traders (filtering entry points).
The indicator features customizable settings and visual signals, making it adaptable to various trading styles.

Reversal Strength Meter – Adib NooraniThe Reversal Strength Meter is an oscillator designed to identify potential reversal zones based on supply and demand dynamics. It uses smoothed stochastic logic to reduce noise and highlight areas where momentum may be weakening, signaling possible market turning points.
🔹 Smooth, noise-reduced stochastic oscillator
🔹 Custom zones to highlight potential supply and demand imbalances
🔹 Non-repainting, compatible across all timeframes and assets
🔹 Visual-only tool — intended to support discretionary trading decisions
This oscillator assists scalpers and intraday traders in tracking subtle shifts in momentum, helping them identify when a market may be preparing to reverse — always keeping in mind that trading is based on probabilities, not certainties.
📘 How to Use the Indicator Efficiently
For Reversal Trading:
Buy Setup
– When the blue line dips below the 20 level, wait for it to re-enter above 20.
– Look for reversal candlestick patterns (e.g., bullish engulfing, hammer, or morning star).
– Enter above the pattern’s high, with a stop loss below its low.
Sell Setup
– When the blue line rises above the 80 level, wait for it to re-enter below 80.
– Look for bearish candlestick patterns (e.g., bearish engulfing, inverted hammer, or evening star).
– Enter below the pattern’s low, with a stop loss above its high.
🛡 Risk Management Guidelines
Risk only 0.5% of your capital per trade
Book 50% profits at a 1:1 risk-reward ratio
Trail the remaining 50% using price action or other supporting indicators

Highest High Line with Multi-Timeframe Supertrend and RSIOverview:
This powerful indicator combines three essential elements for traders:
Highest High Line – Tracks the highest price over a customizable lookback period across different timeframes.
Multi-Timeframe Supertrend – Displays Supertrend values and trend directions for multiple timeframes simultaneously.
Relative Strength Index (RSI) – Shows RSI values across different timeframes for momentum analysis.
Features:
✅ Customizable Highest High Line:
Selectable timeframes: Daily, Weekly, Monthly, Quarterly, Yearly
Adjustable lookback period
✅ Multi-Timeframe Supertrend:
Supports 1min, 5min, 10min, 15min, 30min, 1H, Daily, Weekly, Monthly, Quarterly, Yearly
ATR-based calculation with configurable ATR period and multiplier
Identifies bullish (green) & bearish (red) trends
✅ Multi-Timeframe RSI:
Calculates RSI for the same timeframes as Supertrend
Overbought (≥70) and Oversold (≤30) signals with color coding
✅ Comprehensive Table Display:
A clean, structured table in the bottom-right corner
Displays Supertrend direction, value, and RSI for all timeframes
Helps traders quickly assess trend and momentum alignment
How to Use:
Use the Highest High Line to identify key resistance zones.
Confirm trend direction with Multi-Timeframe Supertrend.
Check RSI values to avoid overbought/oversold conditions before entering trades.
Align multiple timeframes for stronger confirmation of trend shifts.
Ideal For:
✅ Scalpers (lower timeframes: 1m–30m)
✅ Swing Traders (higher timeframes: 1H–D)
✅ Position Traders (Weekly, Monthly, Quarterly)
💡 Tip: Look for Supertrend & RSI confluence across multiple timeframes for higher probability setups.

AO Smart Scalper – 5M Dynamic SL Edition📈 AO Signals with Fixed and Dynamic SL – Optimized for 5-Minute Charts 📉
This indicator is built for 5-minute timeframe trading, combining powerful momentum signals from the Awesome Oscillator (AO) with both Fixed and Dynamic Stop Loss (SL) levels to enhance trade management and risk control.
✅ Buy/Sell Signals:
The indicator generates clear BUY and SELL signals based on the AO crossing above or below the zero line, helping traders capture momentum shifts early.
🛑 Fixed Stop Loss:
Each trade signal comes with a Fixed SL, calculated based on the high (for shorts) or low (for longs) of the previous candle, with a customizable percentage offset. This SL is plotted with a red line, providing a clear initial risk level.
⚡ Dynamic Stop Loss: Continuous Presence, Strategic Use:
A secondary Dynamic SL line is plotted, which is continuously present on the chart. This dynamic level responds to market conditions and can serve as a trailing stop or key decision point.
💡 Recommended Use: It is recommended to actively start using the Dynamic SL once the trade has moved into profit. This allows protecting obtained profits and minimizing the risk of losses in case of a market reversal.
🛡️ Enhanced Dynamic Stop-Loss Strategy:
🔒 Initial Protection: Utilize the Fixed SL as the initial stop-loss, placed below relevant lows (for longs) or above relevant highs (for shorts), or as provided by the fixed SL indicator.
🛤️ Dynamic Tracking:
🟢 Long Trades: Once in profit, the Dynamic SL will dynamically adjust, moving upwards as higher lows are formed, effectively trailing the price and securing profits.
🔴 Short Trades: Conversely, in short trades, once in profit, the Dynamic SL will move downwards as lower highs are formed, protecting gains.
🔄 Alternatively the dynamic stop loss will follow the dynamic SL line provided by the indicator.
🚪 Exiting Trades: When the price crosses below the Dynamic SL line in a LONG trade, or above it in a SHORT trade, the recommended action is to exit the trade.
↩️ Re-entry Consideration: You may consider re-entering only if the price clearly returns above the Dynamic SL (for longs) or below it (for shorts).
⚠️ IMPORTANT - 5-Minute Strategy Guidance ⏱️
This tool is specifically optimized for the 5-minute timeframe. This approach helps filter out weak setups and maintain discipline in volatile market conditions.
✨ Additional Features:
👁️ Visual and editable SL levels
📊 200-period SMA for trend context
💻 Simple and effective interface for intraday trading setups
🎯 Ideal for traders seeking a clean, rule-based system that combines momentum entry signals with layered stop loss protection.
🔑 Key Changes:
It was emphasized that the Dynamic SL is always present, but its active use is recommended once the trade is in profit.
It was clarified the use of the Fixed SL, giving the option to use the one provided by the indicator, or to place it according to the price action.

Multi-Indicator Signals with Selectable Options by DiGetMulti-Indicator Signals with Selectable Options
Script Overview
This Pine Script is a multi-indicator trading strategy designed to generate buy/sell signals based on combinations of popular technical indicators: RSI (Relative Strength Index) , CCI (Commodity Channel Index) , and Stochastic Oscillator . The script allows you to select which combination of signals to display, making it highly customizable and adaptable to different trading styles.
The primary goal of this script is to provide clear and actionable entry/exit points by visualizing buy/sell signals with arrows , labels , and vertical lines directly on the chart. It also includes input validation, dynamic signal plotting, and clutter-free line management to ensure a clean and professional user experience.
Key Features
1. Customizable Signal Types
You can choose from five signal types:
RSI & CCI : Combines RSI and CCI signals for confirmation.
RSI & Stochastic : Combines RSI and Stochastic signals.
CCI & Stochastic : Combines CCI and Stochastic signals.
RSI & CCI & Stochastic : Requires all three indicators to align for a signal.
All Signals : Displays individual signals from each indicator separately.
This flexibility allows you to test and use the combination that works best for your trading strategy.
2. Clear Buy/Sell Indicators
Arrows : Buy signals are marked with upward arrows (green/lime/yellow) below the candles, while sell signals are marked with downward arrows (red/fuchsia/gray) above the candles.
Labels : Each signal is accompanied by a label ("BUY" or "SELL") near the arrow for clarity.
Vertical Lines : A vertical line is drawn at the exact bar where the signal occurs, extending from the low to the high of the candle. This ensures you can pinpoint the exact entry point without ambiguity.
3. Dynamic Overbought/Oversold Levels
You can customize the overbought and oversold levels for each indicator:
RSI: Default values are 70 (overbought) and 30 (oversold).
CCI: Default values are +100 (overbought) and -100 (oversold).
Stochastic: Default values are 80 (overbought) and 20 (oversold).
These levels can be adjusted to suit your trading preferences or market conditions.
4. Input Validation
The script includes built-in validation to ensure that oversold levels are always lower than overbought levels for each indicator. If the inputs are invalid, an error message will appear, preventing incorrect configurations.
5. Clean Chart Design
To avoid clutter, the script dynamically manages vertical lines:
Only the most recent 50 buy/sell lines are displayed. Older lines are automatically deleted to keep the chart clean.
Labels and arrows are placed strategically to avoid overlapping with candles.
6. ATR-Based Offset
The vertical lines and labels are offset using the Average True Range (ATR) to ensure they don’t overlap with the price action. This makes the signals easier to see, especially during volatile market conditions.
7. Scalable and Professional
The script uses arrays to manage multiple vertical lines, ensuring scalability and performance even when many signals are generated.
It adheres to Pine Script v6 standards, ensuring compatibility and reliability.
How It Works
Indicator Calculations :
The script calculates the values of RSI, CCI, and Stochastic Oscillator based on user-defined lengths and smoothing parameters.
It then checks for crossover/crossunder conditions relative to the overbought/oversold levels to generate individual signals.
Combined Signals :
Depending on the selected signal type, the script combines the individual signals logically:
For example, a "RSI & CCI" buy signal requires both RSI and CCI to cross into their respective oversold zones simultaneously.
Signal Plotting :
When a signal is generated, the script:
Plots an arrow (upward for buy, downward for sell) at the corresponding bar.
Adds a label ("BUY" or "SELL") near the arrow for clarity.
Draws a vertical line extending from the low to the high of the candle to mark the exact entry point.
Line Management :
To prevent clutter, the script stores up to 50 vertical lines in arrays (buy_lines and sell_lines). Older lines are automatically deleted when the limit is exceeded.
Why Use This Script?
Versatility : Whether you're a scalper, swing trader, or long-term investor, this script can be tailored to your needs by selecting the appropriate signal type and adjusting the indicator parameters.
Clarity : The combination of arrows, labels, and vertical lines ensures that signals are easy to spot and interpret, even in fast-moving markets.
Customization : With adjustable overbought/oversold levels and multiple signal options, you can fine-tune the script to match your trading strategy.
Professional Design : The script avoids clutter by limiting the number of lines displayed and using ATR-based offsets for better visibility.
How to Use This Script
Add the Script to Your Chart :
Copy and paste the script into the Pine Editor in TradingView.
Save and add it to your chart.
Select Signal Type :
Use the "Signal Type" dropdown menu to choose the combination of indicators you want to use.
Adjust Parameters :
Customize the lengths of RSI, CCI, and Stochastic, as well as their overbought/oversold levels, to match your trading preferences.
Interpret Signals :
Look for green arrows and "BUY" labels for buy signals, and red arrows and "SELL" labels for sell signals.
Vertical lines will help you identify the exact bar where the signal occurred.
Tips for Traders
Backtest Thoroughly : Before using this script in live trading, backtest it on historical data to ensure it aligns with your strategy.
Combine with Other Tools : While this script provides reliable signals, consider combining it with other tools like support/resistance levels or volume analysis for additional confirmation.
Avoid Overloading the Chart : If you notice too many signals, try tightening the overbought/oversold levels or switching to a combined signal type (e.g., "RSI & CCI & Stochastic") for fewer but higher-confidence signals.

TrendGuard Scalper: SSL + Hama Candle with Consolidation ZonesThis TradingView script brings a powerful scalping strategy that combines the SSL Channel and Hama Candles indicators with a special twist—consolidation detection. Designed for traders looking for consistency in various markets like crypto, forex, and stocks, this strategy highlights clear trend signals, risk management, and helps filter out risky trades during consolidation periods.
Why Use This Strategy?
Clear Trend Detection:
With the SSL Channel, you’ll know exactly when the market is in an uptrend (green) or downtrend (red), giving you straightforward entry points.
Short-Term Trend Precision with Hama Candles:
By calculating unique EMAs for open, high, low, and close, the Hama Candles show the strength and direction of short-term trends. Combined with the Hama Line, it gives you a solid confirmation on whether the trend is strong or about to reverse, allowing for precise entries and exits.
Avoiding Choppy Markets:
Thanks to ATR-based consolidation detection, this strategy identifies low-volatility periods where the market is “choppy” and less predictable. During these times, a yellow background appears on the chart, warning you to hold off on trades, reducing the likelihood of entering losing trades.
Built-In Risk Management:
With adjustable Take Profit and Stop Loss levels based on price movements, you can set and forget your trades, with a safety net if the market turns against you. The strategy automatically closes positions if the price returns to the Hama Candle, keeping your risk low.
How It Works:
Long Position: When both the SSL and Hama indicators show a green trend, and the price is above the Hama Candles, the strategy opens a long position. Take Profit triggers at your chosen risk-to-reward ratio, while Stop Loss protects you just below the Hama Line.
Short Position: When both indicators align in red and the price is below the Hama Candles, the strategy opens a short. Similar to longs, Stop Loss is set just above the Hama Line, and Take Profit is at your defined level.
Start Trading Confidently
Test this strategy with different settings and discover how it can perform across various assets. Whether you're trading Bitcoin, forex pairs, or stocks, this system has the flexibility and robustness to help you spot profitable trends and avoid risky zones. Try it today on a 30-minute timeframe to see how it aligns with your trading goals, and let the consolidation detection guide you away from false signals.
Happy trading, and may the trends be with you! 📈

EMA Scalp Alerts by Sabir KhanThis TradingView indicator, developed by Sabir Khan, is designed for scalping strategies based on Exponential Moving Averages (EMAs). The indicator visually represents three EMAs with customizable parameters and provides alerts for potential trading signals.
Key Features:
Fast EMA: User-configurable fast EMA with default period set to 21.
Slow EMA: User-configurable slow EMA with default period set to 55.
Third EMA: User-configurable third EMA with default period set to 200.
Line Width: Adjustable line width for the fast and third EMAs, allowing customization for better visibility.
Color Customization: Choose colors for each EMA to suit your chart preferences.
Alerts: Automatic alerts for potential trading signals:
Long Signal: Triggered when the fast EMA crosses above the slow EMA.
Short Signal: Triggered when the fast EMA crosses below the slow EMA.
All EMAs Crossover: Triggered when all three EMAs cross over, indicating a potentially strong trend.
Usage:
Users can observe the visual representation of the three EMAs on the chart.
Alerts are generated for potential long, short, or strong trend signals based on EMA crossovers.
The indicator's parameters, including EMA periods, line widths, and colors, are customizable to fit individual preferences.
Alert Message Format:
The alert message provides essential information about the detected signal, including the signal type (Long, Short, None), the involved symbol, timeframe, open, close, high, low, and whether a strong crossover is detected.
Note: This indicator is particularly suitable for traders employing scalp trading strategies focusing on short-term market movements.
*Disclaimer: Trading involves risk, and users should conduct their own research and analysis before making any trading decisions based on this indicator.*

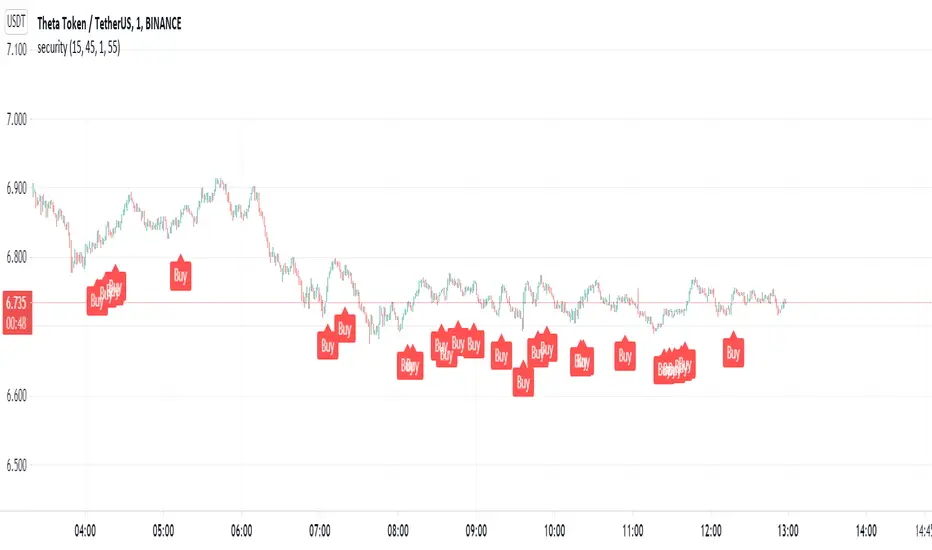
Stochastic Rsi+Ema - Auto Buy Scalper Scirpt v.0.3Simple concept for a scalping script, written for 5 minute candles, optimized for BTC.
1st script I've created from scratch, somewhat from scratch. Also part of the goal of this one is to hold coin as often as possible, whenever it's sideways or not dropping significantly.
Designed to buy on the stochastic bottoms (K>D and rising, and <17)
Then and sell after 1 of 3 conditions;
a. After the price goes back up at least 1 % and then 1-2 period ema reversal
b. After the rsi reversal (is dropping) and K

Kam+ ScalpingThis study project is a Scalping trading Tool that incorporates the majority of the indicators needed to analyse and scalp Trends for 1min, 5min or 15min charts. Incorporated within this tool are the following indicators:
1. Major industry (Banks) recognised important SMAs
3SMA
2. Kijun Sen+ for entry
3. Atr Stop Loss For Stop Loss Entry/Exit.
Hint:- Use With Rsi Time Frame 15 min Custom, And Volume Flow Indicator For Trade Conformation

MACD Indicator for 5 Min ScalpThis Indicator merges the 1 min MACD with BollingerBands to dedect a bigger than avarage tick on the Macd for the 5 min Scalping Strategy
You can change the length of the bollinger bands for the upper and lower channel individually so that you can get better signals
if a tick is bigger than avarage it will be colored, else it would be gray
this is the same indicator i used to get entrys in my 5 min scalping statagy, but i wouldnt just go in a trade when there is a bigger than usual tick. You have to look at other things to

Profitable Contrarian scalpingUses the 5 period and 10 period VMWAs that have been smoothed with a 5 period SMA of the close price. Normally, a short crossover long formation signals a buy signal, but as scalpers know, the 1 minute chart moves so fast and with so much volatility that lagging indicators get wrecked by the market. According, this strategy operates under the assumption that by the time this lagging indicator makes a signal, the price is ready to reverse. Losses are taken swiftly in the case of a continuation pattern. This indicator averages a 55-65% profitable rate and is almost always a positive P/L on the 1 minute chart of the most commonly traded assets.
Of course, there may be validity for this indicator outside the 1 minute chart, but I have found such success to be very limited. Accordingly, use this indicator on SPY, TQQQ, TSLA, AMZN, and major cryptos on the 1 min chart.

Intraday FOREX london scalperThis forex System is only for ECN Broker Account.
Pairs: Major with spread < 0.0001 (EUR/USD).
Setup:
Wait for the market to make to 60 minute from the open.
If the market is near the intraday high be prepared to go short
If the market is near an intraday low for the same time period, then be prepared to go long.
Rules for entry
For sell setups: Enter on sell stop 1 pip from low of the last 15 min bar.
For buy setups: Enter in buy stop 1 pip from high of the last 15-minute bars.
Rules for exit
Take profit: Close out positions on 6 pips profit..
Stop Loss: Close out on 5 pips loss or if trade takes more than 1 minute.

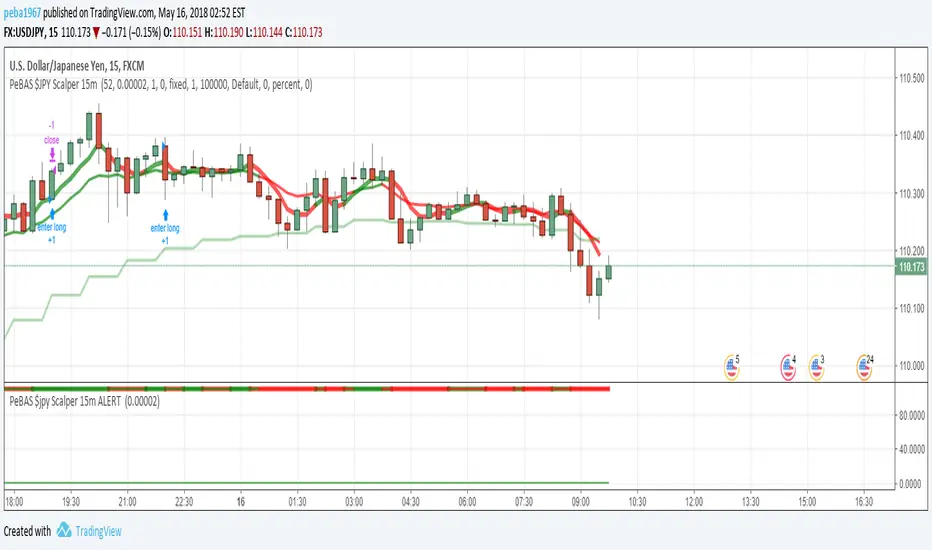
Security. Scalp Adviser by Antony SavacheGreat script for quick deals. Buy and after 5 minutes sell with a target yield of 0.3%
Works on the principle of getting out of the pit. The pit is determined thanks to the rsi on the 15-minute time frame, the exit is determined by the rsi on the 1-minute timeframe. You can play with the rci values in the settings
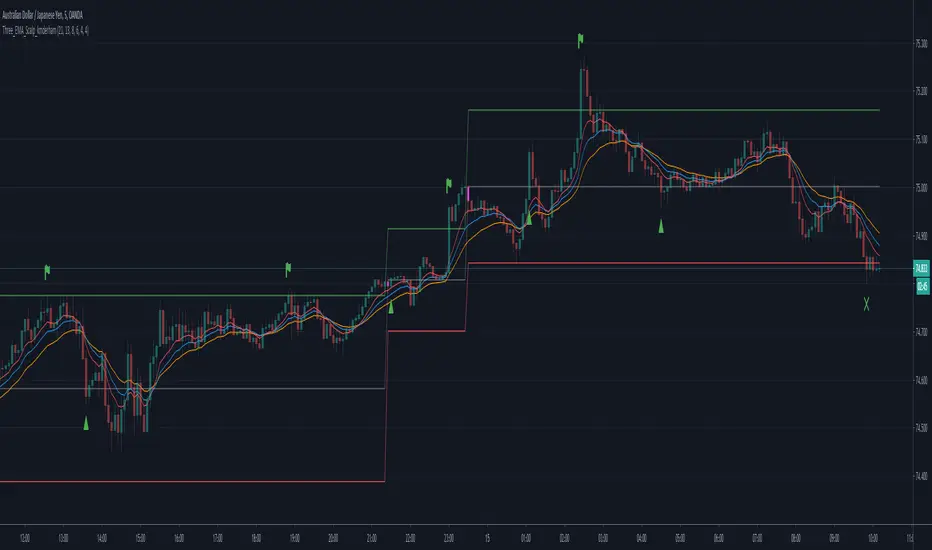
Three EMA Scalp Signals by kmderhamThis script looks for a set up condition where 5 consecutive candles have broken away from the fast EMA (set to 8 by default) followed by a "trigger" candle that crosses back over the fast EMA but not the medium EMA (set to 13 by default). It then determines the entry point based on the bar high or low (not tail or wick) depending on direction of the trend. Once the entry point is crossed, we can enter the position. Win or loss is determined whether the lower or upper levels are crossed (as per trend). After the position is won or lost and if the entry level is re-crossed before a new set up condition is found then a new entry signal is given.
Please note that this should really be used in conjunction with a higher timeframe "Anchor" chart with a fast and a slow EMA so setups and positions should should correspond to the trend of the higher timeframe chart. This was designed for a 5 minute timeframe and a 60 minute anchor chart.
Intraday BUY/SELLBUY & SELL Scalp Signals for Crude Oil Future Contracts (Or it can be used with any scrip with good amount of Volume) based on Sma & RSI overbought/oversold alert (!) for possible reversal indication.
Take Buy position only if candle breaks the high of alert candle & for Sell positions, take position if candle breaks low of the alert candle.
Best to perform with 3 min timeframe on Crude Oil Futures


BP Scalper with resistance barsThis Script is used for scalping on the 15 min. It can do the other time frames but i built it for primarily the 15. There is some logic where i use the previous candles and i'm using intervals of 4 to get 1 hour estimates. This also works with the 1 hour, because the 4 hour is what it will compare with.
It uses Buy volume and sell volume to create the indicators.
If the buy volume starts losing traction on the sell volume the indicator triggers.