ATR Adjusted RSIATR Adjusted RSI Indicator
By Nathan Farmer
The ATR Adjusted RSI Indicator is a versatile indicator designed primarily for trend-following strategies, while also offering configurations for overbought/oversold (OB/OS) signals, making it suitable for mean-reversion setups. This tool combines the classic Relative Strength Index (RSI) with a unique Average True Range (ATR)-based smoothing mechanism, allowing traders to adjust their RSI signals according to market volatility for more reliable entries and exits.
Key Features:
ATR Weighted RSI:
At the core of this indicator is the ATR-adjusted RSI line, where the RSI is smoothed based on volatility (measured by the ATR). When volatility increases, the smoothing effect intensifies, resulting in a more stable and reliable RSI reading. This makes the indicator more responsive to market conditions, which is especially useful in trend-following systems.
Multiple Signal Types:
This indicator offers a variety of signal-generation methods, adaptable to different market environments and trading preferences:
RSI MA Crossovers: Generates signals when the RSI crosses above or below its moving average, with the flexibility to choose between different moving average types (SMA, EMA, WMA, etc.).
Midline Crossovers: Provides trend confirmation when either the RSI or its moving average crosses the 50 midline, signaling potential trend reversals.
ATR-Inversely Weighted RSI Variations: Uses the smoothed, ATR-adjusted RSI for a more refined and responsive trend-following signal. There are variations both for the MA crossover and the midline crossover.
Overbought/Oversold Conditions: Ideal for mean reversion setups, where signals are triggered when the RSI or its moving average crosses over overbought or oversold levels.
Flexible Customization:
With a wide range of customizable options, you can tailor the indicator to fit your personal trading style. Choose from various moving average types for the RSI, modify the ATR smoothing length, and adjust overbought/oversold levels to optimize your signals.
Usage:
While this indicator is primarily designed for trend-following, its OB/OS configurations make it highly effective for mean-reverting setups as well. Depending on your selected signal type, the relevant indicator line will change color between green and red to visually signal long or short opportunities. This flexibility allows traders to switch between trending and sideways market strategies seamlessly.
A Versatile Tool:
The ATR Adjusted RSI Indicator is a valuable component of any trading system, offering enhanced signals that adapt to market volatility. However, it is not recommended to rely on this indicator alone, especially without thorough backtesting. Its performance varies across different assets and timeframes, so it’s essential to experiment with the parameters to ensure consistent results before applying it in live trading.
Recommendation:
Before incorporating this indicator into live trading, backtest it extensively. Given its flexibility and wide range of signal-generation methods, backtesting allows you to optimize the settings for your preferred assets and timeframes. Only consider using it on it's own if you are confident in its performance based on your own backtest results, and even then, it is not recommended.
Komut dosyalarını "rsi指标参数设置9,9,9" için ara

Cubic Bezier Curve RSI [CBCR]Overview :
Introducing the Cubic Bézier Curve RSI – an innovative approach to smoothing the traditional RSI using cubic Bézier curves. This indicator provides traders with a smoother, adaptive version of the RSI that can help filter out noise and better highlight market trends.
Key Features:
Bézier Curve : the script uses cubic Bézier curves to create a smoothed version of the RSI, offering a more visually appealing and potentially more insightful representation of market momentum.
Customizable Settings: Users can adjust the Bézier Curve Length, Impact Factor, and color modes, allowing full customization of the smoothing effect and visualization.
Color-coded Trend Indicator: The smoothed RSI is displayed with colors that indicate potential bullish or bearish trends, helping traders quickly assess market conditions.
Overbought/Oversold Lines: Option to display overbought and oversold levels for better identification of market extremes.
Parameters:
RSI Length: Set the length for the traditional RSI calculation (default is 14).
Bézier Curve Length: Adjust the length of the Bézier curve used to smooth the RSI (default is 20).
Impact Factor: Control the influence of the Bézier smoothed values versus the original RSI values (default is 0.5, ranging from 0.0 to 1.0).
Overbought/Oversold Lines: Option to show overbought (default: 70) and oversold (default: 30) lines for easier identification of extreme conditions.
Color Mode: Choose between "Trend Following" and "Overbought/Oversold" modes for line color indication.
Display Settings: Color customization for bullish and bearish phases allows better visual differentiation.
How It Works:
The CBCR uses four control points derived from historical RSI values over a user-defined length. It then applies the cubic Bezier formula to generate a sequence of points representing a smoothed version of the RSI over this range.
The Bezier curve is recalculated each time a specific number of bars (as defined by the Bezier Curve Length) have passed, helping reduce noise while retaining key trend information.
The result is a smoothed RSI that combines the adaptability of cubic Bezier curves with the familiar oscillation of the RSI, making it potentially more robust for identifying shifts in market sentiment.
Visuals:
Smoothed RSI Line: Plotted on the indicator pane, the line changes color depending on the chosen color mode:
Trend Following Mode: Color changes based on whether the smoothed RSI is above or below the 50-level.
Overbought/Oversold Mode: Color changes based on whether the smoothed RSI is above the overbought level or below the oversold level.
Bullish Color: Configurable (default: cyan).
Bearish Color: Configurable (default: red).
Overbought/Oversold Lines: Horizontal lines at user-defined levels (default: 70 for overbought, 30 for oversold) for easy identification of market extremes.
Usage:
The CBCR can be used like a traditional RSI but with a smoother output that may help traders avoid false signals generated by sudden price spikes. For instance:
Look for crossovers around the 50 level as a signal for changing momentum.
Use the overbought and oversold levels to identify potential reversal zones.
Observe the color change of the line for an immediate visual cue on current sentiment.
Dynamic Volume RSI (DVRSI) [QuantAlgo]Introducing the Dynamic Volume RSI (DVRSI) by QuantAlgo 📈✨
Elevate your trading and investing strategies with the Dynamic Volume RSI (DVRSI) , a powerful tool designed to provide clear insights into market momentum and trend shifts. This indicator is ideal for traders and investors who want to stay ahead of the curve by using volume-responsive calculations and adaptive smoothing techniques to enhance signal clarity and reliability.
🌟 Key Features:
🛠 Customizable RSI Settings: Tailor the indicator to your strategy by adjusting the RSI length and price source. Whether you’re focused on short-term trades or long-term investments, DVRSI adapts to your needs.
🌊 Adaptive Smoothing: Enable adaptive smoothing to filter out market noise and ensure cleaner signals in volatile or choppy market conditions.
🎨 Dynamic Color-Coding: Easily identify bullish and bearish trends with color-coded candles and RSI plots, offering clear visual cues to track market direction.
⚖️ Volume-Responsive Adjustments: The DVRSI reacts to volume changes, giving greater significance to high-volume price moves and improving the accuracy of trend detection.
🔔 Custom Alerts: Stay informed with alerts for key RSI crossovers and trend changes, allowing you to act quickly on emerging opportunities.
📈 How to Use:
✅ Add the Indicator: Set up the DVRSI by adding it to your chart and customizing the RSI length, price source, and smoothing options to fit your specific strategy.
👀 Monitor Visual Cues: Watch for trend shifts through the color-coded plot and candles, signaling changes in momentum as the RSI crosses key levels.
🔔 Set Alerts: Configure alerts for critical RSI crossovers, such as the 50 line, ensuring you stay on top of potential market reversals and opportunities.
🔍 How It Works:
The Dynamic Volume RSI (DVRSI) is a unique indicator designed to provide more accurate and responsive signals by incorporating both price movement and volume sensitivity into the RSI framework. It begins by calculating the traditional RSI values based on a user-defined length and price source, but unlike standard RSI tools, the DVRSI applies volume-weighted adjustments to reflect the strength of market participation.
The indicator dynamically adjusts its sensitivity by factoring in volume to the RSI calculation, which means that price moves backed by higher volumes carry more weight, making the signal more reliable. This method helps identify stronger trends and reduces the risk of false signals in low-volume environments. To further enhance accuracy, the DVRSI offers an adaptive smoothing option that allows users to reduce noise during periods of market volatility. This adaptive smoothing function responds to market conditions, providing a cleaner signal by reducing erratic movements or price spikes that could lead to misleading signals.
Additionally, the DVRSI uses dynamic color-coding to visually represent the strength of bullish or bearish trends. The candles and RSI plots change color based on the RSI values crossing critical thresholds, such as the 50 level, offering an intuitive way to recognize trend shifts. Traders can also configure alerts for specific RSI crossovers (e.g., above 50 or below 40), ensuring that they stay informed of potential trend reversals and significant market shifts in real-time.
The combination of volume sensitivity, adaptive smoothing, and dynamic trend visualization makes the DVRSI a robust and versatile tool for traders and investors looking to fine-tune their market analysis. By incorporating both price and volume data, this indicator delivers more precise signals, helping users make informed decisions with greater confidence.
Disclaimer:
The Dynamic Volume RSI is designed to enhance your market analysis but should not be used as a sole decision-making tool. Always consider multiple factors before making any trading or investment decisions. Past performance is not indicative of future results.

Multi-Length RSI **Multi-Length RSI Indicator**
This script creates a custom Relative Strength Index (RSI) indicator with the ability to plot three different RSI lengths on the same chart, allowing traders to analyze momentum across various timeframes simultaneously. The script also includes features to enhance visual clarity and usability.
**Key Features:**
1. **Customizable RSI Lengths:**
- The script allows you to input and customize three different RSI lengths (7, 14, and 28 by default) via user inputs. This flexibility enables you to track short-term, medium-term, and long-term momentum in the market.
2. **Dynamic Colour Coding:**
- The RSI lines are color-coded based on their current value:
- **Above 70 (Overbought)**: The line turns red.
- **Below 30 (Oversold)**: The line turns green.
- **Between 30 and 70**: The line retains its user-defined colour (blue, yellow, orange by default).
- This dynamic colouring helps to quickly identify overbought and oversold conditions.
3. **Adjustable Line Widths and Colours:**
- Users can customize the colour and thickness of each RSI line, allowing for a personalized visual experience that fits different trading strategies.
4. **Overbought, Oversold, and Midline Levels:**
- The script includes static horizontal lines at the 70 (Overbought) and 30 (Oversold) levels, with a red and green colour, respectively.
- A midline at the 50 level is also included in gray and dashed, helping to visualize the neutral zone.
5. **Dynamic RSI Value Labels:**
- The current values of each RSI line are displayed directly on the chart as labels at the most recent bar, with colours matching their corresponding lines. This feature provides an immediate reference to the exact RSI values without the need to hover or look at the data window.
6. **Alerts for Crosses:**
- The script includes built-in alert conditions for when any of the RSI values cross above the overbought level (70) or below the oversold level (30). These alerts can be configured to notify you in real-time when significant momentum shifts occur.
**How to Use:**
1. **Customization**:
- Input your preferred RSI lengths, colours, and line widths through the script’s settings menu.
2. **Visual Analysis**:
- The indicator plots all three RSI values on a separate pane below the price chart. Use the color-coded lines and levels to quickly identify overbought, oversold, and neutral conditions across multiple timeframes.
3. **Set Alerts**:
- You can configure alerts based on the built-in alert conditions to get notified when the RSI crosses critical levels.
**Ideal For:**
- **Traders looking to analyze momentum across multiple timeframes**: The ability to view short-term, medium-term, and long-term RSIs simultaneously offers a comprehensive view of market strength.
- **Those who prefer visual clarity**: The dynamic colouring, clear labels, and customizable settings make it easy to interpret RSI data at a glance.
- **Traders who rely on alerts**: The built-in alert system allows for proactive trading based on significant RSI level crossings.
---
This script is a powerful tool for any trader looking to leverage RSI analysis across multiple timeframes, offering both customization and clarity in a single indicator.
TechniTrend RSI (11TF)Multi-Timeframe RSI Indicator
Overview
The Multi-Timeframe RSI Indicator is a sophisticated tool designed to provide comprehensive insights into the Relative Strength Index (RSI) across 11 different timeframes simultaneously. This indicator is essential for traders who wish to monitor RSI trends and their moving averages (MA) to make informed trading decisions.
Features
Multiple Timeframes: Displays RSI and RSI MA values for 11 different timeframes, allowing traders to have a holistic view of the market conditions.
RSI vs. MA Comparison: Indicates whether the RSI value is above or below its moving average for each timeframe, helping traders to identify bullish or bearish momentum.
Overbought/Oversold Signals:
Marks "OS" (OverSell) when RSI falls below 25, indicating a potential oversold condition.
Marks "OB" (OverBuy) when RSI exceeds 75, signaling a potential overbought condition.
Real-Time Updates: Continuously updates in real-time to provide the most current market information.
Usage
This indicator is invaluable for traders who utilize RSI as part of their technical analysis strategy. By monitoring multiple timeframes, traders can:
Identify key overbought and oversold levels to make entry and exit decisions.
Observe the momentum shifts indicated by RSI crossing above or below its moving average.
Enhance their trading strategy by integrating multi-timeframe analysis for better accuracy and confirmation.
How to Interpret the Indicator
RSI Above MA: Indicates a potential bullish trend. Traders may consider looking for long positions.
RSI Below MA: Suggests a potential bearish trend. Traders may look for short positions.
OS (OverSell): When RSI < 25, the market may be oversold, presenting potential buying opportunities.
OB (OverBuy): When RSI > 75, the market may be overbought, indicating potential selling opportunities.

Korneev Reverse RSIRethinking the Legendary Relative Strength Index by John Welles Wilder
The essence of the new approach lies in the reverse use of the so-called "overbought" and "oversold" zones. In his 1978 book, "New Concepts in Technical Trading Systems," where the RSI mechanism was thoroughly described, Wilder writes that one way to use the oscillator is to open a long position when the RSI drops into oversold territory (below 30) and to open a short position when the RSI rises to overbought levels (above 70). However, backtesting this strategy with such inputs yields rather mediocre results.
Based on the calculation formula, the RSI calculates the rate of price change over a certain period. Therefore, overbought and oversold zones will have relative significance (relative to the set calculation period). It is no coincidence that the word "relative" was added to the name of the oscillator. It is worth accepting as an axiom the assertion that the price of an asset is fair at every moment in time.
Essentially, the RSI calculates the strength of a trend. If the oscillator value is above 70, it is highly likely that an upward movement is occurring in the market. Therefore, in the current strategy, a long position is opened precisely at the moment of greatest buyer strength (when RSI > 80), i.e., in the direction of the trend, since counter-trend trading with the RSI has proven to be ineffective. The position is closed after the buyers lose their advantage and the RSI drops to 40.
The strategy is recommended to be used only with long positions, as short positions show negative results. The strategy uses a moving average for the RSI with a period of 14 to smooth the oscillator data.
--------------------------------------------------------------------------------------------
Переосмысление легендарного осциллятора Relative strength index Джона Уэллса Уайлдера
Суть нового подхода заключается в реверсивном использовании так называемых зон "перекупленности" и "перепроданности". В своей книге от 1978 года "New concepts in tecnical trading systems", в которой был подробно описан механизм работы RSI, Уайлдер пишет, что один из способов использования осциллятора - открытие длинной позиции при снижении RSI в перепроданность (ниже 30) и открытие короткой позиции при повышении RSI до перекупленности (выше 70). Однако бэктест стратегии с такими вводными дает весьма посредственные результаты.
Исходя из формулы расчета, RSI рассчитывает скорость изменения цены за определенный период. Поэтому зоны перекупленности и перепроданности будут иметь относительное значение (относительно установленного периода расчета). Не зря ведь в названии осциллятора было добавлено слово "относительной". Стоит принять за аксиому утверждение, что цена актива справедлива в каждый момент времени.
По сути, RSI рассчитывает силу тренда. Если значение осциллятора выше 70, то на рынке с высокой долей вероятности происходит восходящее движение. Поэтому в текущей стратегии открытие лонга происходит именно в момент наибольшей силы покупателей (когда RSI > 80), то есть в сторону тренда, поскольку контртрендовая торговля по RSI показала свою несостоятельность. Закрытие позиции происходит после того, как покупатели теряют преимущество и RSI снижается до 40.
Стратегию рекомендуется использовать только с длинными позициями, поскольку короткие позиции показывают отрицательный результат. В стратегии используется скользящая средняя для RSI с периодом 14 для сглаживания данных осциллятора.

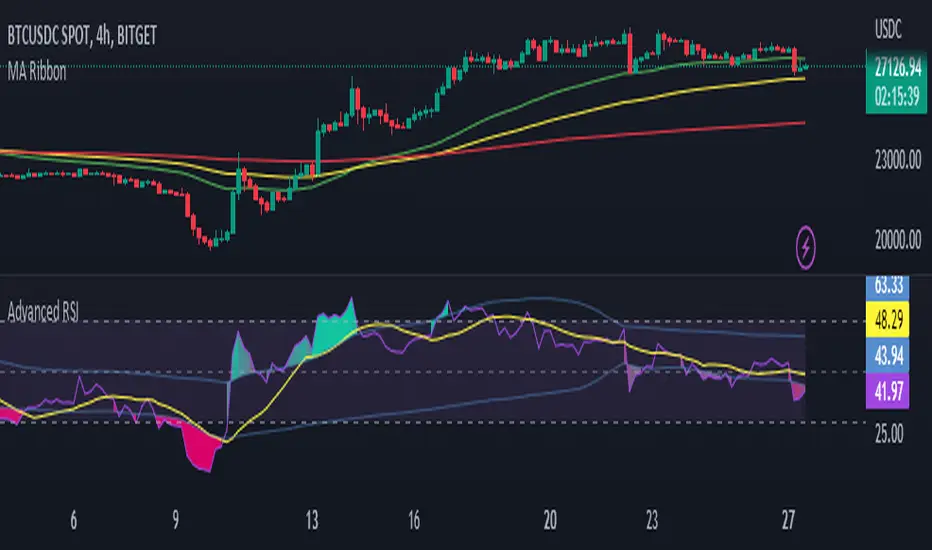
Advanced RSI [CryptoSea]The Advanced RSI Duration (ARSI) is a unique tool crafted to deepen your market insights by focusing on the duration the Relative Strength Index (RSI) spends above or below key thresholds. This innovative approach is designed to help traders anticipate potential market reversals by observing sustained overbought and oversold conditions.
Core Feature
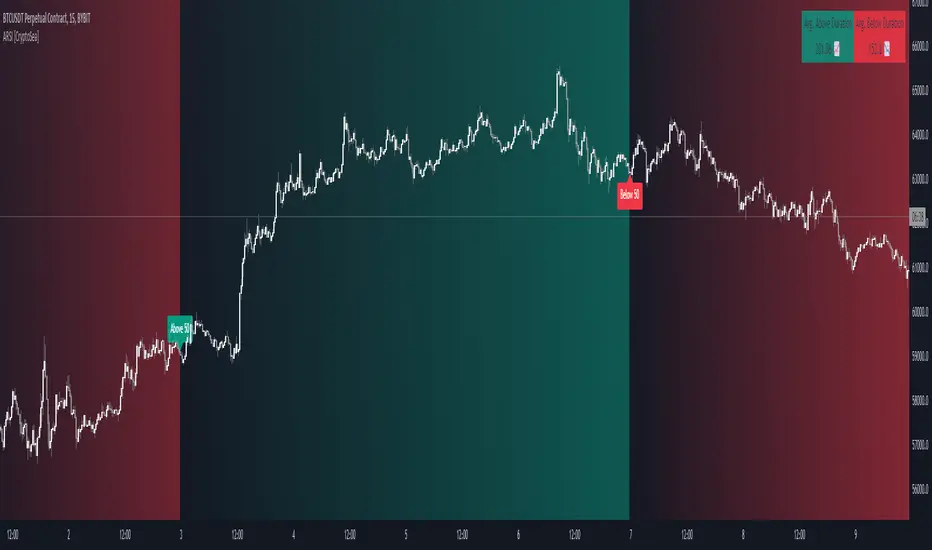
Duration Monitoring ARSI's standout feature is its ability to track how long the RSI remains in overbought (>70) or oversold (<30) conditions. By quantifying these durations, traders can gauge the strength of current market trends and the likelihood of reversals.
Enhanced Functionality
Multi-Timeframe Flexibility : Analyze the RSI duration from any selected timeframe on your current chart, offering a layered view of market dynamics.
Customizable Alerts : Receive notifications when the RSI maintains its position above or below set levels for an extended period, signaling sustained market pressure.
Visual Customization : Adjust the visual elements, including colors for overbought and oversold durations, to match your analytical style and preferences.
Label Management : Control the frequency of labels marking RSI threshold crossings, ensuring clarity and focus on significant market events.
Settings Overview
RSI Timeframe & Length : Tailor the RSI calculation to fit your analysis, choosing from various timeframes and period lengths.
Threshold Levels : Define what you consider overbought and oversold conditions with customizable upper and lower RSI levels.
Duration Alert Threshold : Set a specific bar count for how long the RSI should remain beyond these thresholds to trigger an alert.
Visualization Options : Choose distinct colors for durations above and below thresholds, and adjust label visibility to suit your charting approach.
Application & Strategy
Use ARSI to identify potential turning points in the market
Trend Exhaustion : Extended periods in overbought or oversold territories may indicate a strong trend but also warn of possible exhaustion and impending reversals.
Comparative Analysis : By evaluating the current duration against historical averages, traders can assess the relative strength of ongoing market conditions.
Strategic Entries/Exits : Utilize duration insights to refine entry and exit points, capitalizing on the predictive nature of prolonged RSI levels.
Alert Conditions
The Advanced RSI (ARSI) offers critical alert mechanisms to aid traders in identifying prolonged market conditions that could lead to actionable trading opportunities. These conditions are designed to alert traders when the RSI remains at extremes longer than typical durations, signaling sustained market behaviors.
Above Upper Level Alert: This alert is triggered when the RSI sustains above the upper threshold (usually 70) for more than the configured duration, indicating strong bullish momentum or potential overbought conditions.
Below Lower Level Alert: Similarly, this alert is activated when the RSI stays below the lower threshold (commonly 30) for an extended period, suggesting significant bearish momentum or potential oversold conditions.
These alerts enable traders to respond swiftly to extend market conditions, enhancing their strategy by providing timely insights into potential trend reversals or continuations.
The Advanced RSI Duration Analysis empowers traders with a nuanced understanding of market states, beyond mere RSI values. It highlights the significance of how long markets remain in extreme conditions, offering a predictive edge in anticipating reversals. Whether you're strategizing entries or preparing for shifts in market momentum, ARSI is your companion for informed trading decisions.
Dual RSI Differential - Strategy [presentTrading]█ Introduction and How it is Different
The Dual RSI Differential Strategy introduces a nuanced approach to market analysis and trading decisions by utilizing two Relative Strength Index (RSI) indicators calculated over different time periods. Unlike traditional strategies that employ a single RSI and may signal premature or delayed entries, this method leverages the differential between a shorter and a longer RSI. This approach pinpoints more precise entry and exit points, providing a refined tool for traders to exploit market conditions effectively, particularly in overbought and oversold scenarios.
Most important: it is a good eductional code for swing trading.
For beginners, this Pine Script provides a complete function that includes crucial elements such as holding days and the option to configure take profit/stop loss settings:
- Hold Days: This feature ensures that trades are not exited too hastily, helping traders to ride out short-term market volatility. It's particularly valuable for swing trading where maintaining positions slightly longer can lead to capturing significant trends.
- TPSL Condition (None by default): This setting allows traders to focus solely on the strategy's robust entry and exit signals without being constrained by preset profit or loss limits. This flexibility is crucial for learning to adjust strategy settings based on personal risk tolerance and market observations.
BTCUSD 6h LS Performance
█ Strategy, How It Works: Detailed Explanation
🔶 RSI Calculation:
The RSI is a momentum oscillator that measures the speed and change of price movements. It is calculated using the formula:
RSI = 100 - (100 / (1 + RS))
Where RS (Relative Strength) = Average Gain of up periods / Average Loss of down periods.
🔶 Dual RSI Setup:
This strategy involves two RSI indicators:
RSI_Short (RSI_21): Calculated over a short period (21 days).
RSI_Long (RSI_42): Calculated over a longer period (42 days).
Differential Calculation:
The strategy focuses on the differential between these two RSIs:
RSI Differential = RSI_Long - RSI_Short
This differential helps to identify when the shorter-term sentiment diverges from longer-term trends, signaling potential trading opportunities.
BTCUSD Local picuture
🔶 Signal Triggers:
Entry Signal: A buy (long) signal is triggered when the RSI Differential exceeds -5, suggesting strengthening short-term momentum. Conversely, a sell (short) signal occurs when the RSI Differential falls below +5, indicating weakening short-term momentum.
Exit Signal: Trades are generally exited when the RSI Differential reverses past these thresholds, indicating a potential momentum shift.
█ Trade Direction
This strategy accommodates various trading preferences by allowing selections among long, short, or both directions, thus enabling traders to capitalize on diverse market movements and volatility.
█ Usage
The Dual RSI Differential Strategy is particularly suited for:
Traders who prefer a systematic approach to capture market trends.
Those who seek to minimize risks associated with rapid and unexpected market movements.
Traders who value strategies that can be finely tuned to different market conditions.
█ Default Settings
- Trading Direction: Both — allows capturing of upward and downward market movements.
- Short RSI Period: 21 days — balances sensitivity to market movements.
- Long RSI Period: 42 days — smoothens out longer-term fluctuations to provide a clearer market trend.
- RSI Difference Level: 5 — minimizes false signals by setting a moderate threshold for action.
Use Hold Days: True — introduces a temporal element to trading strategy, holding positions to potentially enhance outcomes.
- Hold Days: 5 — ensures that trades are not exited too hastily, helping to ride out short-term volatility.
- TPSL Condition: None — enables traders to focus solely on the strategy's entry and exit signals without preset profit or loss limits.
- Take Profit Percentage: 15% — aims for significant market moves to lock in profits.
- Stop Loss Percentage: 10% — safeguards against large losses, essential for long-term capital preservation.

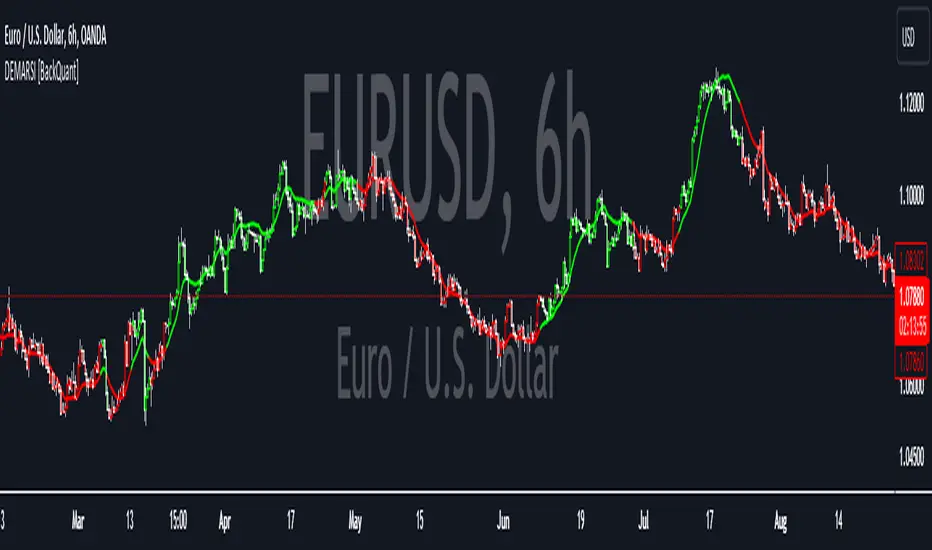
DEMA RSI Overlay [BackQuant]DEMA RSI Overlay
PLEASE Read the following, knowing what an indicator does at its core before adding it into a system is pivotal. The core concepts can allow you to include it in a logical and sound manner.
Anyways,
BackQuant's new trading indicator that blends the Double Exponential Moving Average (DEMA) with the Relative Strength Index (RSI) to create a unique overlay on the trading chart. This combination is not arbitrary; both the DEMA and RSI are revered for their distinct advantages in trading strategy development. Let's delve into the core components of this script, the rationale behind choosing DEMA and RSI, the logic of long and short signals, and its practical trading applications.
Understanding DEMA
DEMA is an enhanced version of the conventional exponential moving average that aims to reduce the lag inherent in traditional averages. It does this by applying more weight to recent prices. The reduction in lag makes DEMA an excellent tool for tracking price trends more closely. In the context of this script, DEMA serves as the foundation for the RSI calculation, offering a smoother and more responsive signal line that can provide clearer trend indications.
Why DEMA?
DEMA is chosen for its responsiveness to price changes. This characteristic is particularly beneficial in fast-moving markets where entering and exiting positions quickly is crucial. By using DEMA as the price source, the script ensures that the signals generated are timely and reflective of the current market conditions, reducing the risk of entering or exiting a trade based on outdated information.
Integrating RSI
The RSI, a momentum oscillator, measures the speed and change of price movements. It oscillates between zero and 100 and is typically used to identify overbought or oversold conditions. In this script, the RSI is calculated based on DEMA, which means it inherits the responsiveness of DEMA, allowing traders to spot potential reversals or continuation signals sooner.
Why RSI?
Incorporating RSI offers a measure of price momentum and market conditions relative to past performance. By setting thresholds for long (buy) and short (sell) signals, the script uses RSI to identify potential turning points in the market, providing traders with strategic entry and exit points.
Calculating Long and Short Signals
Long Signals : These are generated when the RSI of the DEMA crosses above the longThreshold (set at 70 by default) and the closing price is not above the upper volatility band. This suggests that the asset is gaining upward momentum while not being excessively overbought, presenting a potentially favorable buying opportunity.
Short Signals : Generated when the RSI of the DEMA falls below the shortThreshold (set at 55 by default). This indicates that the asset may be losing momentum or entering a downtrend, signaling a possible selling or shorting opportunity.
Logical Soundness
The logic of combining DEMA with RSI for generating trade signals is sound for several reasons:
Timeliness : The use of DEMA ensures that the price source for RSI calculation is up-to-date, making the momentum signals more relevant.
Balance : By setting distinct thresholds for long and short signals, the script balances sensitivity and specificity, aiming to minimize false signals while capturing genuine market movements.
Adaptability : The inclusion of user inputs for periods and thresholds allows traders to customize the indicator to fit various trading styles and timeframes.
Trading Use-Cases
This DEMA RSI Overlay indicator is versatile and can be applied across different markets and timeframes. Its primary use-cases include:
Trend Following: Traders can use it to identify the start of a new trend or the continuation of an existing trend.
Swing Trading: The indicator's sensitivity to price changes makes it ideal for swing traders looking to capitalize on short to medium-term price movements.
Risk Management: By providing clear long and short signals, it helps traders manage their positions more effectively, potentially reducing the risk of significant losses.
Final Note
We have also decided to add in the option of standard deviation bands, calculated on the DEMA, this can be used as a point of confluence rendering trading ranges. Expanding when volatility is high and compressing when it is low.
For example:
This provides the user with a 1, 2, 3 standard deviation band of the DEMA.
Thus following all of the key points here are some sample backtests on the 1D Chart
Disclaimer: Backtests are based off past results, and are not indicative of the future.
INDEX:BTCUSD
INDEX:ETHUSD
BINANCE:SOLUSD
Kalman Filtered RSI Oscillator [BackQuant]Kalman Filtered RSI Oscillator
The Kalman Filtered RSI Oscillator is BackQuants new free indicator designed for traders seeking an advanced, empirical approach to trend detection and momentum analysis. By integrating the robustness of a Kalman filter with the adaptability of the Relative Strength Index (RSI), this tool offers a sophisticated method to capture market dynamics. This indicator is crafted to provide a clearer, more responsive insight into price trends and momentum shifts, enabling traders to make informed decisions in fast-moving markets.
Core Principles
Kalman Filter Dynamics:
At its core, the Kalman Filtered RSI Oscillator leverages the Kalman filter, renowned for its efficiency in predicting the state of linear dynamic systems amidst uncertainties. By applying it to the RSI calculation, the tool adeptly filters out market noise, offering a smoothed price source that forms the basis for more accurate momentum analysis. The inclusion of customizable parameters like process noise, measurement noise, and filter order allows traders to fine-tune the filter’s sensitivity to market changes, making it a versatile tool for various trading environments.
RSI Adaptation:
The RSI is a widely used momentum oscillator that measures the speed and change of price movements. By integrating the RSI with the Kalman filter, the oscillator not only identifies the prevailing trend but also provides a smoothed representation of momentum. This synergy enhances the indicator's ability to signal potential reversals and trend continuations with a higher degree of reliability.
Advanced Smoothing Techniques:
The indicator further offers an optional smoothing feature for the RSI, employing a selection of moving averages (HMA, THMA, EHMA, SMA, EMA, WMA, TEMA, VWMA) for traders seeking to reduce volatility and refine signal clarity. This advanced smoothing mechanism is pivotal for traders looking to mitigate the effects of short-term price fluctuations on the RSI's accuracy.
Empirical Significance:
Empirically, the Kalman Filtered RSI Oscillator stands out for its dynamic adjustment to market conditions. Unlike static indicators, the Kalman filter continuously updates its estimates based on incoming price data, making it inherently more responsive to new market information. This dynamic adaptation, combined with the RSI's momentum analysis, offers a powerful approach to understanding market trends and momentum with a depth not available in traditional indicators.
Trend Identification and Momentum Analysis:
Traders can use the Kalman Filtered RSI Oscillator to identify strong trends and momentum shifts. The color-coded RSI columns provide immediate visual cues on the market's direction and strength, aiding in quick decision-making.
Optimal for Various Market Conditions:
The flexibility in tuning the Kalman filter parameters makes this indicator suitable for a wide range of assets and market conditions, from volatile to stable markets. Traders can adjust the settings based on empirical testing to find the optimal configuration for their trading strategy.
Complementary to Other Analytical Tools:
While powerful on its own, the Kalman Filtered RSI Oscillator is best used in conjunction with other analytical tools and indicators. Combining it with volume analysis, price action patterns, or other trend-following indicators can provide a comprehensive view of the market, allowing for more nuanced and informed trading decisions.
The Kalman Filtered RSI Oscillator is a groundbreaking tool that marries empirical precision with advanced trend analysis techniques. Its innovative use of the Kalman filter to enhance the RSI's performance offers traders an unparalleled ability to navigate the complexities of modern financial markets. Whether you're a novice looking to refine your trading approach or a seasoned professional seeking advanced analytical tools, the Kalman Filtered RSI Oscillator represents a significant step forward in technical analysis capabilities.
Thus following all of the key points here are some sample backtests on the 1D Chart
Disclaimer: Backtests are based off past results, and are not indicative of the future.
INDEX:BTCUSD
INDEX:ETHUSD
BINANCE:SOLUSD

[The_lurker] RSI-MFI-WPR Indicatoris an advanced trading indicator developed for the TradingView platform, which synergistically refers to the insights of three popular technical analysis tools: the Relative Strength Index (RSI), the Money Flow Index (MFI) and the Williams Indicator. Percentage range (WPR). This indicator is precisely designed to help traders identify potential buy and sell opportunities by accurately interpreting market momentum, volume, and price position relative to recent highs and lows.
The primary goal of the RSI-MFI-WPR Indicator is to provide a comprehensive tool that leverages the combined power of RSI, MFI and WPR to detect overbought and oversold conditions, indicating potential market reversal points. This multi-faceted approach aims to provide traders with a more robust framework for making informed decisions, and enhance their trading strategy through multi-indicator analysis.
Explanation of the indicator conditions
The essence of this indicator lies in its strategic conditions that indicate possible entry and exit points:
Oversold Condition (Condition): This is determined when the RSI and MFI are below 30, and the WPR drops below -91, indicating a strong oversold condition in the market. Such a scenario usually indicates a buying opportunity, assuming that the market may rebound from this oversold state.
Divergence Condition (Condition 1): Checks if the MFI exceeds 2.1 times the RSI. This unique case aims to highlight instances where there is a significant inflow of funds into an asset, which is not proportionately reflected in its RSI, which may indicate an upcoming price increase or highlight an unusual market situation for further From the analysis.
Overbought Warning (conditionExit): An exit signal is triggered when both the MFI and RSI exceed 85, and the WPR is above -15. This combination indicates an overbought condition in the market, indicating that the asset may be overvalued and that a price correction or reversal may be imminent, thus indicating a potential selling opportunity or a warning of initiating new positions.
Application and visualization
The RSI-MFI-WPR Indicator not only provides numerical insights but also displays these conditions on a TradingView chart. Through the use of color coding and plotting, it provides traders with an intuitive way to distinguish market conditions, enabling quick and effective decision-making. Incorporating alert conditions ensures that traders are immediately notified of important market events, in line with their strategic trading objectives.
Planning and alerts in “RSI-MFI-WPR Indicator”
Collected alert status
CombinedAlertCondition is a logical statement that combines all individual conditions (Condition, Condition1, Condition Exit, and The_lurkerMFI_oversold) into a single alert trigger. This condition becomes true and triggers an alert if any of the conditions specified for potential trading opportunities or warnings are met. It is designed to provide a comprehensive alert system that informs the trader of any important signal identified by the indicator, including entry and exit signals as well as oversold conditions.
Visual indicators
Background color for oversold condition: The script sets the background color to a specific shade of blue ( with 90% transparency) when the custom MFI indicates an oversold condition (The_lurkerMFI_oversold). This visual signal helps traders quickly recognize periods when the market may be undervalued and potentially poised for a rebound.
Drawing warning and exit signs:
Entry Signals: For Condition and Condition 1, which identify potential entry points, the indicator draws upward pointing triangles below the price bars. These triangles are colored in specific shades to differentiate signals from a fundamental oversold condition and a divergence condition, making it intuitive for traders to recognize the type of signal.
Exit Signals: For an exit condition, which indicates overbought conditions that may indicate an impending price correction, red downward-pointing triangles are drawn above the price bars. This serves as a clear visual warning to consider exiting positions or proceed with caution.
Configure the alarm
The script uses the conditional alert function to create an alert based on the AlertCondition combination. When this condition is met, any of the predefined signals are indicated
Conclusion
In short, the “RSI-MFI-WPR Indicator” stands out as a versatile and dynamic indicator that enriches a trader's toolkit by combining the analytical strengths of RSI, MFI and WPR. By setting clear conditions for entry and exit points from the market, it facilitates a proactive approach to trading, based on a detailed examination of market dynamics. This indicator demonstrates how mixing multiple technical tools can lead to more informed and accurate market analysis, with the aim of elevating the trading experience on Tradingview.
==================================================================================
هو مؤشر تداول متقدم تم تطويره لمنصة TradingView،
والذي يشير بشكل تآزري إلى رؤى ثلاث أدوات تحليل فني شائعة:
1- مؤشر القوة النسبية (RSI)،
2- مؤشر تدفق الأموال (MFI)،
3- مؤشر ويليامز. نطاق النسبة المئوية (WPR).
تم تصميم هذا المؤشر بدقة لمساعدة المتداولين على تحديد فرص الشراء والبيع المحتملة من خلال التفسير الدقيق لزخم السوق وحجمه وموقع السعر بالنسبة إلى الارتفاعات والانخفاضات الأخيرة.
الهدف الأساسي لمؤشر RSI-MFI-WPR هو توفير أداة شاملة تستفيد من القوة المشتركة لمؤشر RSI وMFI وWPR للكشف عن ظروف ذروة الشراء والمبالغة في البيع، مما يشير إلى نقاط انعكاس السوق المحتملة. ويهدف هذا النهج متعدد الأوجه إلى تزويد المتداولين بإطار أكثر قوة لاتخاذ قرارات مستنيرة، وتعزيز استراتيجية التداول الخاصة بهم من خلال تحليل متعدد المؤشرات.
شرح شروط المؤشر
يكمن جوهر هذا المؤشر في ظروفه الإستراتيجية التي تشير إلى نقاط الدخول والخروج المحتملة:
حالة ذروة البيع (الحالة): يتم تحديد ذلك عندما يكون مؤشر القوة النسبية RSI وMFI أقل من 30، وينخفض WPR إلى أقل من -92، مما يشير إلى حالة ذروة بيع قوية في السوق. يشير مثل هذا السيناريو عادةً إلى فرصة شراء، على افتراض أن السوق قد ينتعش من حالة ذروة البيع هذه.
شرط الاختلاف (الشرط 1): يتحقق مما إذا كانت السيولة تتجاوز 2.1 مرة مؤشر القوة النسبية. تهدف هذه الحالة الفريدة إلى تسليط الضوء على الحالات التي يوجد فيها تدفق كبير للأموال إلى أحد الأصول، وهو ما لا ينعكس بشكل متناسب في مؤشر القوة النسبية الخاص به، مما قد يشير إلى زيادة قادمة في الأسعار أو يسلط الضوء على وضع غير عادي في السوق لمزيد من التحليل.
تحذير ذروة الشراء (conditionExit): يتم إطلاق إشارة خروج عندما يتجاوز مؤشر MFI ومؤشر القوة النسبية 85، ويكون WPR أعلى من -15. يشير هذا المزيج إلى حالة ذروة الشراء في السوق، مما يشير إلى أن الأصل قد يكون مبالغًا في قيمته وأن تصحيح السعر أو انعكاسه قد يكون وشيكًا، مما يشير إلى فرصة بيع محتملة أو تحذير ببدء مراكز جديدة.
التطبيق والتصور
لا يوفر مؤشر RSI-MFI-WPR رؤى رقمية فحسب، بل يعرض أيضًا هذه الشروط على مخطط TradingView. من خلال استخدام الترميز اللوني والتخطيط، فإنه يوفر للمتداولين طريقة بديهية للتمييز بين ظروف السوق، مما يتيح اتخاذ قرارات سريعة وفعالة. يضمن دمج شروط التنبيه إخطار المتداولين على الفور بأحداث السوق المهمة، بما يتماشى مع أهدافهم التجارية الإستراتيجية.
التخطيط والتنبيهات في مؤشر RSI-MFI-WPR
حالة التنبيه التي تم جمعها ( CombinedAlertCondition ) عبارة منطقية تجمع كل الشروط الفردية
Condition، Condition1، Condition Exit، وThe_lurkerMFI_oversold في مشغل تنبيه واحد.
ليصبح هذا الشرط صحيحًا ويطلق تنبيهًا في حالة استيفاء أي من الشروط المحددة لفرص التداول المحتملة أو التحذيرات. وهو مصمم لتوفير نظام تنبيه شامل يُعلم المتداول بأي إشارة مهمة يحددها المؤشر، بما في ذلك إشارات الدخول والخروج بالإضافة إلى ظروف ذروة البيع.
المؤشرات البصرية
لون الخلفية لحالة ذروة البيع: يقوم البرنامج النصي بتعيين لون الخلفية إلى ظل معين من اللون الأزرق (بشفافية 90٪) عندما تشير مؤسسة التمويل الأصغر المخصصة إلى حالة ذروة البيع (The_lurkerMFI_oversold). تساعد هذه الإشارة المرئية المتداولين على التعرف بسرعة على الفترات التي قد تكون فيها السوق مقومة بأقل من قيمتها الحقيقية ومن المحتمل أن تكون مستعدة للانتعاش.
رسم علامات التحذير والخروج:
إشارات الدخول: بالنسبة للحالة والحالة 1، التي تحدد نقاط الدخول المحتملة، يرسم المؤشر مثلثات تشير إلى الأعلى أسفل أشرطة السعر. يتم تلوين هذه المثلثات بظلال محددة لتمييز الإشارات عن حالة ذروة البيع الأساسية وحالة التباعد، مما يجعل من السهل على المتداولين التعرف على نوع الإشارة.
إشارات الخروج: بالنسبة لحالة الخروج، التي تشير إلى ظروف ذروة الشراء التي قد تشير إلى تصحيح وشيك للسعر، يتم رسم مثلثات حمراء تشير إلى الأسفل فوق أشرطة السعر. يعد هذا بمثابة تحذير مرئي واضح للنظر في الخروج من المواقف أو المضي قدمًا بحذر.
تكوين المنبه
يستخدم البرنامج النصي وظيفة التنبيه الشرطي لإنشاء تنبيه بناءً على مجموعة AlertCondition. عند استيفاء هذا الشرط، تتم الإشارة إلى أي من الإشارات المحددة مسبقًا
خاتمة
باختصار، يبرز "مؤشر RSI-MFI-WPR" كمؤشر متعدد الاستخدامات وديناميكي يثري مجموعة أدوات المتداول من خلال الجمع بين نقاط القوة التحليلية لـ RSI وMFI وWPR. ومن خلال وضع شروط واضحة لنقاط الدخول والخروج من السوق، فإنه يسهل اتباع نهج استباقي للتداول، بناءً على فحص تفصيلي لديناميكيات السوق. يوضح هذا المؤشر كيف أن الجمع بين أدوات فنية متعددة يمكن أن يؤدي إلى تحليل سوق أكثر استنارة ودقة، بهدف رفع مستوى تجربة التداول على Tradingview.
==================================================================================
باختصار :
1- ظهور المثلث الاصفر يعني تواجد سيولة كبيره ( مفيد جدا لعملات البومب ) .
2- ظهور المثلث الأبيض يعني وصول الى مستويات تشبع البيع وهي فرصة ممتازه للشراء ( منطقة دخول ).
3- ظهور خط افقي يعني قرب عكس الاتجاه الى أعلى ( منطقة دخول ) .
4- ظهور مثلث أحمر يعني قرب عكس الاتجاه الى أسفل ( منطقة خروج ) .
5- التنبيه يعمل على جميع ما ذكر أعلاه في تنبيه واحد حتى تسهل المراقبة .
6- أفضل فواصل الاستخدام ( 4 ساعات ، 12 ساعه ، يوم ) .

Variety Step RSI w/ Dynamic Zones [Loxx]Variety Step RSI w/ Dynamic Zones is a stepped RSI calculation with Discontinued Signal Lines. This indicator includes 7 types of RSI to choose from. The addition of the Discontinued Signal Lines allows this indicator to better identify momentum shifts in price so traders have better defined long/short signals.
Enhanced Moving Average Calculation with Stepped Moving Average and the Advantages over Regular RSI
Technical analysis plays a crucial role in understanding and predicting market trends. One popular indicator used by traders and analysts is the Relative Strength Index (RSI). However, an enhanced approach called Stepped Moving Average, in combination with the Slow RSI function, offers several advantages over regular RSI calculations.
█ Stepped Moving Average and Moving Averages:
The Stepped Moving Average function serves as a crucial component in the calculation of moving averages. Moving averages smooth out price data over a specific period to identify trends and potential trading signals. By employing the Stepped Moving Average function, traders can enhance the accuracy of moving averages and make more informed decisions.
Stepped Moving Average takes two parameters:
The current RSI value and a size parameter. It computes the next step in the moving average calculation by determining the upper and lower bounds of the moving average range. It accomplishes this by adjusting the values of smax and smin based on the given RSI and size.
Furthermore, Stepped Moving Average introduces the concept of a trend variable. By comparing the previous trend value with the current RSI and the previous upper and lower bounds, it updates the trend accordingly. This feature enables traders to identify potential shifts in market sentiment and make timely adjustments to their trading strategies.
█ Advantages over Regular RSI:
Enhanced Range Boundaries:
The inclusion of size parameters in Stepped Moving Average allows for more precise determination of the upper and lower bounds of the moving average range. This feature provides traders with a clearer understanding of the potential price levels that can influence market behavior. Consequently, it aids in setting more effective entry and exit points for trades.
Improved Trend Identification:
The trend variable in Stepped Moving Average helps traders identify changes in market trends more accurately. By considering the previous trend value and comparing it to the current RSI and previous bounds, Stepped Moving Average captures trend reversals with greater precision. This capability empowers traders to respond swiftly to market shifts and potentially capture more profitable trading opportunities.
Smoother Moving Averages:
Stepped Moving Average's ability to adjust the moving average range bounds based on trend changes and size parameters results in smoother moving averages. Regular RSI calculations may produce jagged or erratic results due to abrupt market movements. Stepped Moving Average mitigates this issue by dynamically adapting the range boundaries, thereby providing traders with more reliable and consistent moving average signals.
Complementary Functionality with Slow RSI:
Stepped Moving Average and Slow RSI function in harmony to provide a comprehensive trading analysis toolkit. While Stepped Moving Average refines the moving average calculation process, Slow RSI offers a more accurate representation of market strength. The combination of these two functions facilitates a deeper understanding of market dynamics and assists traders in making better-informed decisions.
What is a Discontinued Signal Line (DSL)?
Many indicators employ signal lines to more easily identify trends or desired states of the indicator. The concept of a signal line is straightforward: by comparing a value to its smoothed, slightly lagging state, one can determine the current momentum or state.
The Discontinued Signal Line builds on this fundamental idea by extending it: rather than having a single signal line, multiple lines are used based on the indicator's current value.
The "signal" line is calculated as follows:
When a specific level is crossed in the desired direction, the EMA of that value is calculated for the intended signal line.
When that level is crossed in the opposite direction, the previous "signal" line value is "inherited," becoming a sort of level.
This approach combines signal lines and levels, aiming to integrate the advantages of both methods.
In essence, DSL enhances the signal line concept by inheriting the previous signal line's value and converting it into a level.
Extras
-Alerts
-Signals
Related indicators:
Step RSI

@tk · fractal rsi levels█ OVERVIEW
This script is an indicator that helps traders to identify the RSI Levels for multiple fractals wherever the current timeframe is. This script was based on RSI Levels, 20-30 & 70-80 by abdomi indicator, that calculates the Relative Strenght Index levels based on the asset's price and plots it into the chart, creating a "wave" style indicator. The core feature of this indicator is the fractal rays, so trader can visualize each of the oversold and overbought levels of multiple timeframe on the current timeframe that he is on. The indicator will plots multiple rays after the chart bars. indicating where is the oversold and overbought levels for others fractals.
█ MOTIVATION
Since the RSI Levels, 20-30 & 70-80 by abdomi indicator helps a lot to identify the possible price levels when the asset is oversold or overbought, I saw myself drawing multiple horizontal lines on these levels in lower timeframes so, in an uptrend or downtrend, I can try to get a pullback of these trends when the asset reaches oversold or overboght levels. So, I get the idea to make those lines visible in multiple timeframes so I don't need to draw it myself manually anymore.
█ CONCEPT
The trading concept to use this indicator is the concept to make entries on uptrend or downtrend pullbacks when the asset price reaches oversold or overbought levels. But this strategy don't works alone. It needs to be aligned together with others indicators like Exponential Moving Averages, Chart Patterns, Support and Resistance, and so on... Even more confluences that you have, bigger are your chances to increase the probability for a successful trade. So, don't use this indicator alone. Compose a trading strategy and use it to improve your analysis.
█ CUSTOMIZATION
This indicator allows the trader to customize the following settings:
GENERAL
Text size
Changes the font size of the labels to improve accessibility.
Type: string
Options: `tiny`, `small`, `normal`, `large`.
Default: `small`
RSI LEVELS · SETTINGS
Pre-oversold Level
Changes the RSI Level to calculate the "pre-oversold" price level on the chart.
Type: int
Min: 1
Max: 49
Default: 33
Pre-overbought Level
Changes the RSI Level to calculate the "pre-overbought" price level on the chart.
Type: int
Min: 51
Max: 100
Default: 67
Show "Pre-over" Levels
Enables / Disables the pre-oversold and pre-overbought levels on the chart.
Type: bool
Default: true
FRACTAL RAYS · SETTINGS
Length
Changes the base length for the RSI calculation.
Type: int
Min: 1
Default: 14
Source
Changes the base source for the RSI calculation.
Type: float
Default: close
FRACTAL RAYS · STYLE
Ray Color
Changes the color of all fractal rays and its label.
Type: color
Default: color.rgb(187, 74, 207)
Ray Style
Changes the style of all fractal rays.
Type: string
Options: `line.style_solid`, `line.style_dashed`, `line.style_dotted`
Default: line.style_dotted
Ray Length
Changes the length of all fractal rays.
Type: int
Default: 15
FRACTAL RAYS · OVERSOLD
Oversold Level
Changes the base RSI Level for fractal rays calculation.
Type: int
Min: 1
Default: 30
Oversold Prefix
Customizes the fractal ray label with a prefix text.
Type: string
Default: 🚀
Oversold Suffix
Customizes the fractal ray label with a suffix text.
Type: string
Default: (empty)
FRACTAL RAYS · OVERBOUGHT
Overbought Level
Changes the base RSI Level for fractal rays calculation.
Type: int
Min: 1
Default: 70
Overbought Prefix
Customizes the fractal ray label with a prefix text.
Type: string
Default: 🐻
Overbought Suffix
Customizes the fractal ray label with a suffix text.
Type: string
Default: (empty)
FRACTAL RAYS · VISIBILITY RULES
These rules are applied for each of fractal rays so, the traders can choose what timeframes they wants to show the fractal rays for each of it. The rule will be applied as the following condition: `if timeframe != CURRENT_TIMEFRAME and timeframe <= CHOSEN_OPTION`. Actually, the fractal rays are on the chart but, isn't visible because it was applied a transparent color, so it is visually not on the chart to prevent chart's over polution.
LABELS
Show Labels on Price Scale
Shows labels on price scale.
Type: bool
Default: false
Show Price on Fractal Rays
Shows the RSI Level price on each of fractal rays respectively.
Type: bool
Default: false
█ EXTERNAL LIBRARIES
This script uses the `tk` library to calculate RSI Levels. It is a library that contains various functions that helps pine script developers to calculate RSI Levels.
█ FUNCTIONS
The library contains the following functions:
fn_fractalVisibilityRule(string visibilityRule)
Converts the fractal rays timeframe visibility rule label to timestamp int.
Parameters:
visibilityRule: (string) Fractal ray visibility rule label.
Returns: (int) Fractal ray visibility rule timestamp.
fn_requestFractal(string period, expression)
Converts the fractal rays timeframe visibility rule label to timestamp int.
Parameters:
period: (string) Timeframe period for the desired fractal.
expression: (mixed) Security expression that will be applied for calculation.
Returns: (mixed) A result determined by expression.
fn_plotRay(float y, string label, color color, int length)
Plots ray after chart bars for the current time.
Parameters:
period: (string) Timeframe period for the desired fractal.
expression: (mixed) Security expression that will be applied for calculation.
Returns: (void) This function only plots the elements into the chart
fn_plotRsiLevelRay(simple string period, simple int level, color color)
Plots RSI Levels ray after chart bars for the current time.
Parameters:
period: (simple string) Timeframe period.
level: (simple int) Relative Strength Index level.
color: (color) The color of both, ray and label text.
Returns: (void) This function only plots the elements into the chart

D-BoT Alpha 'Short' SMA and RSI StrategyDostlar selamlar,
İşte son derece basit ama etkili ve hızlı, HTF de çok iyi sonuçlar veren bir strateji daha, hepinize bol kazançlar dilerim ...
Nedir, Nasıl Çalışır:
Strateji, iki ana girdiye dayanır: SMA ve RSI. SMA hesaplama aralığı 200 olarak, RSI ise 14 olarak ayarlanmıştır. Bu değerler, kullanıcı tercihlerine veya geriye dönük test sonuçlarına göre ayarlanabilir.
Strateji, iki koşul karşılandığında bir short sinyali oluşturur: RSI değeri, belirlenen bir giriş seviyesini (burada 51 olarak belirlenmiş) aşar ve kapanış fiyatı SMA değerinin altındadır.
Strateji, kısa pozisyonu üç durumda kapatır: Kapanış fiyatı, takip eden durdurma seviyesinden (pozisyon açıldığından beri en düşük kapanış olarak belirlenmiştir) büyükse, RSI değeri belirlenen bir durdurma seviyesini (bu durumda 54) aşarsa veya RSI değeri belirli bir kar al seviyesinin (bu durumda 32) altına düşerse.
Güçlü Yönleri:
İki farklı gösterge (SMA ve RSI) kullanımı, yalnızca birini kullanmaktan daha sağlam bir sinyal sağlayabilir.
Strateji, karları korumaya ve fiyat dalgalanmalarında kayıpları sınırlamaya yardımcı olabilecek bir iz süren durdurma seviyesi içerir.
Script oldukça anlaşılır ve değiştirmesi nispeten kolaydır.
Zayıf Yönleri:
Strateji, hacim, oynaklık veya daha geniş piyasa eğilimleri gibi diğer potansiyel önemli faktörleri göz önünde bulundurmaz.
RSI seviyeleri ve SMA süresi için belirli parametreler sabittir ve tüm piyasa koşulları veya zaman aralıkları için optimal olmayabilir.
Strateji oldukça basittir. Trade maliyetini (kayma veya komisyonlar gibi) hesaba katmaz, bu da trade performansını önemli ölçüde etkileyebilir.
Bu Stratejiyle Nasıl İşlem Yapılır:
Strateji, short işlemler için tasarlanmıştır. RSI, 51'in üzerine çıktığında ve kapanış fiyatı 200 periyotluk SMA'nın altında olduğunda işleme girer. RSI, 54'ün üzerine çıktığında veya 32'nin altına düştüğünde veya fiyat, pozisyon açıldığından beri en düşük kapanış fiyatının üzerine çıktığında işlemi kapatır.
Lütfen Dikkat, bu strateji veya herhangi bir strateji izole bir şekilde kullanılmamalıdır. Tüm bu çalışmalar eğitsel amaçlıdır. Yatırım tavsiyesi içermez.
This script defines a trading strategy based on Simple Moving Average (SMA) and the Relative Strength Index (RSI) indicators. Here's an overview of how it works, along with its strengths and weaknesses, and how to trade using this strategy:
How it works:
The strategy involves two key inputs: SMA and RSI. The SMA length is set to 200, and the RSI length is set to 14. These values can be adjusted based on user preferences or back-testing results.
The strategy generates a short signal when two conditions are met: The RSI value crosses over a defined entry level (set at 51 here), and the closing price is below the SMA value.
When a short signal is generated, the strategy opens a short position.
The strategy closes the short position under three conditions: If the close price is greater than the trailing stop (which is set as the lowest close since the position opened), if the RSI value exceeds a defined stop level (54 in this case), or if the RSI value drops below a certain take-profit level (32 in this case).
Strengths:
The use of two different indicators (SMA and RSI) can provide a more robust signal than using just one.
The strategy includes a trailing stop, which can help to protect profits and limit losses as the price fluctuates.
The script is straightforward and relatively easy to understand and modify.
Weaknesses:
The strategy doesn't consider other potentially important factors, such as volume, volatility, or broader market trends.
The specific parameters for the RSI levels and SMA length are hard-coded, and may not be optimal for all market conditions or timeframes.
The strategy is very simplistic. It doesn't take into account the cost of trading (like slippage or commissions), which can significantly impact trading performance.
How to trade with this strategy:
The strategy is designed for short trades. It enters a trade when the RSI crosses above 51 and the closing price is below the 200-period SMA. It will exit the trade when the RSI goes above 54 or falls below 32, or when the price rises above the lowest closing price since the position was opened.
Please note, this strategy or any strategy should not be used in isolation. It's important to consider other aspects of trading such as risk management, capital allocation, and combining different strategies to diversify. Back-testing the strategy on historical data and demo trading before going live is also a recommended practice.

D-Bot Alpha RSI Breakout StrategyHello dear Traders,
Here is a simple yet effective strategy to use, for best profit higher time frame, such as daily.
Structure of the code
The code defines inputs for SMA (simple moving average) length, RSI (relative strength index) length, RSI entry level, RSI stop loss level, and RSI take profit level. The default values of these variables can be customized as per the user's preferences.
The script calculates SMA and RSI based on the input parameters and the closing price of the asset.
Trading logic
This strategy allows the placement of a long position when:
The RSI crosses above the RSI entry level and
The close price is above the SMA value.
After entering a long position, it applies a trailing stop mechanism. The stop price is updated to the close price if the close price is lower than the last close price.
The script closes the long position when:
RSI falls below the stop loss level.
RSI reaches or exceeds the take profit level.
If the trailing stop is activated (once RSI reaches or exceeds the take profit level), the closing price falls below the trailing stop level.
Strengths
The strategy includes mechanisms for entering a position, taking profit, and stopping losses, which are fundamental aspects of a trading strategy.
It applies a trailing stop mechanism that allows to capture further gains if the price keeps increasing while protecting from losses if the price starts to decrease.
Weaknesses
This strategy only contemplates long positions. Depending on the market situation, the strategy may miss opportunities for short selling when the market is on a downward trend.
The choice of the fixed RSI entry, stop loss, and take profit levels may not be ideal for all market conditions or assets. It might benefit from a more adaptive mechanism that adjusts these levels according to market volatility or trend.
The strategy doesn't factor in trading costs (such as spread or commission), which could have a significant impact on the net profit, especially if the user is trading with a high frequency or in a low liquidity market.
How to trade with this strategy
Given these parameters and the strategy outlined by the code, the trader would enter a long position when the RSI crosses above the RSI entry level (default 34) and the closing price is above the SMA value (SMA calculated with default period of 200). The trader would exit the position when either the RSI falls below the RSI stop loss level (default 30), or RSI rises above the RSI take profit level (default 50), or when the trailing stop is hit.
Remember "The strategies I have prepared are entirely for educational purposes and should not be considered as investment advice. Support your trades using other tools. Wishing everyone profitable trades..."

Advanced RSI with Volatility Bands [RedWhite]English - Introduction
This indicator uses a standard RSI of 14 periods, however, instead of using static lines of 70 and 30 to identify overbought and oversold zones, a moving average band is added, similar to the Bollinger Bands indicator.
Español - Introducción
Este indicador utiliza un RSI estándar de 14 períodos, sin embargo, en lugar de utilizar líneas estáticas de 70 y 30 para identificar las zonas de sobrecompra y sobreventa, se agrega una banda de medias móviles similar al indicador de las Bandas de Bollinger.
English - Calculation
The moving average band is constructed by calculating a moving average (default of 70 periods) on the standard RSI of 14 periods. From this average, volatility bands are applied, drawing an upper and lower band by using a standard deviation (default of 1).
Español - Cálculo
La banda de medias móviles se construye calculando una media móvil (por defecto de 70 períodos) sobre el RSI estándar de 14 períodos. A partir de esta media, se aplican bandas de volatilidad, dibujando así una banda superior e inferior mediante el uso de una desviación estándar (por defecto de 1).
English - Interpretation
When the RSI surpasses the upper band, the chart's background is shaded by default (green) to signal a possible overbought situation. On the other hand, when the RSI surpasses the lower band, the chart's background is shaded by default (red) to signal a possible oversold situation. The indicator can be customized in terms of period length, moving average values, and standard deviations. In addition, background colors can be adjusted according to the user's preferences.
Español - Interpretación
Cuando el RSI supera la banda superior, el fondo del gráfico se sombra de un color por defecto (verde) para señalar una posible situación de sobrecompra. Por otro lado, cuando el RSI supera la banda inferior, el fondo del gráfico se sombrea de un color por defecto (rojo) para señalar una posible situación de sobreventa. El indicador se puede personalizar en cuanto a la longitud de los períodos, los valores de la media móvil y las desviaciones estándar. Además, los colores del fondo se pueden ajustar según las preferencias del usuario.
English - Conclusion
By incorporating moving average bands, the indicator can provide more precise signals that are adjusted to changing market conditions. Additionally, the function of coloring the background can help traders visualize overbought and oversold zones clearly and make informed decisions accordingly. It is important to note that this indicator is not infallible and should be used in conjunction with other indicators and market analysis to make informed trading decisions.
Español - Conclusión
Al incorporar bandas de medias móviles, el indicador puede proporcionar señales más precisas ajustadas a las condiciones cambiantes del mercado. Además, la función de colorear el fondo puede ayudar a los traders a visualizar claramente las zonas de sobrecompra y sobreventa y tomar decisiones informadas en consecuencia. Es importante tener en cuenta que este indicador no es infalible y debe ser utilizado junto con otros indicadores y análisis del mercado para tomar decisiones de trading informadas.
English: For comparison purposes, the standard 14-period RSI is presented above, and below it, the standard 14-period RSI with volatility bands is shown.
Español: Con fines comparativos, se presenta el RSI estándar de 14 períodos arriba, y debajo se muestra el RSI estándar de 14 períodos con bandas de volatilidad.
English: RSI of 14 periods with a band of moving averages of 70 periods and a standard deviation with a value of 1
Español: RSI de 14 periodos con una banda de medias móviles de 70 periodos y una desviación estándar con un valor de 1
English: RSI of 14 periods with a band of moving averages of 70 periods and a standard deviation with a value of 0
Español: RSI de 14 periodos con una banda de medias móviles de 70 periodos y una desviación estándar con un valor de 0
English - Note
This indicator is inspired by Blai5's "Advanced RSI".
Español- Nota
Este indicador está inspirado en el "RSI Avanzado" de Blai5.