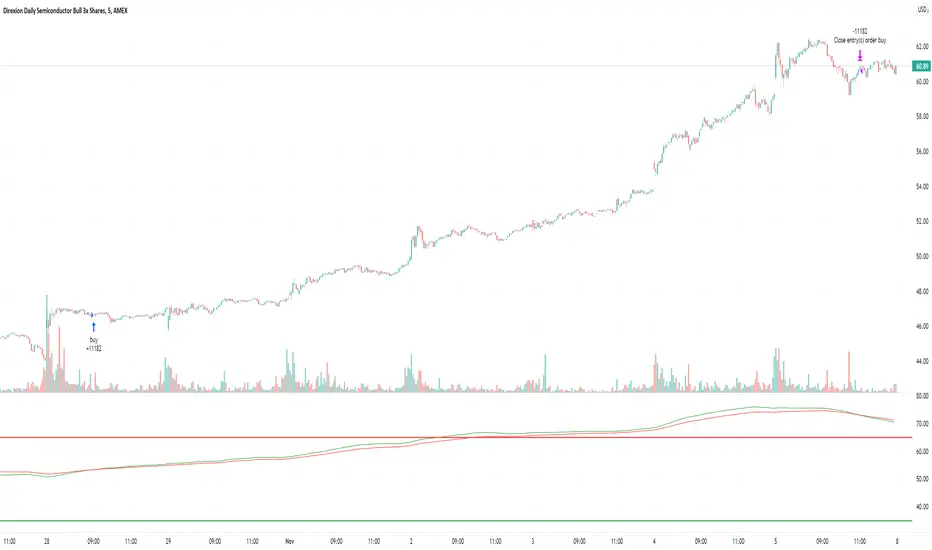
RSI Average Swing BotThis is a modified RSI version using as a source a big length(50 candles) and an average of all types of sources for candle calculations such as ohlc4, close, high, open, hlc3 and hl2.
In this case we are going to use a 0-1 scale for an easier calculation, where 0.5 is going to be our middle point.
Above 0.5 we consider a bullish possibility.
Below 0.5 we consider a bearish possibility.
I made a small example bot using that initial logic, together with 2 exit points for long or short positions.
If there are any questions, let me know !
"rsi" için komut dosyalarını ara

RSI multitimeframe SMA crossoverStrategy based on the multi timeframe equally weighted RSI moving averages turned into single average and then cross of the 2 combined outputs, seems to be promising, default settings work good on 5m chart(better entry) but very filtered trade amount. If you want to use it on different timeframes be my guest and mess with adjustments, pretty much every aspect of strategy is adjustable, idea is same. If somebody liked the idea and able to improve it - share with me :)
RSI Centered PivotsJust a simple RSI central pivot strategy I made for a friend.
Backtested on BYBIT:BTCUSD, 155m.
DISCLAIMER : Please do your own research into anything you use before using it to trade.

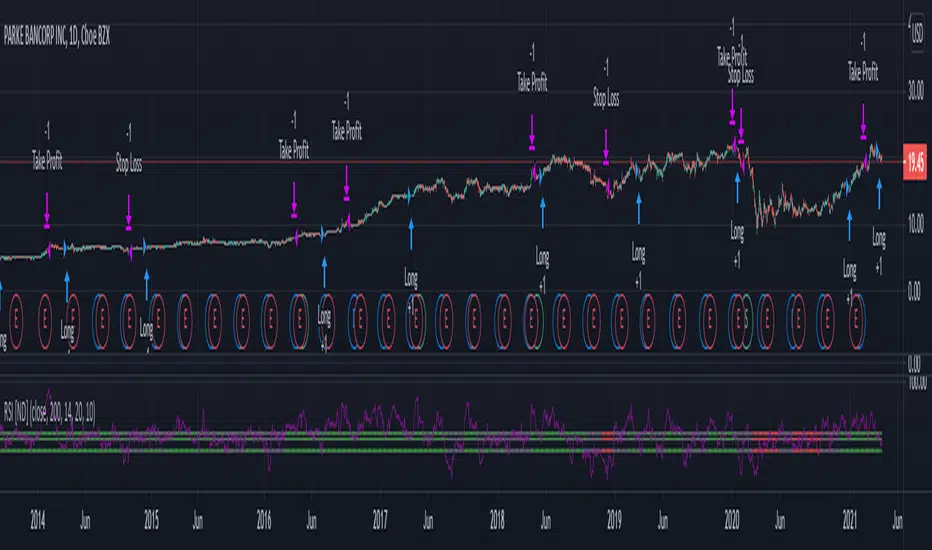
RSI Strategy [Nostradanis]Strategy based on an adaptation of the Relative Strength Index and slow exponential moving average.
Green lines: uptrend
Gray lines: lateral trend
Red Lines: downtrend
Use:
When RSI crosses up 40 and 50 lines can be a good long entry if ema trend is clearly bullish.
55 line confirms entry.
Designed for swing with under $20 shares but can be adapted to scalping
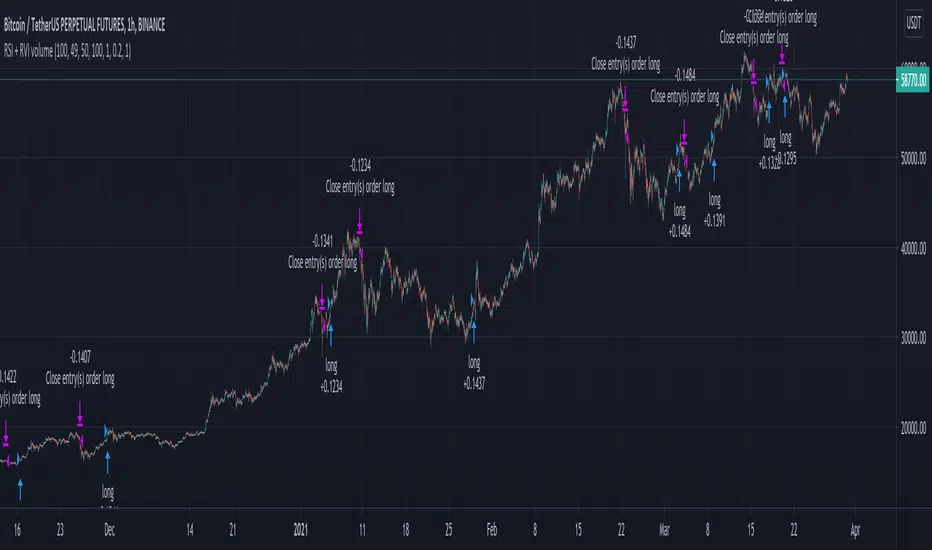
RSI and RVI on volume crypto BTC This strategy combine special version of RSI and RVI , where in this case , I am using the volume , for measuring the speed and change of volume to the price both up and down size together with the volatility spikes.
In this case instead of looking at the volume or volatility, I am combining them into one oscillator.
For best usage, I believe a big length of candles like 100 can get better results, and use it in this way as a lagging indicator.
Since most of the tests I made for futures, I applied a risk management in % of the price movement. For stop loss we have 20% while for TP, 100%. However in both cases, we will exit sooner, and thats going to be when condition from the oscillator says so.
For this we have a middle level, 50, which will act as both overbought and oversold areas.
At the same time I apply the posibility of using leverage into size calculations for more precise tests and try to get min-max out of it.
If you have any questions, please let me know !
RSI w MA StrategyThis strategy is mostly for cryptocurrencies, it applies a moving average to an rsi and trades based on the crossings. It includes the indicator that it is made from.

RSI 75/25 SignalThis momentum-based script prints long and short signals according to the 14 candle RSI average. When it crosses over 75, the market is bullish and as such, a trader should look for long based trades. When it crosses under 25, a trader should focus on shorts. This indicator works best on high timeframes such as 4hour and 1day.

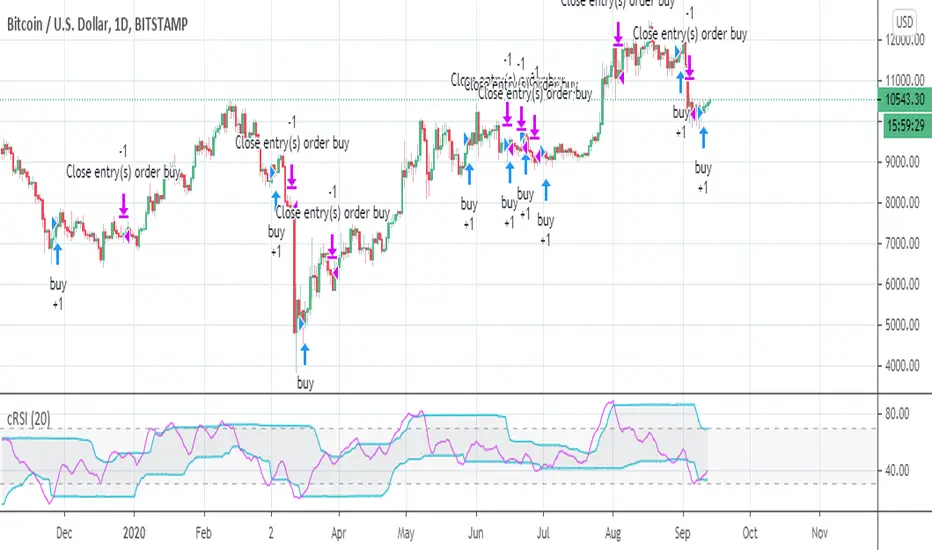
RSI cyclic smoothed strategy backtestI added a few lines of code to "when to trade"'s code to see that backtest result of "RSI cyclic smoothed v2".
RSI+MA_Scalping_StrategyOANDA:USDJPY
This strategy is based on Larry Connors' 2-period RSI strategy. I applied this for scalping(5Minutes) in the forex market based on his strategy.
Best use for YEN Crosses (High liquidity) trading such as USD/JPY and EUR/JPY.
Notes:
1. This strategy doesn't work well if volatility is low.
2. Don't go against Long-term trends. This strategy has practically no stop loss during rapid trends, so if going against trends can be devastating.(Especially GBP/JPY)
3. Don't martingale trading with this strategy. Based on my research, At first glance, it seems to work, but lose in the long run.

RSI-VWAP INDICATORThis simple indicator provides great results.
It is the popular RSI indicator with VWAP as a source instead of close.
What is the Volume Weighted Average Price (VWAP)?
VWAP is calculated by adding up the dollars traded for every transaction (price multiplied by the number of shares traded) and then dividing by the total shares traded. That is, volume.
On the Backtest, trades are laddered to improve the average entrance price.

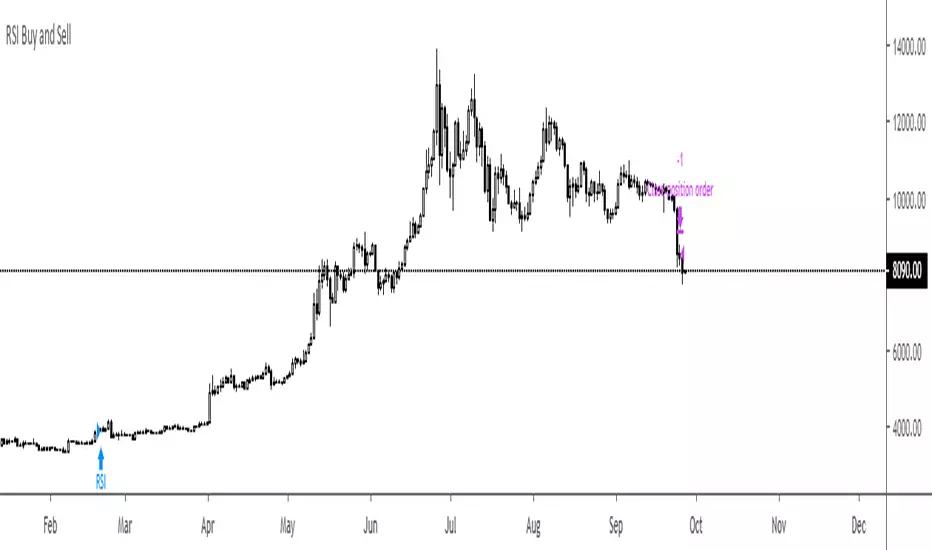
RSI Buy and SellThis is sooooooooo simple.
Buy when RSI is above 70 and don't sell til it'sunder 30.
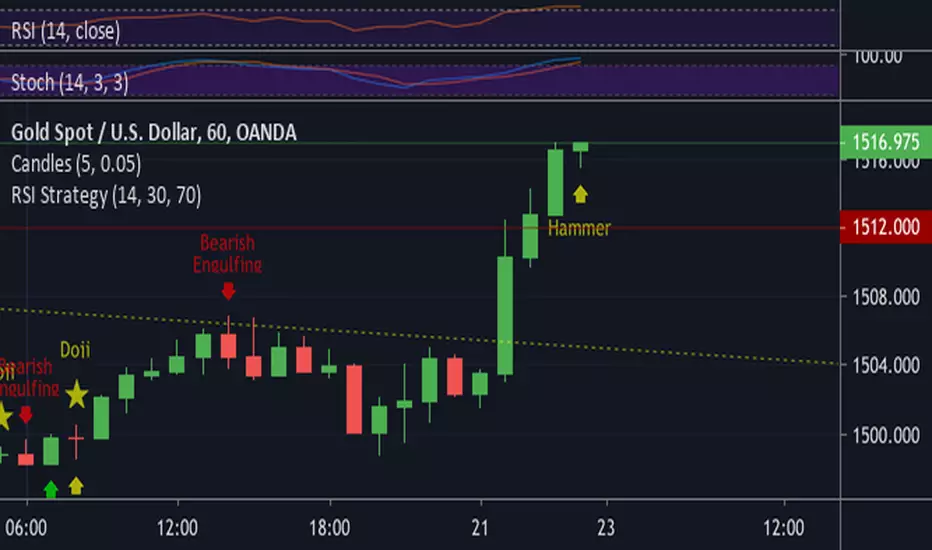
RSI StrategyNothing special in this strategy its just purely and application of RSI in 1hour chart of XAUUSD.
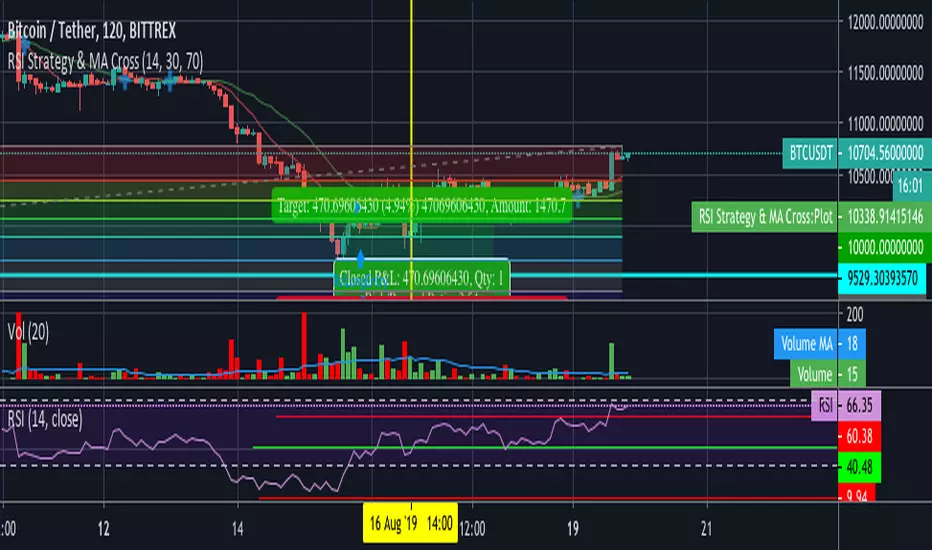
RSI Strategy & MA CrossCombination of two strategy.
MA Cross strategy is using 2 sma at 9 & 21. It can be configured through the source code.
RSI strategy to decide whether the stock/crypto is currently overbought/oversold.
Useful for quick entry and exit trade.
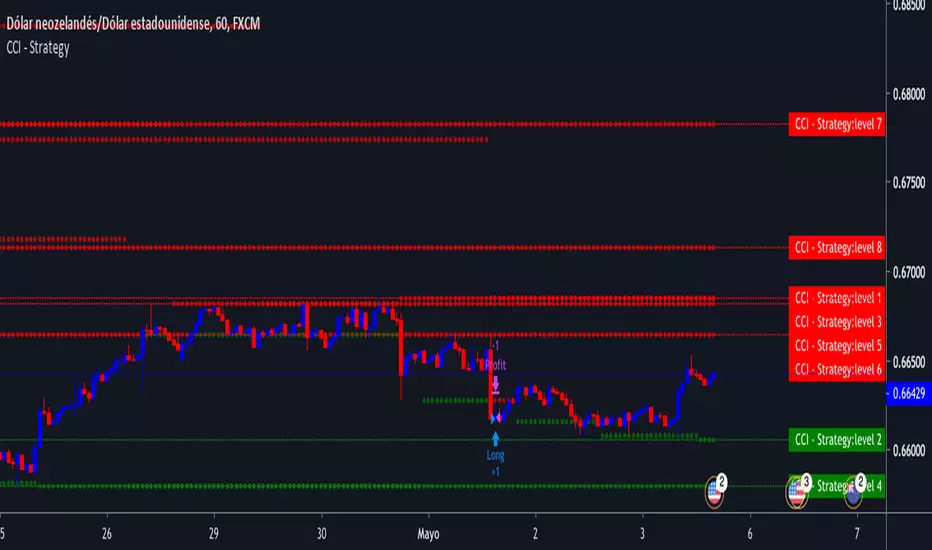
RSI-Stoch-CCI with S/RThe script works with RSI and Stoch to make sure the price is oversold or overbought, but also use CCI to identify the cyclical trends. If the price is on support or resistance and the indicators are oversold or overbought and alert there's an option to buy or sell.

RSI EMA Strategy 15M+// Strategy based on Relative Strength Index (RSI) and Exponential Moving Average (EMA)
// Greatest effect on 15M+ time frame
// Created and based on Binance chart
// Working with comission
// No repaints

RSI Trade Emulting for ProfitYou can get your profit with easy RSI indicator and can also add stop loss rate.

RSI + BOLLINGER, Long-Short v1.3Custom RSI + BOLLINGER settings to capture profits. Switch to bullish or short trades.


Rsi + channelCombination with rsi + price channel. Good approach to robot trading. The best time frame 1H leverage up to 5. I use the script for trading with own robot development. Only for bitmex XBT/USD and rebate will be as bonus 0.025)

