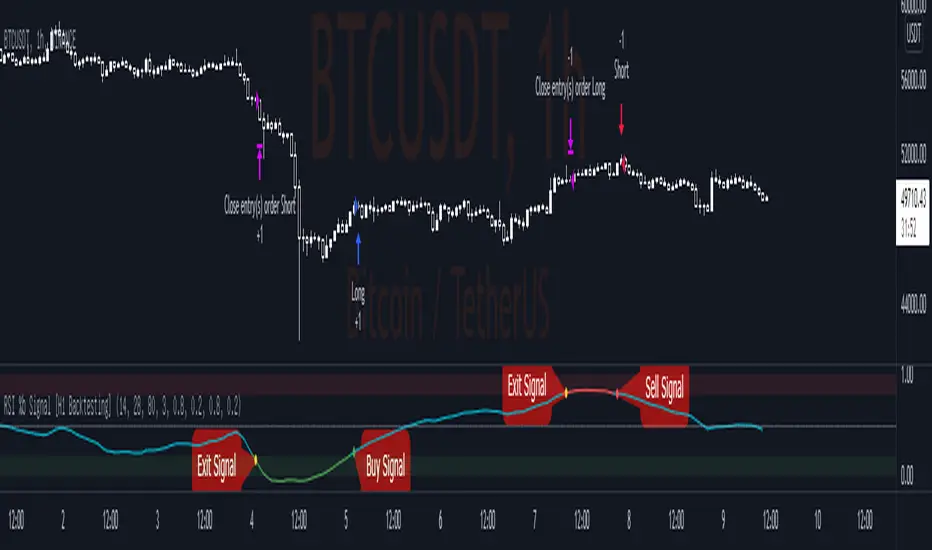
RSI %b Signal [H1 Backtesting]-----------------------------------------------------------------
This simple strategy base on RSI, EMA, Bollinger Bands to get Buy and Sell Signal with detail as below:
-----------------------------------------------------------------
1.Define Oscillator Line
+ Oscillator Line is smoothed by ema(28) of RSI(14) on H1 Timeframe
2.Define Overbought and Oversold
+ Apply Bollinger Bands BB(80,3) on Oscillator Line and calculate %b
+ Overbought Zone marked above level 0.8
+ Oversold Zone marked below level 0.2
3.Buy Signal
+ Entry Long Position when %b crossover Point of Entry Long
+ Deafault Point of Entry Long is 0.2
+ Buy signal marked by Green dot
4.Sell Signal
+ Entry Short Position when %b crossunder Point of Entry Short
+ Deafault Point of Entry Short is 0.8
+ Sell signal marked by Red dot
5.Exit Signal
+ Exit Position (both Long and Short) when %b go into Overbought Zone or Oversold Zone
+ Exit signal marked by Yellow dot
-----------------------------------------------------------------
"rsi" için komut dosyalarını ara
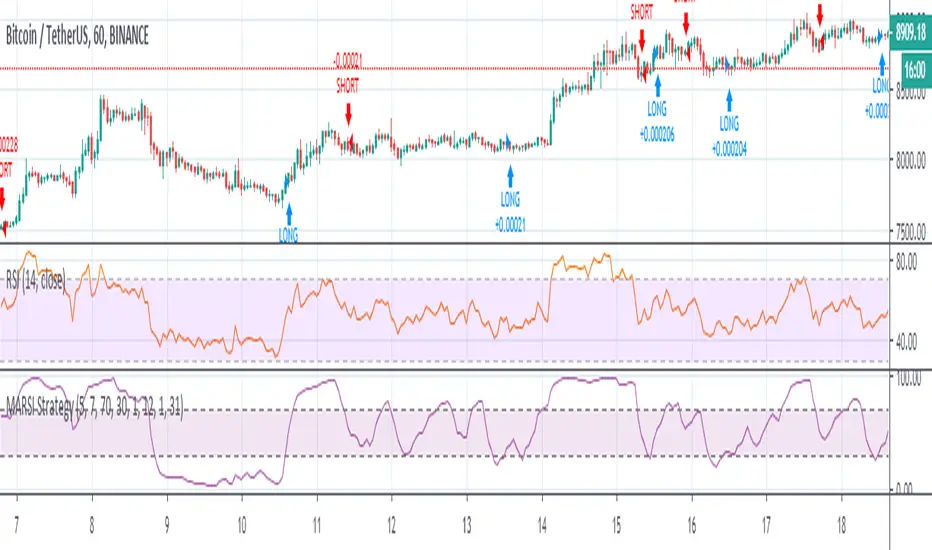
RSI & SMA Strategy By DenizIntroduction
It has always been a major challenge to detect the current market price in technical analysis . There are some basic but strong indicators that help us to estimate the next market action. Relative Strength Index and Simple Moving Average indicators were used in this strategy.
This strategy aims to detect the next market action with different calculations & usages of RSI and SMA indicators.
Strategy Features
As per the result of the calculation from RSI and SMA outputs the strategy will decide to go "Long" or "Short" if the directions are changed from long to short the trade will be closed and it's opening new trade as per to the new direction.
Apart from basic "take profit" and "stop" options there is an additional closing trade option named "Long/Short Bar Count". If the trade could not reach the target in a certain period, it will look for a quit with a 0 loss.
Advantages
Informative alarm messages.
High ratio of Profitable trade numbers.
Disadvantages
Less trade count.

RSI Overbought Oversold Divergence Strategy w/ Buy/Sell SignalsThis indicator is a copy of my RSI Overbought/Oversold Divergence Indicator with-Alerts
Only difference is that the alerts are disabled, instead it uses tradingviews strategy tester signals
If you want alerts just use the other indicator

RSI Cross [xaurr]This is simple but profitable rsi cross strategy, to find optimal values you can change rsi and ema periods.
Good Luck!

RSI OverTrend Strategy (by Marcoweb) v1.0Hi guys, just adapted the CCI Level zero Strategy with the Over Bought and Over Sold levels provided by the Relative Strength Index. The strat is opening a long position at RSI Oversold 30 Level closing it at RSI Overbought 70 Level flipping the position.
Enjoy :D

RSI-VWAP Indicator %█ OVERALL
Simple and effective script that, as you already know, uses vwap as source of the rsi, and with good results as long as the market has no long-term downtrend.
RsiVwap = rsi (vwap (close), Length)
The default settings are for BTC in a 30 minute time frame. For other pairs and time frames you just have to play with the settings.
█ FEATURES
• The option to start trading from a certain date has been added.
• To make the profit more progressive, a percentage of your equity is used for entries and a percentage of your position is used for closings.
• The option to trade in Spot mode has been added, since, for the TradingView backtest, the money is infinite and if you do not limit it somehow,
it would offer you much better profits than the live trading.
QuantityOnLong = Spot ? (EquityPercent / 100) * ((strategy.equity / close) - strategy.position_size) : (EquityPercent / 100) * (strategy.equity / close)
• The option to stop the system when the drawdown exceeds the fixed limit has been added.
Drawdown, as you already know, is a very important measure of risk in trading systems.
The maximum drawdown will tell us what the maximum loss of a trading system has been during a period. This maximum loss is determined by:
strategy.risk.max_drawdown(Risk, strategy.percent_of_equity)
• Leverage plotted on labels added.
█ ALERTS
To enjoy the benefits of automatic trading, TradingView alerts can be used as direct buy-sell orders on spot, or long-close orders with leverage.
Currently there are Chrome extensions that act as a bridge between TradingView and your Exchange or Broker.
This is an example of syntax for this type of extensions. Copy and paste a message like this into the alert window:
{{strategy.order.action}} @ {{strategy.order.price}} | e = {{exchange}} a = account s = {{ticker}} b = {{strategy.order.action}} {{strategy.order.alert_message}}
█ NOTE
Certain Risks of Live Algorithmic Trading You Should Know:
• Backtesting cannot assure actual results.
• The relevant market might fail or behave unexpectedly.
• Your broker may experience failures in its infrastructure, fail to execute your orders in a correct or timely fashion or reject your orders.
• The system you use for generating trading orders, communicating those orders to your broker, and receiving queries and trading results from your broker may fail.
• Time lag at various point in live trading might cause unexpected behavior.
• The systems of third parties in addition to those of the provider from which we obtain various services, your broker, and the applicable securities market may fail or malfunction.
█ THANKS
Thanks to TradingView, its Pine code, its community and especially those Pine wizards who post their ideas that helps us to learn.
If the world is heading toward a equitable new world economic order, let's get rich first ...
Happy trading!

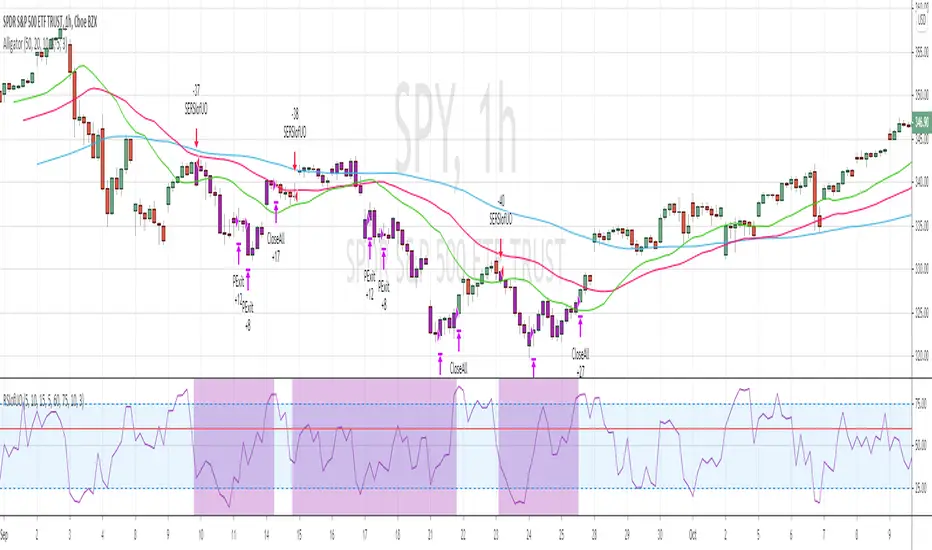
RSI of Ultimate Oscillator [SHORT Selling] StrategyThis is SHORT selling strategy with Ultimate Oscillator. Instead of drectly using the UO oscillator , I have used RSI on UO (as I did in my previous strategies )
Ultimator Oscillator settings are 5, 10 and 15
RSI of UO setting is 5
Short Sell
==========
I have used moving averages from WilliamAlligator indicator --- settings are 10(Lips), 20(teeth) and 50 (Jaw)
when Lips , Teeth and Jaw are aligned to downtrend (that means Lips < Teeth < Jaw )
Look for RSIofUO dropping below 60 ( setting parameter is Sell Line )
Partial Exit
==========
When RSIofUO crossing up Oversold line i.e 30
Cover Short / Exit
=================
When RSIofUO crosisng above overbought line i.e 70
StopLoss
========
StopLoss defaulted to 3 % , Though it is mentioned in settings , it has not been not used to calcuate and StopLoss Exit... Reason is, when RSIofUO already crossed 60 line (for SHORTING) , then it would take more efforts go up beynd 60. There is saying price takes stairs to climb up but it takes elevator to go down. I have not purely depend on this to exit stop loss, however noticed the trades in this stratgey did not get out with loss higher than when RSIofUO reaching 70 level.
Note
======
Williams Alligator is not drawn from the script. It is manually added to chart for illustration purpose. Please add it when you are using this strategy , whch woould give an idea how the strategy is taking Short Trades.
This is tested on Hourly chart for SPY
Bar color changes to purple when the strategy is in SHORT trade
Warning
========
For the eductional purposes only
RSI + BB Scalping StrategyThis strategy uses the RSI indicator and the Bollinger Bands to identify trade entries while using the ATR to determine stop-losses. The strategy only triggers when both the RSI and Bollinger Band indicators are both either overbought or oversold.
This indicator is free to use. Trade at your own risk.

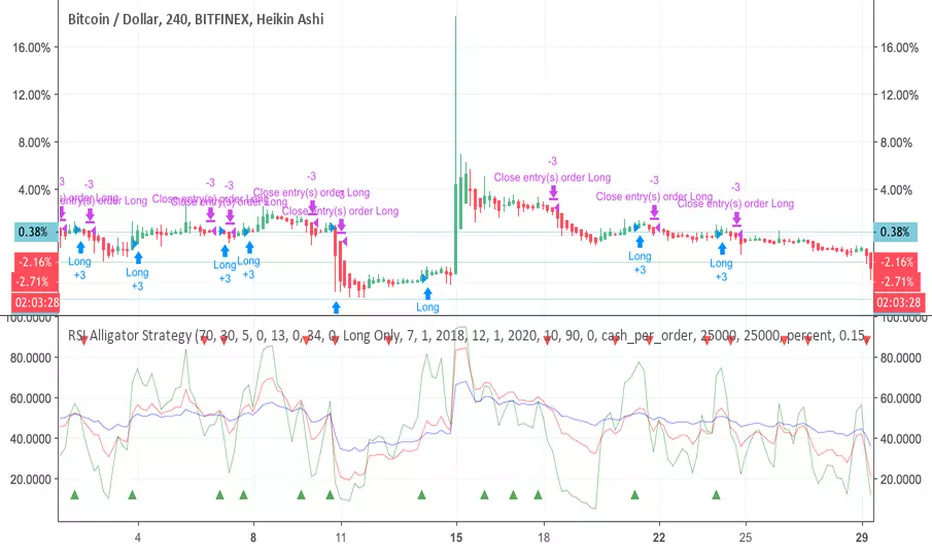
RSI Alligator StrategyHello trading family! Just wanted to give a quick write up and share the new code for the RSI Alligator Strategy. I amended it to show every crossover signal, weak and strong, so we can accurately gauge its effectiveness.
Having played with this for a couple hours now I have learned a few things
-Using Heikin Ashi seems to smooth it out a bit and provides about 20% fewer signals, leading to overall more accuracy. However, it can be misleading as the Heikin Ashi opening price doesn't always line up with the market price, especially in cases of large moves. Overall though it didn't seem too far off except for a few instances.
-Also, using the Heikin Ashi gives you a better idea of the trend, which this indicator is primarily used to detect and exploit.
-Having tested on TF of 1H-1D, overall profitability is found to be highest between 4H-12H, with 1D giving the "safest" longer term signals, and lower TF's generating many more signals due to volatility.
-Instead of waiting for the next signal in order to close, you can often use a crossover/crossunder of the 5 and 13 to close the previous trade, especially if paired with a Heikin Ashi of opposite color (green to close a short, red to close a long)
-You will also notice several instances where the Green 5 period show divergences that aren't visible on the regular RSI, another handy little feature
So far I have still only tested this on BTCUSD. Feel free to apply it to any coin and let me know what you find.
Here is the script. If you have any ideas or suggestions please let me know!
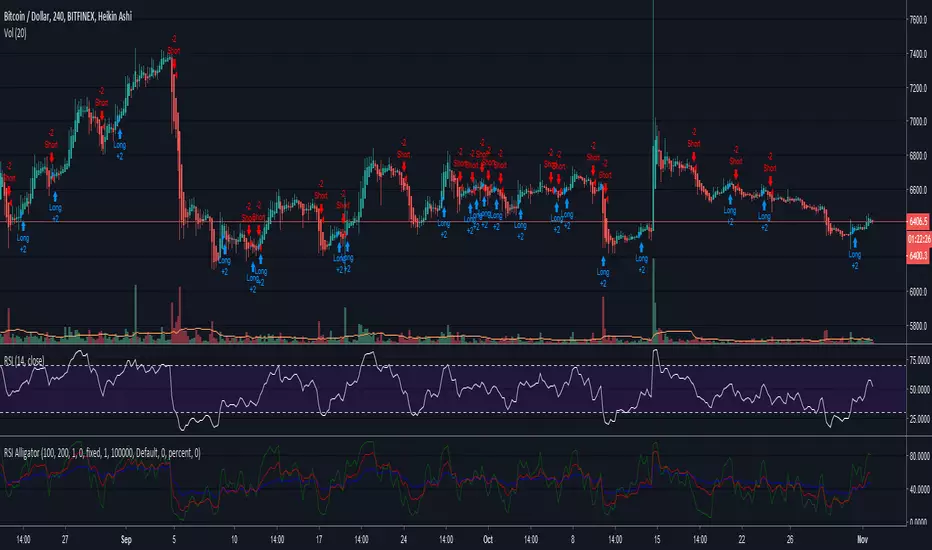
RSI Alligator Strategy [forked from jedireza]Backtester for RSI alligator is Williams Alligator strategy using Relative Strength Index to predict entries
Original script can be found at
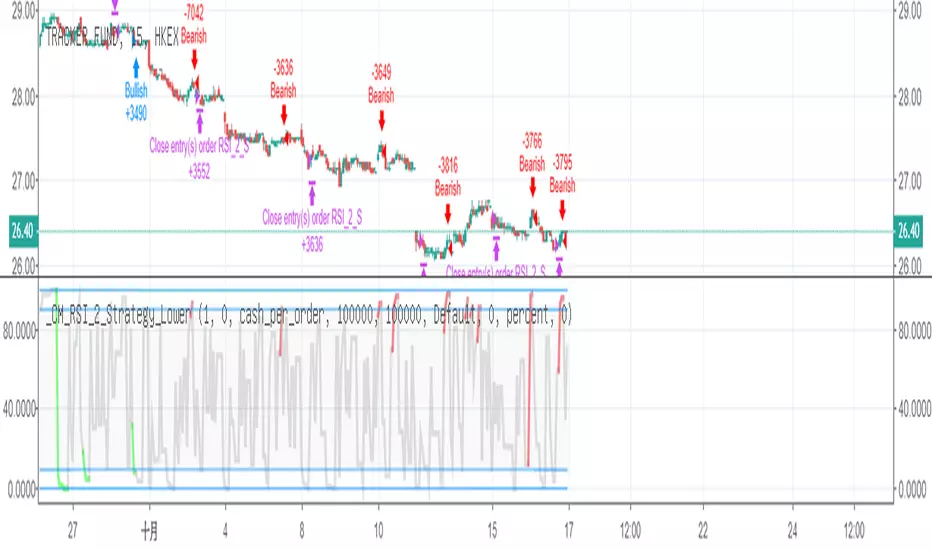
RSI-2 Larry Connars for 15 min KOnly Long when close > ma120 and rsi < 10 and rsi >1
平倉WHEN close > ma5 and ma1 穿 ma3
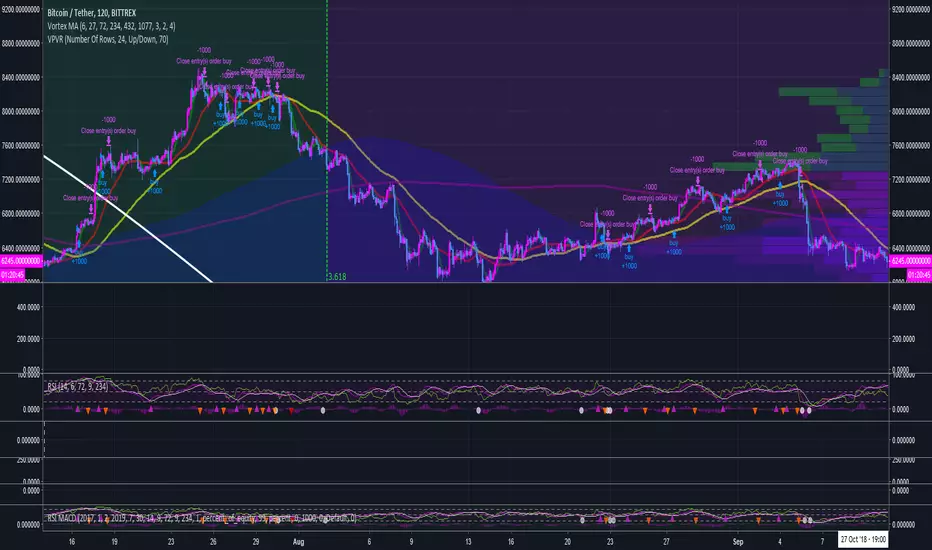
RSI MACD with conditional MA indicator backtestingbacktesting for the RSI MACD with conditional MA indicator:
RSI + MACD Strategy (ETHUSD 1D)This script uses a combination of MACD, RSI and Stochastic RSI to find tops and bottoms with a ~70% profit rate. While it is successful with all of the top market coins, ETHUSD is by far showing the best results. It is fine tuned only for 1D charts, any other time interval results in losses. It's been tested with shorting as well, but longing + selling gives better returns.
Each market is slightly different, but backtests from October 2015 on Poloniex show almost 300,000%(!!) gains. While it is unlikely to produce such gains going forward (but who knows!), the profit rate is still much higher than buy–and–hold on any long-term backtests. As always, don't follow a script blindly and use your own best judgement when trading.
DISCLAIMER:
This script should be used for educational purposes only, and is not intended to provide trading advice. Use at your own risk!

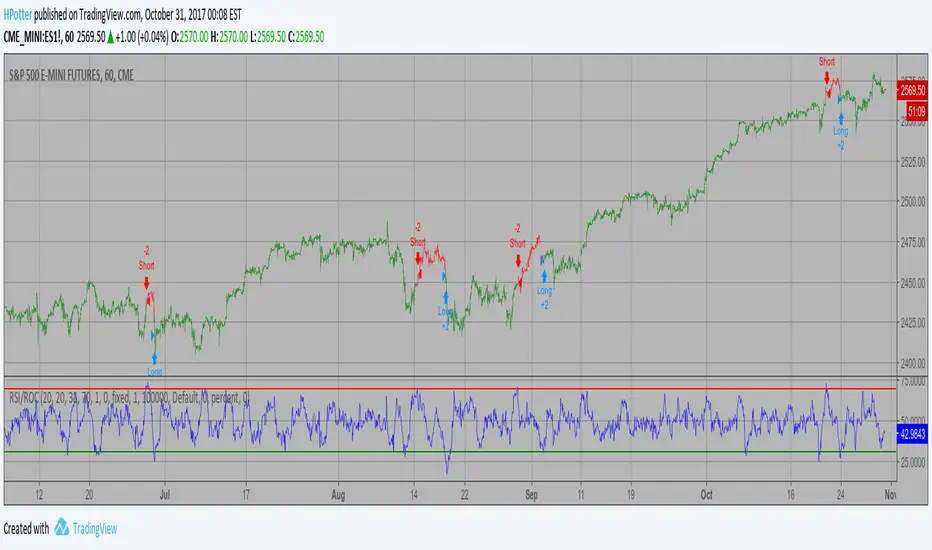
RSI based on ROC Backtest This is the new-age indicator which is version of RSI calculated upon
the Rate-of-change indicator.
The name "Relative Strength Index" is slightly misleading as the RSI
does not compare the relative strength of two securities, but rather
the internal strength of a single security. A more appropriate name
might be "Internal Strength Index." Relative strength charts that compare
two market indices, which are often referred to as Comparative Relative Strength.
And in its turn, the Rate-of-Change ("ROC") indicator displays the difference
between the current price and the price x-time periods ago. The difference can
be displayed in either points or as a percentage. The Momentum indicator displays
the same information, but expresses it as a ratio.
You can change long to short in the Input Settings
WARNING:
- For purpose educate only
- This script to change bars colors.
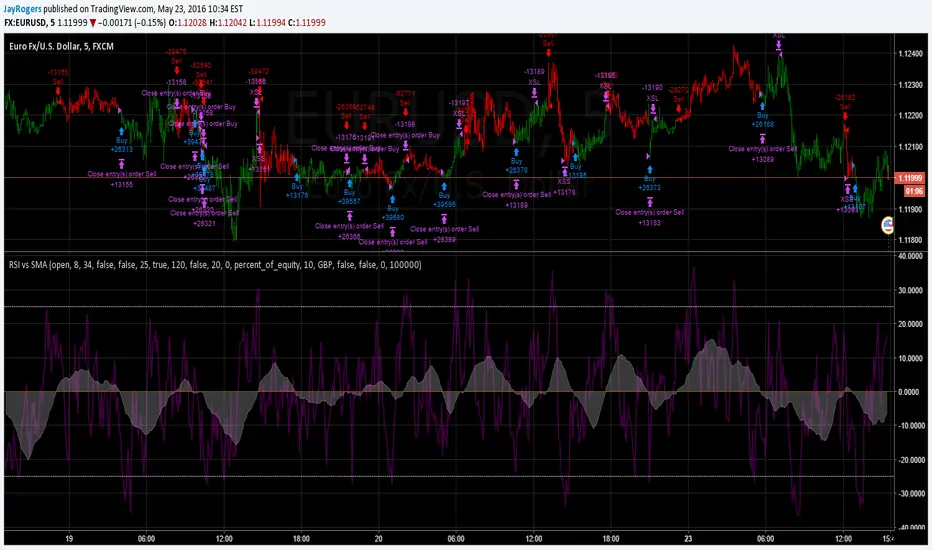
RSI versus SMA (no repaint)*** USE AT YOUR OWN RISK ***
Nothing is perfect, and all decisions by you are on your own head. And stuff.
Description:
It's RSI versus a Simple Moving Average.. Not sure it really needs much more description.
Should not repaint - Automatically offsets by 1 bar if anything other than "open" selected as RSI source.
...sometimes smashing things together just happens to work...
RSI + 55 EMA + Volume (SL Marked, No Engulfing)This is to help entering in trades by considering 50 EMA and RSI indicators, Volume is used for confirmations

RSI BREAKOUT SIGNALSThis BB + RSI Breakout indicator is designed to help traders identify potential buy and sell opportunities based on price movements relative to the Donchian channel (or Bollinger-type channel) and momentum conditions. It calculates the highest high and lowest low over a user-defined length to form a dynamic channel, and then it checks whether the current price breaks above the upper band (for a buy signal) or below the lower band (for a sell signal). To avoid repeated signals in a row, the indicator uses a state system: after a buy signal occurs, it will not generate another buy until a sell occurs, and vice versa. When a buy signal is triggered, it automatically calculates a take-profit price a certain percentage above the buy candle and displays this price below the candle as a “TP” label. Sell signals are displayed above the candle, and any previous TP label is cleared. The indicator updates in real time, so the signals move with the chart, giving a clear and lag-free visualization of entry points and potential profit targets.


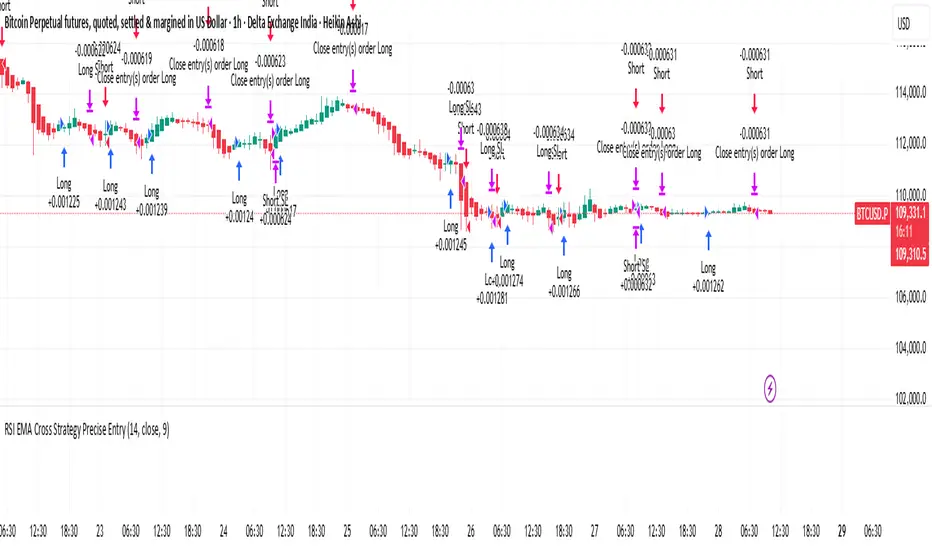
RSI Cross Strategy Precise EntryThis is based on RSI movement. it generates buy and sell signals precisely
RSI-MACD-trade"Strategic trading strategy using RSI and MASCD
Highest returns when applied to weekly charts"

✅ BACKTEST: UT Bot + RSIRSI levels widened (60/40) — more signals.
Removed ATR volatility filter (to let trades fire).
Added inputs for TP and SL using ATR — fully dynamic.
Cleaned up conditions to ensure alignment with market structure.
