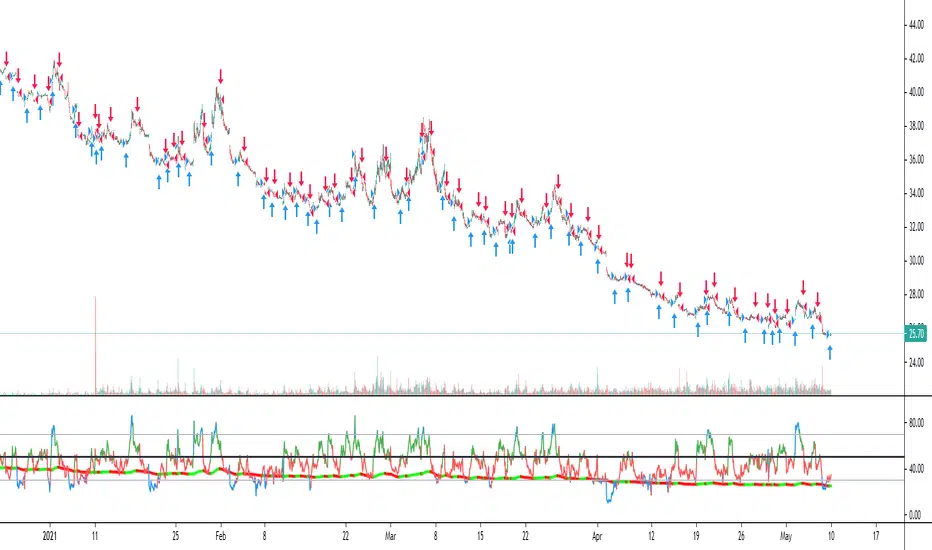
Agressive Scalper StrategyAfter many different tests and tries we found a strategy which is suited for people that likes to trade in shorter time frames. It uses multiple indications for entries. Entries include indications like Double ATR, Consolidation Detection, Dynamic RSI Calculation with Overbought and Oversold lines and also previous bars highs and lows. Although this strategy has been coded and tested on short time frames, after many additions it turns out it can be very profitable in every time frame if you play with the settings. Also it has some helpers for people that likes to optimize and see how their choices affects the outcome.
The strategy calculates the entry with the rules below:
LONG ENTRY RULES
- Price must be in consolidation zone
- Fast ATR Must be higher than Slow ATR
- Dynamic RSI must be below the oversold line (Green Line as Default)
- The Signal lookback must allow entry. (For example if you set signal lookback to 5, if the LOW of current price is LOWEST point of last 5 bars it is okay to enter LONG) If you check the lookback helper it will show you as green arrow at the bottom.
SHORT ENTRY RULES
- Price must be in consolidation zone
- Fast ATR Must be higher than Slow ATR
- Dynamic RSI must be above the overbought line (Red Line as Default)
- The Signal lookback must allow entry. (For example if you set signal lookback to 5, if the HIGHEST of current price is HIGHEST point of last 5 bars it is okay to enter SHORT) If you check the lookback helper it will show you as red arrow at the top.
This strategy has additional settings that are not available in indicator version that is previously released so i suggest everyone to use this instead.
Happy trading everyone!
"rsi" için komut dosyalarını ara
PowerX Strategy BacktestThis script implements the Power X trading strategy by Markus Heitkoetter and Rockwell Trading. The strategy is described in detail in "The PowerX Strategy: How to Trade Stocks and Options in Only 15 Minutes a Day" written by Markus Heitkoetter.
The Power X trading strategy uses RSI, Slow Stochastic and MACD indicators. When RSI and Slow Stochastic are both greater than 50 and MACD crosses up the signal line, it signals an up-trend. If RSI and slow stochastic are both less than 50 and MACD crosses down the signal line, it signals a down-trend. Other conditions signal no trend. There is an official version of this indicator available: PowerX Strategy Bar Coloring OFFICIAL VERSION.
This script opens a long entry with an up-trend momentum and a short entry with down-trend momentum. Trades are exited when profit target or stop loss is reached. Profit target and stop loss are calculated based on 7 days Average Daily Range (ADR). If the momentum is lost, a trade is exited the next day. The quantity of assets to buy/sell is calculated based on the stop loss to limit the risk to a user defined percentage of the initial capital.
There is another implementation of the Power X trading strategy available by therealhaolu: Power X Strategy Back-test. However, according to the comments this script seems to have some flaws.

EMR Strategy [H1 Backtesting]EMR Strategy base on EMA, MACD and RSI to supply signal on time frame H1.
Details of Rule as below:
===
1.EMA
+ Time frame: H1
+ Periods: 25, 100 (~ EMA 25 H4), 600 (~ EMA 25 D1)
===
2.MACD
+ Time frame: H1
+ Periods: 12,26,9
===
3.RSI
+ Time frame: H1
+ Periods: 14
===
4.Trading Rule
4.1.Long Position
+ MACD>0 and RSI>50 and close price moving above EMA 25
+ Close price crossed EMA 100 or crossed EMA 600 at the first time
4.2.Short Position
+ MACD<0 and RSI<50 and close price moving below EMA 25
+ Close price crossed EMA 100 or crossed EMA 600 at the first time
===
5.Money Management
+ This strategy concentrate into winrate.
+ So use trailing stop to protect your profits.
+ And use stoploss to avoid big loss on trades.

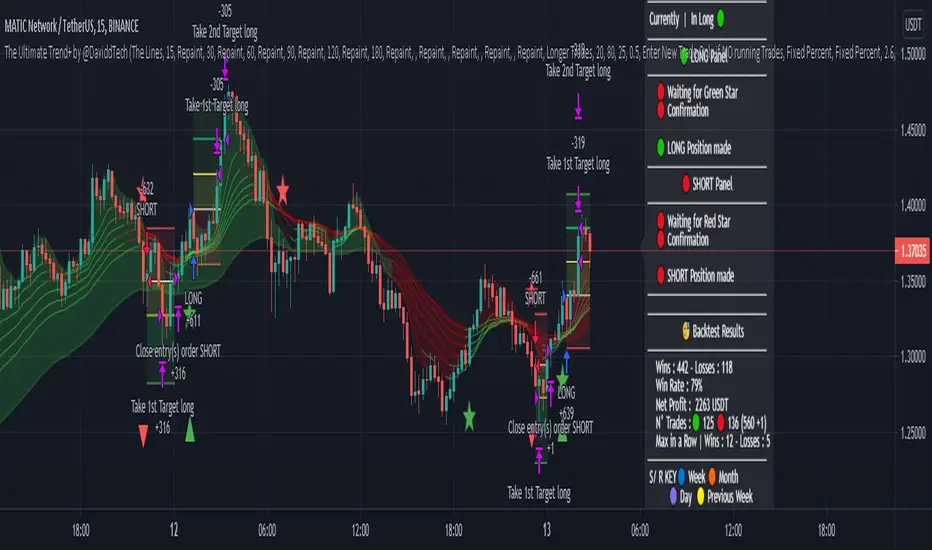
Multi Time Frame Heiken Ashi Candles by @DaviddTechMulti Time Frame Heiken Ashi Candles Visual Strategy.
Inspired by a video on YouTube by TradePro I decided to backtest this strategy.
The Strategy : This strategy waits for all the lines to cross green or red to look for a an entry.
It seems to give good results on the 15 minute timeframe.
1. The Cloud - Confirmed with no repainting.
2. The Lines may repaint as the price movement changes.
Confluence with the RSI STOCHASTIC.
If you use the RSI STOCHASTIC you have 2 options.
1. Super Scalper - Where the strategy will enter on every cross <> the two levels.
2. Longer positions - One entry is made where the RSI STOCHASTIC the closest to the GREEN/RED Star.
WARNING:
- For purpose educate only
- Plots EMAs and other values on chart.
- This script to change bars colors.
Full Forex scalper StrategyTHis is a FOREX scalping system that can be optimized with almost all majors and crosses pairs.
Its made of multiple elements such as :
MACD
Stochastic RSI
Fast VW moving average
Slow VW moving average
Time management( forex sessions as inputs)
Rules for entry
Long
Last 2 MACD values were ascending, fast moving average is below moving average and stochastic RSI is below 30 level. At the same time we are either into London or NY session.
Short
Last 2 MACD values were descending, fast moving average is above moving average and stochastic RSI is above 70 level. At the same time we are either into London or NY
Rules for exit
WE have 2 exit possibilities: we can exit either at the end of NY/London Session or based on a TP/SL risk management calculating % in movement.
If you have any questions let me know !

Forex scalper 2xEMA + SRSI + MACDThis is a forex scalping strategy designed for the most liquid pairs, like major forex pairs.
Its made of
1 EMA 50
1 EMA 100
Stochastic RSI
MACD
Rules
For long :close of the candle is above moving average 50, moving average 50> moving average 100, macd histogram is positive and cross over of stochastic rsi with the oversold level.
For short :close of the candle is below moving average 50, moving average 50 < moving average 100, macd histogram is negative and cross under of stochastic rsi with the overbought level.
Exit
For exit we have take profit and stop loss using fixed pip points.
For this example on EURUSD we use 20 pips for both tp and sl
IF you have any questions let me know !

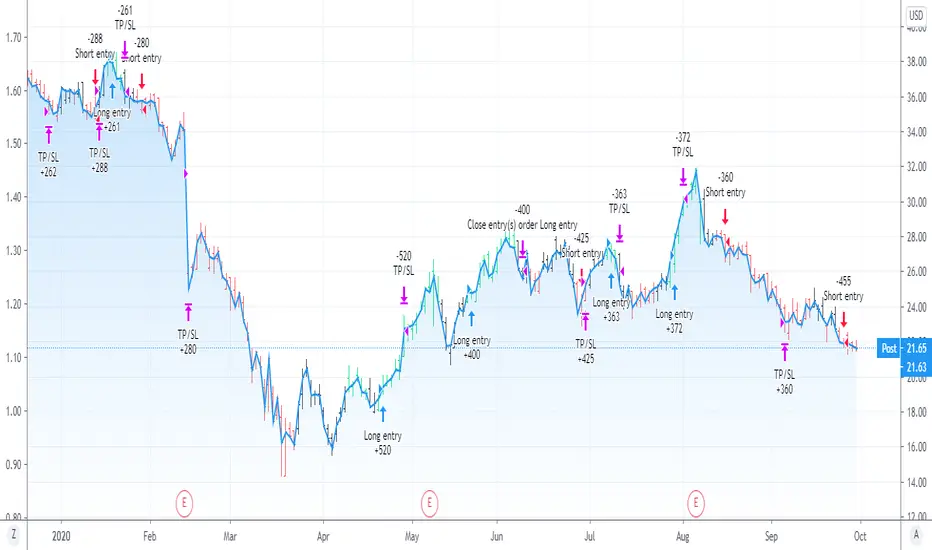
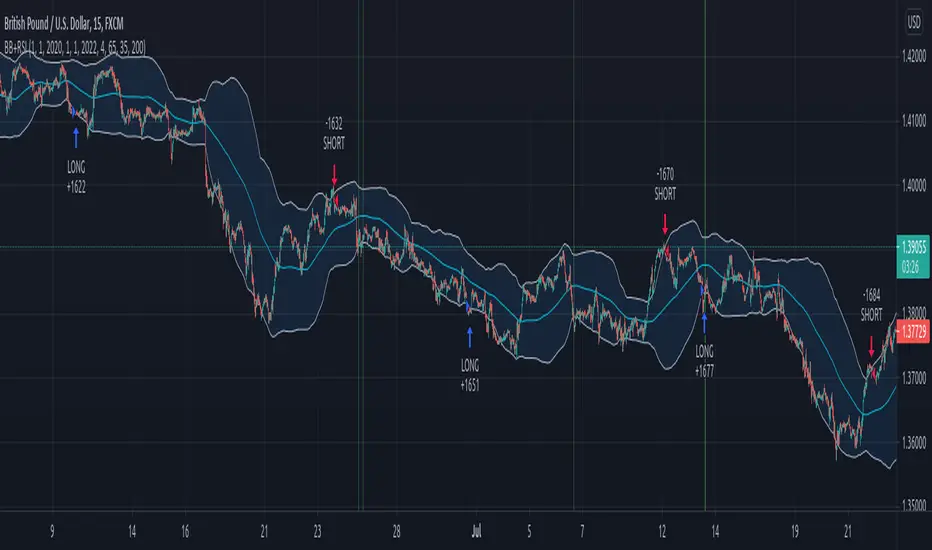
Swing forex strategy 15minThis is a strategy made using BB+ RSI indicators that seems to work great with 15 min major pairs for FOREX.
THe rules for it are simple:
For long we enter when the close of our candle crosses upwards the lower line and rsi crossover the over sold line
We exit long when we have a short entry.
For short we enter when the close of the candle crosses downwards the top line and rsi cross under the over bought line
WE exit short when we have a long entry.
Careful, this strategy has no risk management inside.
If you have any questions let me know !
Double Bollinger StrategyFrom "Bitcoin Trading Strategies: Algorithmic Trading Strategies For Bitcoin And Cryptocurrency That Work" by David Hanson.
*Works better with 1hr time frame and some input optimisations.
"Double Bollinger Band Scalping System
Recommended Timeframe: 1 minute or 5 minute *
Required Indicators:
// - RSI with a length of 14 (default settings)
// - Bollinger band #1 settings: Length = 50, stDev = 1 Hide the basis/middle line (basis line not needed for this strategy)
Note: This is the slower bollinger band in the directions
// - Bollinger band #2 settings: Length 20, stDev = 1 Hide the basis/middle line (basis line not needed for this strategy)
Note: This is the faster bollinger band in the directions
Enter Long/Buy Trade When:
// - RSI is above the level 50
// - A candle closes above the top of the faster bollinger band
Enter a long when a candle then closes above the top of the slower bollinger band, and price is above the top of both bands
Place a stop loss under the low of the entry candle Example of a long trade using this strategy
Exit Long Trade When: A candle closes below the top band of the fast bollinger band
Enter Short/Sell Trade When:
// - RSI is below the level 50
// - A candle closes below the bottom of the faster bollinger band
Enter a short when a candle then closes below the bottom of the slower bollinger band, and price is below both bands
Place a stop loss above the high of the entry candle Example of a short trade using this strategy
Exit Short Trade When: Price closes inside the bottom of the faster bollinger band"

Maximized Scalping On Trend (by Coinrule)" The trend is your friend. " This is one of the most famous and valuable teachings that experienced traders can give to newbies. There is a reason for that.
No matter your views about where the price moves, what matters is where the price heads to . The market is always right, and ultimately it decides who gets the profit and who has to take a loss.
The purpose of this strategy is to spot when it's the most suitable time to buy an asset profiting from a potential short-term price increase. The strategy tends to open trades frequently, closing them on average in one and a half days.
ENTRY
The buy order is placed on assets that present strong momentum when it's more likely that it is about to increase further in the short term.
To capture momentum on the asset, the rule strategy requires:
the MA50 greater than the MA100
the RSI greater than 50
The rule, then, places the order when
The price crosses above the MA9.
EXIT
This strategy comes with a stop loss and a take profit which adapt dynamically to market conditions.
The trade is closed in profit when the RSI is greater than 70 , as the trend could experience a pull-back.
Alternatively, the trade is closed when the RSI is lower than 30 , being this a sign of weakening of the trend.
Pro tip : The 1-hour time frame has proven to return the best results on average. The strategy can also work well in the 15-min time frame if you want to increase the trades' frequency.
The strategy assumes each order to trade 30% of the available capital and opens a trade at a time. A trading fee of 0.1% is taken into account.

Combo Backtest 123 Reversal & Relative Momentum Index This is combo strategies for get a cumulative signal.
First strategy
This System was created from the Book "How I Tripled My Money In The
Futures Market" by Ulf Jensen, Page 183. This is reverse type of strategies.
The strategy buys at market, if close price is higher than the previous close
during 2 days and the meaning of 9-days Stochastic Slow Oscillator is lower than 50.
The strategy sells at market, if close price is lower than the previous close price
during 2 days and the meaning of 9-days Stochastic Fast Oscillator is higher than 50.
Second strategy
The Relative Momentum Index (RMI) was developed by Roger Altman. Impressed
with the Relative Strength Index's sensitivity to the number of look-back
periods, yet frustrated with it's inconsistent oscillation between defined
overbought and oversold levels, Mr. Altman added a momentum component to the RSI.
As mentioned, the RMI is a variation of the RSI indicator. Instead of counting
up and down days from close to close as the RSI does, the RMI counts up and down
days from the close relative to the close x-days ago where x is not necessarily
1 as required by the RSI). So as the name of the indicator reflects, "momentum" is
substituted for "strength".
WARNING:
- For purpose educate only
- This script to change bars colors.

Moving Average Color StrategyHello,
Strategy based on scrips "Moving Average Color Direction Detection" from Dreadblitz published on Aug 9, 2019.
You can chose MA type, length and reaction setting to adjust to time frame/ticker. Always seemed like RSI is ahead of actual price action
and just messing around with MA on the RSI .
Couple I found:
SPXS / SPXL 20M timeframe, MA 32 Reaction 2 (HullMA) 50% of equity so you dont lose everything :)
UVXY / SVXY 20M MA 32 Reaction 6 (HullMA) 50% of equity so you dont lose everything :)
APPLY to RSI , or any indicator really and play with Adjustments.
HiLo Extension This Strategy is finding high and low breaks of the day and enter into the trader based on RSI value and time value
1) This strategy is created for Indian Index like Nifty, Bank Nifty and so...
2) Trades are initiate only after 10:15 AM and before 3:10PM
3) High and Low of the day break will be check during the above time frame
4) RSI value will be check (RSI 50)
5) and trade will be initiate
6) Stop loss set as vwma 20...
Note: This Script will work fine in Index future chart not index spot chart...
This is just my idea only... Please back test yourselve, before using it..
Your comments are welcome!

Flawless Victory Strategy - 15min BTC Machine Learning StrategyHello everyone, I am a heavy Python programmer bringing machine learning to TradingView. This 15 minute Bitcoin Long strategy was created using a machine learning library and 1 year of historical data in Python. Every parameter is hyper optimized to bring you the most profitable buy and sell signals for Bitcoin on the 15min chart. The historical Bitcoin data was gathered from Binance API, in case you want to know the best exchange to use this long strategy. It is a simple Bollinger Band and RSI strategy with two versions included in the tradingview settings. The first version has a Sharpe Ratio of 7.5 which is amazing, and the second version includes the best stop loss and take profit positions with a Sharpe Ratio of 2.5 . Let me talk a little bit more about how the strategy works. The buy signal is triggered when close price is less than lower Bollinger Band at Std Dev 1, and the RSI is greater than a certain value. The sell signal is triggered when close price is greater than upper Bollinger Band at Std Dev 1, and the RSI is greater than a certain value. What makes this strategy interesting is the parameters the Machine Learning library found when backtesting for the best Sharpe Ratio. I left my computer on for about 28 hours to fully backtest 5000 EPOCHS and get the results. I was able to create a great strategy that might be one of TradingView's best strategies out on the website today. I will continue to apply machine learning to all my strategies from here on forward. Please Let me know if you have any questions or certain strategies you would like me to hyper optimize for you. I'm always willing to create profitable strategies!
P.S. You can always pyramid this strategy for more gains! I just don't add pyramiding when creating my strategies because I want to show you the true win/loss ratio based buying one time and one selling one time. I feel like when creating a strategy that includes pyramiding right off the bat falsifies the win rate. This is my way of being transparent with you all. Have fun trading!

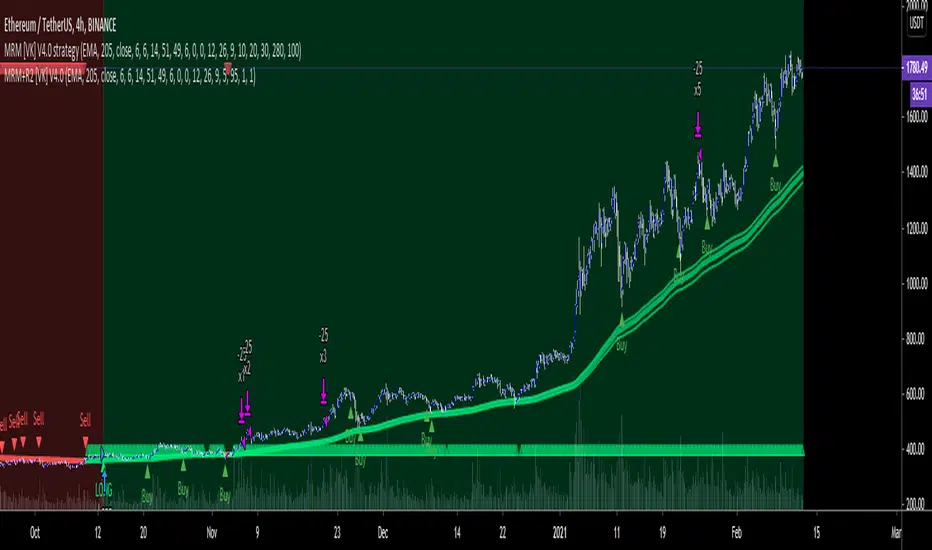
MRM [VK] V4.0 strategyMRM VK strategy
This strategy uses MA, RSI , MACD combined.
MACD and RSI can be used multi time frame to filter trend.
It is a very simple strategy which goes long/short when MACD , RSI and MA Trend Changes in higher Time Frame.
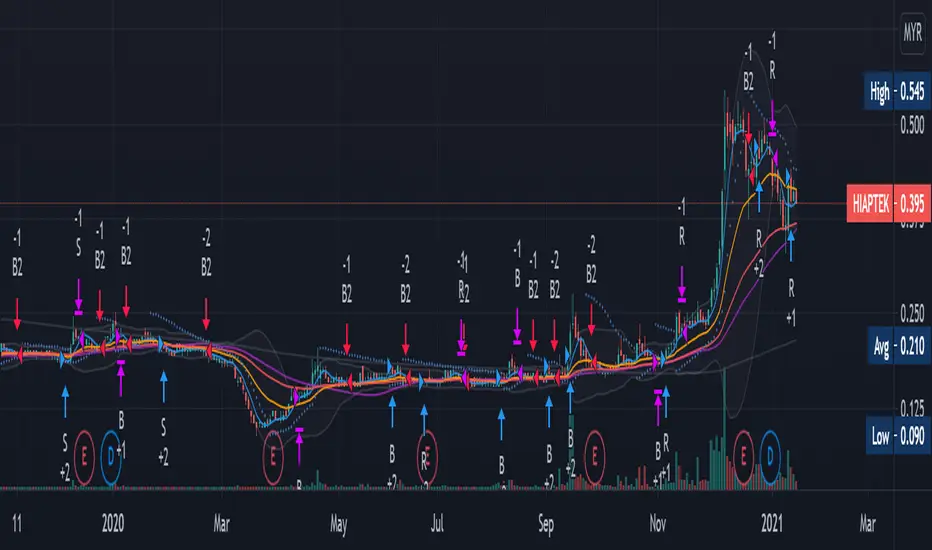
Renovation-10 (Including 10 Traditional Indicators)This idea is not rare. It is just a combination of 10 most well know and traditional Indicators to form one renovated indicator. There are Moving Average (MA), Volume (V), Bollinger Band (BB), Relative Strength Index ( RSI ), Stochastic RSI, Modified Stochastic RSI, Moving Average Convergence Divergence ( MACD ), Average directional index ( ADX ), Average True Range (ATR) and Parabolic Stop and Reverse (PSAR). These indicators most I found was just showing entering position strategic alone. I just want to know how well them work together when combination. I modified many times and thinking for the strategic enter and exist position with the choice of these 10 indicators to maximize the profitability which shows in strategic tester in every stock and conditions.
THEORY:
Fluctuation of price is like a Wave which I categorized it into four period. They are Sideway, Breakout Positive and Negative, Retracement and Consolidation. Breakout is rare to happen, either go up or go down. After a breakout usually will have small retracement, then trend will go for sideway. After long period of sideway, the wave is starting to run out of energy and there will be consolidation period.
STRATEGIC OPTION:
S: Sideway Period
B: Breakout Period
R: Retracement Period
(+): Buy
(-): Sell
PROBLEM:
1. Not performing very well at very penny stock which the graph looks like barcode.
Suggesting can change daily graph to weekly graph to avoid.
2. Be careful with Sideway entry signal because sometimes price may continue go down. You will stuck at middle if you enter without confirmation.
Confirm the price is stable at support by current low is higher or equal to past three to five day low before entry.
3.Always remember Breakout is rare, do not push for luck
Always make profit at Sideway and Retracement trend. Can Sell half only at BB when breakout buying signal is available, to avoid losing chance of chasing breakout.
4. Breakout selling signal 2 may delay
After breakout, make sure sell all when 2-3 red candle appeared or When BB is squeezing.
5. Other tools may required to confirm entry position.
These combination strategic is more to personal experiences and knowledges, it hard to adjust in coding for strategic position.
This is my first publication and I just do it for fun, having fun in reading the script and creating own ideas.
Information provided is only educational and sharing , should not be used to take action in the markets.
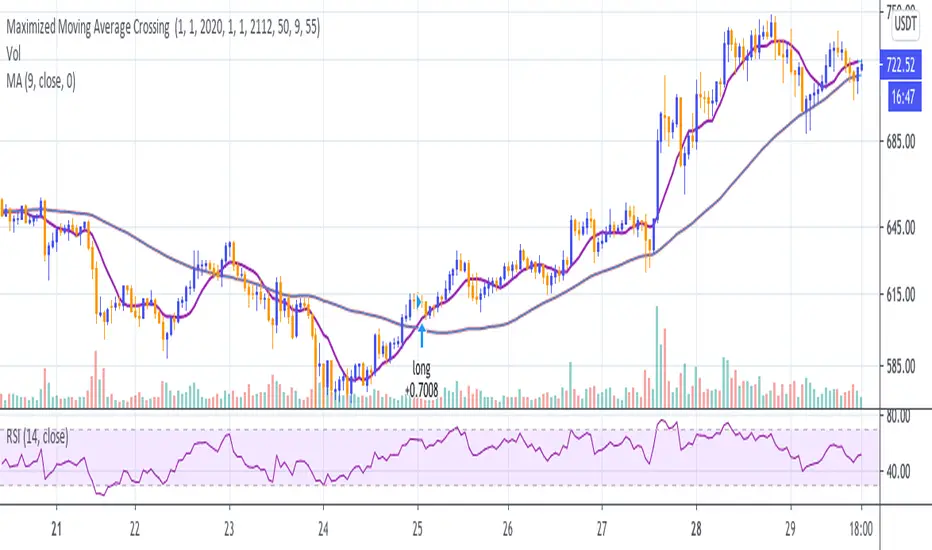
Maximized Moving Average Crossing (by Coinrule)Using the crossings of two Moving Averages to trade in a trading strategy is a Trend-Following approach. As the name would suggest, to be successful, it requires the asset to be on-trend.
The general limit of a common strategy based on Moving Averages is that they underperform when the market is less volatile or trading sideways. When volatility compresses, the indicators get very close one to another, crossing each other very often. That's exactly the condition when trend-following strategies underperform.
To improve this strategy, it's useful to filter the buy signal using the RSI. When the RSI is close to overbought conditions, that means that the coin is likely trading in an uptrend. Strong uptrends usually come with RSI values that stay overbought for long periods, creating interesting opportunities.
Setup
Buy condition: the MA9 crosses above the MA50, and at the same time, the RSI has a value greater than 55.
Sell condition: the MA9 crosses below the MA50.
The strategy is optimized to provide better results on the 1-hr time frame, but it could work well also on higher time frames, such as the 4-hrs.
The strategy assumes each order to trade 30% of the available capital and opens a trade at a time. A trading fee of 0.1% is taken into account.
Cyatophilum Scalper [BACKTEST]This indicator comes with a backtest and alert version. This is the backtest version. Its purpose is to create low timeframe and scalping strategies, by choosing from a list of built-in entry points which are described in detail below, and by configuring a risk management system to your liking.
Before diving into the entry points, I will explain the strategy and risk management settings.
These 3 settings allow to choose your strategy direction, and main behavior.
- Go Long ↗: activate or deactivate long entry points.
- Go Short ↘: activate or deactivate short entry points.
- Reversal strategy ↗↘↗↘: Activate this option will allow trades to reverse position from an opposite entry point. Keep it deactivated and trades will either wait a TakeProfit(TP) or StopLoss(SL) to be closed. When neither SL nor TP or set, this option is automatically activated.
StopLoss settings:
Both Long and Short SL can be activated and configured.
The base % price is the starting point of the stoploss, in a percentage of current price.
Trailing stop, when activated, works with 2 settings:
- % Price to Trigger: a percentage of current price the price should move in a bar to trigger a trailing movement.
- % Price Movement: the stoploss variation in a percentage of current price that moves on each bar.
TakeProfit settings:
Both Long and Short TP can be activated and configured.
The base % price is the value of the TP, in a percentage of current price.
Trailing Profit Deviation %: Percent deviation for the trailing take profit.
DCA:
DCA stands for Dollar Cost Average. The idea is to open additional orders from the base order so as to improve risk management.
These additional orders are also called Safety Orders. The indicator can handle up to 9 safety orders.
The strategy will exit either from a take profit based on percentage from base order or from a total volume percentage (Configurable in the parameters).
The steps spacing (space between each step) and safety orders volume (order size) can both scale by adding a scale multiplier.
By choosing from the base strategy dropdown menu, the indicator will generate entry points.
1. BUY SELL:
-> Low timeframes spot trading, with simple buy and sell orders.
How it works:
The indicator used is a combination of QQE (Atr based trend following indicator) and RMA 100 trendline.
I think the QQE does a great job in low timeframes because it is not impacted by the noise.
The RMA which is the moving average used in the RSI, will help giving confirmation to the entry points.
How to use:
It is meant to be used as a reversal strategy, but you can add a TP or SL if you want.
When comparing to Buy & Hold, make sure to deactivate the "Short results in the backtest" setting.
2. TREND SCALPING
-> A strategy for low timeframes trading.
How it works:
The strategy creates high volatility entries filtered by a duo convergence of adaptive trendlines (Adaptive HULL MA using the chart's resolution, Adaptive Tilson T3 using 1H resolution) and a higher timeframe (1H) RSI filter (long threshold: 70, short threshold: 40, RSI length: 10).
How to use:
Must be used on charts with a resolution smaller than 1H. Recommended: from 1m to 30m.
Must NOT be used as reversal strategy. Use it with a take profit and stop loss, and DCA if you can.
Sample risk management settings:
3. Support/Resistance BREAKOUTS
-> Trade low timeframes pivot points breakouts.
How it works:
The indicator calculates the 100 previous bars swing high and low. Any break above high or below low will trigger an entry point.
The entry is however filtered by an Adaptive Tilson T3 Trendline, an ADX 30 minimum threshold and a minimum average volume threshold.
How to use:
I recommend to click "Reversal" Strategy and set a Takeprofit target.
Find the best timeframe between 1m and 30m using the backtest version.
Example here with BTCUSDTPERP on 15m:
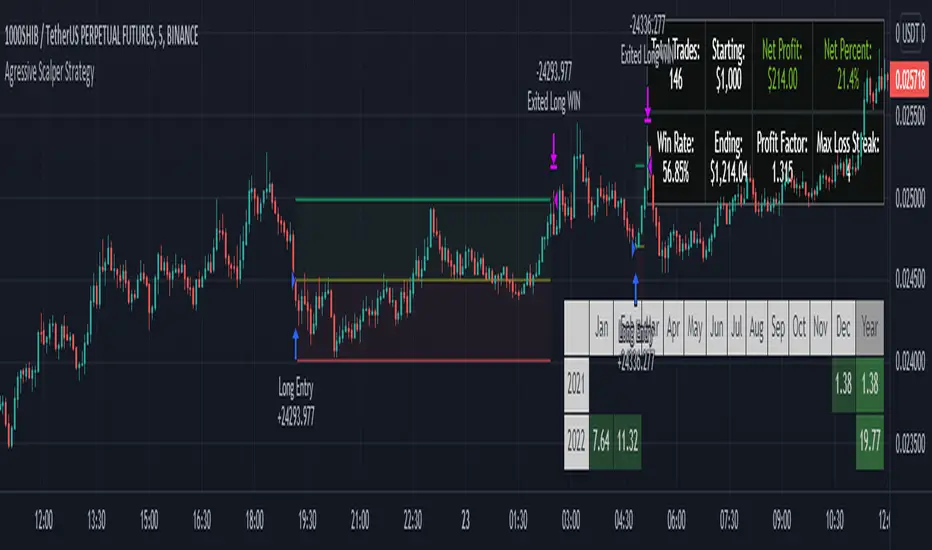
4. AGGRESSIVE SCALPING
-> Lots of trades in low timeframes.
How it works:
Created using Cyato AI, Higher/Lower Highs and Lows and 2 HULLMA crosses as entries, and 2 Adaptive Tilson T3 as trendfilter, a 25 ADX threshold filter and a volume filter.
How to use:
Recommended Risk Management settings: Takeprofit, Stoploss and DCA (Safety orders).
Find which timeframe work the best from 30 min and below. Should not be used above 30 min since this is the resolution for the MTF Tilson.
How to create Strategy Alerts:
Write your alert messages for EXIT, LONG and SHORT orders in the settings (Backtest section).
Then click add alert, and in the alert message, write the following:
{{strategy.order.alert_message}}
BACKTEST PARAMETERS
- Inital capital: 10 000$
- Base order size: 0.1 contract (0.1 btc)
- Safety order size: 0.1 contract (0.1 btc)
- Commission: 0.1%
- Slippage: 100 ticks
Oldest trade: 2020-08-31
Backtest Period: From 2020-08-31 to 2020-11-12
Configuration used: see the live chart configuration panel at the top.
To gain access to this paid indicator, please use the link below.

[astropark] DMI/ADX strategy [strategy]Dear Followers,
today I'm happy to share with you my DMI / ADX Strategy .
It provides directional trend information, so if a bullish or a bearish trend is going to start. Statistically it works better on lower timeframes (from 5 minutes to 1 hour).
It is both a Swing and Scalping Strategy indicator , based on a simple trend following theory , good for trading FOREX, Indexes, Stocks, Commodities and Cryptocurrencies.
To help in Taking Profits, the strategy integrates 2 special other than bull/bear signals:
Overbought and Oversold RSI Signals , which appear both as darker background (the darker the color, the more the price is in overbought/oversold) and green "ob"-"tp" / red "os"-"tp" labels (they optionally pop up only on a configurable stronger overbought/oversold condition) (you can enable/disable it optionally)
Peak Profit Tracker , which resets every time a new trade starts and keeps track of price fluctuation during the trade: the message is don't be too greedy and take profits or lock them with a stoploss in profit (you can enable/disable it optionally)
You can edit many options in order to
have more/less bull/bear signals
enable/disable showing bull/bear signals
enable/disable showing RSI TP signals (you can edit RSI length, overbought (OB) and oversold (OS) levels)
enable/disable showing peak profits on each trade
The user who wants to use this strategy, especially via an automated bot, must always set a stoploss (example 150$ from entry on bitcoin ) or use a proper risk management strategy .
This is not the "Holy Grail", so use it with caution. It's highly suggested to use a proper money management .
This script will let you backtest performance of the indicator based on bear/bull signals.
You can find the alarms version by searching for my DMI / ADX Strategy and choosing the "alarms" named.
Here there are some examples how this DMI / ADX strategy works on many markets:
LTC/USDT 15m
BTC/USD 15m
BNB/BTC 15m
ETH/USD 15m
GOLD (XAU/USD) 15m
GOLD (XAU/USD) 1h
FB 15m
AAPL 15m
TSLA 1h
BANKNIFTY Index 5m
NIFTY 50 Index 5m
This is a premium indicator , so send me a private message in order to get access to this script .

Bitlinc MARSI Study AST w/ Take Profit & Stop loss - beta 0.1This script is beta 0.1 - will update as soon as the script is tradable
This script is based on AST on a 10 minute timeframe. You can change the asset and the timeframe for any asset you want to trade, but for it to work correct ALL settings have to be testes in the Strategy section of the TradingView. Each assets and timeframe require a different mixture of settings. This is NOT a one settings fits all trading for all assets on any timeframe. Below are the settings and explanation on how it works.
How it fires a buy / sell:
The script will plot an RSI with upper and lower bands in a separate indicator window. The idea behind this script is to fire a LONG when MA crosses OVER lower band and fire a SHORT when the MA crosses under the lower band. Each order that fires is an OCO (Order Cancels Order) for pyramiding.
Settings:
You have full control of these settings as mentioned above, you must configure every part of this script for each asset and timeframe you trade.
- Length of MA
- Length
- Upper bands of RSI
- Lower bands of RSI
- Take profit percentage
- Stop loss percentage
- Month to start and end the strategy (within 2020)
- Day to start and end the strategy (within 2020)
- Quantity type
- Slippage
- Pyramiding
***Remember that after the signal to enter or exit a trade is fired, the alert will trigger AFTER the close of the candle that caused the tigger to fire

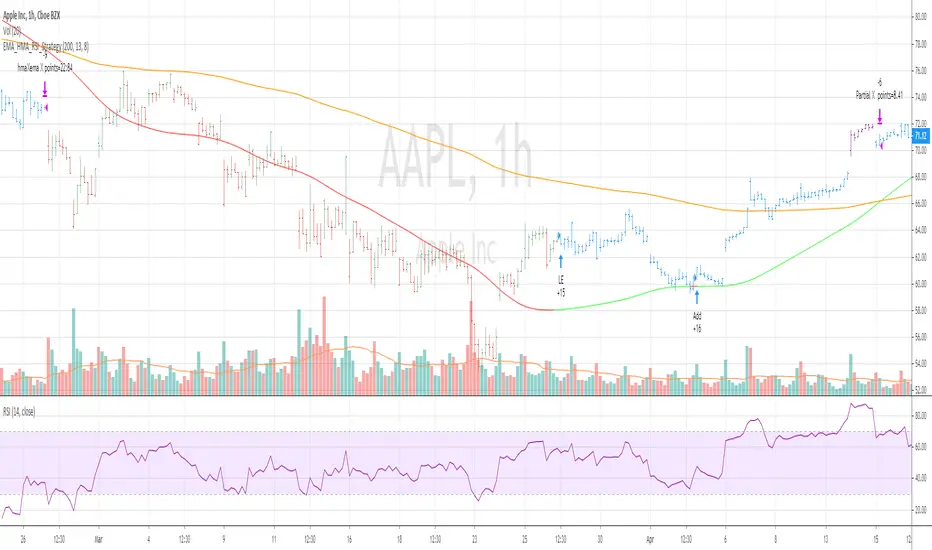
EMA_HMA_RSI_StrategyThis strategy BUYS when HMA is below EMA (default setting is 200) and HMA turning to green and RSI 13 is below 70
Adds to existing position when current price is below BUY price and RSI crossing above 30 or 40
Exits the long position when HMA crosses down EMA
when you select Take Profit setting , partial profits are taken when current price > BUY price and RSI 13 crossing down 80
Bar color changes to purple when RSI13 is above 80 (if only in Long position exists)
Tested for SPY QQQ AAPL on hourly and 30 mins chart
Warning : For educational purposes only
Aroon Oscillator StrategyThis is simple strategy based on Aroon Oscillator. I have found that using length 144 or 169 on hourly chart shows excellent results.
Tested on SPY , QQQ and AAPL. Especially when you look at AAPL results , it has 60% profitable in recent trades. ( Dont assume this will be same for other stocks or ETFs)
Aroon Oscillator setting : 169 ( 169 is square root of 13 ... you can also use fib level 144 , which is square root of 12 )
BUY
When Aroon Oscillator crosses above zero line
Add
if Long position is already opened, and current close is less than BUY price and RSI 13 crossing above 30 line
Exit
when Aroon Oscialltor crosses below zero line
Stop Loss
default stop loss has been set to 5%
Note: I have not plotted RSI to the chart. Please include RSI 13 to see how position gets added ... Also add ema 169 to see how the price is aligned with the Aroon Oscillator
Warning
For the educational purposes only

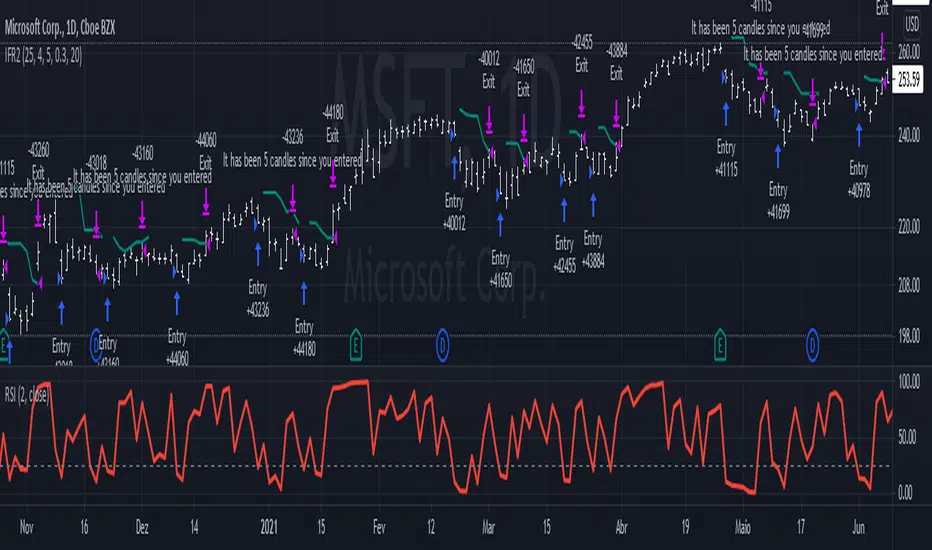
IFR2The IFR2 strategy is based on the RSI indicator.
If the two period RSI is less than the overbought level (25 is the default, but you can configure it to be lower), a long position is placed at the close of the candle. If you are doing it live, you'd have to enter the market ~ 10 minutes before it closes, check the RSI, and buy if it is lower than your overbought level. This generates a discrepancy in the backtesting, but since it is a very small difference, it can be disregarded. Higher overbought levels generate more signals, but they mostly are unreliable. Lower values generates better yields, but they won't occur very often. This strategy is designed to be used in a daily graph, and I don't recommend using it in intraday periods, since you'll make too little money to compensate for the operational cost.
The strategy exits when the high price of two previous candles is reached. If the exit price is higher than the closing price of when you entered, you'll be at a profit, otherwise you'll be at a loss. The exit price is plotted in the graph and it's colors depends on the current open profit: positive values will be green, negative will be red.
This strategy completely disregards the current trend. Long orders will be placed even if you are at a strong down trend. This may seem odd, but you have to keep in mind that this is a volatility based strategy , not a trend following one.
This setup was designed by Alexandre Wolwacz, a.k.a. Stormer.
Power X Strategy Back-testThis script back-test the Power X Strategy developed by Markus Heitkoetter and Rockwell Trading. For more detail about the strategy, please refer to "The PowerX Strategy: How to Trade Stocks and Options in Only 15 Minutes a Day" written by Markus Heitkoetter. Note that this script is not publish, develop or maintain by Rockwell Trading, and may have different results. Rockwell Trading has a powerful software called Power X Optimizer, which scan, back-test and optimize the best stock for the strategy.
The Power X Strategy uses RSI , Slow Stochastic and MACD indicators under the hood. When RSI and slow Stochastic are both greater than 50 and MACD crosses up the signal line, it marks as up-trend. If RSI and slow stochastic are both less than 50 and MACD crosses down the signal line, it marks as down-trend. Other are mark as no trend.
This back-test makes a long entry with an up-trend momentum and short entry with down-trend momentum. Trade is exited when profit target or stop lose is reach. Profit target and stop lose is calculated based on 7 days Average Daily Range (ADR).
If the either of the momentum is lost, trade is exited the next day. It also skips the entire month of March 2020, since the market crash and is not in a normal market condition for the strategy.