Divergence for Many [Dimkud - v5]Strategy is based on "Divergence for Many Indicators v4 ST" strategy by CannyTolany01
which is based on "Divergence for Many Indicator" indicator by LonesomeTheBlue
This strategy is searching for divergences on 18 indicators which you can select and optimise one by one.
Additionally you can connect any other External Indicator value. (just add this indicator the the chart and select option in settings)
To the original indicator/strategy I have added 9 additional indicators:
( Money Flow Index, Williams_Vix, Stochastic RSI , SMI Ergodic Oscillator, Volume Weighted MACD , Bull Bear Power, Balance of Power , Relative Volatility Index , Logistic Settings).
Converted strategy to v5 of Pine Script.
Added Static SL/TP in percents (%).
Added filters to filter enters:
1. Volume Weighted MACD - Multi-TimeFrame Filter
(It checks for histogram to falling or rising for a set periods of bars)
2. Money Flow Index - Multi-TimeFrame Filter
(It checks if MFI Oscillator is in the set diapason.
Also It checks if MFI is falling or rising for a set periods of bars )
3. ATR filter
(check changes in fast ATR to slow ATR )
Strategy shows good backtest results on many crypto tokens on 45m - 1h periods. (with parameters optimisation for every indicator)
To find best parameters - you can enable indicators one-by one, and optimise best parameters for each of them.
Then enable all indicators with successful results.
Optimise SL/TP.
Then try to enable and optimise filters (channels etc.)
The better is to optimise parameters separately for Short and Long trading. And run two separate bots (in settings enable only Long or only Short.)
Updates:
- Added visualisation for open trades (SL/TP)
- Added Volatility filter by ATR with many options for tests.
- Fixed some small bugs.
- Added second RSI filter (you can use two RSIs with different TF or settings)
- Updated ATR volatility and MFI filter. Removed non-effective options
- Added CCI filter
- Added option to Enable/Disable visualisation of TP/SL on chart
- Fixed one small quick bug. ("ATR filter short" was not working)
- Added Super Trend filter
- Added Momentum filter
- Added Volume Filter
- All "request.security" MultiTimeFrame calls changed to 100% non-repait function "f_security()"
"rsi" için komut dosyalarını ara

Investments/swing trading strategy for different assetsStop worrying about catching the lowest price, it's almost impossible!: with this trend-following strategy and protection from bearish phases, you will know how to enter the market properly to obtain benefits in the long term.
Backtesting context: 1899-11-01 to 2023-02-16 of SPX by Tvc. Commissions: 0.05% for each entry, 0.05% for each exit. Risk per trade: 2.5% of the total account
For this strategy, 5 indicators are used:
One Ema of 200 periods
Atr Stop loss indicator from Gatherio
Squeeze momentum indicator from LazyBear
Moving average convergence/divergence or Macd
Relative strength index or Rsi
Trade conditions:
There are three type of entries, one of them depends if we want to trade against a bearish trend or not.
---If we keep Against trend option deactivated, the rules for two type of entries are:---
First type of entry:
With the next rules, we will be able to entry in a pull back situation:
Squeeze momentum is under 0 line (red)
Close is above 200 Ema and close is higher than the past close
Histogram from macd is under 0 line and is higher than the past one
Once these rules are met, we enter into a buy position. Stop loss will be determined by atr stop loss (white point) and break even(blue point) by a risk/reward ratio of 1:1.
For closing this position: Squeeze momentum crosses over 0 and, until squeeze momentum crosses under 0, we close the position. Otherwise, we would have closed the position due to break even or stop loss.
Second type of entry:
With the next rules, we will not lose a possible bullish movement:
Close is above 200 Ema
Squeeze momentum crosses under 0 line
Once these rules are met, we enter into a buy position. Stop loss will be determined by atr stop loss (white point) and break even(blue point) by a risk/reward ratio of 1:1.
Like in the past type of entry, for closing this position: Squeeze momentum crosses over 0 and, until squeeze momentum crosses under 0, we close the position. Otherwise, we would have closed the position due to break even or stop loss.
---If we keep Against trend option activated, the rules are the same as the ones above, but with one more type of entry. This is more useful in weekly timeframes, but could also be used in daily time frame:---
Third type of entry:
Close is under 200 Ema
Squeeze momentum crosses under 0 line
Once these rules are met, we enter into a buy position. Stop loss will be determined by atr stop loss (white point) and break even(blue point) by a risk/reward ratio of 1:1.
Like in the past type of entries, for closing this position: Squeeze momentum crosses over 0 and, until squeeze momentum crosses under 0, we close the position. Otherwise, we would have closed the position due to break even or stop loss.
Risk management
For calculating the amount of the position you will use just a small percent of your initial capital for the strategy and you will use the atr stop loss for this.
Example: You have 1000 usd and you just want to risk 2,5% of your account, there is a buy signal at price of 4,000 usd. The stop loss price from atr stop loss is 3,900. You calculate the distance in percent between 4,000 and 3,900. In this case, that distance would be of 2.50%. Then, you calculate your position by this way: (initial or current capital * risk per trade of your account) / (stop loss distance).
Using these values on the formula: (1000*2,5%)/(2,5%) = 1000usd. It means, you have to use 1000 usd for risking 2.5% of your account.
We will use this risk management for applying compound interest.
In settings, with position amount calculator, you can enter the amount in usd of your account and the amount in percentage for risking per trade of the account. You will see this value in green color in the upper left corner that shows the amount in usd to use for risking the specific percentage of your account.
Script functions
Inside of settings, you will find some utilities for display atr stop loss, break evens, positions, signals, indicators, etc.
You will find the settings for risk management at the end of the script if you want to change something. But rebember, do not change values from indicators, the idea is to not over optimize the strategy.
If you want to change the initial capital for backtest the strategy, go to properties, and also enter the commisions of your exchange and slippage for more realistic results.
If you activate break even using rsi, when rsi crosses under overbought zone break even will be activated. This can work in some assets.
---Important: In risk managment you can find an option called "Use leverage ?", activate this if you want to backtest using leverage, which means that in case of not having enough money for risking the % determined by you of your account using your initial capital, you will use leverage for using the enough amount for risking that % of your acount in a buy position. Otherwise, the amount will be limited by your initial/current capital---
Some things to consider
USE UNDER YOUR OWN RISK. PAST RESULTS DO NOT REPRESENT THE FUTURE.
DEPENDING OF % ACCOUNT RISK PER TRADE, YOU COULD REQUIRE LEVERAGE FOR OPEN SOME POSITIONS, SO PLEASE, BE CAREFULL AND USE CORRECTLY THE RISK MANAGEMENT
Do not forget to change commissions and other parameters related with back testing results!
Some assets and timeframes where the strategy has also worked:
BTCUSD : 4H, 1D, W
SPX (US500) : 4H, 1D, W
GOLD : 1D, W
SILVER : 1D, W
ETHUSD : 4H, 1D
DXY : 1D
AAPL : 4H, 1D, W
AMZN : 4H, 1D, W
META : 4H, 1D, W
(and others stocks)
BANKNIFTY : 4H, 1D, W
DAX : 1D, W
RUT : 1D, W
HSI : 1D, W
NI225 : 1D, W
USDCOP : 1D, W

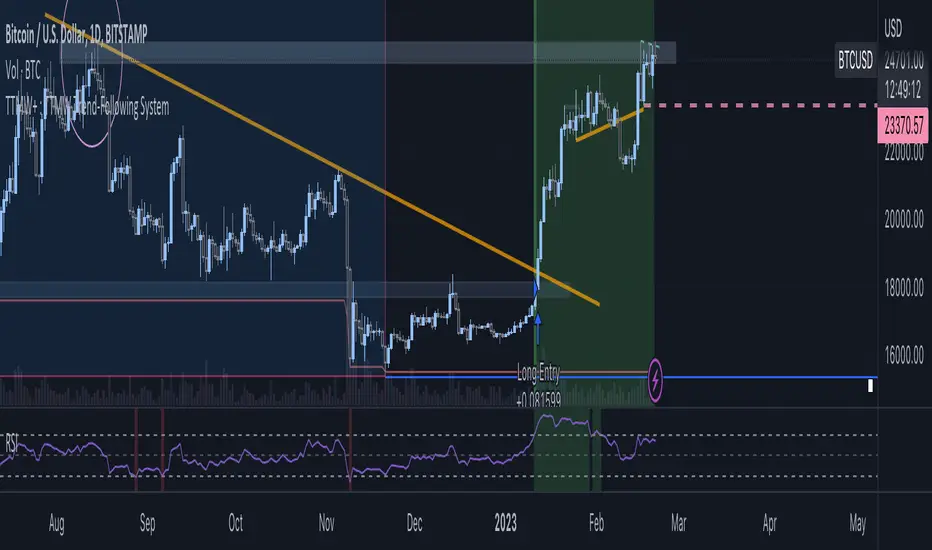
TTMW+ : TTMW Trend-Following System TTMW Trend-Following System
Developed by Stamp - To The Milky Way
# What is TTMW Trend Following System ? #
- TTMW Trend-Following System is designed and developed by "To The Milky Way". The indicator is very simple and useful for low time-preference trader, the concept of the indicator is to follow the trend when the strong buy momentum is indicated using the only indicator ,RSI (Relative Strength Index), to provide the signal for the traders. The cross-over of RSI and overbought value indicates the strong Buy momentum and the possible FOMO state, labels the Buy Signal which is indicated on the chart. The cross-under of RSI and oversold value indicated the strong Sell momentum that would be the Take-Profit or Stop-Loss target.
- The TTMW Trend-Following System is able to Backtest the performance of the system with any specific ticker by using the Strategy Tester that is provided in Tradingview, so the traders can verify the past performance of the system performing in any specify ticker before making the investing decision.
- The Trend Following system is better to use in large timeframe. The indicator is designed and developed to perform on 1D Timeframe.
# How to use ? #
- The system is very simple to use. The system is designed for 3 trading style (Normal, Aggressive, Super Aggressive) which can be selected in the setting. Traders can select the trading style which fit the best with their trading style.
- The system is developed with the Dashboard that can be enabled in the setting. The Dashboard provides the major informations that can help the traders.
- The system has an alert function that can be used to alert via Email when the Buy or Sell signal is triggered.
DRM StrategyOne of the ways I go when I develop strategies is by reducing the number of parameters and removing fixed parameters and levels.
In this strategy, I'm trying to create an RSI indicator with a dynamic length.
Length is computed based on the correlation between Price and its momentum.
You can set min and max values for the RSI, and if the correlation is close to 1, we'll be at a min RSI value. When it's -1, we'll be at the max level.
I got this idea from Sofien Kaabar's book.
The strategy is super simple, and there might be much room for improvement.
Performance on the deep backtesting is not excellent, so I think the strategy needs some filters for regimes, etc.
Thanks to @MUQWISHI for helping me code it.
Disclaimer
Please remember that past performance may not indicate future results.
Due to various factors, including changing market conditions, the strategy may no longer perform as well as in historical backtesting.
This post and the script don’t provide any financial advice.

M0PB (Momentum Pullback)Long/short strategy that identifies extreme readings on the rsi as a *momentum signal*, unlike most RSI strategies the script will look to buy or sell the first pullback in the direction of the extreme RSI reading.
Enters positions on the first pullback to the 5ema(low)/ 5ema(high) and exits at rolling 12 bar high/ low. The rolling high/ low feature means that if the price enters into a prolonged consolidation the profit target will begin to reduce with each new bar. The best trades tend to work within 2-6 bars.
Built for use on 5 min intervals on FX, Indexes, and Crypto. Lower than 5 minute time frames tend to be noisier and mean more commissions and a higher risk of slippage so the suggested timeframe is 5 mins.
Hard stop is X ATR (users can experiment with this) from the position entry price. This can be adjusted in user inputs.
There is a lot of slack left in entries and exits but the overall strategy is fairly robust across timeframes and markets and has between 60%-70% win rate with larger winners.
Signals that occur from economic news volatility are best avoided.

I11L - Meanreverter 4h---Overview---
The system buys fear and sells greed.
Its relies on a Relative Strength Index (RSI) and moving averages (MA) to find oversold and overbought states.
It seems to work best in market conditions where the Bond market has a negative Beta to Stocks.
Backtests in a longer Timeframe will clearly show this.
---Parameter---
Frequency: Smothens the RSI curve, helps to "remember" recent highs better.
RsiFrequency: A Frequency of 40 implies a RSI over the last 40 Bars.
BuyZoneDistance: Spacing between the different zones. A wider spacing reduces the amount of signals and icnreases the holding duration. Should be finetuned with tradingcosts in mind.
AvgDownATRSum: The multiple of the Average ATR over 20 Bars * amount of opentrades for your average down. I choose the ATR over a fixed percent loss to find more signals in low volatility environments and less in high volatility environments.
---Some of my thoughts---
Be very careful about the good backtesting performance in many US-Stocks because the System had a favourable environment since 1970.
Be careful about the survivorship bias as well.
52% of stocks from the S&P500 were removed since 2000.
I discount my Annual Results by 5% because of this fact.
You will find yourself quite often with very few signals because of the high market correlation.
My testing suggests that there is no expected total performance difference between a signal from a bad and a signal from a good market condition but a higher volatility.
I am sharing this strategy because i am currently not able to implement it as i want to and i think that meanreversion is starting to be taken more serious by traders.
The challange in implementing this strategy is that you need to be invested 100% of the time to retrieve the expected annual performance and to reduce the fat tail risk by market crashes.

Risk Management Strategy TemplateThis strategy is intended to be used as a base template for building new strategies.
It incorporates the following features:
Risk management:
Configurable X% loss per stop loss
Configurable R:R ratio
Trade entry:
Calculated position size based on risk tolerance
Trade exit:
Stop Loss currently configurable ATR multiplier but can be replaced based on strategy
Take Profit calculated from Stop Loss using R:R ratio
Backtesting:
Configurable backtesting range by date
Trade drawings:
TP/SL boxes drawn for all trades. Can be turned on and off
Trade exit information labels. Can be turned on and off
NOTE: Trade drawings will only be applicable when using overlay strategies
Debugging:
Includes section with useful debugging techniques
Strategy conditions
Trade entry:
LONG
C1: Price is above EMA line
C2: RSI is crossing out of oversold area
SHORT
C1: Price is below EMA line
C2: RSI is crossing out of overbought area
Trade exit:
Stop Loss: Stop Loss ATR multiplier is hit
Take Profit: R:R multiplier * Stop Loss is hit
The idea is to use RSI to catch pullbacks within the main trend.
Note that this strategy is intended to be a simple base strategy for building upon. It was not designed to be traded in its current form.

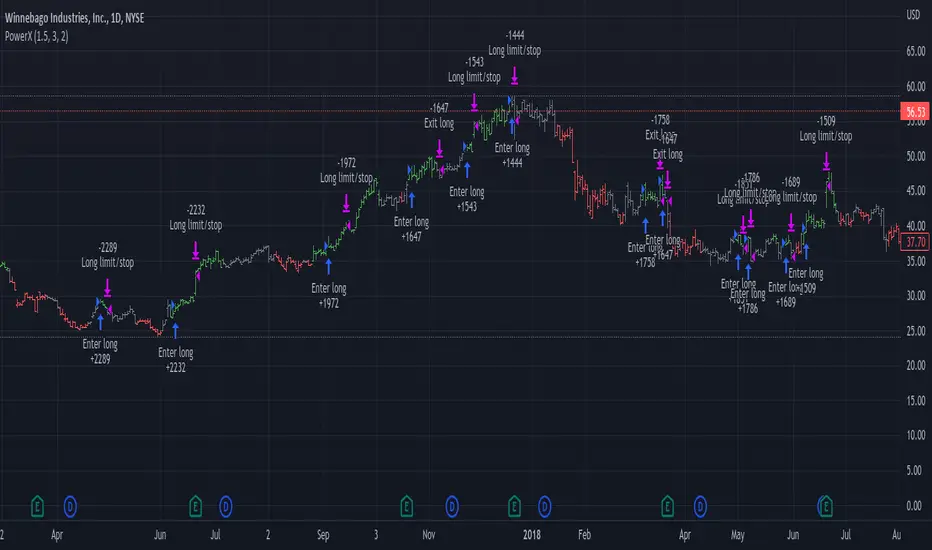
PowerX by jwitt98This strategy attempts to replicate the PowerX strategy as described in the book by by Markus Heitkoetter
Three indicators are used:
RSI (7) - An RSI above 50 indicates and uptrend. An RSI below 50 indicates a downtrend.
Slow Stochastics (14, 3, 3) - A %K above 50 indicates an uptrend. A %K below 50 indicates a downtrend.
MACD (12, 26, 9) - A MACD above the signal line indicates an uptrend. A MACD below the signal line indicates a downtrend
In addition, multiples of ADR (7) is used for setting the stops and profit targets
Setup:
When all 3 indicators are indicating an uptrend, the OHLC bar is green.
When all 3 indicators are indicating a downtrend, the OHLC bar is red.
When one or more indicators are conflicting, the OHLC bar is black
The basic rules are:
When the OHLC bar is green and the preceding bar is black or Red, enter a long stop-limit order .01 above the high of the first green bar
When the OHLC bar is red and the preceding bar is black or green, enter a short stop-limit order .01 below the low of the first red bar
If a red or black bar is encountered while in a long trade, or a green or black bar for a short trade, exit the trade at the close of that bar with a market order.
Stop losses are set by default at a multiple of 1.5 times the ADR.
Profit targets are set by default at a multiple of 3 times the ADR.
Options:
You can adjust the start and end dates for the trading range
You can configure this strategy for long only, short only, or both long and short.
You can adjust the multiples used to set the stop losses and profit targets.
There is an option to use a money management system very similar to the one described in the PowerX book. Some assumptions had to be made for cases where the equity is underwater as those cases are not clearly defined in the book. There is an option to override this behavior and keep the risk at or above the set point (2% by default), rather than further reduce the risk when equity is underwater. Position sizing is limited when using money management so as not to exceed the current strategy equity. The starting risk can be adjusted from the default of 2%.
Final notes: If you find any errors, have any questions, or have suggestions for improvements, please leave your message in the comments.
Happy trading!
Bitfinex Shorts StratOverview
This strat applies the data from BITFINEX:USDSHORTS to the RSI indicator in order to provide SHORT/LONG entries as the number of contracts goes up and down. Although Bitfinex has lost relevance over the years its generally considered an exchange dominated by smart money rather than retail. I'd like to see if any insights can be gained by following their trading behaviour.
How to use
Select the underlying security you wish to trade and load the indicator. Select the appropriate short security by searching in the Bitfinex Short Symbol. RSI settings apply to short symbol not the actual asset. Strategy shorts the underlying asset when shorts rise and longs when they drop. The shorts symbol will follow the value of the loaded chart. Works best on 4 hour chart.
Why use shorts only rather than both long/shorts?
Bitfinex longs seem to be on a long-term uptrend accounting for 25x the number of shorts. Might be enormous confidence on part of the whales, but more likely reflects selling spot and buying perp. Given the size disparity and price action I don't think longs info is adding much.
Problems with script:
a) We don't really know the intentions of short players (e.g. speculation or hedging spot)
b) The script uses a decline in shorts as a long signal
c) RSI is a blunt tool there are probably better options for calculating high/lows in shorts
d) Shorts are accumulated both at highs and also when BTC price is already heavily trending down. This suggests some are speculative (at the highs) or protective/hedging during a decline
Takeaways:
Based on this strat Bitfinex whales are more wrong than right.
Results don't carry across well into altcoins using the accompanying short symbol. However, what is interesting is that applying the BITFINEX:BTCUSDSHORTS to altcoin charts does work pretty well.
Strat needs some refinement to control for entries under different circumstances.
Probably not a great idea to use this as a strategy in isolation, but highlights how Bitfinex whale behaviour is a good gauge to follow.

ALMA/EMA/SRSI Strategy + IndicatorBack with another great high hit rate strategy!!
Disclaimer* This strategy was sampled using source code written by @ClassicScott , as referred to in the script, there is a clear line where the source code was scripted by myself.
This Strategy consists of three key factors, the ALMA, EMA crossover, and a Stochastic Rsi
ALMA: The Alma is the step line shown, turning green and red at select times. This average value gives general oversight of the macro movement of price action. and this particular one was coded by Mr.ClassicScott.
EMA crossover: At the input screen you are given an option of the fast and slow ema's. The default is solely for the hit rate and correlation to the Alma of this strategy. The arrows you see depicted on the chart are the crossover events happening.
Stochastic Rsi: The Stochastic Rsi is a stochastic value, using data sampled from the rsi. The use of this indicator in my strategy is to prevent entries when too overbought and oversold, as well as closures and vice versa, to prevent holding bags either way.
Fixed % TP: In the input screen you are given a take profit and stop loss percentage, for good R/R the hit rate will take a notch down, but with no R/R it will be near perfect.
How to use this:
Add it to your chart to get the strategy inputs. (The strategy is really only useful on a 15min TF. However the indicator within it can be used on anything at anytime!)
Watch the yellow and aqua moving averages, these are your ema's and crossover's will trigger signals based on your integer inputs.
Find Correlation between other leading indicators, as well as crossover's down/up and a red/green alma.
DO NOT use the arrows as buy/sell signals. These are simply to show ema's are crossing under or over. Momentum indicator's paired with this can be useful to determine if it could be a buy signal or sell signal.
Cheat Code's Notes:
Almost at 1000 boosts!!! I appreciate the support from everyone and I will keep trying my best to deliver quality strategies for the people.
-Cheat Code
BYBIT:BTCUSDT

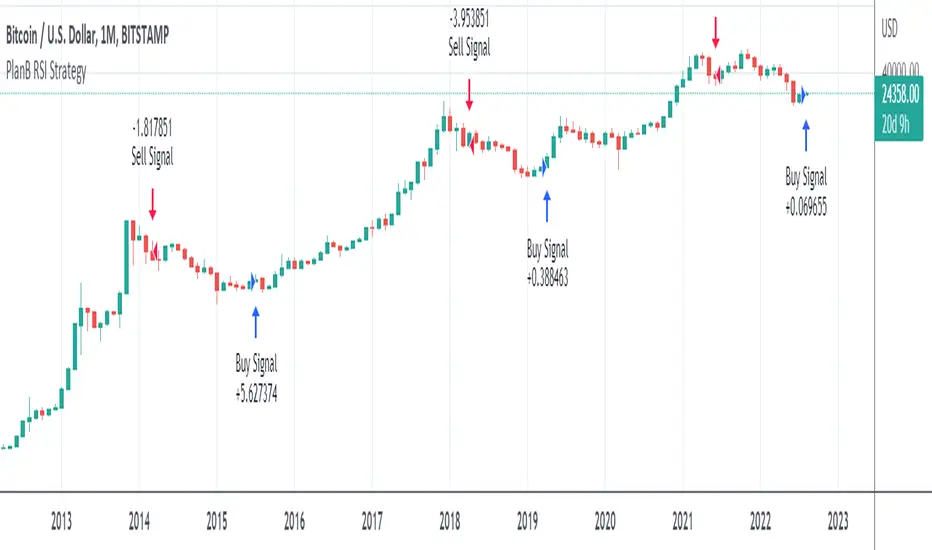
PlanB Quant Investing 101 v2This script has been Inspired by PlanB Article Quant Investing 101.
With this script, I implemented Plan B strategy outlined in that article, trying to reproduce his findings independently and allowing TradeView Users to do the same.
PlabB is aware of this effort, and he's positive about it, via Twitter commenting, liking and sharing of this resource .
Trading Idea:
This script uses RSI index to determine the Buy And Sell signal.
As per the original PlanB article:
IF ( RSI was above 90% last six months AND drops below 65%) THEN sell,
IF ( RSI was below 50% last six months AND jumps +2% from the low) THEN buy, ELSE hold
My simple code is aimed at replicating his study in Pine so that every TV user can check his signal.
IPB_JPMUPS_2022Introduction :
This indicator serves two purposes
a) It is a multi dimensional floor pivot indicator, which takes its concepts from Secrets of Pivot Boss book of Frank Ochoa. Most of the indicators suggested in the book are packed in one indicator.
b) It also has an inbuilt intraday strategy which identifies trend, direction and momentum based on CPR (Central Pivot Range) concepts and accordingly comes up with trading signals.
How this indicator is different from the published ones :
A). Role as an indicator
This indicator has all the CPR (Central Pivot Range) indicators packed together which provides a ready made solution for CPR based trading. The following are the salient features of this indicator :
1) This indicator plots daily CPR using previous day high, low and close. It also plots Support and Resistance levels based on floor pivots formula.
Moreover, it also plots developing CPR which is based on current day's high, low and close. Apart from that it also plots CPR for next day session as well which is useful for EOD analysis.
2) This indicator plots weekly CPR using previous week high, low and close. It also plots developing CPR which is based on current week's high, low and close.
3) This indicator plots monthly CPR using previous month high, low and close. It also plots developing CPR which is based on current month's high, low and close.
4) This indicator plots pivot EMA which is called PEMA. It uses three different EMAs which are customisable and uses them to plot a moving average web based on pivot points of each candle, which is called as PEMA. This also facilitates PEMA plotting for higher time frame (daily time frame) as well.
5) This indicator plots daily time frame moving average in intraday chart which can be used as a key zone during trading. The period is customisable.
B) Role as a strategy
This indicator also functions as an intraday trading strategy called JPMUPS (JP stands for author's nickname. MUPS stands for Manoj Ultimate Pivot Strategy). This strategy attempts to identify trend, direction and momentum and when all these three align together it gives buy and sell signals. The concepts are as under:
Trend identification :
Whenever a trend is established, the developing CPR starts to widen. Hence this strategy uses the width of the developing CPR and compares it with the MA of the width to identify the trend. If the width of the developing CPR crosses the 34 period MA (can be customised), it assumes a trend is developing.
Direction identification:
Whenever a direction is established, the CPR components, namely BC and TC shifts its position. Hence this strategy uses this concept to identify the direction. It computes MACD sort of histogram of the BC and TC difference and whenever the histogram slops upwards, it assumes bullish direction and vice versa.
Momentum identification :
Whenever momentum is established, the developing CPR starts sloping upwards. Hence this strategy uses this concept to identify the momentum. It computes RSI of the developing CPR and if the RSI is above the 34 period MA (can be customised) of RSI , it assumes momentum is establishing and vice versa.
When all the above are aligned together, it gives buy or sell signals suitably.
How to use it :
a) Indicator usage :
1) CPR zones are key zones which predominantly acts as support and resistance zones. Looking at the price action at these zones, one can look for trading opportunities in live market.
2) Developing CPR acts as pull back zones and is very useful in live trading and also EOD analysis for spotting opportunities by combining price action.
b) Strategy usage :
1). Strategy signals are only indicative. Users are strongly advised not to use the strategy blindly. Users are advised to go though the CPR concepts thoroughly and use this strategy signals only as a supplement for further decision making / analysis.
Markets meant for :
1). This indicator and Strategy is predominantly designed for I ndian stock markets . However it can be customised for other markets as well by changing the timings of the markets in the parameters.
Market conditions meant for :
1). This indicator is meant for all types of market conditions as its predominant role is to plot the key support and resistance zones using CPR concepts.
2). The strategy is mainly found to be effective in trending markets and predominantly indices like Nifty and Bank Nifty . Hence Users are advised to use this only as an indicative feature and not blindly trade based on signals. The strategy is found to be less effective in lower time frames like 1min / 3min, etc. 15 min time frame provides fair performance. However it doesnt mean that it will continue to perform in the same manner in the future.

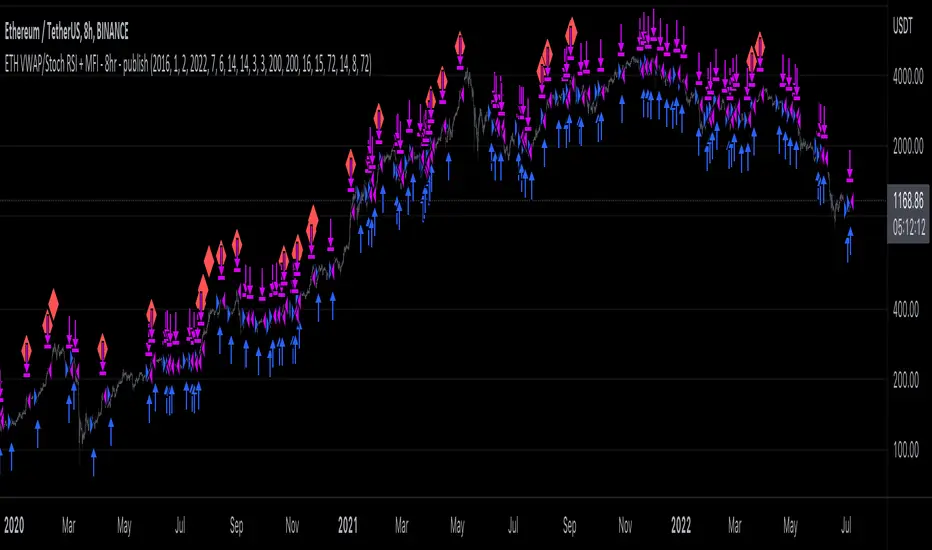
ETH long bot - 8hrThis is a high-latency algorithm, safely running on the Ethereum 8hr chart where it can execute trades on a multi-day timeframe, making it easy to enter and exit large positions and without incurring excessive commission fees.
As a long bot, this script should be ran in markets that are trending upwards. Nonetheless, the operator can be at ease knowing that the script can safely run autonomously during these extended periods. It is shown here performing full-time over a 46 month period, from January 2019 through October 2021, steadily increasing the available capital despite the asset's fluctuations. While the buy and hold return over this time was 714%, the algorithm produced a net profit 4,060%, outperforming the market by over 5.5x. This equates to a 40x return on investment in 4 years.
The strategy behind this algorithm is to always capitalize on significant jumps in the market. This is accomplished by using a simple combination of RSIs:
- One RSI uses VWAP as a source, which is primarily responsible for entering growth trends whenever they begin
- The other is a Stochastic RSI , which is primarily responsible for identifying exhausted periods of growth
These calculations are calibrated so that the bot can jump in and out of trades to improve its position when there isn't significant price action one way or the other, but is then able to remain in positions during uptrends that are backed by volume to achieve maximum gains. This strategy is reflected by the fact that while profitable trades are almost 3 times larger than losing trades, on average, they also last for an average of 6 days, whereas losing trades usually last about 2.
[Pt] Premarket Breakout StrategyThis is a 1 trade per day strategy for trading SPY or QQQ index. By default, this is designed for 1 min time frame. This was an experimental script that seems to be profitable at the time of publication.
How it works:
Pre-market high and low is defined per trading day between 9:00 to 9:30 EST.
Then we looking for the first breakout on either PM high or PM low.
- Breakout high = long trade
- Breakout low = short trade
If long trade, we wait until Stochastic RSI D signal line to hit a lower threshold (18 by default). Then we enter long when K crosses above D line.
If short trade, we wait until Stochastic RSI D signal line to hit an upper threshold (82 by default). Then we enter short when K crosses below D line.
Stop loss for long
- set to PM low if entry is above PM high + %ATR buffer
- or set to PM range + %ATR buffer
Stop loss for short
- set to PM high if entry is below PM low + %ATR buffer
- or set to PM range + %ATR buffer
Profit target is set to 2x the risk by default.
*Note: Different Stochastic RSI lengths should be used if trading 5 min time frame. See tooltip.
Happy trading~~!

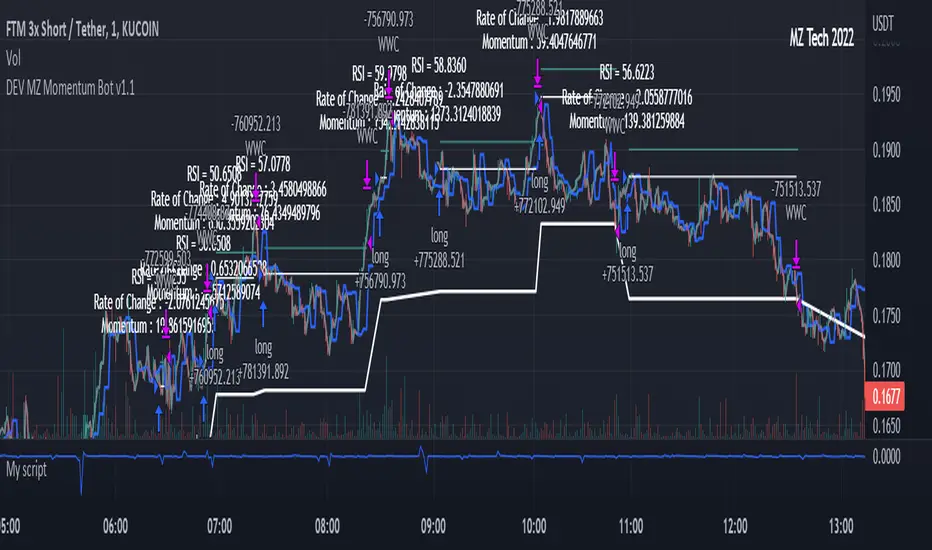
MZ Momentum Non Repainting HTF HFT Scalper BotThis is an original script meant to be a high frequency trader that works on higher time frame calculations. I came up with the idea that using calculus I can figure out the actual rate of change and momentum with different calculations than the momentum indicator that is provided by trading view. Once momentum is shifted on a small time frame, it will provide an entry signal. The script is meant to be used on an algorithmic trading system for scalping purposes. It should be run on a one minute time frame.
Set it up on a one minute chart - setup your bot on a one minute interval.
Find the source of your data. You can use any time frame, open, close. high, low, olc4. Open is pretty much guaranteed to not have any repainting issues - although all the other calcs use a custom isbarconfirmed security repaint calculation.
Set your rate of change period - typically I use a one minute time frame for this as well - but set my length fairly long (30-40).
Then set your period for momentum calculation. This will sample the rate of change data to figure out your momentum. I typically try a setting of 6-8. If that doesn't work, try setting it about the same as the rate of change period and add or subtract a few from there.
Unfortunately due to various plotting constraints in Pinescript, you cannot plot the rate of change and momentum and price in the same.
Set your trigger point. I try values -30, -20, -10, 0, 1. Then finesse to get an earlier entry signal. You should account for a slight delay from the signal to the actual entry. Your backtest should test well, but please note that does not gaurantee results. In my findings, I have seen that there is a slight minimal delay between signal to entry and that can make the difference whether your trade is profitable or not.
Use the show data to show you additional data when you are backtesting. This can allow you to try to filter out results or market conditions that do not work. I typically work with the RSI and use the 30 minute and 15 minute RSIs. I make sure that it is trading within a certain band - about 40-75. You can try the inverse and only buy during really low RSI's as well.
Use the enter and close messages to setup your webhook messages. But I recommend to allow the algo trading platform to close the trade for you based on their calcs since that platform knows the actual price level and when it has become profitable.
Filters have been setup for
Moving Average Variants - any time frame, any length.
RSI - Any time frame, any length,
Future Plans: ATR Filter so you can filter out low volatility periods.
Send me a message with any suggestions.
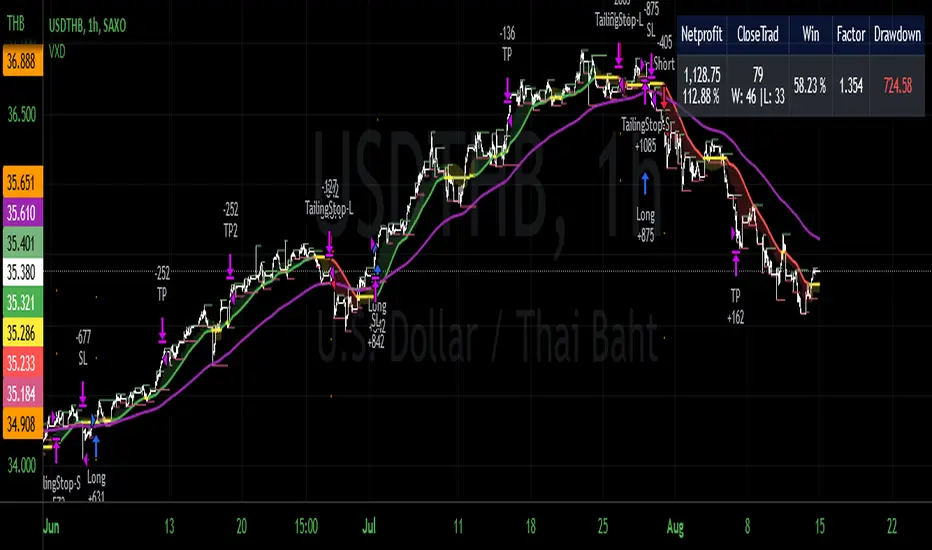
VXD Cloud EditionVXD Cloud Edition.
to overcome sideways market conditions this cloud configured for low timeframe.
every TA is same as VXD Supercycle but show as cloud.
Symbols on chart show Premium and Discount Prices
X-Cross = Engulfing Candle with weak volume .
O-circle - Engulfing Candle with strong volume .
Pivot point and Rejected Block
Pivot show last High and low of a price in past bars
Rejected Block show when that High or Low price are important level to determined if it's Hidden Divergence or Divergence (with RSI)
Setting
Momentum: RSI = 25 , RSI MA = 14
Trend: Rolling VWAP and ATR and Subhag (Everthing show as a cloud)
Trailing STOP: ATR 12 x 2.4
Highlight Bars color when volume is above SMA 6
SMA200 act as TP Line
Risk:Reward Calculation
if Buy your Stoploss will be previous Pivot low
if Sell your Stoploss will be previous Pivot high
and TP line will be calculated form there, then show in Orange color line
Buy condition : Close is above Cloud and close above pivot high
Sell condition : Close is below Cloud and close below pivot low
Trip : add this to alerts setting.
Order {{strategy.order.action}} filled on {{ticker}} @ {{strategy.order.price}} {{strategy.order.alert_message}}.
Gap Reversion StrategyToday I am releasing to the community an original short-term, high-probability gap trading strategy, backed by a 20 year backtest. This strategy capitalizes on the mean reverting behavior of equity ETFs, which is largely driven by fear in the market. The strategy buys into that fear at a level that has historically mean reverted within ~5 days. Larry Connors has published useful research and variations of strategies based on this behavior that I would recommend any quantitative trader read.
What it does:
This strategy, for 1 day charts on equity ETFs, looks for an overnight gap down when the RSI is also in/near an oversold position. Then, it places a limit order further below the opening of the gapped-down day. It then exits the position based on a higher RSI level. The limit buy order is cancelled if the price doesn't reach your limit price that day. So, the larger you make the gap and limit %, the less signals you will have.
Features:
Inputs to allow the adjustment of the limit order %, the gap %, and the RSI entry/exit levels.
An option to have the limit order be based on a % of ATR instead of a % of asset price.
An optional filter that can turn-off trades when the VIX is unusually high.
A built in stop.
Built in alerts.
Disclaimer: This is not financial advice. Open-source scripts I publish in the community are largely meant to spark ideas that can be used as building blocks for part of a more robust trade management strategy. If you would like to implement a version of any script, I would recommend making significant additions/modifications to the strategy & risk management functions. If you don’t know how to program in Pine, then hire a Pine-coder. We can help!

Customizable Non-Repainting HTF MACD MFI Scalper Bot StrategyThis script was originally shared by Wunderbit as a free open source script for the community to work with.
WHAT THIS SCRIPT DOES:
It is intended for use on an algorithmic bot trading platform but can be used for scalping and manual trading.
This strategy is based on the trend-following momentum indicator . It includes the Money Flow index as an additional point for entry.
HOW IT DOES IT:
It uses a combination of MACD and MFI indicators to create entry signals. Parameters for each indicator have been surfaced for user configurability.
Take profits are fixed, but stop loss uses ATR configuration to minimize losses and close profitably.
HOW IS MY VERSION ORIGINAL:
I started trying to deploy this script myself in my algorithmic trading but ran into some issues which I have tried to address in this version.
Delayed Signals : The script has been refactored to use a time frame drop down. The higher time frame can be run on a faster chart (recommended on one minute chart for fastest signal confirmation and relay to algotrading platform.)
Repainting Issues : All indicators have been recoded to use the security function that checks to see if the current calculation is in realtime, if it is, then it uses the previous bar for calculation. If you are still experiencing repainting issues based on intended (or non intended use), please provide a report with screenshot and explanation so I can try to address.
Filtering : I have added to additional filters an ABOVE EMA Filter and a BELOW RSI Filter (both can be turned on and off)
Customizable Long and Close Messages : This allows someone to use the script for algorithmic trading without having to alter code. It also means you can use one indicator for all of your different alterts required for your bots.
HOW TO USE IT:
It is intended to be used in the 5-30 minute time frames, but you might be able to get a good configuration for higher time frames. I welcome feedback from other users on what they have found.
Find a pair with high volatility (example KUCOIN:ETH3LUSDT ) - I have found it works particularly well with 3L and 3S tokens for crypto. although it the limitation is that confrigurations I have found to work typically have low R/R ratio, but very high win rate and profit factor.
Ideally set one minute chart for bots, but you can use other charts for manual trading. The signal will be delayed by one bar but I have found configurations that still test well.
Select a time frame in configuration for your indicator calculations.
Select the strategy config for time frame. I like to use 5 and 15 minutes for scalping scenarios, but I am interested in hearing back from other community memebers.
Optimize your indicator without filters (trendFilter and RSI Filter)
Use the TrendFilter and RSI Filter to further refine your signals for entry. You will get less entries but you can increase your win ratio.
I will add screenshots and possibly a video provided that it passes community standards.
Limitations: this works rather well for short term, and does some good forward testing but back testing large data sets is a problem when switching from very small time frame to large time frame. For instance, finding a configuration that works on a one minute chart but then changing to a 1 hour chart means you lose some of your intra bar calclulations. There are some new features in pine script which might be able to address, this, but I have not had a chance to work on that issue.

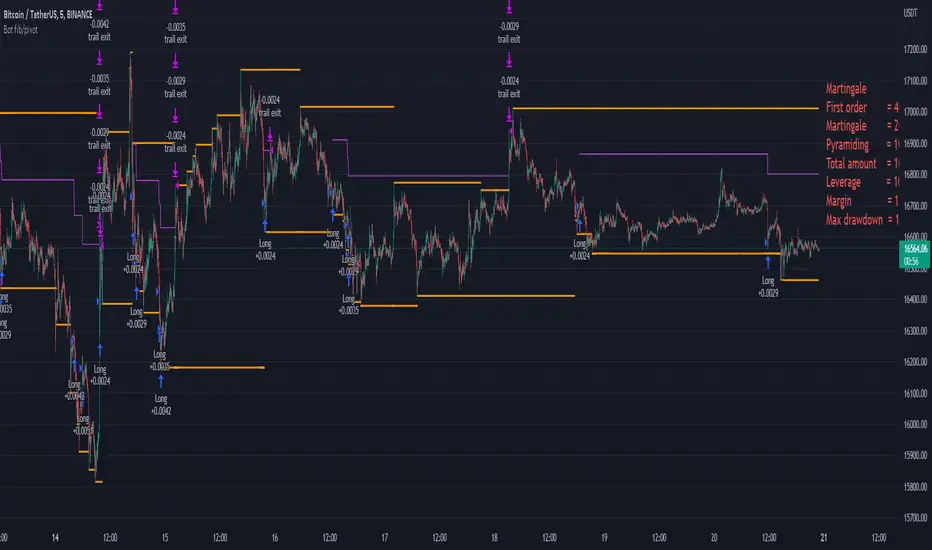
Bot fib/pivot Hello, friends!
This strategy is based on the fibonacci level you choose in the setup and possible pivot points under the control of Williams’ Percent Range.
Williams' Percent Range is a dynamic indicator that detects overbought/oversold conditions.
When the possible reversal points coincide with the fibonacci level, and the high or low points according to Williams also coincide, then an entry occurs.
One of the oldest and most reliable trading tools are widely used support and resistance levels.
In this strategy, we are trying to find these reversal levels based on fibonacci.
//LOGIC ENTRY SETTINGS
Deviation-deviation from the pivot point, the lower this figure, the more entries. The yellow lines on the chart are pivot points.
Fibonacci lvl-fibonacci level, from which the entry will occur, provided that other conditions match
Highest lookback-The setting, which refers to Williams' Percent Range , looks at how many candles ago, was high or low. The smaller the number, the larger, but less accurate inputs.
//AMOUNT(USDT) FIRST ORDER AND > % NEXT
-Martingale first order (the amount of the entrance to the usdt) / next order (Increase of each subsequent order as a percentage)
//EXIT SETTINGS (%, RSI)
-Use RSI for close position? (the position will not be closed if it is in the red, even if the RSI conditions worked)
-Use % for exit? Exit immediately upon reaching the specified percentage
-Use trailing? When the checkbox is checked, the position will be exited by trailing.
Activation trail,after?- When the specified percentage is reached, trailing is activated!
Stop_trail,%- if the last candle falls from the high (after the trailing is activated), the position will be exited.
For example:
We entered the purchase at 100 per asset, activation costs 10, and stop is 2.
the price reached 110, there was an activation, after that it went up to 120, and from the high of the last candle, a 2% drop occurs and the trade is exited.
PS:The default value is 1%, what does this give us? if there is a sharp increase, then we take away all the movement
Use only long?
Allow long?- Only long trades will be displayed
Allow short? Only short trades will be displayed
Allo reverse? Upon receipt of a return signal, the opposite position will be closed.
//MARTINGALE GRID
If there is a check mark in the line "Use martingale and grid?"
then the grid will be active
If there is a check mark in the "Limit each next entry,%?" then, even if the entry from the bot logic is triggered, and the price does not fall by the specified percentage, then there will be no entry!
If there is a check mark in the "Grid,%" column, then purchases with martingale support will be added with a decrease by the specified percentage!
PS: "Grid" always starts anew, as the input from logic triggered!
//FILTER SETTINGS
1) Use filter oscillator? (The filter uses 7 averaged oscillators)
Period-the period for which you will be billing
Upper line-Short entry border.
(if 40, then there will be no entry until it reaches)
Lower line-Long entry border.
(20 until below 20 no entry)
2)Use filter range?
Filter type-moving average selection
Bars back-offset speed based on number of last bars
Period-period to calculate
3)Use filter supertrend?
Supertrend filter with multitimeframe
// How do filters work 2 and 3?
Filters can work either one by one or together.
A trade is entered when conditions from the logic and filters in the red zone are triggered, when there are no entries in the green zone.
//DATA RANGE:
-Testing results for any period of time
//PIRAMIDING
-Also in the settings there is a pyramid of order, keep this in mind. Make a deal for a small part of the deposit, and not for all the money at once!
PS: to use martingale, you need to write in the hook messages:
"amount": "{{strategy.order.contracts}}" (purchases will be in the amount of coins equivalent to USDT)
The default settings for TF are 1 minute, 10 inputs.
You can choose your settings for any TF, but look at different coins to make sure you have good statistics
The Brain Trust Presets Strategies [BTC / ETH] [PrismBot] [Lite]This strategy contains 9 different timeframe strategies (2 strategy types with pre-adjusted filter options for the different timeframes) tailored to BTC ( Bitcoin ) and ETH ( Ethereum ) on Binance. While I've listed these prebuilt strategies for specific timeframes, they are versatile enough to be checked and tested on other timeframes, and exchanges as well. I have been careful to avoid any curvefitting or overfitting. Included is useful default order settings, but we wanted to ensure you, the user, has control over the order settings for your own equity and trading.
These strategies are created, tailored, tested, and actively used by me.
It is up to you to do your own due diligence when testing these strategies on your exchange, and for your use, and PrismBot bears no responsibility for losses from the use of these strategies.
These strategies employ a variety of methods. Notable inclusions are other live strategies of mine including but not limited to:
ADX + MACD
RSI
Consolidations
Bull Bear Power
Volume Calculations
Open Interest Data
All of these setups include trend trading methods intended to maximize profitability in strong trending markets, and filters deployed to prevent failures in consolidation, though nothing is failproof.
You can control your leverage, quantity calculations, and other order settings. However, all other strategy input parameters are controlled by the strategy selectors.
Some strategies use 1.5 to 1 Risk to Reward ratio while others use 1:1.
How we execute trades for each strategy:
For 10m and 45m
we use a variety of settings for a Normalized MACD and ADX indicator. The thesis is we detect Normalized MACD crossovers at specific values and only allow trading of the strategy when the ADX is above a specific value.
For 15m, 1H, and 45m
we utilize the RSI crossovers of overbought and oversold and use the RSI moving average to filter trades. The thesis is we detect overbought for long and oversold for short.
For each strategy we use additional filters such as Bull Bear Power, Volume Flow, and Open Interest calculations to simply validate a trade.
Automatic Mode
In automatic mode, we detect your timeframe and current coin chart to decide one of the strategies from our database. If you want to manually select a different strategy or try the strategies on different cryptocurrencies, you can disable automatic mode entirely.

RSI_Boll-TP/SLThis strategy is originally "Bollinger + RSI , Double Strategy (by ChartArt)"
I added just TP/SL exit point, position direction selection(long, short or both) and time window into that strategy.

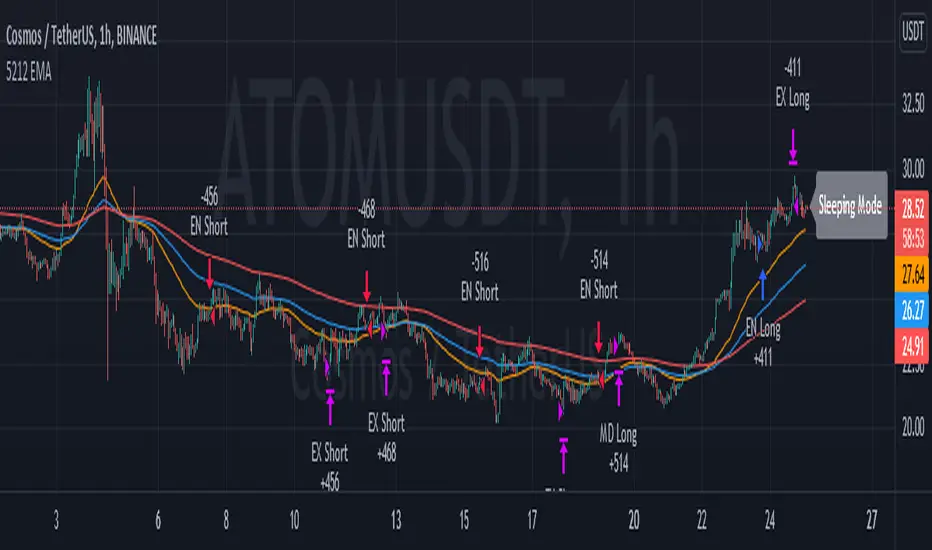
5212 EMA Strategyver 01
23 December 2021
This strategy using :
- 3 EMA period 50, 100, 200
- stochastic RSI slow
Long Cond :
- Stochastic RSI cross below 20
- EMA 50 > 100 > 200
Short Cond :
- Stochastic RSI cross above 80
- EMA 50 < 100 < 200
Sleeping Mode
- EMA 50 between EMA 100 & EMA 200
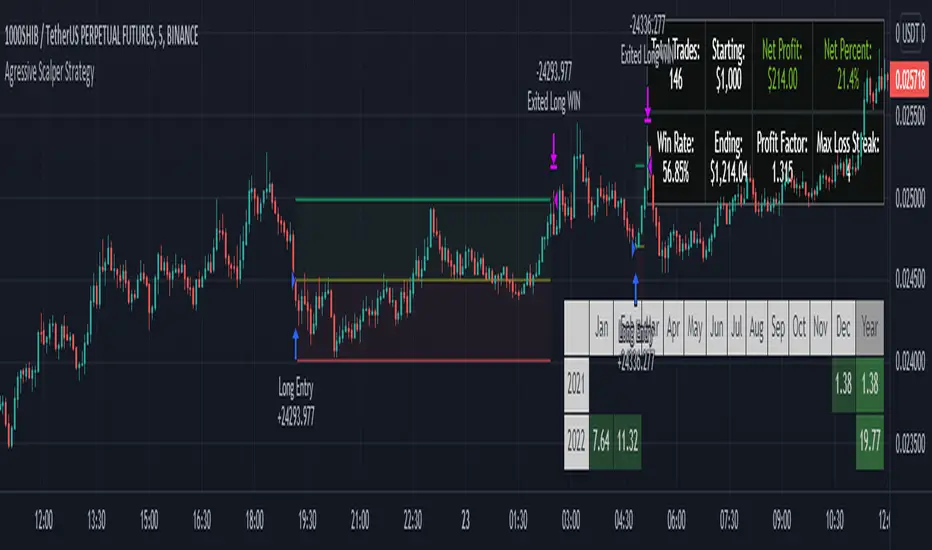
Agressive Scalper StrategyAfter many different tests and tries we found a strategy which is suited for people that likes to trade in shorter time frames. It uses multiple indications for entries. Entries include indications like Double ATR, Consolidation Detection, Dynamic RSI Calculation with Overbought and Oversold lines and also previous bars highs and lows. Although this strategy has been coded and tested on short time frames, after many additions it turns out it can be very profitable in every time frame if you play with the settings. Also it has some helpers for people that likes to optimize and see how their choices affects the outcome.
The strategy calculates the entry with the rules below:
LONG ENTRY RULES
- Price must be in consolidation zone
- Fast ATR Must be higher than Slow ATR
- Dynamic RSI must be below the oversold line (Green Line as Default)
- The Signal lookback must allow entry. (For example if you set signal lookback to 5, if the LOW of current price is LOWEST point of last 5 bars it is okay to enter LONG) If you check the lookback helper it will show you as green arrow at the bottom.
SHORT ENTRY RULES
- Price must be in consolidation zone
- Fast ATR Must be higher than Slow ATR
- Dynamic RSI must be above the overbought line (Red Line as Default)
- The Signal lookback must allow entry. (For example if you set signal lookback to 5, if the HIGHEST of current price is HIGHEST point of last 5 bars it is okay to enter SHORT) If you check the lookback helper it will show you as red arrow at the top.
This strategy has additional settings that are not available in indicator version that is previously released so i suggest everyone to use this instead.
Happy trading everyone!