RSI Long Only with Confirmed CrossbacksThis RSI-based long-only strategy aims to identify and trade potential reversals with confirmation to reduce false signals. It enters a long position only after the Relative Strength Index (RSI) first dips below a specified oversold threshold (default 44) and then crosses back above it, signaling a possible bullish reversal with momentum. The strategy avoids premature entries by requiring this two-step confirmation. Similarly, it exits the long position only after RSI first rises above the overbought threshold (default 70) and then crosses back below it, indicating a potential loss of bullish momentum. By waiting for RSI to travel beyond the thresholds and then revert, the strategy attempts to capture stronger and more reliable directional moves while filtering out temporary spikes.
"rsi" için komut dosyalarını ara

RSI of MACD Strategy [Long only]This strategy uses the RSI on MACD indicator.
BUY
====
When RSI indicator crossing over 30 or 35 line and price above slow ema
Note: when the position already taken, you may reenter on the purple candle
Partial Exit
==========
Partial profit taking option is available in settings. If this is selected , 1/3 position exited when RSI indicator crossing down 80 line
Close
=====
When RSI indicator crossing below 15
Stop Loss
=========
I havent used hard stop loss in this strategy. Reason is , when price going down , indicator may go up ... so just wanted to ride along with indicator ...
Stop loss mentioned in the settings is used in calculation of how many units can be be purchased based on risk level
Tested with SPY and QQQ ETFs on hourly chart
Warning
=========
For the eductional purposes only ...
This is not a financial advise. please do your own research before taking any trading decission

Rsi BotOk This is MTF RSI bot
it has two way to approach it . one is strict with no repaint at all , just click to remove the repaint in the menu .
its still make profit but sure not crazy unrealistic one:)
The other option is the "repaint version" which is under my special repaint control system (not perfect but since we can never truly control the repaint the signal may be not perfect ) , but in general it not so much repainting :)
to verify just use the bar control to see how it work.
the buy and sell depend on the rsi crossing oversold and overbought level that you can control in the menu
Also in the menu you see a factor . this has two function . since it based on % , when you buy you want to be buying in upswing
so let factor let say of 0.8 (is 0.8% above the entry ) this to make sure we buy in upswing and vice versa when we sell. this to correct many wrong entry of the rsi . the other function is important in the repainting model since it reduce the repainting by allot.
the min distance in menu is to control the difference between the two rsi (red color and the blue color= slow and fast)
for Forex i find factor of 0.1 % in the repaint model to work find
on Crypto best is between 0.5 to 1
there is option to check and see if stop loss and take profit improve your profit or not (i put both on very high level so it will not be a factor but you can change it as you wish
you can test to see if it better to go longs or shorts in this model or both direction
i put the setup of 50% eqiuty maybe it too much but it you choice if you test the model to reduce it to proper amount (best is 10-30%)
The repainting model is much more profti but does not matter what i do to correct it is sometime repaint. most of time it actual work fine so it your choice if you want to use it or not . just be sure on what you are doing if you put money on it
the non repaint model is much more safe nut much less profit. still it can make profit with proper setting can work very nice
so if you are not sure what you doing the use the more stable one and remove the repaint in the option
if you have any question just pm or write remarks

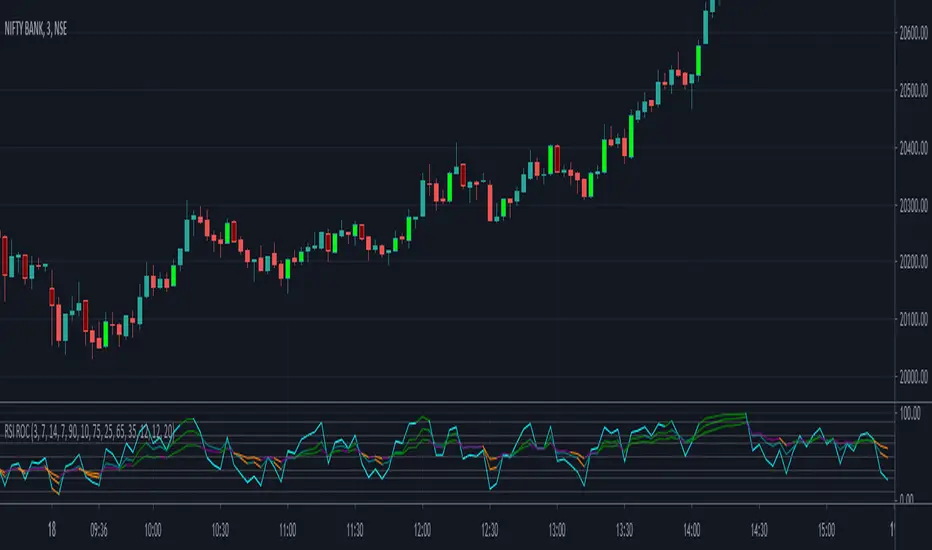
RSI - Rate of ChangeCode based on RSI lower value crossing over higher value
RSI Rate of Change of different lengths used in all parts of code
ADX and CCI use is limited in V1.0
Script provides 3 RSIs and overbrought and oversold for each of these RSIs. When RSI cross over each other clearly Buy and Sell signals are fired.
Lime is buy and Maroon means sell. Use it along with EMA
RSI Box Strategy (pseudo- Grid Bot)This is a strategy intended primarily for algorithmic traders. It's a pseudo-grid bot that uses a dynamic, volume-weighted grid that only updates when the RSI meets certain conditions. It's also a breakout strategy, whereas normal grid bots are not (typical grid bots sell when a higher grid is reached, whereas this strategy sells when a lower grid is breached under specific conditions). This strategy also sells 100% of pyramiding orders on close.
In a nutshell, the strategy updates its grid to the volume-weighted highest/lowest values of your given source ("src" in the settings) each time that there is a RSI crossunder/crossover. From this range it produces an evenly-spaced grid of five lines, and uses the current source to determine which grid line is closest to the source. Then, if the source crosses over the line directly above the current line, it enters a buy order. If the source crosses under the line directly below the current line, it enters a sell order.
You can configure shorts, source, RSI length, and overbought/oversold levels in the settings.
For the strategy results below: fees are at 0.1% per trade, with order size 1% of equity and a max pyramiding value of 33. For a greater R/R profile, you can increase the order size, which will increase drawdown but potentially yield better results.

RSI Improved strategySet a Horizontal Ray at the price that relates highest / lowest RSI .
It 's more clear to decide when to open long / short position manually.
It's a scalping strategy that works in 15min chart(basically works in most of timeframe , if you don't look it as a scalping strategy), when RSI hits Highest / Lowest value , the strategy will open a Long / Short position.
The Default Risk Reward Ratio was 1 (1600 points : 1600 points) you can adjust it in settings
You guys can look it as a RSI alert indicator
Think before you do , use it wisely. Thanks a lot!
There is a lot of useless words in Pine if you wanna look it please ignore it.

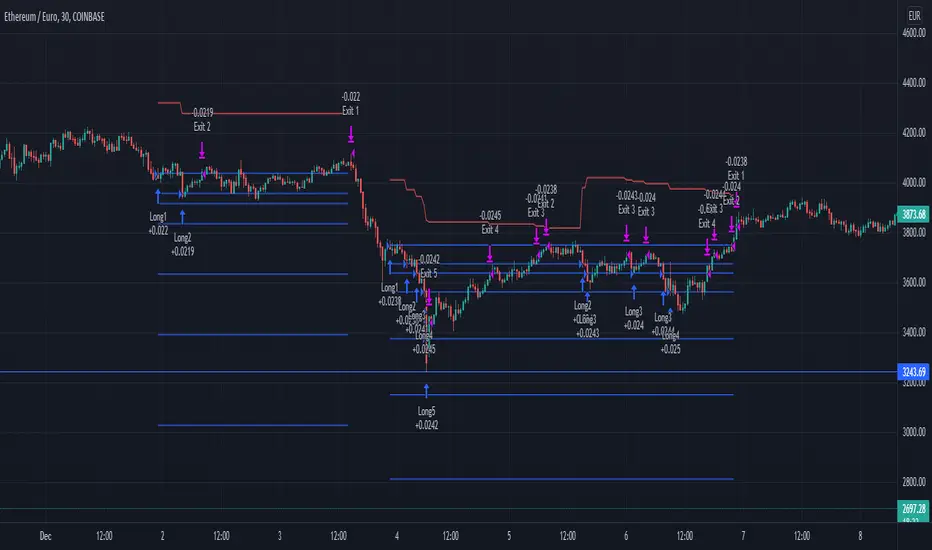
RSI+PA+PrTPHi everybody,
This strategy is a RSI, Price Averaging, Pyramiding Strategy based on the earlier RSI+PA+DCA strategy. See below.
For this slightly different strategy I left the DCA option out and instead focused on the Take Profit calculation. In the previous strategy the Take Profit was directly connected to the Average Price level with a specified take profit %. When the price reached the Take Profit all positions where exited. The strategy opened multiple position based on the PA price levels. The separate positions can close when they reach separately specified Take Profit Limit. Each time the prices crosses the PA layer again the position can be re-opened. This causes the average price to drop each time a separate position is opened and closed.
I thought it was an interesting way to minimize losses and in general it works fine. Only when the market goes bearish it can cause significant losses
For the lack of a better word, I dubbed it Progressive Take Profit. The PrTP works different and is less risky. It doesn't directly follow the average price development and is calculated for a part based on the estimated profits of the separate closed positions. Every time a separate position is closed, the profit of that position is deducted of the Take Profit Limit. This causes the Take Profit Limit to drop les drastically then the average price and the whole position will only be closed when the separately opened and closed positions made up for the biggest losses.
There are still some aspects in the puzzle that are not fully worked out yet and I am still working on it, but I wanted to share this idea already and maybe you have some thoughts about it.
The next step is to re-implement a better worked out DCA function.
To be continued.
RSI StrategyThis RSI strategy will allow you to go long when RSI is overbought and go short when RSI is oversold. You can also change the checked boxes to reverse this. Uncheck "Overbought Go Long & Oversold Go Short" and check "Overbought Go Short & Oversold Go Long" to use this reversed option.
You can also choose to use an ema filter as an additional qualifier for entry. Uncheck "No EMA Filter" and check "Use EMA Filter" if you want to use it.
Be sure to enter slippage and commission into the properties to give you realistic results.
I've also built in backtesting date ranges and the ability to trade only within certain times of day and have it close all trades at the end of that time frame. This is especially useful for day trading stocks. To specify a time from use the format 0930-1100 or whatever your trading hours will be. Check off "Enable Close Trade At End Of Time Frame" to close the trade at the end of your trading hours.
You can also specify a % based take profit and stop loss. Also keep in mind that the way this code is designed if you use the stop loss and/or take profit and it reaches either target and closes, then it will immediately re-enter if the condition for long or short entry is true.
Finally there's custom alert fields so you can send custom alert messages for strategy entry and exit for use with automated trading services. Simply enter your messages in the fields within the strategy properties and then put {{strategy.order.alert_message}} in your alert message body and it will dynamically pull in the appropriate message.

RSI Rising Crypto Trending StrategyThis is crypto and stock market trending strategy designed for long timeframes such as 4h+
From my tests it looks like it works better to trade crypto against crypto than trading against fiat.
Indicators used:
RSI for rising/falling of the trend
BB sidemarket
ROC sidemarket
Rules for entry
For long: RSI values are rising, and bb and roc tells us we are not in a sidemarket
For long: RSI values are falling, and bb and roc tells us we are not in a sidemarket
Rules for exit
We exit when we receive an opposite direction.
Cuation: Because this strategy uses no risk management, I recommend you takje care with it.
If you have any questions, let me know !

RSI Mean Reversion Bot StrategyI started developing this strategy as a way to plug in and test values before defining them in the bots on 3Commas, Coinrule, and Quadency. None of those bots performed the same way my script did and I kept working on it until the strategy finally yielded the same simulated results when paired with the Tradingview bot on Quadency. I looked at all the different RSI strategies already published and saw what each was missing and changed it in mine to make it better:
1. Backtest an actual timeframe by date and time
2. Define the RSI price source
3. Fully manipulate the RSI length
4. Define a stop loss that works
5. Pick Long or Short, or both, based on market conditions. Or compare side by side to decide which you want.

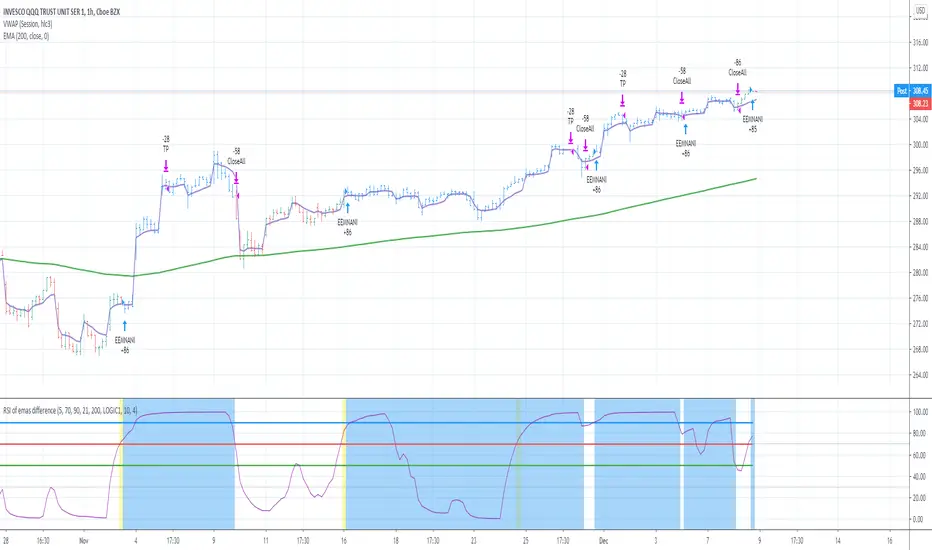
RSI of emas difference [ EEMANI ]This strategy is found by error.
Initially I started to find the weekly version of RSIofVWAP strategy. somehow I didn't see good results. Then , on the same script I did change it to find rsi emas difference strategy.
while changing the code , for the long term ema /slow ema input , I had entered fastema value instead of the price close. That is the error.
But strategy showed good results , then I extended it to add stop loss and take profits. Since this is found by error, I cant explain much how it is working.
Please check if your symbol works with this strategy and let me know ... your feedback is greatly appreciated to improve the strategy ...
I name it as EEMANI strategy
BUY
======
When the RSIofEMAsdiff is crossing above 70 (buy Line) and fastEma is rising
Note:
On the indicator it shows yellow background ... thats the entry point ....
when strategy is already in Long position , if you see yellow back ground thats where you can add or enter if you missed earlier signal
background and bar color color changes to blue when strategy is in Long position
Partial Exit
=========
when RSI value reaches 99 , 1/3 of the position si closed with profit
Close
======
when RSI value crossing down 90 (exitLine)
Stop Loss
=========
defaulted to 4% (increasing this value might improve the performance , but number of bars will go high , that means you need to wait longer time to get out of the trade ... Thats boring !!!
Note :
I have added two formulas , both of them are produce similar results. But different equities on different logic. check which formula is working for you
LOGIC1 => fastEMAval-slowEMAval
LOGIC2 => (slowEMAval+fastEMAval)/weeklyVwap
Warning
=========
For the use of educational purposes only
RSI of VWAPThis strategy inputs the vwap as source to RSI indicator.
ENTRY
When RSIofVwap crossover 70 and price is above ema200
partial exits
when RSIofVwap reaches 90 level take a portion of profit
Exit
When RSIofVwap crossdown 30
stoploss
defaulated to 5%
Risk Level
Defaulted to 10%. Based on this startegy calcuclates hiw many units can be purchased adhering to stoploss value
Note: code doesnt draw the RSI (vwap) indicator to the chart. if you want to see how these signals are generated , you can select RSI and VWAP of 14 period length.
warning
For educational purposes only

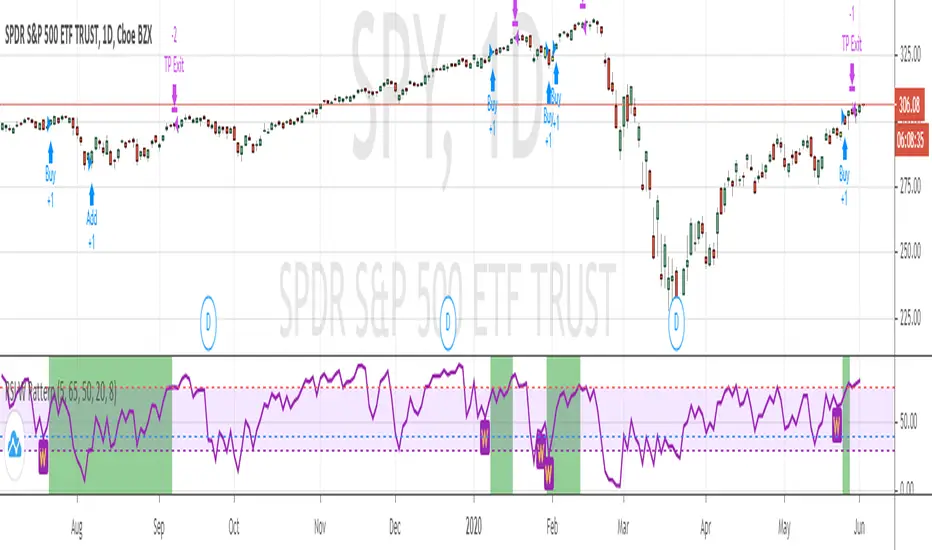
RSI W Pattern strategyThis strategy is similar to RSI V pattern strategy, but it looks for W pattern in RSI chart.
RULES
======
BUY
1. ema20 is above ema50
2. RSI5 crossing up 30 from oversold area
3. and RSI5 must be below overbought area (default value set to 65)
Add to existing Position
1. You can add on the next W pattern OR
2. if RSI5 is crossing up from below 20
Exit
1. when RSI5 reaches 75
Note: This is for short term/swing trading . which gets on when price dip in trending and quickly gets you out on RSI overbought area
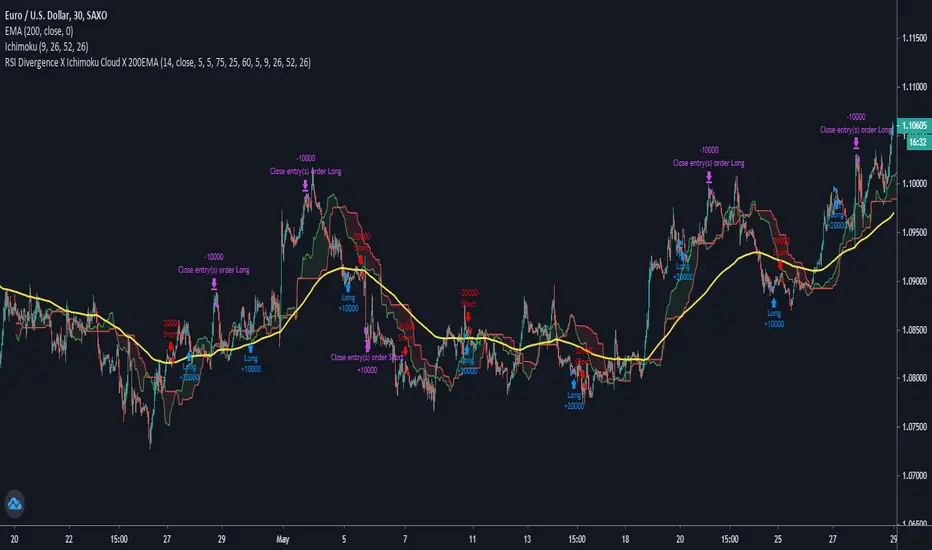
RSI Divergence X Ichimoku Cloud X 200EMAHi all,
This script is a combination of the RSI Divergence Strategy combined with Ichimoku Cloud and 200 EMA .
A long position is entered only when the RSI identifies a bullish divergence (either regular or hidden), and that the Ichimoku Cloud is above the 200 EMA . This is to ensure that there is a confirmation of a bullish trend before an entry.
Similarly, a short position is entered only when the RSI identified a bearish divergence (either regular or hidden), and that the Ichimoku Cloud is below the 200 EMA . This is to ensure that there is a confirmation of a bearish trend before an entry.
I find that this script works best on Intraday charts.
This is just a simple script I built on my third attempt of backtesting strategies on TradingView. Do give it a go and let me know if you guys have any feedback or comments about it. Happy trading!
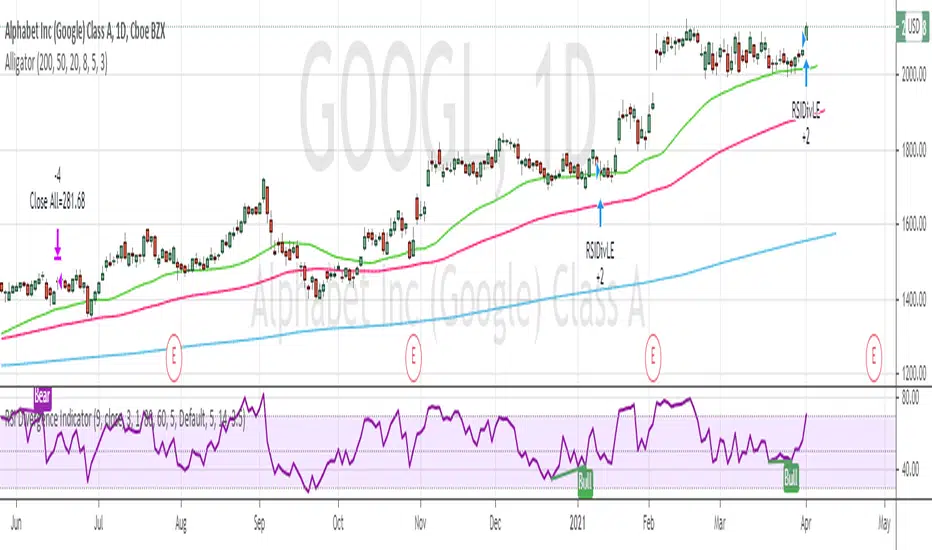
RSI Divergence Indicator strategyThis strategy is based on RSI divergence indicator.
RSI period setting 5
Go Long when Bull or Hidden Bull is shown
Exit when RSI goes above 75 OR when bear condition appears
Rsi, Ema , Ma and Bollinger Bands for 1 min BtcusdtThis is for 1 min Btcusdt pair.
I am tring to find a way to catch %1 ups and downs.
Basicly it buys when rsi low and minute candle closes under ema,ma and lower bollinger band,
it sells when candle goes over upper bb,low ma, when rsi high.
It sells when rsi high ,candle closes over upper bb,over low ma and does the opposite when buying.
I know it's crowded but still tring to learn what to do ^^
I welcome any suggestions to improve.
It works better with shorts for now.
Don't buy with this !! You might lose big !

RSI-VWAPBacktest script based on the previous RSI-VWAP indicator:
It's the popular RSI indicator with VWAP as a source instead of close:
- RSI_VWAP = rsi(vwap(close), RSI_VWAP_length)
What is the Volume Weighted Average Price ( VWAP )?
VWAP is calculated by adding up the dollars traded for every transaction (price multiplied by the number of shares traded) and then dividing by the total shares traded.
Trades are laddered to improve the average entry price and each entry is increased, improving the entry but increasing the risk of being liquidated.
It can be easily converted to study (alerts)
Settings for BINANCE:BTCUSDT at 30m

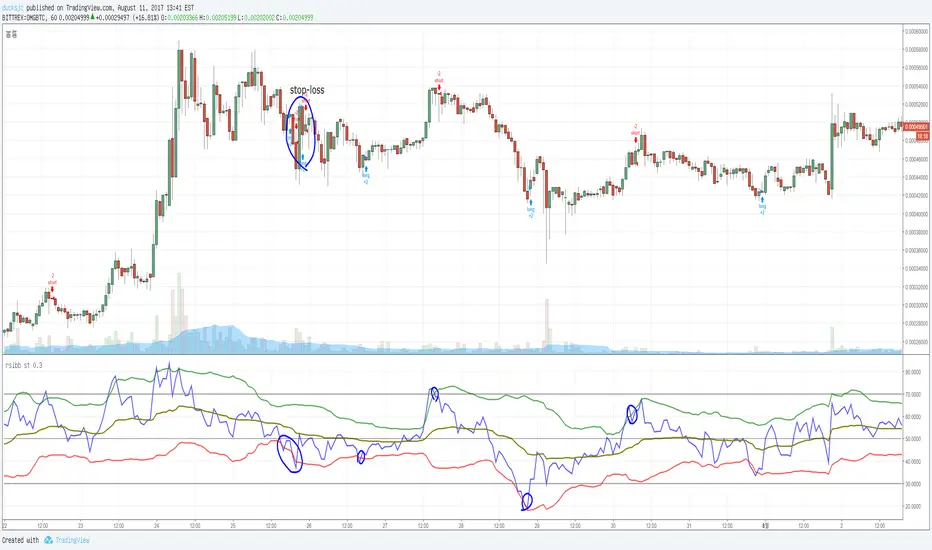
rsi+bb stadded BB in rsi .
if rsi touch green, sell.
if rsi touch red, buy.
also it has stop-loss function.
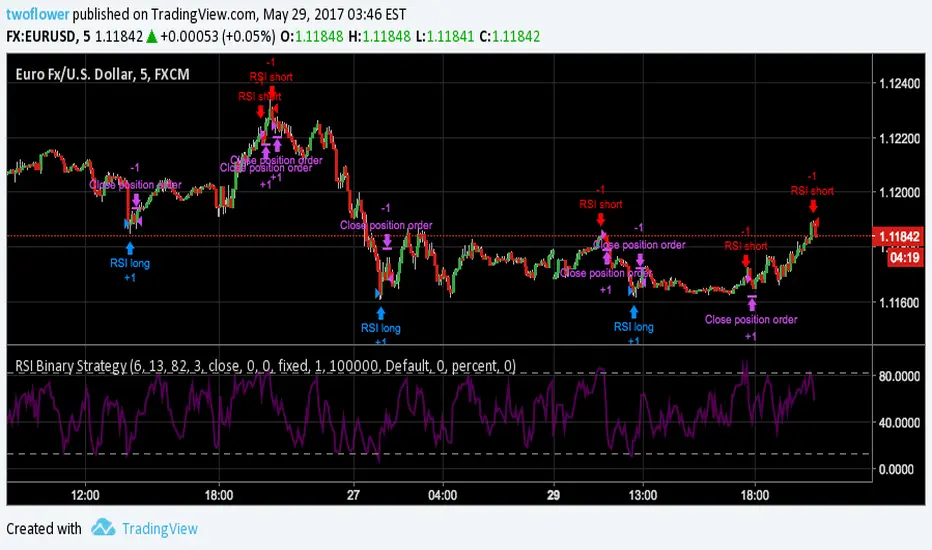
RSI Binary StrategyAnother basic strategy most people learn at the beginning of their trading carreer (like me) is the RSI strategy. This is an adaptation of the built-in RSI strategy for use in binary options. Who knows, maybe one day i will graduate to CFD trading, but my time for trading in general is limited at the moment and I am very much still at the beginning of this entire topic.
The rather specific values for the RSI bounds and length I saved have been developed for the EURUSD short term (5min.) interval, giving the highest amount of winning vs. loosing trades as of the publishing date of this script, which is the only important factor for binary options in my understanding. Use at your own risk.
Feel free to comment, give me pointers and/or recommendations.
RSI with EMA FilterThis indicator combines the Relative Strength Index (RSI) with a trend-filtering Exponential Moving Average (EMA) to generate higher-quality momentum signals.
RSI identifies overbought and oversold market conditions, while the EMA confirms the overall trend direction, helping traders avoid false signals in choppy markets.

RSI Mean-Reversion StrategyLong entry when RSI ≤ 30; exit at RSI ≥ 70. 100% equity per trade, 0.1% commission + 1 tick slippage. Optional 2% stop-loss. Visual buy/sell signals, dynamic SL line, and background highlight on oversold zones. Clean, backtest-ready Pine Script v5. Everything is easily adjustable to suit your liking.

RSI with Slow and Fast MA Crossing Strategy (by Coinrule)This strategy utilises 3 different conditions that have to be met to buy and 1 condition to sell. This strategy works best on the ETH/USDT pair on the 4-hour timescale.
In order for the strategy to enter the trade, it must meet all of the conditions listed below:
ENTRY
RSI increases by 5
RSI is lower than 70
MA9 crosses above MA50
To exit a trade, the below condition must be met:
EXIT
MA50 crosses above MA9
This strategy works well on LINK/USDT on the 1-day timeframe, MIOTA/USDT on the 2-hour timeframe, BTC/USDT on the 4-hour timeframe, and BEST/USDT on the 1-day timeframe (and 4h).
Back-tested from 1 January 2020.
The strategy assumes each order is using 30% of the available coins to make the results more realistic and to simulate you only ran this strategy on 30% of your holdings. A trading fee of 0.1% is also taken into account and is aligned to the base fee applied on Binance.

RSI Mean Reversion StrategyThis is a scalping strategy designed to be used for crypto trading. It uses an Exponential Moving Average with a default length of 100 in order to identify the trend of the market. If the price is trading above 100, it will only take long trades, and vice versa for shorts. It places long orders when the RSI value closes below 40, and the price is also above the 100 EMA. It places short orders when the RSI value is above 60, and the price is below the 100 EMA.
*Note: for custom alert messages to be read, "{{strategy.order.alert_message}}" must be placed into the alert dialogue box when the alert is set.
