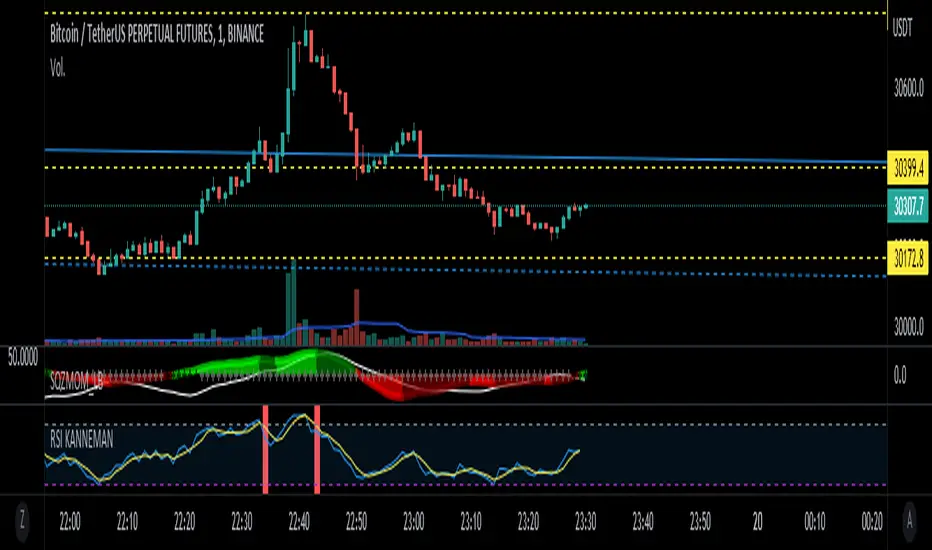
RSI Wave squeezePlots TTM Squeeze momentum histogram (green/red).
Plots RSI (blue) in the same pane.
Shows squeeze dots and RSI overbought/oversold lines.
"rsi" için komut dosyalarını ara

AK_Trend reversal_Range_Market_RSI + Stoch. RSIRSI + Stoch. RSI based indicator to predict trend reversal. Most applicable in range market

RSI and MACD Table with Cross [BY UKT]This script displays a compact, real-time dashboard of RSI and MACD values across multiple timeframes, along with the MACD cross direction (↑ / ↓) to help traders quickly assess momentum and trend strength.
▶️ Key Features:
RSI values for Weekly, Daily, 1H, 30M, 15M, 5M, and 3M
MACD values and cross status for each timeframe
Color-coded values for visual clarity (Green = Bullish, Red = Bearish)
Useful for both scalping and swing trading to get a multi-timeframe momentum overview
📌 Works on all asset classes: stocks, forex, crypto, and indices
👨💻 Developed in Pine Script v5

RSI Support & Resistance Breakouts with OrderblocksThis tool is an overly simplified method of finding market squeeze and breakout completely based on a dynamic RSI calculation. It is designed to draw out areas of price levels where the market is pushing back against price action leaving behind instances of short term support and resistance levels you otherwise wouldn't see with the common RSI.
It uses the changes in market momentum to determine support and resistance levels in real time while offering price zone where order blocks exist in the short term.
In ranging markets we need to know a couple things.
1. External Zone - It's important to know where the highs and lows were left behind as they hold liquidity. Here you will have later price swings and more false breakouts.
2. Internal Zone - It's important to know where the highest and lowest closing values were so we can see the limitations of that squeeze. Here you will find the stronger cluster of orders often seen as orderblocks.
In this tool I've added a 200 period Smoothed Moving Average as a trend filter which causes the RSI calculation to change dynamically.
Regular Zones - without extending
The Zones draw out automatically but are often too small to work with.
To solve this problem, you can extend the zones into the future up to 40 bars.
This allows for more visibility against future price action.
--------------------------------------------
Two Types of Zones
External Zones - These zones give you positioning of the highest and lowest price traded within the ranging market. This is where liquidity will be swept and often is an ultimate breaking point for new price swings.
How to use them :
External Zones - External zones form at the top of a pullback. After this price should move back into its impulsive wave.
During the next corrective way, if price breaches the top of the previous External Zone, this is a sign of trend weakness. Expect a divergence and trend reversal.
Internal Zones - (OrderBlocks) Current price will move in relation to previous internal zones. The internal zone is where a majority of price action and trading took place. It's a stronger SQUEEZE area. Current price action will often have a hard time closing beyond the previous Internal Zones high or low. You can expect these zones to show you where the market will flip over. In these same internal zones you'll find large rejection candles.
**Important Note** Size Doesn't Matter
The size of the internal zone does not matter. It can be very small and still very powerful.
Once an internal zone has been hit a few times, its often not relevant any longer.
Order Block Zone Examples
In this image you can see the Internal Zone that was untouched had a STRONG price reaction later on.
Internal Zones that were touched multiple times had weak reactions later as price respected them less over time.
Zone Overlay Breakdown
The Zones form and update in real time until momentum has picked up and price begins to trend. However it leaves behind the elements of the inducement area and all the key levels you need to know about for future price action.
Resistance Fakeout : Later on after the zone has formed, price will return to this upper zone of price levels and cause fakeouts. A close above this zone implies the market moves long again.
Midline Equilibrium : This is simply the center of the strongest traded area. We can call this the Point of Control within the orderblock. If price expands through both extremes of this zone multiple times in the future, it eliminates the orderblock.
Support Fakeout : Just like its opposing brother, price will wick through this zone and rip back causing inducement to trap traders. You would need a clear close below this zone to be in a bearish trend.
BARCOLOR or Candle Color: (Optional)
Bars are colored under three conditions
Bullish Color = A confirmed bullish breakout of the range.
Bearish Color = A confirmed bearish breakout of the range.
Squeeze Color = Even if no box is formed a candle or candles can have a squeeze color. This means the ranging market happened within the high and low of that singular candle.

RSI w/Hann WindowingThis RSI by John Ehlers of "Yet Another" Improved RSI. Taking advantage of the Hann windowing. As seen on PRC and published by John Ehlers, it has a zero mean and appears smoother than the classic RSI. In his own words " I prefer oscillator-type indicators to have a zero mean. We can achieve this simply by multiplying the classic RSI by 2 so it swings from 0 to 2, and then subtract 1 from the product so the indicator swings from -1 to +1." Ehlers goes on to say " Bear in mind 14 may not be the best length to analysis. So, the best length to use for the RSIH indicator is on the order of the dominant cycle period of the data."
This indicator works well with both bullish and bearish divergences. It also works well with oversold and overbought indications. Shown by the Red zone on top (Overbought) and the green zone on the bottom(oversold). Each which have an adjustable buffer zone. You may need to adjust the length of the RSIH to suit your asset. There are also multiply signal line's to choose from. Also take note of when the RSIH crosses up or down on the signal line.
None of this is financial advice.

RSI on Chart Window- The RSI indicator is displayed right on the chart, along with overbought and oversold notification symbols.
- Easily enable/disable the display of RSI Upper Band, Lower Band.

RSI by JBTRelative Strength Index With Alerts. With an upper band of crossing over 62 (RSI) and a lower band with a Triger price of 32 (RSI), This saves time and effort in waiting for the price to move above the desired level.
RSI Influenced AverageUsing a couple of different ways of calculating (User selectable) the standard rsi oscillator is merged with a moving average for a slight variation. Plenty of options in the settings to play with like changing rsi length, MA length, lookback lengths, MA type, and much more. For Use with other moving averages ideally, or as a standalone indicator.

RSI with Slow and Fast MA Crossing Strategy (by Coinrule)This strategy utilises 3 different conditions that have to be met to buy and 1 condition to sell. This strategy works best on the ETH/USDT pair on the 4-hour timescale.
In order for the strategy to enter the trade, it must meet all of the conditions listed below:
ENTRY
RSI increases by 5
RSI is lower than 70
MA9 crosses above MA50
To exit a trade, the below condition must be met:
EXIT
MA50 crosses above MA9
This strategy works well on LINK/USDT on the 1-day timeframe, MIOTA/USDT on the 2-hour timeframe, BTC/USDT on the 4-hour timeframe, and BEST/USDT on the 1-day timeframe (and 4h).
Back-tested from 1 January 2020.
The strategy assumes each order is using 30% of the available coins to make the results more realistic and to simulate you only ran this strategy on 30% of your holdings. A trading fee of 0.1% is also taken into account and is aligned to the base fee applied on Binance.

RSI Mean Reversion StrategyThis is a scalping strategy designed to be used for crypto trading. It uses an Exponential Moving Average with a default length of 100 in order to identify the trend of the market. If the price is trading above 100, it will only take long trades, and vice versa for shorts. It places long orders when the RSI value closes below 40, and the price is also above the 100 EMA. It places short orders when the RSI value is above 60, and the price is below the 100 EMA.
*Note: for custom alert messages to be read, "{{strategy.order.alert_message}}" must be placed into the alert dialogue box when the alert is set.

RSI + rCalcThis is a modification of the TradingView RSI.
I have added HMA and ALMA options to the MA settings and also the option for a colour change on RSI cross.
A reverse calc has also been added. This will display the MA cross/Overbought/Oversold price predictions. There is also the option to display an entered RSI or Price for a prediction display.
All colours and modifications can be turned on/off.
Enjoy! :)
RSI Potential Divergence - FontiramisuIndicator showing potential momentum divergences on RSI Momentum.
The problem with the classic divergence is that when the signal appears, it is sometimes too late to enter a trade.
The potential divergence corrects this problem by signaling the beginning of a potential divergence.
RSI is a momentum indicator that offers relevant insights with divergences.
Potential divergences are indicated with the letter B and a red color for Bearish Div or Green color for Bullish Div .
Potential divergence is confirmed when the line and the label "Bear"' or "Bull" appear.

RSI In-Chart Indicator with Candle StickSimplified RSI with in Chart Indicator for better analysis, What is does? it simply plot OB/OS over candles for better understanding. Also you can on/of candle stick along side in setting but the RSI is always on.
Candle stick Patterns
Three White Soldier (TWS)
Three Black Crows (TBS)

RSI, Stoch Rsi, EMA, SMA, & ROCThis indicator is simply an enhanced version of the RSI followed up by a few extra indicators that pair strongly with the RSI. This indicator allows the user to interact with various inputs based off the indicators provided. All indicators include moving average, relative strength index, stochastic relative strength index, simple moving average, exponential moving average, and rate of change. This program is unique as it is very versatile allowing the user to use as little or as many indicators as needed interchangeably.
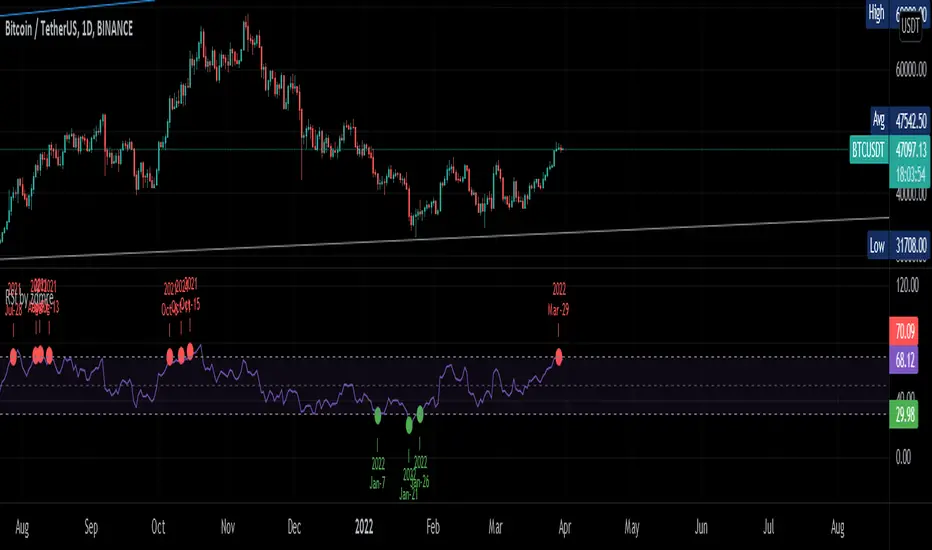
RSI by zdmreTraditional interpretations and usage of the RSI dictate that values of 70 or above suggest that a security becomes overbought or overvalued and may be primed for a trend reversal or corrective price pullback. An RSI reading of 30 or below indicates an oversold or undervalued condition.
30 = Oversold
70 = Overbought
Thanks @DieGobelMonte for your suggestion.
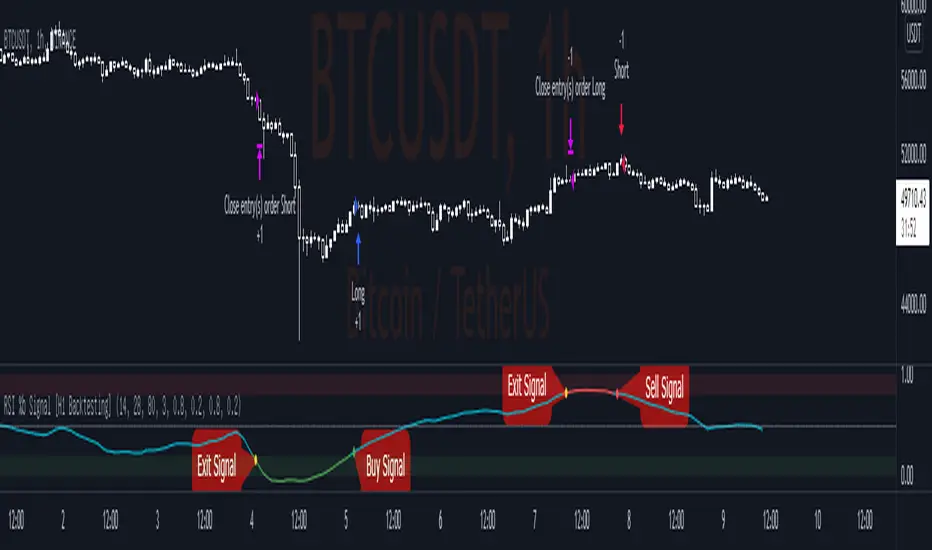
RSI %b Signal [H1 Backtesting]-----------------------------------------------------------------
This simple strategy base on RSI, EMA, Bollinger Bands to get Buy and Sell Signal with detail as below:
-----------------------------------------------------------------
1.Define Oscillator Line
+ Oscillator Line is smoothed by ema(28) of RSI(14) on H1 Timeframe
2.Define Overbought and Oversold
+ Apply Bollinger Bands BB(80,3) on Oscillator Line and calculate %b
+ Overbought Zone marked above level 0.8
+ Oversold Zone marked below level 0.2
3.Buy Signal
+ Entry Long Position when %b crossover Point of Entry Long
+ Deafault Point of Entry Long is 0.2
+ Buy signal marked by Green dot
4.Sell Signal
+ Entry Short Position when %b crossunder Point of Entry Short
+ Deafault Point of Entry Short is 0.8
+ Sell signal marked by Red dot
5.Exit Signal
+ Exit Position (both Long and Short) when %b go into Overbought Zone or Oversold Zone
+ Exit signal marked by Yellow dot
-----------------------------------------------------------------
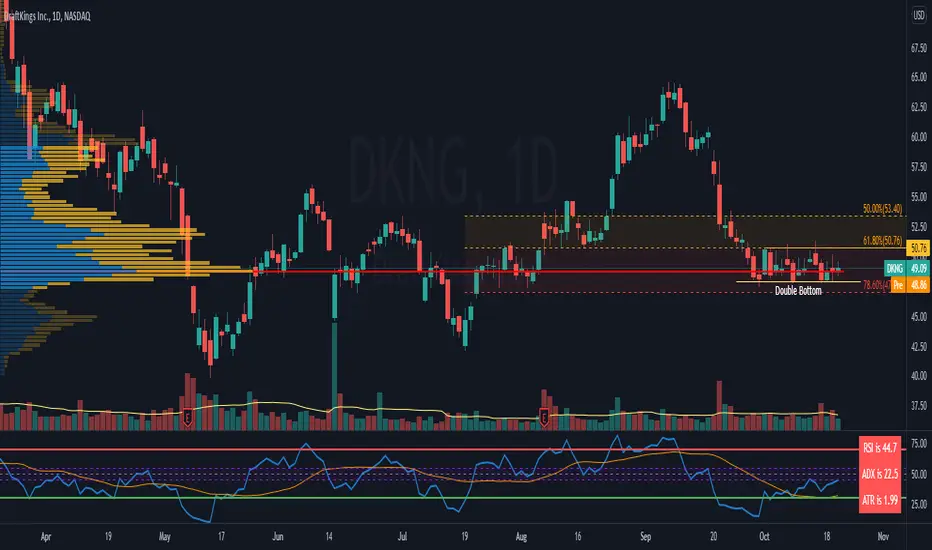
RSI c/w MA, ADX and ATR data I have added 3 items to the RSI indicator which helps me to get more information at the same time.
1) ADX value - when ADX is above 25 we have a strong trend
2) ATR Value - helps me to calculate my daily targets and stop-loss levels at a glance.
3) A simple moving average - This shows me the trend of RSI. If the price breaks a trend line and at the same time RSI crosses above the MA, it shows me a breakout has happened. In longer timeframes, it can show you in advance if you should expect a reversal in the trend.
You can turn on or off the MA as well as the ADX line.
RSI Overbought Oversold Divergence Strategy w/ Buy/Sell SignalsThis indicator is a copy of my RSI Overbought/Oversold Divergence Indicator with-Alerts
Only difference is that the alerts are disabled, instead it uses tradingviews strategy tester signals
If you want alerts just use the other indicator

RSI OBLIVION This is a powerful tool if combined with other parameters. It's an advanced version of an RSI .
It shows OB and OS conditions and price direction or shift of the trend.
This indicator can be used in various ways with all markets.
The current settings are designed to work with futures market.
Combined with our TSI and Price action, RSI OBLIVION is the most reliable KPI out there.
Reached out to us for assistance.

RSI Cross [xaurr]This is simple but profitable rsi cross strategy, to find optimal values you can change rsi and ema periods.
Good Luck!

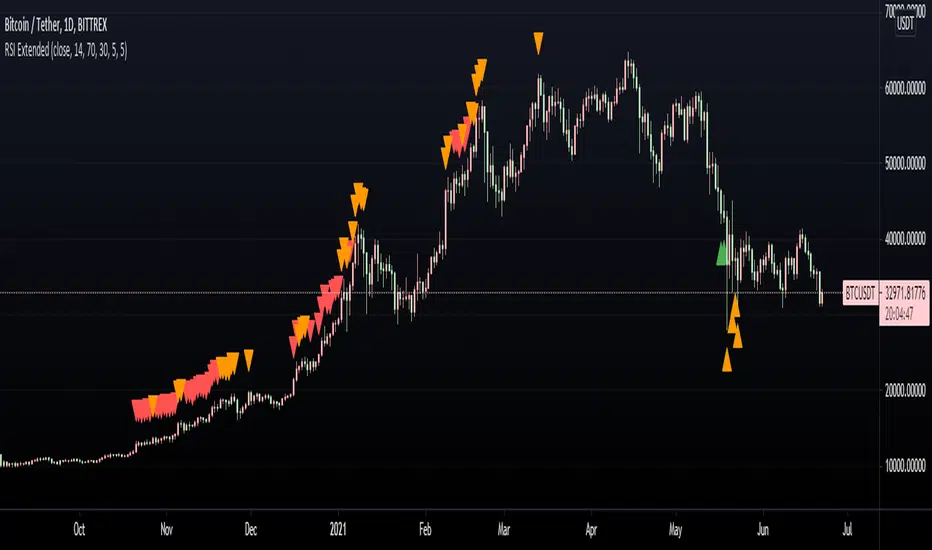
RSI ExtendedThis script is intended to print signals on the main price chart and send alerts when the RSI is overbought or oversold.
You can customize the source of the signal (open, close, etc), as well as oversold/overbought levels, and RSI length.
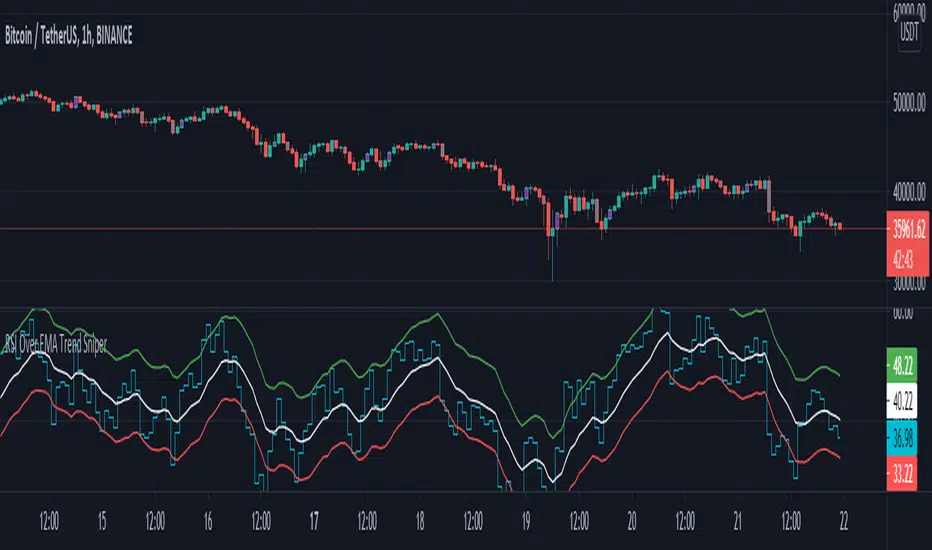
RSI Over EMA Trend SniperThis is an indicator that uses horizontal EMA lines with a RSI line on top of it to provide optimal entry and exit positions for trading crypto.
How to use:
If the Aqua(RSI) line passes upwards on the red heading to the white - it's heading towards a good BUY signal. To be safe you wait until it passes above the white line, then BUY LONG. Another signal to buy long is when the Aqua line passes above the white and green lines.
Selling is essentially the opposite, if the Aqua line is passing down from the green or white lines, then it's time to sell and exit your trade.
This indicator works well as a confirmation, and it's nice to have multiple confirmations, so it's suggested you use this with other indicators that can provide entry and exit confirmations.