RSI + Trend Kijun LTThis script is a simple RSI + 1 indication on trend :
- RSI 14 periods that you can personalize :
- period and upper/lower boundary can be customize
- Coloration when RSI exceeds the upper/lower limits
- Indication on long term trend :
- if intraday or daily : weekly trend (haussier / baissier Ⓦ)
- if weekly : monthly trend (haussier / baissier Ⓜ)
- The trend is calculate by the following expression : last confirmed close (not real time) weekly/monthly compared to Kijun-Sen weekly/monthly
Ce script est un simple RSI + 1 indication de tendance :
- RSI 14 périodes que vous pouvez personnaliser :
- Période et limite supérieure/inférieure personnalisables
- Coloration lorsque le RSI dépasse les limites supérieures/inférieures
- Indication de la tendance à long terme :
- si intrajournalier ou journalier : tendance hebdomadaire (haussier / baissier Ⓦ)
- si hebdomadaire : tendance mensuelle (haussier / baissier Ⓜ)
- La tendance est calculée par l'expression suivante : dernière clôture confirmée (pas en temps réel) hebdomadaire/mensuelle par rapport à Kijun-Sen hebdomadaire/mensuelle.
NB : Maybe in futur, possibility to add daily trend when intraday / Peut-être à l'avenir, possibilité d'ajouter une tendance journalière en intrajournalier.
"rsi" için komut dosyalarını ara
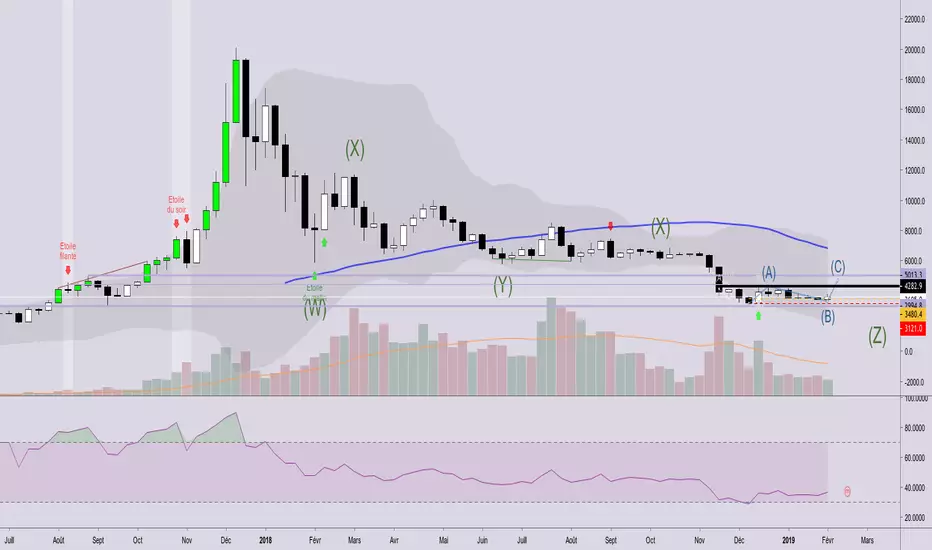
RSI|The Wave PrincipleThe Wave Principle | Modified RSI
30 green | 70 red = Strong Movement (Possible Impulse)
20 cyan | 80 Yellow = Strongest Movement
Support and Resistance Level (Trend Continuation)
Uptrend= 40
Downtrend = 60
Break+Retest = BR
Div = Divergence (Change in trend)
--------------------------------------------
This indicator has been modified from original RSI to fit Wave Principle characteristics:
Uptrend Impulsive Wave over 70 RSI it changes color to red, and > 80 yellow stronger impulse | Usually means continuation, at least once more.
Downtrend Impulsive Wave under 30 RSI it changes color to green, and < 20 cyan stronger impulse | Usually means continuation, at least once more.
Once RSI reached these levels, it doesn't mean trend reversal but a correction is expected. If it shows divergence along with an Ending Diagonal, it's a confirmation for trend reversal.
In a corrective wave, levels 40-60 represents support and resistance levels where price won't go further. Indicating Corrective Waves, not as strong as Impulsives.
Prices can breakout RSI trend lines and retest from the other side before continue the new trend as also described in the Wave Principle.
--------------------------------------------

RSI Bands Multi Time Frame [Jigga + LazyBear]This is a modified version of LazyBear's RSI Bands script. I added the possibility to display multiple RSI bands, so you can see the zones, where it is viable to enter a long or a short. You can also use different time frames, so you can visually see where any specific value of RSI is for your given time frame. This gives you a lot of possibilities. Default settings use 1h time frame and the most common reversal areas for RSI. Feel free to change the settings as you see fit. If the script makes your candles too small, you can go to style and turn off individual RSI bands. After that you will still be able to see the zones, but the scale of your chart won't be affected.
It also displays the middle line, which shows you the current trend and can prevent you from entering a long, when RSI is oversold during a strong downtrend or a short, when RSI is overbought during a strong uptrend.
Do not forget to use a proper stop loss and risk management.
Here you can see it in action in different markets:
BTC - BitMex
NASDAQ Composite - Stocks
EUR / USD - Forex

RSI Divergence - Baby WhaleThis RSI script will show you the following things:
When the RSI moves between the green lines (40 - 80++) we are in a Bull market.
If the RSI moves between the middle green and red line (40-60) we have some sideways action.
And yes, when the RSI is between the red lines (60 - 20--) we can say that we are in a Bear market.
The dashed lines in between are on every 10 points on the RSI.
All colors and lines are customisable.
The real MVP of this scrip is the RSI Divergence spotter.
A little green or red triangle will show up on the chart when a RSI Divergence is formed.
The Divergence is only shown when it happens in overbought (70+) or oversold (30-) regions to avoid too many signals.
I highly recommend not to jump in on every signal you get, but also use multiple reasons, like Elliot Wave or fib levels, before entering a trade.
If you want access, just send a message please.
Much love from Baby Whale!!
🙏❤️🐳

RSI StrapFollowers, this RSI is for you!
RSI Strap uses a normal Relative Strength Index (RSI) to determine what price level is in the over-bought or over-sold range.
This minimalist overlay improves the technical trading experience as indicators take up a lot of space and leave your chart area cluttered.
Change the RSI length, as well as the overbought and oversold levels in the indicator settings panel.
The default RSI length is set at 14, and the overbought and oversold levels are 70% and 30% respectively.
Happy Trading!
Find this indicator by searching "RSI Strap" in the public indicator library.
Don't forget to like!

RSI Exhaustion • Minimalist TradingThe RSI Exhaustion is an essential replacement of the standard RSI indicator because it is able to identify and highlight hidden exhaustion levels .
The indicator is crucial, even to the novice trader, to accurately spot trend reversal or trend continuation opportunities particularly when the RSI is neither overbought nor oversold. Additionally, the RSI Exhaustion becomes helpful in confirming extreme overbought or oversold RSI conditions.
By identifying hidden exhaustion levels, the RSI Exhaustion indicator represents an essential support to the trader in effectively reading the market and taking only the best opportunities.
The indicator is available via subscription and you can enjoy a free trial . To know more about the indicator and start the trial simply visit the link below.
➡ Try the indicator

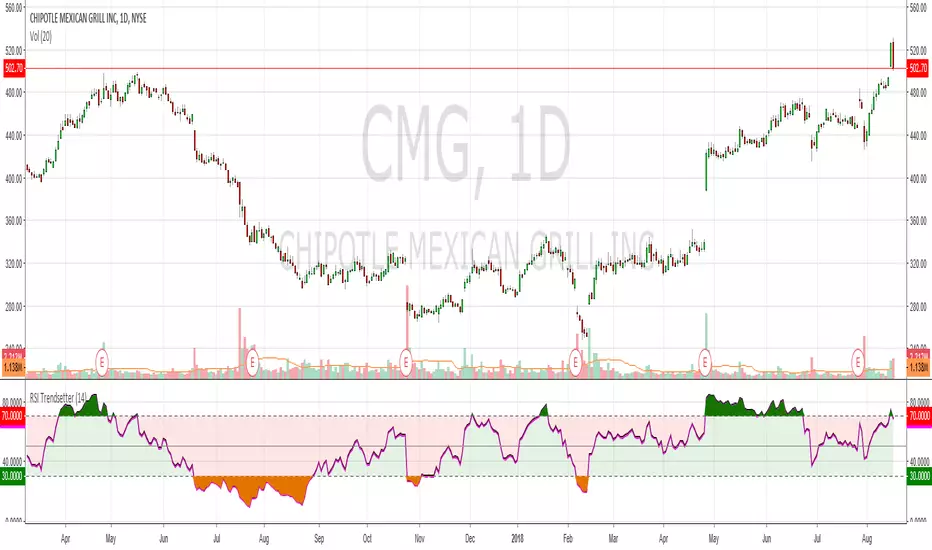
RSI TrendspotterHad a bit of a TA epiphany with RSI so bear with me. The time since RSI was last overbought/sold is a solid trend indicator. This may seem obvious but after x number of years trading it hit me like a smack in the face. I've coded this for easy visualisation. They're fairly simple changes but it's making a big difference in my trendspotting already.
In the example CMG hasn't been overbought for 183 days, so the RSI is mostly green:
Before that it hadn't been oversold for 199 days, so RSI is mostly red:
And before that it was ranging like a maf*ckin' sine wave, so the RSI shows green, red, green, red, etc.:
Finally, normal RSI for comparison. Same data, but now with pretty colours:
I've also added overbought/oversold highlights cause that just makes the whole charting thing a lot easier. Enjoy!
RSI buy/sell partitionsLook overbought and overbought to predict the time of the transaction.
RSI overbought:
- RSI = 21 to 30 (default configuration): The graph showing the letters 'Buy' and candles will have different colors.
- RSI < 21 (default configuration): The graph showing the letters 'Buy' displays bold and the candles will have high light background colors.
RSI oversold:
- RSI = 70 to 79 (default configuration): The chart that shows the word 'sell' and the candlestick will have different colors.
- RSI > 80 (default configuration): Display chart for 'Sell' displays bold and candles will have high light background colors.

RSI Multi-TimeframeThe Relative Strength Index (RSI) is an extremely useful oscillating momentum indicator that was developed by J. Welles Wilder and is one of the most widely used indicators in technical analysis.
HOW IS IT USED ?
In the classic view, a security is thought to be overbought when its RSI reading is above 70 and oversold when its RSI reading falls below 30. This makes it a good indicator for mean-reversion systems. Wilder recommended using the 70 and 30 levels as overbought and oversold levels respectively. When the RSI moves up over the 30 line it is considered a possible bullish reversal while a move down below the 70 line is considered a possible bearish reversal.
When the RSI is above 70 it is a potential exit signal if you are in a long position and when it is below 30 it is a potential exit signal if you are in a short position. Some traders use extreme readings for entry points in the direction of the long-term trend. Thus, if the long-term trend is bullish, then you'd wait for the RSI to reach oversold territory, which would be a potential entry point for a long position. Conversely, if the long-term trend is bearish, then overbought conditions could be a potential point to short the security.
I added the possibility to add on the chart a 2nd timeframe for confirmation.
If you found this script useful, a tip is always welcome... :)

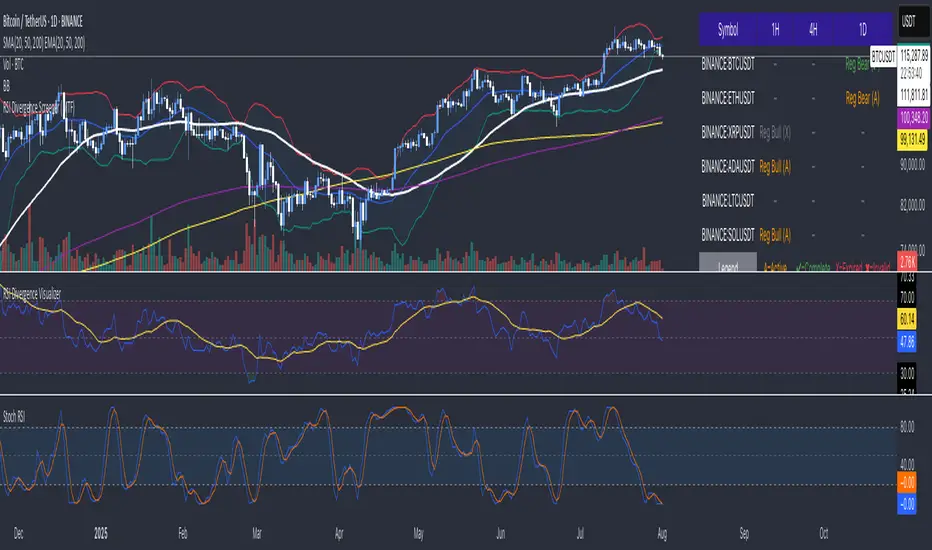
RSI Divergence Screener (MTF)
This powerful screener identifies RSI divergences across multiple symbols and timeframes, presenting the results in a clean, easy-to-read table. It screens for both regular bullish and bearish divergences, allowing you to quickly spot potential trend reversals.
The screener tracks the status of each divergence, categorizing it as:
Active (A): A divergence has formed and is still developing.
Complete (✔): The divergence has been confirmed (optionally, by the RSI crossing the 50 midpoint).
Expired (X): The divergence has persisted for too long without confirmation.
Invalidated (✖): A new high or low has been made, nullifying the divergence.
With customizable settings for RSI length, divergence sensitivity, and the ability to select up to six symbols and three timeframes, this tool is ideal for traders who want to monitor multiple markets efficiently.
Future Features
Expanded Divergence Types: The indicator will be enhanced to detect Hidden Bullish and Hidden Bearish divergences, which signal trend continuation. This will provide a more comprehensive view of potential trading opportunities.
Advanced Completion Flags: Users will have greater control over how a divergence is confirmed. New options will include:
RSI Level Confirmation: The ability to specify any RSI level (e.g., 30 or 70) for completion, rather than being limited to the midpoint of 50.
Breakout/Breakdown Confirmation: A divergence will be marked as complete when the price breaks out above the previous pivot high for a bullish divergence, or breaks down below the previous pivot low for a bearish divergence. This is a powerful signal that the trend has reversed.
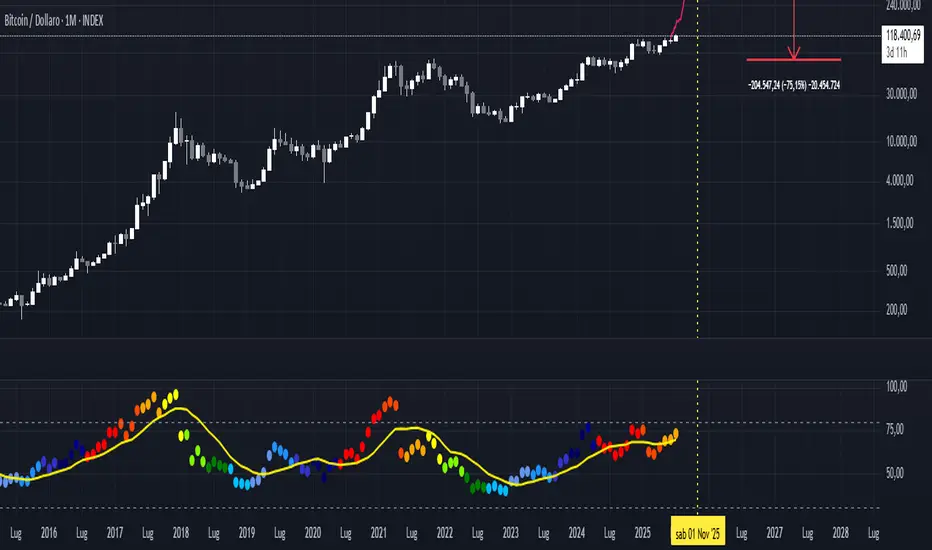
RSI Halving Heatmap by GUELFO
📈 **RSI Halving Heatmap Indicator**
This custom RSI indicator colors the RSI line based on the number of months remaining until the next Bitcoin halving. The closer we get to the halving, the warmer the color—ranging from deep blue (far from halving) to bright red (near halving).
✅ Includes:
- Customizable RSI length and source
- 12-color gradient scale for halving proximity
- Optional SMA overlay on RSI for trend smoothing
Ideal for visualizing market momentum in the context of Bitcoin’s halving cycle.
RSI with 2-Pole FilterA momentum indicator that tells you if a stock is overbought or oversold.
RSI goes between 0 and 100.
70 = overbought (might fall)
<30 = oversold (might rise)
It often looks jagged or choppy on volatile days.
Think of this filter like a momentum smoother:
It still follows RSI closely,
But it doesn’t react to every little jiggle in price,
Which helps avoid false signals.
it keeps track of:
The current RSI,
The last 2 RSI values (inputs), and
The last 2 outputs (filtered RSIs).
It uses feedback to shape the output based on previous values, making it smoother than a simple moving average.

RSI Multi-Frame Multi-Asset
✅ Key Features:
Multi-Asset: Simultaneously analyze Bitcoin, SP500, Nasdaq, DXY, Gold, Oil, VIX and more
Multi-Timeframe: Configure any timeframe for all RSI calculations
Smart Average RSI: Automatically calculates the mean of all active RSI values
Special Data: Includes Bitcoin Hashrate, 10Y-2Y Spread, and US Interest Rates
Built-in Alerts: Automatic notifications on overbought/oversold crossovers
🎯 Why is it Unique?
Instead of looking at 10 different charts, you get an instant macro view of the market. The average RSI shows you the overall strength/weakness of global markets, while individual RSI values let you identify divergences and specific opportunities.
🚀 Perfect For:
Traders seeking correlations between assets
Global markets macro analysis
Identifying divergences between Bitcoin and traditional markets
Multi-timeframe breakout trading

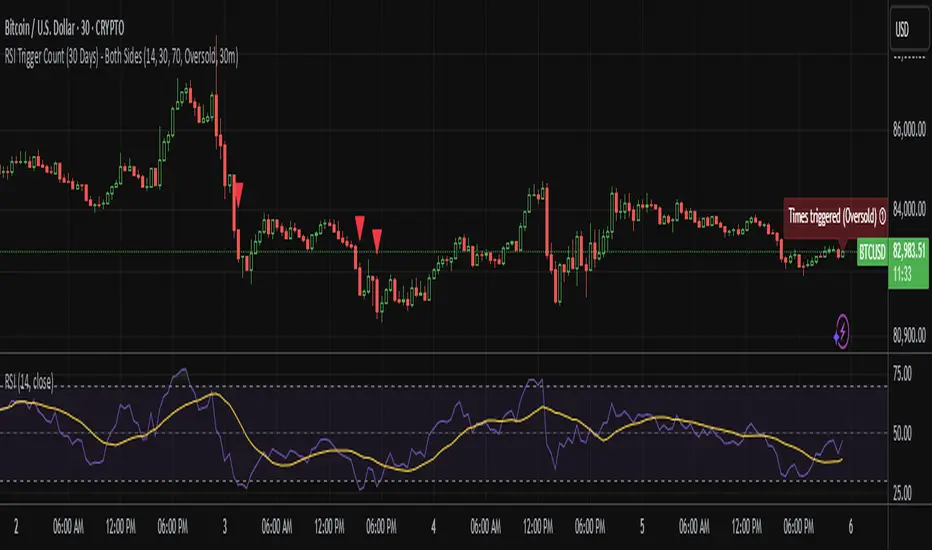
RSI Trigger Count (30 Days) - Both SidesRSI Dual Trigger Counter (30 Days)
This indicator tracks both oversold ( crossunder ) and overbought ( crossover ) RSI events on a 30-minute chart, featuring:
Dual-Mode Selector:
Counts either RSI < 30 (oversold) or RSI > 70 (overbought) crossings
Toggle between modes via input menu
30-Day Rolling Count:
Displays total triggers in the last 30 days (e.g., "Times triggered (Oversold) ① 19")
Visual Alerts:
Red triangles ↓ for oversold crossunders
Green triangles ↑ for overbought crossovers
Customizable:
Adjustable RSI length (2-100) and thresholds (1-100)
Works on any timeframe (auto-scales calculations)
Purpose: Identifies frequent reversal signals for both buying dips (oversold) and selling rallies (overbought).
RSI and EMA crossover with big candlesThis TradingView indicator identifies big bullish and bearish candles using RSI, EMA crossovers, and wick analysis. It helps traders spot potential trend continuation or reversal points by labeling significant price movements and providing real-time alerts.
NOTE: THIS WORKS BEST ON 2 MINS TIME FRAME ONLY
Key Features:
✅ Big Candle Detection:
Detects large candles based on body size and recent price action.
Differentiates between bullish (green) and bearish (red) candles.
✅ Wick Analysis & RSI Filtering:
Ensures candles have relatively small wicks for stronger signals.
RSI confirmation:
Bullish signals require RSI above 59.
Bearish signals require RSI below 40.
✅ Candle Counting & Labeling:
Labels bullish and bearish candles with sequential numbers.
Adds PUTS and CALLS labels when an 8 EMA crosses the 21 EMA.
Adjusts label positioning for better visibility.
✅ Configurable Alerts for #2 Candle:
Alerts trigger when the second bullish or bearish candle is detected.
Users can enable/disable alerts from the script settings.
✅ EMA Crossover Signals:
Bullish crossover (8 EMA above 21 EMA): Displays a "CALLS" label below the candle.
Bearish crossover (8 EMA below 21 EMA): Displays a "PUTS" label above the candle.
Usage:
📊 Trend Confirmation: Use the big candle signals + EMA crossover for stronger trade setups.
🔔 Alerts: Get notified when the second big candle forms.
📉 Reversals & Continuation Patterns: Identify shifts in momentum early.
This script is perfect for traders looking for a clean and powerful price action-based indicator with automated alerts. 🚀

RSI to Price RatioThe RSI to Price Ratio is a technical indicator designed to provide traders with a unique perspective by analyzing the relationship between the Relative Strength Index (RSI) and the underlying asset's price. Unlike traditional RSI, which is viewed on a scale from 0 to 100, this indicator normalizes the RSI by dividing it by the price, resulting in a dynamic ratio that adjusts to price movements. The histogram format makes it easy to visualize fluctuations, with distinct color coding for overbought (red), oversold (green), and neutral (blue) conditions.
This indicator excels in helping traders identify potential reversal zones and trend continuation signals. Overbought and oversold levels are dynamically adjusted using the price source, making the indicator more adaptive to market conditions. Additionally, the ability to plot these OB/OS thresholds as lines on the histogram ensures traders can quickly assess whether the market is overstretched in either direction. By combining RSI’s momentum analysis with price normalization, this tool is particularly suited for traders who value precision and nuanced insights into market behavior. It can be used as a standalone indicator or in conjunction with other tools to refine entry and exit strategies.
RSI Buy/Sell SignalsThis Pine Script is designed to plot Buy and Sell signals based on the Relative Strength Index (RSI) for both 15-minute and hourly timeframes. It calculates the RSI values for the current 15-minute chart and requests the hourly RSI data for comparison. Buy signals are generated when the RSI crosses above 60 in either timeframe, while sell signals occur when the RSI crosses below 40. The script also plots visual markers on the chart, indicating buy signals with green labels below the price bars and sell signals with red labels above the price bars. Additionally, it allows for alert conditions, notifying the user when a buy or sell signal is triggered.

RSI Sector analysis
Screening tool that produces a table with the various sectors and their RSI values. The values are shown in 3 rows, each with a user-defined length, and can be averaged out and displayed as a single value. The chart is color coded as well. Each ETF representing a sector can be looked at individually, with the top holdings in each preprogrammed, but users can define their own if they wish. The left most ticker is the "benchmark"; SPY is the benchmark for the various sectors, and the ETF is the benchmark for the tickers within.
Symbols are color coded: light blue text indicates that a symbol has greater RSI values in all three timeframes than the benchmark (the leftmost symbol). Orange text indicates that a symbol has a lower RSI value for all three timeframes. In the first row, light blue text indicates the largest RSI increase from the third row to the first row. Orange text indicates the largest RSI decrease from the third row to the first row.
A blue highlight indicates that the value is the highest among the tickers, excluding the benchmark, and an orange highlight indicates that the value is the lowest among the tickers, also excluding the benchmark. A blue highlight on the ticker indicates that it has the highest average value of the 3 rows, and a orange highlight on the ticker indicates that it has the lowest average value of the 3 rows.

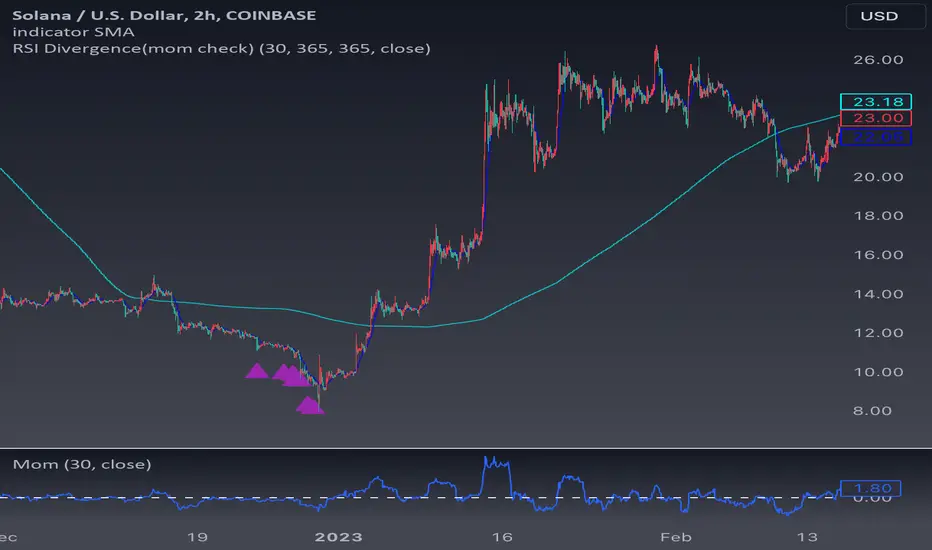
RSI divergence(mom check)The core of this indicator is obviously RSI divergence. But there are some tips I would like to explain and suggest.
First of all, although the basic principle of this indicator is simple: simply comparing the price and RSI value within a given time period. To be more specific, if the price now is lowest among last 300 candlesticks but its RSI value is not, then the candlesticks will be marked. However, sometimes it is not accurate. Here are some examples:
This is bitcoin 2h chart from COINBASE. It is true that we can capture most of corrections and make a fortune during a bull market. However, the market is not always consist of bull market:
This is also bitcoin 2h chart from COINBASE. We can imagine how much money we would lose if we buy every time solely according to the RSI divergence signals during a bear market. So, how to solve this question? As a bullish indicator, it's normal to have distortions in a bear market, but I still hope to improve its win rate and make it more reliable even though when people are trading during a bear market. So we need to add some filtering conditions to screen out all the divergence signals.
The first indicator came in my mind is: Momentum. Here is the momentum code with its zero axis:
//@version=5
indicator(title="Momentum", shorttitle="Mom", timeframe="", timeframe_gaps=true)
//input variables
len = input.int(30, minval=1, title="Length")
src = input(close, title="Source")
//calculate momentum
mom = src - src
//draw momentum chart
plot(mom, color=#2962FF, title="MOM")
//draw 0 axis
hline(0, "Zero Line", color=color.white)
One thing we should notice is that ’30’ is the time period of the momentum, you can change this to everything you want according to which assets you are trading. For example, in a long-run bullish stock market or gold market, you can set ’60’. But when it comes to futures or crypto, maybe 30 is a better choice.
Now, I use momentum as a condition to distinguish a bearish trend: if the all momentum value of past 100 candlesticks of my RSI divergence signals are minus, which means these divergence signals are in a bearish trend, in this case, I market them as purple signal2. Attached are some examples of BTC, ETH and SOL charts. We can see if we trade according to green signal1s. We gonna have to cut our losses multiple times, and for leveraged traders, it could even mean facing liquidation. However, signal2 has helped filter most of signal1s. So in most conditions, I believe the appearance of signal2 represents the end of bearish trends.
So far, we have created an overall frame. And I have set ‘alertcondition’ functions so that we can use this indicator to set alerts.
Here are some tips I would like to suggest based on my personal experiences:
1. Set stop losses and follow them strictly;
2. Adjust the time period according to different assets. For instance, 4h chart is good for bitcoin and most altcoin. But when it comes to stock market, 12h or 1d may be a better choice. You need to find the best suitable time period by yourself;
3. In a bear market, please be especially cautious with the green Signal 1; they are great for following uptrends but are not suitable for bottom-fishing. I recommend waiting for the purple Signal 2 to appear before placing trust again in the green Signal 1.
4. To be continued….
RSI TrendsThis TradingView script combines RSI trend analysis with FVG (Fair Value Gap) detection to identify potential buy and sell opportunities in financial markets. The script is customizable and provides extensive visual feedback directly on the chart, enhancing both strategic entry and exit points for traders. Raw code of FVG was taken from LuxAlgo
Features
FVG Detection: Identifies Fair Value Gaps (FVG), and provides options to display these gaps based on user settings.
RSI Trend Bars: Utilizes the Relative Strength Index (RSI) to paint bars indicating overbought and oversold conditions. This helps traders understand current market sentiment and potential reversal points.
Customizable Settings: Users can customize the timeframe, FVG types, and RSI thresholds. This flexibility allows the script to be adapted to various trading styles and timeframes.
Historical Analysis: Option to display or hide historical FVGs, helping users analyze past market behavior without cluttering the chart.
Alert System: Integrated alerts for detected buy and sell signals based on RSI conditions and the presence or absence of FVGs. This feature notifies traders of potential trading opportunities.
Trading Signals
Buy, Buy+, and Buy++ Signals: These signals are triggered based on overbought conditions without corresponding bearish FVG presence, with increasing stringency for higher tiers of buy signals.
Sell, Sell+, and Sell++ Signals: These signals are based on oversold conditions devoid of bullish FVG presence, with each subsequent plus sign indicating a higher level of confirmation required to trigger the signal.
Use Case
Ideal for traders who rely on technical analysis and are looking for an automated way to spot potential buy and sell points using both price action gaps and momentum indicators.
Customization
All input parameters are adjustable directly from the indicator's settings panel, making it easy to tailor the tool to your trading needs and preferences.

RSI-HeatmapThis unique indicator is a comprehensive tool designed for traders seeking to gain an edge in the market. It consists of three main components: a revised RSI, a dynamic heatmap, and an integrated alert system.
1.Modified RSI:
Unlike the traditional RSI that calculates delta as the difference between the current price and the previous price (Δ = {price} - {previous price}), this version computes delta by comparing the current price with the price n periods ago (Δ = {price} - {n-th previous price}). This delta is then smoothed using a Volume Weighted Moving Average (VWMA) with a short length to preserve the RSI's core characteristics while adapting it to capture longer-term momentum shifts more effectively.
2.Heatmap:
The heatmap feature introduces a novel approach to visualize market conditions, with 5 high levels and 5 low levels identified around the current price. When the price crosses these thresholds, the RSI-based heatmap changes colors, ranging from blue (indicative of oversold conditions) to red (signaling overbought conditions). This visual tool helps traders quickly gauge the strength and potential reversal points in the market.
3.Alert:
The Alert system employs MACD (Moving Average Convergence Divergence) and CCI (Commodity Channel Index) indicators to signal potential buy or sell opportunities. It categorizes alerts into four color-coded recommendations:
Green and Lighter Green: Strong buy signal, suggesting favorable conditions for entering buy positions.
Blue and Lighter Blue: Moderate buy signal, indicating less robust but potentially profitable buy conditions.
Red and Lighter Red: Strong sell signal, advising traders to consider taking sell positions.
Orange and Lighter Orange: Moderate sell signal, hinting at sell conditions that are not as compelling as those indicated by red.

RSI MFI MultiTimeframe Oversold/OverboughtHello Traders,
This indicator is designed to easily visualize the overbought/oversold states of RSI and MFI across multiple timeframes.
The indicator is very straightforward.
The deeper the red, the closer it is to 0, and the deeper the green, the closer it is to 100. The intermediate values are rendered in a transparent gray to focus on the key regions.
However, I understand that traders may have an interest in knowing the most recent state of the oscillator, whether it was overbought or oversold.
For this reason, I have included the 'Gradient Color' option in the color settings.
By turning off this option, you can easily see at a glance which region the oscillator was in most recently.
(Gradient Color Option Off)
In addition, I know that many traders are interested in the actual RSI/MFI values across multiple timeframes.
Thus, I have displayed the RSI/MFI values for each timeframe on the far right.
Furthermore, although the name of this indicator is RSI MFI MultiTimeframe Oversold/Overbought, I have also included the Stochastic RSI as an option, as I find it personally useful.
Feel free to use it if you find it helpful.

RSI Chart LevelsThe RSI Chart Levels shows you in a simple way where Support/Resistance might be. You want to make sure all settings are the same in the RSI that you are using with this overlay to be accurate.
This is also good at spotting divergence in real-time. If price goes over the Higher High but the RSI hasn't gained a new Higher High it is showing divergence, vice versa for Lower Low.
This overlay was created with the idea of RSI Divergence Scanner by zdmre indicator. Add his RSI and match the settings to the chart overlay. The default Zigzag is set to 7 which zdmre settings is different so change to whatever you prefer.
Shoutout to zdmre original work!
