[_ParkF]RSI (+ichimoku cloud)RSI
Typical RSI indicators were plotted with candles and expressed wick to resemble a candle chart,
and linear regression was added to predict changes in force intensity,
which allowed us to confirm support and resistance within linear regression .
In addition, divergence signal was marked as an additional basis for the price fluctuation point due to support and resistance .
In other words,
if the diversity signal appears together when the rsi candle is supported and resisted within linear regression ,
this is the basis for predicting that it is a point of change in the existing trend.
Finally, the period value and standard deviation of linear regression can be arbitrarily modified and used.
I hope it will help you with your trading.
--------------------------------------------------------------------------------------------------------------------------------------------------------------
(+ichimoku cloud)
Clouds made of the preceding span 1 and the preceding span 2 of the balance table can predict the trend by displaying the current price balance ahead of the future.
In addition to the role of clouds in the above-described balance sheet, this indicator also shows the cloud band support and resistance of the current RSI value.
일반적인 RSI 지표를 캔들화 하였고 꼬리까지 포함하여 캔들 차트와 유사하게 표현 하고,
캔들화한 RSI 지표에 선형회귀(채널)를 추가 하여 RSI 지표 특유의 힘의 강도의 변화를 지지와 저항으로 확인할 수 있게 해봤습니다.
또한 다이버전스 신호를 추가하여 선형회귀(채널)로 인한 지지와 저항에 따른 가격 변동의 근거로 삼을 수 있습니다.
즉, 선형회귀(채널) 안에서 RSI 캔들이 지지와 저항을 받을 때 다이버전스 신호가 함께 나타난다면 이는 기존 추세의 변화 지점임을
예측해 볼 수 있는 근거가 됩니다.
마지막으로 선형회귀(채널)의 기간값과 표준편차는 임의로 수정하여 사용할 수 있습니다.
당신의 트레이딩에 도움이 되었으면 합니다.
--------------------------------------------------------------------------------------------------------------------------------------------------------------
(+일목균형표의 구름)
일목균형표의 선행스팬1과 선행스팬2로 만들어진 구름은 현재 가격의 균형을 미래에 선행하여 표시하여 추세를 예측해볼 수 있습니다.
본 지표에서는 위에서 설명한 일목균형표의 구름의 역할과 더불어 현 RSI 값의 구름대 지지, 저항 또한 확인해볼 수 있습니다.
* I would like to express my gratitude to zdmre for revealing the linear regression source.
"rsi" için komut dosyalarını ara

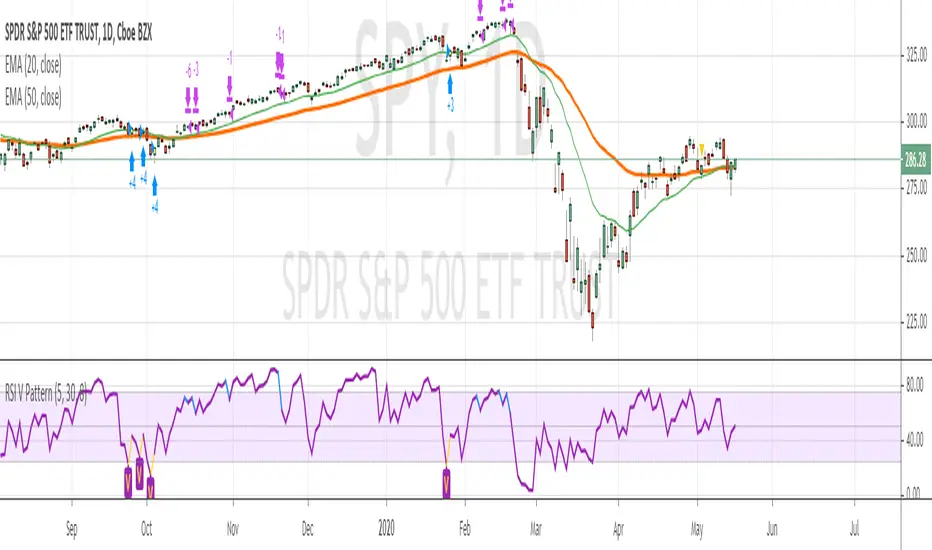
RSI V Pattern strategyThis strategy based on RSI for swing trading or short term trading
Strategy Rules
=============
LONG
1. ema20 is above ema50 --- candles are colored green on the chart
2. RSI value sharply coming up
previous candle1 low is previous candle2 low and previous candle1 RSI value is less than previous candle2
current candle RSI value is greater than previous candle1 and crossing above 30
above which makes a V shape on RSI indicator, colored in yellow on the chart , price bar is colored in yellow
3. Enter Long when the above V pattern occurs
EXIT LONG
1. when the RSI reaches 70 , close half position and move stop loss to up
2. when RSI reaches high value 90, close 3/4 position
3. when RSI crossing below 10 OR stopLoss hit , whichever happens first , close whole position
Note : take profit levels are colored in blue on RSI and Price candles
I have tested SPY , QQQ on daily chart , performance results are with 80% win rate and more than 3 profit factor
Happy Trading
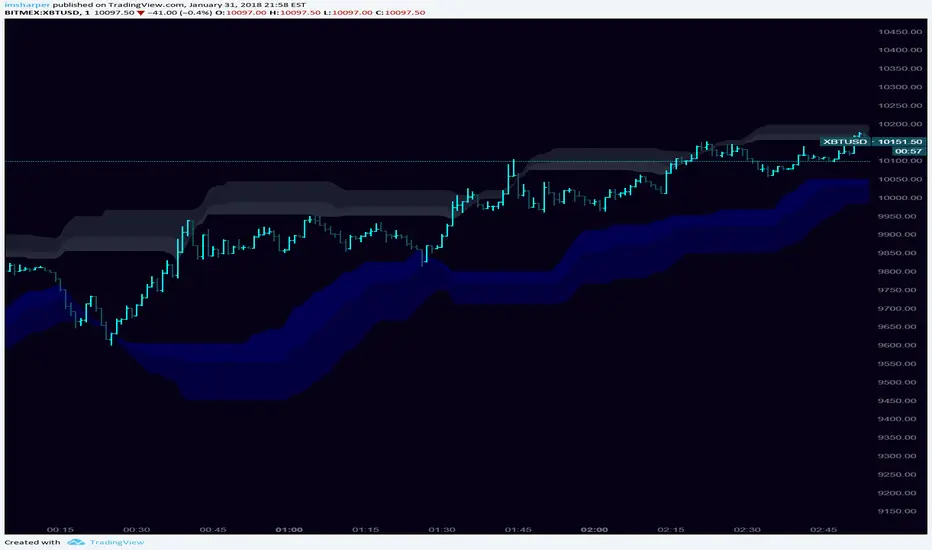
RSI Swing SignalThis indicator is a tool designed to be used with Steven Hart's RSI Exhaustion strategy. For more information google TheTradingChannel or look him up on YouTube :)
The default RSI settings for this strategy are:
RSI Overbought: 80
RSI Oversold: 20
Length: 7
When the RSI gets above 80, the line will turn red and the script will begin looking for a specific type of engulfing candle to go short. The same is true when the RSI gets below 20, but the line will turn green and look for longs. It is best used as a back-testing aid, but it can also be used to send emails or SMS alerts whenever the conditions are met. It can also be used as an alternative colored RSI indicator by removing the signals in the settings menu and changing the RSI parameters to whatever you normally use. This can aid in RSI divergence and overbought/sold strategies.
Entries:
The bright green and bright red lines represent the first type of engulfing candle.
The dark green and red lines represent the second type of engulfing candle.
Some pairs perform best with only one of these entries, while others work fine with both.
This is a counter-trend or consolidation strategy, and is best used in combination with trend-continuation or trend-following strategies. As always, make sure you back-test it before you use it to trade as it works better on some pairs than others.

RSI ZonesThis is a combination of a couple ideas I saw on here. The result is from three configurable EMA smoothed RSI overbought/oversold zones. The default is set to Donchian Channel mode where the highs/lows of the RSI's are plotted. An optional basis line derived from the slowest RSI is also included. Toggling this mode off gives you different results.
You'll want to play with different lengths for your own preferences and to see what works best for you.
Being able to see price bounce between these zones should hopefully give you some ideas on how you could potentially use this.
Credit to LazyBear for the initial idea.
RSI SCALPER with Dynamic ATR LinesThis is a versatile scalping indicator that combines RSI-based signals, dynamic ATR channels, and Stochastic-based divergence detection to identify potential entry and exit points in the market .
Key Features
Dynamic ATR Channel – Calculates support and resistance based on ATR (Average True Range) with configurable length and multiplier for both support and resistance lines, plus a midline
Multi-timeframe RSI – Two separate RSI calculations with independent timeframe settings: one for "KUN RSI" signals and one for "GET READY" alerts
Divergence Detection – Identifies regular and hidden bullish/bearish divergences using Stochastic D and fractals
25 MA Types – Comprehensive library of smoothing functions including WMA, HMA, EMA, TEMA, DEMA, ZLEMA, and several advanced variants
Signal Types
Signal Description
Get Ready (Long) Price crosses above dynamic support while RSI is oversold
Get Ready (Short) Price crosses below dynamic resistance while RSI is overbought
EXIT (Buy Break) Price closes above resistance (previously below) without simultaneous short signal
EXIT (Sell Break) Price closes below support (previously above) without simultaneous long signal
R-BULL / R-BEAR Regular divergence – signals potential trend reversal
H-BULL / H-BEAR Hidden divergence – signals trend continuation
Settings
RSI Parameters:
Separate timeframe selection for both RSI calculations
Configurable length and overbought/oversold levels (default 70/30)
ATR Channel:
Independent timeframe for channel calculation
Individual ATR lengths and multipliers for support (8/1.44) and resistance (14/1.44)
Divergence:
Dedicated timeframe setting
Stochastic parameters (length, smooth K, smooth D)
MA type selection for smoothing
Alerts
The indicator includes four predefined alerts for divergence signals that trigger only on confirmed bars:
Regular Bullish/Bearish Divergence
Hidden Bullish/Bearish Divergence
Use Cases
Suitable for active scalping and swing trading on crypto, forex, and stocks. Combine signals with price structure and volume for optimal use. The ATR channel adapts automatically to volatility, while divergence signals provide early warning of potential trend shifts .

RSI & BB Oversold Scalper with MACD Confirmation [DotGain]RSI & BB Oversold Scalper with MACD Confirmation
The RSI & BB Oversold Scalper is a mean reversion / dip-buying indicator designed for traders who want to combine oversold conditions with momentum confirmation .
It uses a multi-step logic: first detect an oversold setup, then wait for a MACD confirmation within a defined time window before issuing a buy signal.
---
Core Concept
1. Detect an oversold setup using Bollinger Bands %b, RSI and an optional DSS filter
2. Keep the setup active for a limited number of candles
3. Trigger the entry using a MACD bullish crossover
4. Reset after entry to avoid multiple signals from the same setup
---
Buy Signal Logic
A buy signal is generated when the following conditions are met:
1. Oversold Setup (filters can be enabled/disabled individually)
• Bollinger Bands %b Oversold (Lookback-based)
The price has traded below the lower Bollinger Band at least once within the last `lookbackBB` candles.
• RSI Oversold (Lookback-based)
The RSI has dropped below 30 at least once within the last `lookbackRSI` candles.
• DSS (Double Smoothed Stochastic) Reversal Filter
A bullish crossover of the DSS line above its signal line while the DSS value is below 20 , indicating a potential momentum reversal from oversold conditions.
Note:
BB %b and RSI are lookback filters , while the DSS condition is a single-bar crossover event .
---
2. MACD Confirmation (Entry Timing)
After the setup becomes active, the indicator waits for a bullish MACD crossover (`MACD line crosses above Signal line`) within a user-defined time window (`validWindow` candles).
If the MACD confirmation occurs within this window, a buy signal is printed.
If the window expires without confirmation, the setup is discarded automatically.
---
Reset Logic
• After a buy signal, the setup is reset immediately
• Only one signal is allowed per setup
• No late entries after the time window expires
---
Inputs & Customization
• Enable or disable BB, RSI and DSS filters individually
• Adjust lookback periods to control how recent oversold conditions must be
• Tune the MACD confirmation window to balance early vs. conservative entries
Smaller windows = faster, more aggressive entries
Larger windows = fewer but more confirmed signals
Recommended Markets & Timeframes
• Cryptocurrencies, Forex, Indices, liquid stocks
• Best suited for 1m – 15m scalping
• Also usable on 15m – 1h for slower mean-reversion trades
Visuals
• Buy signals are displayed as labels below the price candles
Important Notes
• This indicator is a signal and timing tool , not a complete trading system
• Always combine with higher-timeframe trend, support/resistance or volume analysis
• Backtesting and paper trading are strongly recommended
Disclaimer:
This "RSI & BB Oversold Scalper with MACD Confirmation" (Oversold Scalper) indicator is provided for informational and educational purposes only. It does not, and should not be construed as, financial, investment, or trading advice.
The signal generated by this tool (Green) is the result of a specific set of algorithmic conditions. They are not a direct recommendation to buy or sell any asset. The indicator's purpose is to highlight possible weakness in the markets, not to provide infallible trade signals.
All trading and investing in financial markets involves a substantial risk of loss. You can lose all of your invested capital.
Past performance is not indicative of future results. Even an indicator designed to filter out "chop" may produce false, lagging, or losing signals. Markets can remain unpredictable longer than you can remain solvent.
The creator DotGain assumes no liability for any financial losses or damages you may incur, directly or indirectly, as a result of using this indicator or the information it provides.
You are solely responsible for your own trading and investment decisions. Always conduct your own research (DYOR), validate signals with other methods, and consider your personal risk tolerance before entering any trade.

RSI + MACD Multi-Timeframe StrategyThis strategy combines the Relative Strength Index (RSI) from the daily timeframe with the Moving Average Convergence Divergence (MACD) from the 4-hour timeframe to generate precise long entry and exit signals.
The system uses a multi-timeframe approach to align longer-term trend conditions with shorter-term momentum shifts — allowing traders to catch dips with confirmation and exit before reversals.
🧠 Strategy Logic
✅ Long Entry Condition:
- RSI on the daily (1D) timeframe is oversold (below your defined threshold)
- MACD on the 4H timeframe crosses above the signal line
→ A long trade is opened when these two align
✅ Long Exit Condition:
- RSI on the daily timeframe is overbought
- MACD on the 4H timeframe crosses below the signal line
→ The long trade is closed when these two conditions are met
💡 This strategy currently supports long entries only. Short logic can be added if needed.
📊 Indicator Components
🔹 RSI (Relative Strength Index):
- A momentum oscillator that measures the speed and magnitude of price changes.
- Helps identify overbought (potential sell) and oversold (potential buy) conditions.
- Applied on the 1D timeframe (by default) to reflect broader market trend or exhaustion levels.
🔹 MACD (Moving Average Convergence Divergence):
- A trend-following momentum indicator based on moving averages.
- The MACD Line (fast EMA - slow EMA) crossing above the Signal Line indicates bullish momentum.
- Used here on the 4-hour timeframe (by default) for shorter-term momentum confirmation.
🔹 Multi-Timeframe (MTF) Logic:
- Uses request.security() to pull higher timeframe data (1D for RSI, 4H for MACD).
- Ensures no repainting, as it only uses closed candles from the higher timeframe.
- Aligns longer-term signals with shorter-term entries, reducing false signals.
📈 Plotting Options
The script includes a plot selector input allowing you to toggle between:
- RSI Plot (with overbought/oversold lines)
- MACD Plot (MACD line and signal line)
- This helps visualize signal conditions clearly on your chart.
🛠 Customization
- RSI & MACD settings are fully configurable
- RSI and MACD timeframes can be adjusted independently
⚠️ Disclaimer
This strategy is provided for educational and informational purposes only.
It is not financial advice or a recommendation to buy or sell any asset.
Past performance does not guarantee future results. Always test strategies in a simulated environment before live use, and consult with a licensed financial advisor for investment decisions.

PDB - RSI Based Buy/Sell signals with 4 MARSI Based Buy/Sell Signals on Price chart + 4 MA System
This indicator plots RSI-based Buy & Sell signals directly on the price chart , combined with a 4-Moving-Average trend filter (20/50/100/200) for higher accuracy and cleaner trade timing.
The signal triggers when RSI reaches user-defined overbought/oversold levels, but unlike a standard RSI, this version plots the signals **on the chart**, not in the RSI window — making entries and exits easier to see in real time.
RSI Levels Are Fully Customizable
The default RSI thresholds are 30 (oversold) and 70 (overbought).
However, you can adjust these to fit your trading style. For example:
> When day trading on the 5–15 min timeframe, I personally use 35 (oversold) and 75 (overbought) to catch moves earlier.
> The example shown in the preview image uses 10-minute timeframe settings.
You can change the RSI levels to trigger signals from **any value you choose**, allowing you to tailor the indicator to scalping, day trading, or swing trading.
4 Moving Averages Included:
20, 50, 100, 200 MAs act as dynamic trend filters so you can:
✔ trade signals only in the direction of trend
✔ avoid false reversals
✔ identify momentum shifts more clearly
Works on all markets and timeframes — crypto, stocks, FX, indices.

RSI Momentum Trend MM with Risk Per Trade [MTF]This is a comprehensive and highly customizable trend-following strategy based on RSI momentum. The core logic identifies strong directional moves when the RSI crosses user-defined thresholds, combined with an EMA trend confirmation. It is designed for traders who want granular control over their strategy's parameters, from signal generation to risk management and exit logic.
This script evolves a simple concept into a powerful backtesting tool, allowing you to test various money management and trade management theories across different timeframes.
Key Features
- RSI Momentum Signals: Uses RSI crosses above a "Positive" level or below a "Negative" level to generate trend signals. An EMA filter ensures entries align with the immediate trend.
- Multi-Timeframe (MTF) Analysis: The core RSI and EMA signals can be calculated on a higher timeframe (e.g., using 4H signals to trade on a 1H chart) to align trades with the larger trend. This feature helps to reduce noise and improve signal quality.
Advanced Money Management
- Risk per Trade %: Calculate position size based on a fixed percentage of equity you want to risk per trade.
- Full Equity: A more aggressive option to open each position with 100% of the available strategy equity.
Flexible Exit Logic: Choose from three distinct exit strategies to match your trading style
- Percentage (%) Based: Set a fixed Stop Loss and Take Profit as a percentage of the entry price.
- ATR Multiplier: Base your Stop Loss and Take Profit on the Average True Range (ATR), making your exits adaptive to market volatility.
- Trend Reversal: A true trend-following mode. A long position is held until an opposite "Negative" signal appears, and a short position is held until a "Positive" signal appears. This allows you to "let your winners run."
Backtest Date Range Filter: Easily configure a start and end date to backtest the strategy's performance during specific market periods (e.g., bull markets, bear markets, or high-volatility periods).
How to Use
RSI Settings
- Higher Timeframe: Set the timeframe for signal calculation. This must be higher than your chart's timeframe.
- RSI Length, Positive above, Negative below: Configure the core parameters for the RSI signals.
Money Management
Position Sizing Mode
- Choose "Risk per Trade" to use the Risk per Trade (%) input for precise risk control.
- Choose "Full Equity" to use 100% of your capital for each trade.
- Risk per Trade (%): Define the percentage of your equity to risk on a single trade (only works with the corresponding sizing mode).
SL/TP Calculation Mode
Select your preferred exit method from the dropdown. The strategy will automatically use the relevant inputs (e.g., % values, ATR Multiplier values, or the trend reversal logic).
Backtest Period Settings
Use the Start Date and End Date inputs to isolate a specific period for your backtest analysis.
License & Disclaimer
© waranyu.trkm — MIT License.
This script is for educational purposes only and should not be considered financial advice. Trading involves significant risk, and past performance is not indicative of future results. Always conduct your own research and risk assessment before making any trading decisions.

RSI and MACD Divergence IndicatorThe RSI and MACD Divergence Indicator is a custom Pine Script v6 indicator designed for TradingView that identifies and visualizes divergences between price movements and two technical indicators: the Relative Strength Index (RSI) and the Moving Average Convergence Divergence (MACD). Here's a brief explanation of its functionality:
Divergence Detection: The indicator detects both regular and hidden divergences for RSI, MACD (MACD Line), and Histogram. Regular bullish divergences occur when price makes a lower low but the indicator makes a higher low (suggesting a potential reversal upward), while regular bearish divergences occur when price makes a higher high but the indicator makes a lower high (suggesting a potential reversal downward). Hidden divergences indicate continuation patterns (e.g., higher low in price with a lower low in the indicator for bullish continuation).
Customizable Inputs:
Pivot Bars: Sets the number of bars used to confirm pivot highs and lows (default: 5).
RSI and MACD Parameters: Allows adjustment of RSI length (default: 14) and MACD settings (fast: 12, slow: 26, signal: 9).
Toggle Options: Enables/disables detection of regular and hidden divergences for RSI, MACD, and Histogram individually.
Confirmation: Option to wait for pivot confirmation (default: true), delaying divergence display until the pivot is fully formed.
Show Only Last Divergence: Toggles between showing only the most recent divergence (default: true) or all detected divergences (false), with previous lines and labels cleared when true.
Minimum Divergences: Sets the minimum number of divergence types required at a pivot to display (default: 1, max: 6).
Maximum Pivot Points: Limits the number of historical pivot points to check (default: 10).
Maximum Bars to Check: Restricts analysis to the last specified number of bars (default: 500).
Visualization:
Draws lines connecting the price pivot points where divergences are detected, with customizable colors, widths, and styles (solid, dashed, dotted) for RSI and MACD.
Displays a single label per pivot with vertically stacked text listing all detected divergence types (e.g., "RSI Bull Div\nMACD Bull Div"), using semi-transparent backgrounds (green for bullish, red for bearish) and white text.

RSI & DPO support/resistanceThis indicator combines the Relative Strength Index (RSI) to identify overbought and oversold conditions with the Detrended Price Oscillator (DPO) to highlight support and resistance levels.
Unlike traditional indicators that display these metrics in a separate window, this tool integrates them directly onto the main price chart.
This allows for a more cohesive analysis, enabling traders to easily visualize the relationship between price movements and momentum indicators in one unified view.
How to Use It:
Identify Overbought and Oversold Conditions:
Look for RSI values above 70 to identify overbought conditions, suggesting a potential price reversal or pullback. Conversely, RSI values below 30 indicate oversold conditions, which may signal a potential price bounce or upward movement.
Analyze Support and Resistance Levels:
Observe the DPO lines on the main chart to identify key support and resistance levels. When the price approaches these levels, it can provide insights into potential price reversals or breakouts.
Combine Signals for Trading Decisions:
Use the RSI and DPO signals together to make informed trading decisions. For example, if the RSI indicates an overbought condition while the price is near a resistance level identified by the DPO, it may be a good opportunity to consider selling or taking profits.
Monitor Divergences:
Watch for divergences between the RSI and price movements. If the price is making new highs while the RSI is not, it could indicate weakening momentum and a potential reversal.
Set Alerts:
Consider setting alerts for when the RSI crosses above or below the overbought or oversold thresholds, or when the price approaches significant support or resistance levels indicated by the DPO.
Practice Risk Management:
Always use proper risk management techniques, such as setting stop-loss orders and position sizing, to protect your capital while trading based on these indicators.
By following these steps, traders can effectively utilize this indicator to enhance their market analysis and improve their trading strategies.

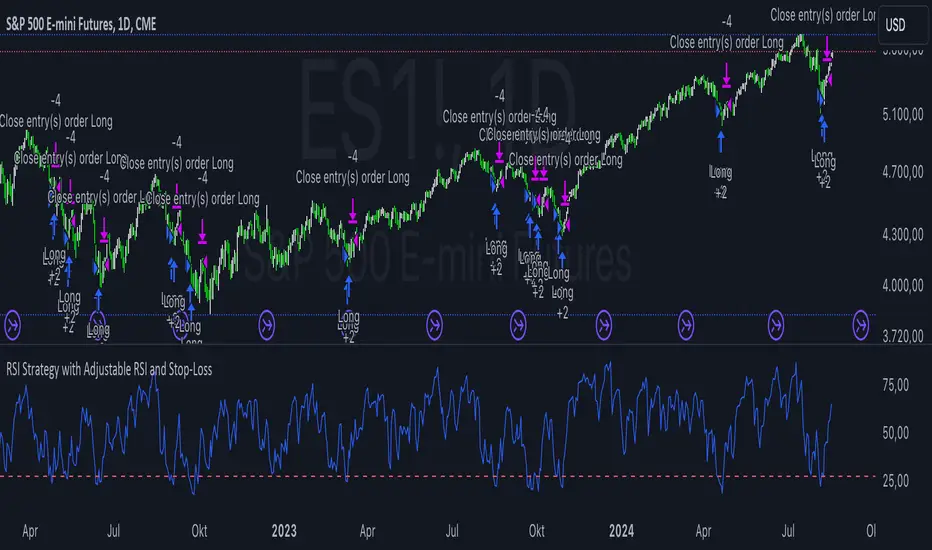
RSI Strategy with Adjustable RSI and Stop-LossThis trading strategy uses the Relative Strength Index (RSI) and a Stop-Loss mechanism to make trading decisions. Here’s a breakdown of how it works:
RSI Calculation:
The RSI is calculated based on the user-defined length (rsi_length). This is a momentum oscillator that measures the speed and change of price movements.
Buy Condition:
The strategy generates a buy signal when the RSI value is below a user-defined threshold (rsi_threshold). This condition indicates that the asset might be oversold and potentially due for a rebound.
Stop-Loss Mechanism:
Upon triggering a buy signal, the strategy calculates the Stop-Loss level. The Stop-Loss level is set to a percentage below the entry price, as specified by the user (stop_loss_percent). This level is used to limit potential losses if the price moves against the trade.
Sell Condition:
A sell signal is generated when the current closing price is higher than the highest high of the previous day. This condition suggests that the price has reached a new high, and the strategy decides to exit the trade.
Plotting:
The RSI values are plotted on the chart for visual reference. A horizontal line is drawn at the RSI threshold level to help visualize the oversold condition.
Summary
Buying Strategy: When RSI is below the specified threshold, indicating potential oversold conditions.
Stop-Loss: Set based on a percentage of the entry price to limit potential losses.
Selling Strategy: When the price surpasses the highest high of the previous day, signaling a potential exit point.
This strategy aims to capture potential rebounds from oversold conditions and manage risk using a Stop-Loss mechanism. As with any trading strategy, it’s essential to test and optimize it under various market conditions to ensure its effectiveness.
RSI Screener / Heatmap - By LeviathanThis script allows you to quickly scan the market by displaying the RSI values of up to 280 tickers at once and visualizing them in an easy-to-understand format using labels with heatmap coloring.
📊 Source
The script can display the RSI from a custom timeframe (MTF) and custom length for the following data:
- Price
- OBV (On Balance Volume)
- Open Interest (for crypto tickers)
📋 Ticker Selection
This script uses a different approach for selecting tickers. Instead of inputting them one by one via input.symbol(), you can now copy-paste or edit a list of tickers in the text area window. This approach allows users to easily exchange ticker lists between each other and, for example, create multiple lists of tickers by sector, market cap, etc., and easily input them into the script. Full credit to @allanster for his functions for extracting tickers from the text. Users can switch between 7 groups of 40 tickers each, totaling 280 tickers.
🖥️ Display Types
- Screener with Labels: Each ticker has its own color-coded label located at its RSI value.
- Group Average RSI: A standard RSI plot that displays the average RSI of all tickers in the group.
- RSI Heatmap (coming soon): Color-coded rows displaying current and historical values of tickers.
- RSI Divergence Heatmap (coming soon): Color-coded rows displaying current and historical regular/hidden bullish/bearish divergences for tickers.
🎨 Appearance
Appearance is fully customizable via user inputs, allowing you to change heatmap/gradient colors, zone coloring, and more.

RSI Momentum Waves [Quantigenics]RSI Momentum Waves Indicator
The RSI Momentum Waves Indicator is your intuitive tool for visualizing market strength and trend persistence. It refines the classic RSI by smoothing the data with Exponential Moving Averages (EMAs), which help clear out the noise to give you a more accurate picture of where the market’s heading. The parameters - RSI Period, Smoothing Period, Overbought, Oversold, Upper Neutral Zone, and Lower Neutral Zone - are all adjustable, so you can tailor the indicator to different market conditions or your trading style.
How It Works:
RSI Period (RsiPer): Adjusts how far back the RSI looks to calculate its value, affecting its sensitivity.
Smoothing Period (SmoothPer): Dictates how smooth the EMA lines are, balancing between sensitivity and noise reduction.
Overbought (OBLevel) / Oversold (OSLevel) Levels: Set the thresholds where the market might be too stretched in either direction and due for a reversal.
Neutral Zones (UpperNZ / LowerNZ): Define the areas where the market is considered neutral, and trend strength is less clear.
Trading Instructions:
Use the RSI Momentum Waves to gain insights into the market’s momentum and make informed decisions:
For Trend Identification: If the waves are consistently above the 50 line and climbing, the market may be bullish; if below and declining, bearish signals are suggested.
Overbought and Oversold Regions: Entering these areas might indicate a potential reversal. A peak and downturn in the overbought region can signal a sell, while a trough and upturn in the oversold region can indicate a buy.
Neutral Zone Caution: In the neutral zones, exercise caution and wait for a breakout in either direction for stronger signals.
Confirm with Other Analysis: Never rely solely on one indicator. Confirm the RSI Momentum Waves signals with other technical indicators or fundamental analysis for best practices.
Remember, the goal is to detect the rhythm of the market’s momentum and act accordingly. Happy trading!

RSI in Candlestick MODEDescription:
The "RSI Bar" indicator is a versatile tool designed to enhance your technical analysis on trading charts. This Pine Script™ code calculates the Relative Strength Index (RSI) for open, close, high, and low prices, and represents the results as bars on the chart. The bars are color-coded based on whether the closing RSI is higher or lower than the opening RSI.
Additionally, the indicator incorporates advanced features such as Pareto analysis and Gaussian smoothing. The Pareto analysis helps identify significant lows and highs in the RSI, providing insights into potential trend reversals. The Gaussian smoothing further refines the analysis, contributing to a more accurate representation of the average RSI trend.
Key Features:
RSI calculation for open, close, high, and low prices.
Color-coded bars for easy visualization of RSI trends.
Pareto analysis to highlight key RSI levels indicating potential reversals.
Gaussian smoothing for improved trend analysis and visualization.
Heiken-Ashi

RSI/MFI Selling Sentiment IndexPsychological Sales Index (Psychological Sales Index)
Fundamental Indicators of Market Sentiment: The Importance of MFI and RSI
The two fundamental indicators that best reflect market sentiment are Money Flow Index (MFI) and Relative Strength Index (RSI). MFI is an indicator of the flow of funds in a market by combining price and volume, which is used to determine whether a stock is over-bought or over-selling. RSI is an indicator of the overheating of the market by measuring the rise and fall of prices, which is applied to the analysis of the relative strength of stock prices. These two indicators allow a quantitative assessment of the market's buying and selling pressure, which provides important information to understand the psychological state of market participants.
Using timing and fundamental metrics
In order to grasp the effective timing of the sale, in-depth consideration was needed on how to use basic indicators. MFI and RSI represent the buying and selling pressures of the market, respectively, but there is a limit to reflecting the overall trend of the market alone. As a result, a study on how to capture more accurate selling points was conducted by comprehensively considering technical analysis along with psychological factors of the market.
The importance of ADX integration and weighting
The "Average Regional Index (ADX)" was missing in the early version. ADX is an indicator of the strength of a trend, and has experienced a problem of less accuracy in selling sentiment indicators, especially in the upward trend. To address this, we incorporated ADX and adopted a method of adjusting the weights of MFI and RSI according to the values of ADX. A high ADX value implies the existence of a strong trend, in which case it is appropriate to reduce the influence of MFI and RSI to give more importance to the strength of the trend. Conversely, a low ADX value increases the influence of MFI and RSI, putting more weight on the psychological elements of the market.
How to use and interpret
The user can adjust several parameters. Key inputs include 'Length', 'Overbought Threshold', 'DI Length', and 'ADX Smoothing'. These parameters are used to set the calculation period, overselling threshold, DI length, and ADX smoothing period of the indicator, respectively. The script calculates the psychological selling index based on MFI, RSI, and ADX. The calculated index is normalized to values between 0 and 100 and is displayed in the graph. Values above 'Overbought Threshold' indicate an overselling state, which can be interpreted as a potential selling signal. This index allows investors to comprehensively evaluate the psychological state of the market and the strength of trends, which can be used to make more accurate selling decisions.

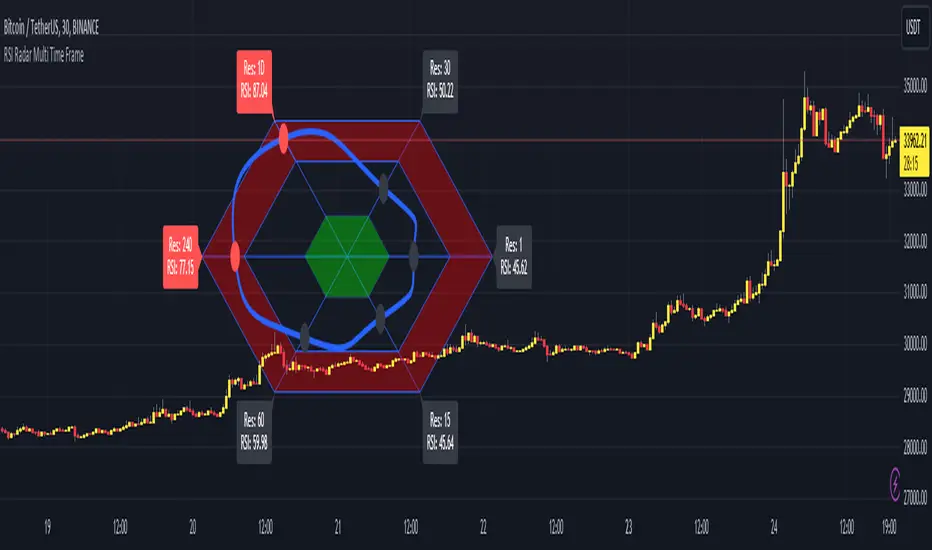
RSI Radar Multi Time FrameHello All!
First of all many Thanks to Tradingview and Pine Team for developing Pine Language all the time! Now we have a new feature and it's called Polylines and I developed RSI Radar Multi Time Frame . This script is an example and experimental work, you can use it as you wish.
The scripts gets RSI values from 6 different time frames, it doesn't matter the time frame you choose is higher/lower or chart time frame. it means that the script can get RSI values from higher or lower time frames than chart time frame.
It's designed to show RSI Radar all the time on the chart even if you zoom in/out or scroll left/right.
You can set OB/OS or RSI line colors. Also RSI polyline is shown as Curved/Hexagon optionally.
Some screenshots here:
Doesn't matter if you zoom out, it can show RSI radar in the visible area:
Another example:
You can change the colors, or see the RSI as Hexagon:
Time frames from seconds to 1Day in this example while chart time frame is any ( 30mins here )
Enjoy!
RSI MACDDifferent Perspective : By using the RSI as the source for MACD calculation, you are incorporating the RSI's characteristics into the MACD indicator. The RSI measures the speed and change of price movements, while the MACD focuses on the convergence and divergence of moving averages. Combining these two indicators may provide a different perspective on market conditions.
Smoothed MACD : Since the RSI is being used as the source for the MACD calculation, the resulting MACD line (macd1 in the code) may exhibit smoother movements compared to a traditional MACD calculated directly from price data. This smoothing effect could potentially help filter out noise and provide a clearer representation of trend changes.
RSI Confirmation : The RSI is often used to identify overbought and oversold conditions. By incorporating the RSI into the MACD calculation, you can potentially gain additional confirmation when the MACD line crosses above or below zero. For example, if the MACD line crosses above zero and the RSI is in an oversold region, it could provide stronger confirmation for a bullish signal.
Example:

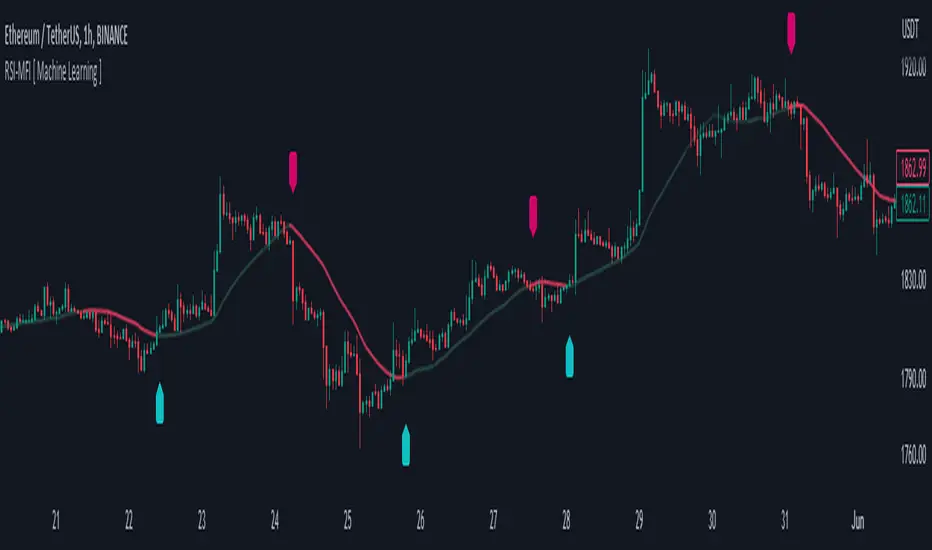
RSI-MFI Machine Learning [ Manhattan distance ]The RSI-MFI Machine Learning Indicator is a technical analysis tool that combines the Relative Strength Index (RSI) and Money Flow Index (MFI) indicators with the Manhattan distance metric.
It aims to provide insights into potential trade setups by leveraging machine learning principles and calculating distances between current and historical data points.
The indicator starts by calculating the RSI and MFI values based on the specified periods for each indicator.
The RSI measures the strength and speed of price movements, while the MFI evaluates the inflow and outflow of money in the market.
By combining these two indicators, the indicator captures both price momentum and money flow dynamics.
To apply machine learning principles , the indicator utilizes the Manhattan distance metric to quantify the similarity or dissimilarity between different data points.
The Manhattan distance is calculated by taking the absolute differences between corresponding RSI and MFI values of the current point and historical points.
Next, the indicator determines the nearest neighbors based on the calculated Manhattan distances.
The number of nearest neighbors is determined by the square root of the specified count of neighbors.
By identifying similar patterns and behaviors in the historical data, the indicator aims to uncover potential trade opportunities.
Trade signals are generated based on the calculated distances. The indicator compares each distance with the maximum distance encountered so far.
If a new maximum distance is found, it updates the value and considers the corresponding direction as a potential trade signal. The trade signals are stored in an array for further analysis.
Furthermore, the indicator considers the price action and a calculated regression line to differentiate between long and short trade signals.
Long trade signals are identified when the closing price is above the regression line, indicating a potentially bullish setup.
Short trade signals are identified when the closing price is below the regression line, indicating a potentially bearish setup.
The RSI-MFI Machine Learning Indicator visualizes the regression line on the price chart and labels the bars accordingly. It highlights the regression line with different colors based on the trade signals, making it easier for traders to identify potential entry or exit points.
Traders can use the RSI-MFI Machine Learning Indicator as a tool to analyze price movements, evaluate market conditions based on RSI and MFI, leverage machine learning concepts to find similar patterns, and make informed trading decisions.
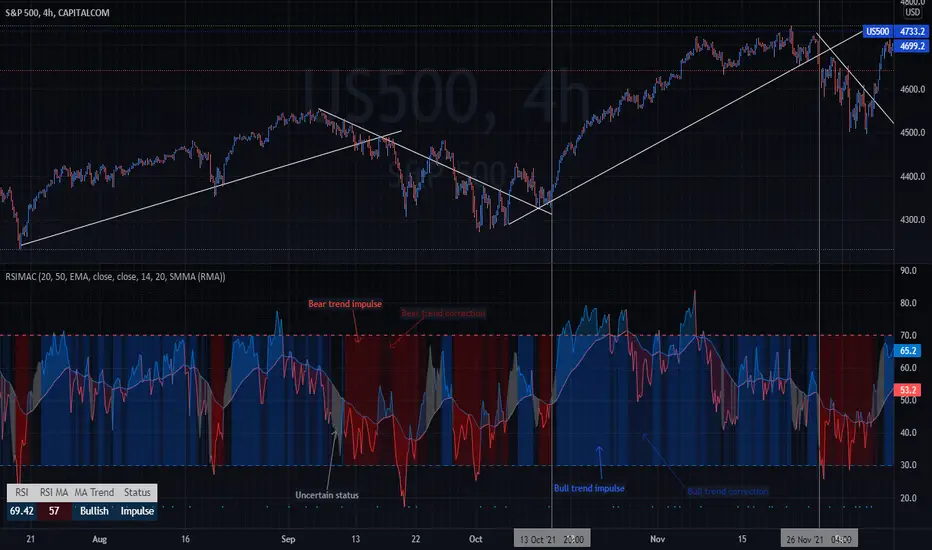
RSI Moving Average CrossoversThis script is an improved version of the RSI indicator, using a moving average on the RSI itself, as well as two other moving averages used to determine the current trend.
A small screener indicating the current movement is displayed in the bottom-left zone of the chart: trend (Bullish/Bearish/Uncertain) and status (Impulse or Correction)
Trends are simply based on moving averages crossovers, coupled to the fact that the current candle closes above the fast MA in a bull trend, and under the fast MA in a bear trend. In other cases, the trend and the movement are considered as "Uncertain" by the indicator.
Options
Various types of moving averages for the RSI and trend MA
Show/Hide crossovers between the RSI and its MA
Color the RSI normal zone with the current trend/movement colors
Show/Hide the screener indicating the current movement
Defaults Parameters
Fast MA 20
Slow MA 50
MA source: Close
RSI Length 14
RSI MA: SMMA (RMA)
RSI MA Length: 20
Don't hesitate to suggest any idea which could improve this indicator.
RSI MACD Same RatioこのインジケータはRSIとMACDを同比率で表示するものです。
なぜ同比率で表示するのでしょうか。
同比率で表示することでRSIとMACDのダイバージェンスを同時に確認することができます。
私には思いつきませんが、他にも使い道はあるかもしれません。
必要と感じた場合はぜひ使ってみてください。
※同比率で表示するためにRSIとMACDの値を変更しています。
そのため、値はあくまで参考程度にご覧ください。
注目すべきはラインのみです。
使う場合は「adjustment ratio」に適当な値を入れて、RSIの比率とMACDの比率を合わせてください。
それでは良いトレードライフを。
-----
This indicator shows RSI and MACD in equal proportions.
Why are they displayed at the same ratio?
By displaying at the same ratio, you can check the divergence of RSI and MACD at the same time.
I can't think of it, but there may be other uses.
If you feel it is necessary, please use it.
caution!
The RSI and MACD values are changed to display the same ratio.
Therefore, please see the values for reference only.
Only the line should be noted.
When using it, enter an appropriate value in "adjustment ratio" and match the RSI ratio with the MACD ratio.
Let's have a good trade life.

RSI/Momentum derivativesthis indicator plots the derivatives of the RSI to get more leading sense of direction of the price
we know that the rsi shows us the momentum of the price, so the easiest/logical way to interpret this indicator and benefit from it is as follows:
- see the price as 'distance'
- see the rsi as 'speed'
- see the rsi/momentum of the above/'speed' as 'velocity'
- see the rsi/momentum of the above/'velocity' as 'acceleration'
once you understand this you can analyse and interpret this indicator to give you a more leading analysis and more accurate entry and exit points.
- also includes the RMA for each RSI derivative which can help for identifying breakouts, direction of price, pivot points and more.
in the above chart
- black is the standard rsi/speed
- orange is the momentum of the rsi/velocity
- green is the momentum of the velocity

RSI Trend Indicator [paRSI]The Relative Strength Index ( RSI ) is a measurement used by traders to assess the price momentum. It is scaled from 0 to 100. when RSI reads below 30, it is usually interpreted as oversold and when RSI is above 70 it is usually interpreted as overbought. However, it is usually not profitable to trade based on overbought and oversold signal.
RSI Trend Indicator or as I like to call it "paRSI" ("Parsa (my name) + RSI") shows that when RSI is above a specific number (default value = 60) it indicates bullish trend and when RSI is below a specific number (default value = 40 ) it indicates bearish trend. Lastly when RSI is below the 2 specified numbers it indicates a neutral trend.
I don't recommend trading based on this single indicator. If you're a trend trader this might be useful tool in addition to your own strategy
Usage:
If the created pattern has worked previously on the chart, you could enter on the first stages of the green or red section (depending on the market's trend).
It is not recommended to trade in any direction when there is no color
*THIS IS A TREND FOLLOWING STRATEGY AND DOES NOT WORK ON ALL MARKETS*
