(JS) RSI Divergence Volume Weighted (v1.0)This indicator is meant to expand upon the current RSI format by adding more variables into the equation. The standard RSI is based off one value that you select (open, close, OHLC4, HLC3, etc.) while this version takes 3 variables into account. 1st - it takes the standard variable that RSI normally uses. 2nd - it factors RSI divergence into the plot by taking the RSI movement % and price movement % to form a ratio. Using this ratio, I duplicated the RSI formula and created a divergence RS to be factored in with the standard price RS. And finally, the 3rd variable is Relative Volume (which I have made adjustable). When calculating for the average up and average down numbers needed to form RS in the original equation, this indicator multiplies the appropriate average based on if it's a green or red day (going into the divergence RS, not the original one). On green days, the green average is multiplied by the relative volume, and on red days, the red average is multiplied by relative volume. What this does, is add to moves with confirmation volume and make moves on no volume weaker - rendering a more precise and effective result. I plan on adding to this, but this is my 1st indicator I've published, so Ihope you enjoy it.
Komut dosyalarını "rsi divergence" için ara

TMsignal - RSI Divergence V1.0TMsignal - RSI Divergence V1.0: It automatically shows RSI Divergence, being much useful for detecting future changes in the tendency of the current stock, and weakness in the actual tendency.
Different timeframes can be set up to meet your needs.
We hope you like it! Contact us any question or improvement suggestions.

RatTrend Multiple RSI Divergence MA Cross OscillatorThis Indicator based on RSI Divergence with Overbought and oversold signals.
All tops and bottoms calculated with Moving Average Crosses and combines with RSI signals.
Best working Timeframe is H4 on current settings, you can modify values to find best for you.
Current settings best for BTC trading.
At the beginning it can confuse you to understand but you will understand signal patterns.
Have fun.

CDC RSI Divergence 15-10-2016An updated version of CDC RSI Divergence
The last version have fixed reversal amount to weed out false signal.
The reversal amount, however, needs to be calibrated to different chart.
The new one uses ATR instead, user can customize the ATR multiplier.
THIS IS NOT A TRADING SIGNAL SYSTEM
though it can be used in such a way it is not designed to.
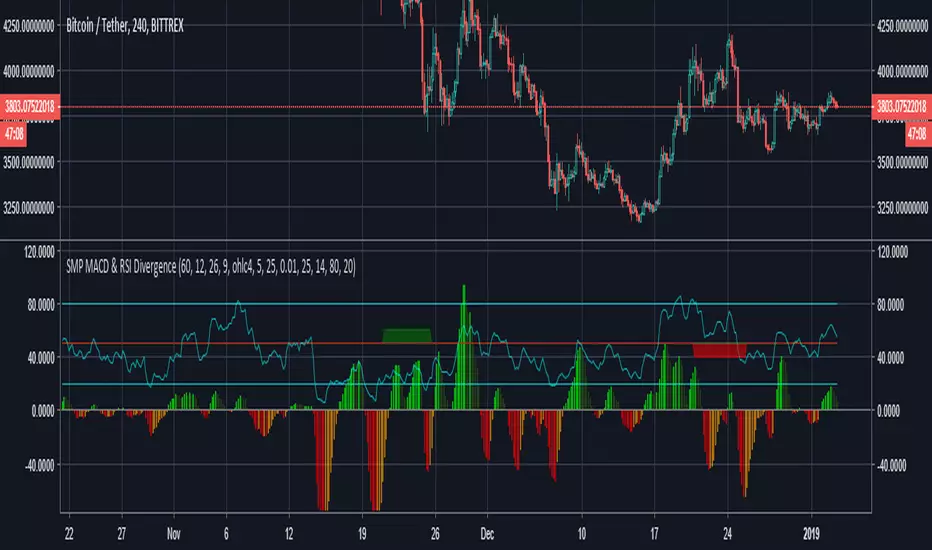
The system helps identify Bullish and Bearish Divergence to help trader change their bias accordingly and should be used in conjunction with a trend following signal.
BULLISH DIVERGENCE is displayed with a green fill over 50 line.
BEARISH DIVERGENCE is displayed with a red fill under 50 line.
The indicator start on the bar where divergence is detected and persists for another 25 bars for easy regcognition.

WIZARD DETECTOR STOCH/RSI DIVERGENCEStochastic RSI Divergence Detector
Short and Long time frames
Alert System


CDC RSI Divergence Strategy for Bitcoin ( by inwCoin )This strategy is based on CDC RSI Divergence indicator ( www.chaloke.com )
Also some code from CTC R-Breaker strategy ( ctc.in.th )
For best result, using 1 H timeframe.
I tried backtest at Bitmex ( XBTUSD ) Bitfinex ( BTCUSD ), OKex ( BTCUSD3M ) and it result is ok.


Multi-Timeframe RSIRSI Divergence (Time-Based Engine)
This script is a powerful and highly customizable tool designed to automatically detect and display RSI divergences from up to three independent, user-defined timeframes directly on your chart. It eliminates the need to manually switch between timeframes to find these critical trading signals, allowing you to see long-term and short-term divergences all in one place.
The engine is built to be flexible, supporting both regular (reversal) divergences and hidden (trend-continuation) divergences. It's designed for traders who rely on divergence analysis as a core part of their strategy.
Key Features
Multi-Timeframe (MTF) Analysis: Configure and display divergences from up to three different timeframes simultaneously (e.g., show 4-Hour, Daily, and Weekly divergences on your 1-Hour chart). Each timeframe operates independently with its own settings.
Regular & Hidden Divergence: The script can detect both standard regular divergences that signal potential reversals and hidden divergences that suggest a trend may continue.
Configurable Pivot Strength: You have full control over the sensitivity of pivot detection. The 'Left Strength' and 'Right Strength' settings allow you to define what qualifies as a significant price pivot, filtering out market noise.
Bar Count Filter: Refine your signals by setting the minimum and maximum number of bars allowed between two pivots. This ensures you only see divergences that fit your specific strategic timeframe.
Dedicated Alerts: Each of the three timeframes has its own "Enable Alerts" toggle. When a new divergence line is drawn on the chart for a specific timeframe, a corresponding alert can be triggered, ensuring you never miss a potential setup.
Full Visual Customization: Tailor the look and feel of the indicator to your preference. Each timeframe has unique color settings for its bullish and bearish lines, allowing for easy visual identification. You can also toggle the visibility of various chart markers to keep your view clean.
How to Use
1. Add the indicator to your chart.
2. Open the Settings panel.
3. For each timeframe you wish to use (1, 2, or 3), check the "Enable Timeframe" box.
4. Select the desired Timeframe, RSI Length, and Pivot Strength for each active engine.
5. Adjust the Min/Max Bars filter to match your trading style.
6. If you want to receive notifications, check the "Enable Alerts" box for the desired timeframe(s). Then, create an alert using TradingView's alert manager, selecting the indicator and choosing the "Any alert() function call" option.

RSI Divergence (chiefwils0n)Greetings All,
This simple indicator is a stylistic modification of the original TradingView Divergence indicator. I've enhanced the following:
Styles
RSI will turn RED when overbought and CYAN when oversold. CYAN presents an LONG opportunity, while RED is where I look for SHORT entries.
Added background color to the the Oversold/Mid-Level and Overbought/Mid-Level. The idea is to go LONG when RSI is in the GREEN channel, and consider closing your position when RSI is the RED channel. Or, SHORT in the RED, and close your position in the GREEN.
Hidden Divergences are styled with muted colors. Maroon is Hidden Bearish and Dark Green is Hidden Bullish.
Regular Divergences have brighter labels with Red (Bearish) and Lime (Bullish). My logic is to bring attention to these divergences, since they are stronger than hidden divergences.
Alerts:
I also added the following alerts:
Bullish Divergence
Hidden Bullish Divergence
Bearish Divergence
Hidden Bearish Divergence
RSI Overbought
RSI Oversold'
The alerts really distinguish this script for me. I hope you enjoy.
Happy Trading!
RSI + DivergencesHi Guys,
This indicator gives you the trend changes (Designed with the basics of Vash's RSI advanced and the Fikira divergence indicator)
This indicator will only give you regular divergences.
Please keep in mind that a trading plan is not only built with momentum but also with location and structure.
Good trading,

RSI Divergence + Hidden Divergence on closeThis script shows divergences over the periods 2,3,4,5 and 6.
One period is 1 day on the Daily, or 5m on the 5m chart
I will add more when needed. but it will get busy soon on the chart so that i why i stick to the most important ones.
The divergence is indicated with a number on the end of the divergence. The number shows how many periods you have to go back in time. This is where you can draw a line as usual. (if anyone knows how to draw a line let me know)
The divergence is only detected after one extra candle close.
The divergence is based on close price.
Red is Bearish divergence
Green is Bullish divergence
Orange on top is hidden(negative) divergence
Orange on bottom is also hidden(Positive) divergence
between 40 and 80 is uptrend
between 20 and 60 is downtrend

RSI Divergence Indicator - Trading VidhyalayaThis indicator automatically identifies RSI-based bullish and bearish divergences and visually marks them directly on the candlestick chart, making it easier for traders to spot potential reversals.
✅ Key Features:
Bullish Divergence
When the price makes a lower low, but the RSI makes a higher low, the indicator highlights the candle with a green arrow or label to signal potential upward reversal.
Bearish Divergence
When the price makes a higher high, but the RSI forms a lower high, the indicator marks the candle with a red arrow or label to indicate a possible downside move.
Real-time Detection
Divergences are plotted in real-time, helping traders react quickly to changing market conditions.
Candlestick Overlay
Signals are shown directly on the chart, rather than below in a separate panel, allowing for faster and clearer decision-making.
📊 Benefits:
Helps in identifying early trend reversals
Works well with other indicators like MACD, Moving Averages, or Volume
Great for both beginners and advanced traders
Saves time by automating divergence spotting, reducing manual errors

RSI Divergence (Pine v4)Summary
Script highlights the divergences in RSI worth taking notice of. By comparing current envionment to relative sample we can see more than
the standard divergences that many catch through analysis. This framework aims to remove the bias or noise many see when looking for any supporting
evidence to their given emotion on a market.
Step-by-Step Walkthrough
Calculates RSI
Sets Divergence Framework
-------> a. Defining variable values, mandatory in Pine 4)
-------> b. Identify Divergences --> "If bar with lowest / highest is current bar, use it's value"
Compare high of current bar being examined with previous bar's high --> "If curr bar high is higher than the max bar high in the lookback window range"
Finds pivot point with at least 2 right candles with lower value
Finds pivot point with at least 2 right candles with lower value
Plot
Set Alerts
This RSI Script is intended for public use and can be shared / implemented as needed
Questions? I do not monitor my TradingView inbox. See email address in signature at the bottom of this page for contact information.

RSI Divergence Smoothed with Signal Line and Power ZonesThis Indicator plots Regular and Hidden Divergences lines for an RSI smoothed by an EMA and for its Signal Line
The RSI can be set to change colour with direction or can be set as single colour
Colour Changing RSI helps when trading Multiple Timeframes as you can look for confluence in the direction of RSI
The divergence script is thanks to @RicardoSantos, I've just adjusted it to suite my indicator
Remember that divergences work best when traded with the trend or very late in a trend when going against the trend
I have also added a Colour Changing Signal Line & Hima Reddy's Power Zones so now you can also
Take full advantage of trading; signal line crosses, 50 crosses and Power Zone RSI support and resistance

RSI with Close & Tail DivergencesRSI divergence is a cornerstone signal for both stock and cryptocurrency traders, renowned for its reliability.
The basis for measuring divergence can vary:
Historically, it's been determined by the candlestick's closing price.
However, a contemporary approach uses the tail values, specifically the high and low prices, of the candlestick.
Depending on the criteria selected, the resultant signals can be markedly different.
Our innovative indicator offers:
Divergence tracking based on the closing price of the candlestick.
Divergence tracking considering the candlestick's peak and trough values.
A unique convergence of both types of divergence signals.
With this tool, traders are empowered to make informed decisions, anchored in precise divergence cues.
This indicator boasts the following capabilities:
Displays divergence based on closing price, highs/lows, as well as a unique combined criterion.
Highlights pivot points.
Denotes divergence spots on the RSI chart with lines.
Offers a background color representation instead of labels.

RSI Divergence Scanner by zdmreDivergence is when the price of an asset is moving in the opposite direction of a technical indicator, such as an oscillator, or is moving contrary to other data. Divergence warns that the current price trend may be weakening, and in some cases may lead to the price changing direction.
If the stock is rising and making new highs, ideally the RSI is reaching new highs as well. If the stock is making new highs, but the RSI starts making lower highs, this warns the price uptrend may be weakening. This is negative divergence.
Positive divergence is the opposite situation. Imagine the price of a stock is making new lows while the RSI makes higher lows with each swing in the stock price. Investors may conclude that the lower lows in the stock price are losing their downward momentum and a trend reversal may soon follow.
Divergence is one of the common uses of many technical indicators, primarily the oscillators.
Use it at your own risk

RSI Divergence Indicator (colorcoded and smoothed)This indicator uses a custom RSI algorithm which displays a modified RSI and stochastic RSI as a simple to read and color coded oscillator.
When RSI turns green it signals a bullish divergence and considers the asset as overbought.
When it turns red it signals a bearish divergence and considers the asset oversold.
Overbought levels at 80 and oversold levels at 20.
Displaying the RSI this way removes the hassle to manually spot for divergences in the chart.
Only use this indicator in confluence with other indicators to confirm an upcoming trend.
This indicator features alarms when the indicator turns green or red.

RSI divergences @D4NN1_0C34NAltcoin / Bitcoin RSI Overlay signals on:
Bull divergence
Bear divergence
Hidden bull divergence
Hidden bear divergence
All divergence signals are under special circumstances.
Later versions might include additional parameters.
Find me on Twitter: @D4NN1_0C34N
our german website: cointrend.de
or youtube: www.youtube.de

RSI DivergenceRSI Indicator with the following additions:
- highlighting the overbought/oversold conditions
- show divergences

RSI Divergence(CompactFX)This is the standard "RSI" with "divergence" displayed. Additionally, it has the following features:
- The line color shifts above and below the RSI 50 threshold.
- The MA can be displayed on the RSI.
- Signs of an expected reversal are displayed.
**Examples of Use**
*For Swing Traders
In addition to using the standard RSI, the divergence display can serve as a trigger for further consideration.
*For Scalpers
For athletic traders who prefer intuition over logic and calculation, we recommend customizing the RSI color to your liking for bulls and bears. Consider extending the price until the RSI color changes. Below is my example.
-One-Minute Scalping
When prices are moving above the long-term and short-term MAs, you can hold a position as long as the RSI is above 55 (below 45 for bears). In this case, pivot signs can also be used as a guide for closing positions. Of course, this is best done during periods of high momentum. Five- and 15-minute scalping also works well. However, these only work if you adhere to my logic. Don't forget to adhere to your own logic and framework.
The above is just an example. Feel free to use it as you like.
