MRSIMulti RSI Divergence 14 and 22
For a full spectrum of the divergence movement into the Chart TRUE overlay
Komut dosyalarını "rsi divergence" için ara

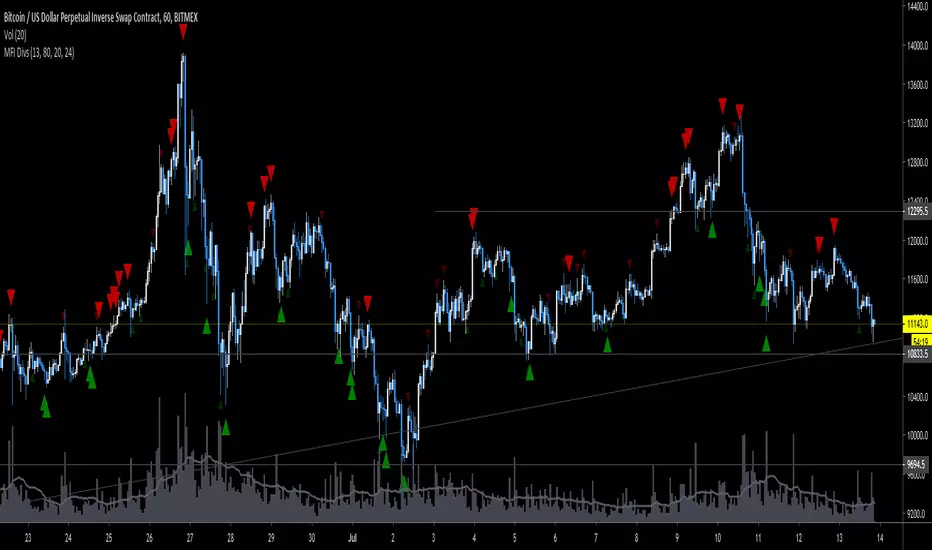
MFI DivergenceThis is an edit of the RSI divergence indicator by Libertus (thanks!). Play around with the settings, you'll want to tweak length & lookback per market & timeframe.
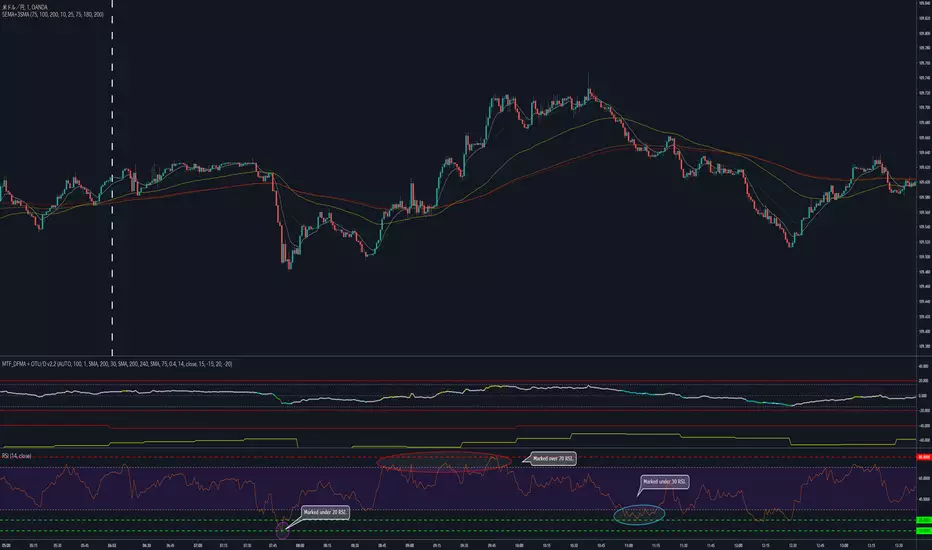
MTF_DFMA + Over Thrust Up / Down v2.1// @version=3
// Copyright @ ALEX
// alpha tester : Norakichi Senpai Santa Norakichi Prop Senpai
// alpha tester : Prop trader : SHINNchan
// Special Thanks WBZ Trading Group
// Function 1. Triple Line, Multi Time Frame _ Difference from Moving Average
// You can use 3-type of DFMA. Each DFMA can apply difference Resolution.
// This means that you can grasp High Time Frame Trend and can avoid Thoughtless Contrarian Scalping Entry.
// for example, DFMA_#1 is 1min and DFMA_#2 is 30min.
// Function 2. By coloring in DFMA_#1 to show "Over Thrust Up". The coloring is depend on "RSI" using OHLC.
// So you can grasp short term "Over Thrust Up", and also "RSI Divergence" from coloring.


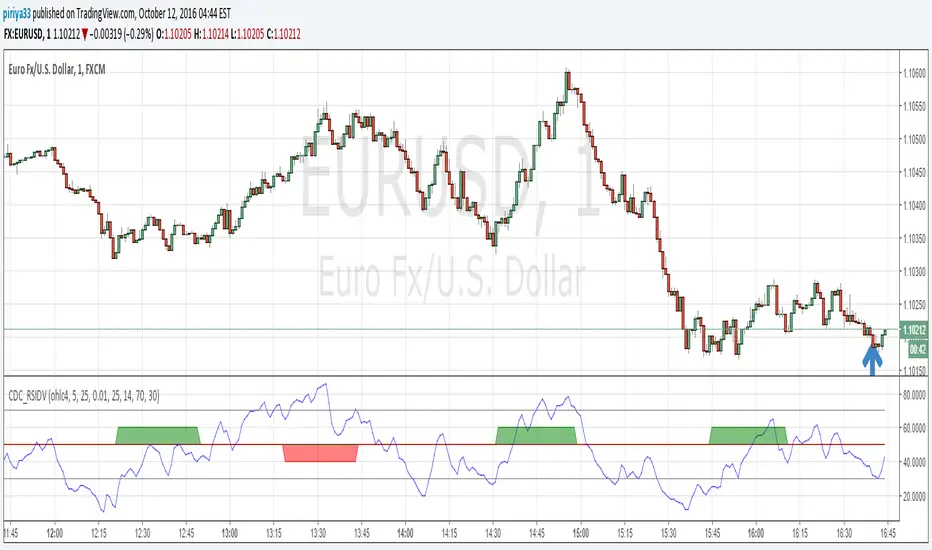
CDC RSI DivergenceThis script alerts when a bullish or bearish divergence occurs.
The alert have minor repainting so do not use this as an entry / exit signal
but rather a guideline to be considered with other indicators. (MACD for example)

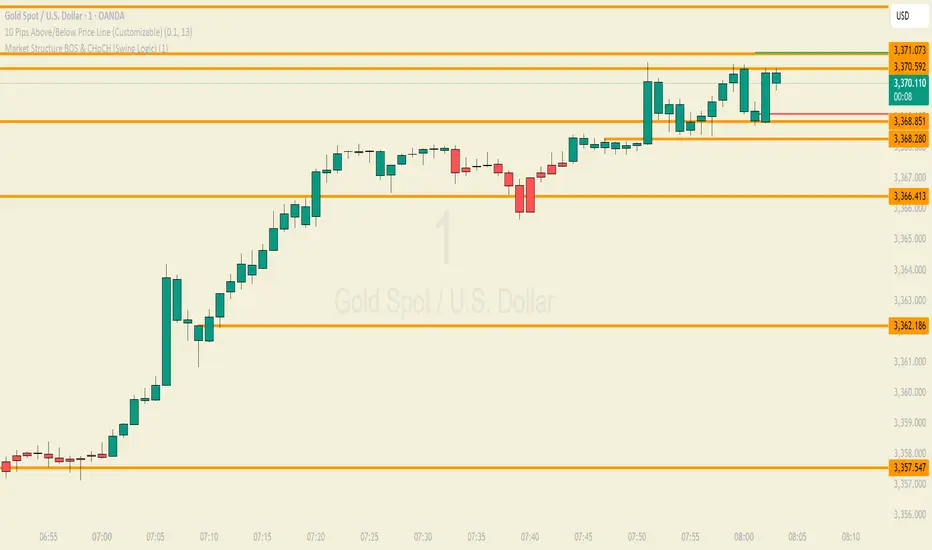
Easy Market Structure BOS & CHoCH (Swing Logic)A trend reversal occurs when the direction of the market changes from an uptrend to a downtrend or vice versa. It is typically confirmed by a shift in price structure, such as a break of key support or resistance, a change in swing highs/lows, or specific candlestick patterns like engulfing or pin bars. Indicators like RSI divergence or moving average crossovers can also support reversal identification. Reversals often follow a strong trend and signal a potential new direction in price movement

easy Market Structure BOS & CHoCH (Swing Logic)
A trend reversal occurs when the direction of the market changes from an uptrend to a downtrend or vice versa. It is typically confirmed by a shift in price structure, such as a break of key support or resistance, a change in swing highs/lows, or specific candlestick patterns like engulfing or pin bars. Indicators like RSI divergence or moving average crossovers can also support reversal identification. Reversals often follow a strong trend and signal a potential new direction in price movement
easy market structure finderA trend reversal occurs when the direction of the market changes from an uptrend to a downtrend or vice versa. It is typically confirmed by a shift in price structure, such as a break of key support or resistance, a change in swing highs/lows, or specific candlestick patterns like engulfing or pin bars. Indicators like RSI divergence or moving average crossovers can also support reversal identification. Reversals often follow a strong trend and signal a potential new direction in price movement

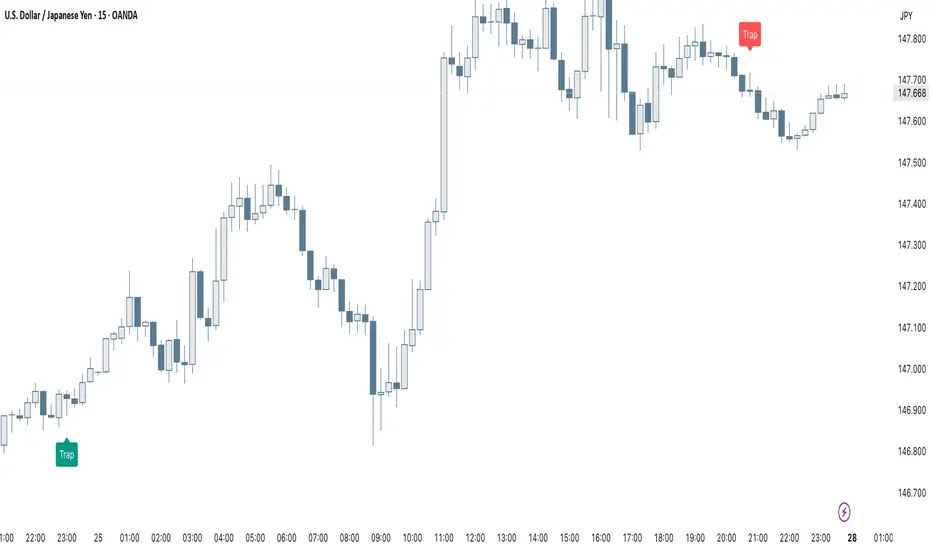
Smart Trap Candle Detector [Pro]Purpose
The Smart Trap Candle Detector is designed to identify common fakeout scenarios in the market, where price breaks a key swing high or low and quickly reverses. These “trap candles” often mislead breakout traders and are commonly used by smart money to induce liquidity before reversing.
How It Works
The script detects potential trap candles using these conditions:
A bearish trap is identified when price breaks above a recent swing high and closes back below it.
A bullish trap is identified when price breaks below a recent swing low and closes back above it.
Optional confirmation from the previous candle’s direction can be enabled.
Swing highs/lows are calculated dynamically using a configurable lookback window.
Once a trap candle is confirmed, a signal is displayed on the chart along with optional labels and alert conditions.
Features
Detects fake breakouts of swing highs and lows
Configurable swing lookback period
Optional confirmation candle filter
Optional label display on trap bars
Built-in alerts for bullish and bearish trap signals
Lightweight, real-time signal detection
Usage Tips
Best used on intraday timeframes such as 15m, 30m, or 1H
Use around key support/resistance zones or liquidity areas
Combine with other confluence signals such as order blocks or RSI divergence
Adjust the swing lookback period depending on the volatility of the asset
Ultimate ATR Extreme DetectorUltimate ATR Extreme Detector
Professional Volatility Analysis Tool for Strategic Trading
Discover Market Turning Points with Precision
Key Features
Smart Extremum Detection: Identifies when ATR reaches its highest or lowest point in your specified lookback period
Quad Visual Alert System:
▲ Green bottom triangles for low volatility signals
▼ Red top triangles for high volatility signals
Background color highlighting for instant state recognition
Status panel showing current volatility extremes
Dual Alert Modes:
TradingView native alerts ("ATR Low/High Signal")
Visual chart alerts with period details (e.g., "Alert: ATR Low (50 bars)")
4 Calculation Methods: RMA (Wilder's), SMA, EMA, and WMA
Fully Customizable:
Adjustable ATR period (default: 14)
Variable lookback window (default: 50)
Toggle features on/off via intuitive input settings
How It Works
The indicator scans volatility extremes using proprietary logic:
Calculates True Range using selected method (RMA/SMA/EMA/WMA)
Compares current ATR value against historical data
Flags critical moments when:
Volatility contracts to N-period lows (prepare for breakouts)
Volatility expands to N-period highs (watch for trend exhaustion)
Strategic Applications
markdown
复制
| SIGNAL | MARKET CONDITION | TRADING IMPLICATION |
|------------------|-----------------------|--------------------------------|
| Low Volatility | Contraction/Consolidation | Anticipate breakout moves |
| High Volatility | Expansion/Climax | Prepare for reversals or pauses |
Position Sizing: Use ATR values to determine optimal stop distances
Entry Timing: Combine with price action at key support/resistance
Risk Management: Adjust stops dynamically based on volatility regime
Optimization Guide
Day Trading: Short lookback (20-30 periods)
Swing Trading: Medium lookback (50-100 periods)
Position Trading: Long lookback (100-200 periods)
Volatility Analysis: Compare multiple timeframes simultaneously
Professional Setup Recommendations
Combine with:
Breakout Confirmation: Volume spikes, chart patterns
Reversal Signals: RSI divergence, candlestick reversals
Volatility Filters: Bollinger Band contraction, Keltner Channel breakout
Compatibility: Works flawlessly across FX, stocks, crypto, and commodities on all timeframes.
Why Traders Choose This Indicator
"Transforms complex volatility analysis into clear, actionable visual cues – the essential tool for breakout traders and risk managers alike."
Install Now to:
Spot consolidation before big moves
Identify exhaustion at trend extremes
Automate volatility-based position sizing
Receive instant alerts at critical volatility turns
Master market rhythms with professional-grade volatility intelligence!

50/100 EMA Crossover with Candle Confirmation📘 **50/100 EMA Crossover with Candle Confirmation – Strategy Description**
The **50/100 EMA Crossover with Candle Confirmation** is a trend-following strategy designed to filter high-probability entries by combining exponential moving average (EMA) crossovers with strong price action confirmation. This strategy aims to reduce false signals commonly associated with EMA-only systems by requiring a **candle close confirmation in the direction of the trend**, making it more reliable for intraday or swing trading across Forex, crypto, and stock markets.
---
### 🔍 **Core Logic**
* The strategy is based on the interaction of the **50 EMA** (fast-moving average) and the **100 EMA** (slow-moving average).
* **Trend direction** is determined by the crossover:
* **Bullish Trend**: When the 50 EMA crosses **above** the 100 EMA.
* **Bearish Trend**: When the 50 EMA crosses **below** the 100 EMA.
* To **filter out false breakouts**, a **candle confirmation** is used:
* For a **Buy signal**: After a bullish crossover, wait for a strong bullish candle (e.g., full-body green candle) to **close above both EMAs**.
* For a **Sell signal**: After a bearish crossover, wait for a strong bearish candle to **close below both EMAs**.
---
### ✅ **Entry Conditions**
**Buy Entry:**
* 50 EMA crosses above 100 EMA.
* Latest candle closes **above both EMAs**.
* Candle must be bullish (green/full body preferred).
**Sell Entry:**
* 50 EMA crosses below 100 EMA.
* Latest candle closes **below both EMAs**.
* Candle must be bearish (red/full body preferred).
---
### 🛑 **Exit or Take-Profit Options**
* **Fixed TP/SL**: 1:2 or 1:3 risk-reward.
* **Trailing Stop**: Based on recent swing highs/lows or ATR.
* **EMA Exit**: Exit trade when the candle closes on the opposite side of 50 EMA.
---
### ⚙️ **Best Settings**
* **Timeframes**: 5M, 15M, 1H, 4H (works well on most).
* **Markets**: Forex, Crypto (e.g., BTC/ETH), Indices (e.g., NASDAQ, NIFTY50).
* **Recommended filters**:
* Use with RSI divergence or volume confirmation.
* Avoid using during high-impact news (especially on lower timeframes).
---
### 🧠 **Why This Works**
The 50/100 EMA crossover provides a **medium-term trend signal**, reducing noise seen in fast EMAs (like 9 or 21). The candle confirmation adds a **momentum filter**, ensuring price supports the directional bias. This makes it suitable for traders who want a balance of trend and entry precision without overcomplicating with too many indicators.
---
### 📈 **Advantages**
* Simple yet effective for identifying trends.
* Filters out fakeouts using candle confirmation.
* Easy to automate in Pine Script or other trading bots.
* Can be combined with support/resistance or SMC zones for better confluence.
---
### ⚠️ **Limitations**
* May lag slightly in ranging markets.
* Late entries possible due to confirmation candle.
* Works best with additional volume or volatility filter.

Haven Average Daily RangeOverview
This indicator is an enhanced version of the traditional ADR tool that adapts to intraday price movements. Unlike static ADR levels, this indicator dynamically adjusts its range boundaries based on real-time price action while maintaining the original ADR calculation framework.
Key Features
ADR calculation based on multiple periods (5, 10, and 20 days)
ADR levels displayed with automatic style changes upon range reach
Customizable display settings (color, line style)
Price labels for better visualization
The indicator helps traders assess the instrument's volatility, identify potential reversal zones, and plan daily trading targets.
Suitable for all timeframes up to D1 and any trading instrument.
How It Works
Session Start (UTC+0): Calculates ADR based on historical data and sets initial High/Low levels
Dynamic Phase: Monitors price action and adjusts the opposite boundary (ADR Low or High) when new extremes are reached.
When price creates new Day high price above the opening price, the ADR Low level moves upward proportionally.
When price creates new Day low price below the opening price, the ADR High level moves downward proportionally.
Completion Phase: Stops adjustments and highlights breach when price reaches either boundary
Trading Application
Entry and Exit Signals
The ADR boundaries serve as key decision points for trade execution. When price approaches the upper ADR boundary, it often signals a potential selling zone, particularly when confluence exists with other overbought indicators such as RSI divergence or resistance levels. Conversely, price reaching the lower ADR boundary frequently indicates potential buying opportunities, especially when supported by oversold conditions or support confluences.
Trend Continuation Assessment
One of the most valuable applications is gauging the probability of continued directional movement. When the current session's price action has not yet reached either ADR boundary, statistical probability favors trend continuation in the established direction. This information helps traders stay with profitable positions longer rather than exiting prematurely.
Reversal and Consolidation Zones
The visual color change to orange when ADR boundaries are reached provides immediate feedback that the normal daily range has been exhausted. At this point, the probability of trend reversal or sideways consolidation increases significantly. This signal helps traders prepare for potential position adjustments or new counter-trend opportunities.

VWAP Supply & Demand Zones PRO**Overview:**
This script represents a major evolution of the original "VWAP Supply and Demand Zones" indicator. Initially created to explore price interaction with VWAP, it has now matured into a robust and feature-rich tool for identifying high-probability zones of institutional buying and selling pressure. The update introduces volume and momentum validation, dynamic zone management, alert logic, and a visual dashboard (HUD) — all designed for improved precision and clarity. The structural improvements, anti-repainting logic, and significant added utility warranted releasing this as a new script rather than a minor update.
---
### What It Does:
This indicator dynamically detects **supply and demand zones** using VWAP-based logic combined with **volume** and **momentum confirmation**. When price crosses VWAP with strength, it identifies the potential zone of excess demand (below VWAP) or supply (above VWAP), marking it visually with colored regions on the chart.
Each zone is extended for a user-defined duration, monitored for touch interactions (tests), and tracked for possible breaks. The script helps traders interpret price behavior around these institutional zones as either **reversal** opportunities or **continuation** confirmation depending on context and strategy preference.
---
### How It Works:
* **VWAP Basis**: Zones are anchored at VWAP at the time of a significant cross.
* **Volume & Momentum Filters**: Crosses are only considered valid if backed by above-average volume and notable price momentum.
* **Zone Drawing**: Validated supply and demand zones are drawn as boxes on the chart. Each is extended forward for a customizable number of bars.
* **Touch Counting**: Zones track the number of price touches. Alerts are issued after a user-defined number of tests.
* **Break Detection**: If price closes significantly beyond a zone boundary, the zone is marked as broken and visually dimmed.
* **Visual Dashboard (HUD)**: A compact real-time HUD displays VWAP value, active zone counts, and current market bias.
---
### How to Use It:
**Reversal Trading:**
* Look for price **rejecting** a zone after touching it.
* Use rejection candles or secondary indicators (e.g., RSI divergence) to confirm.
* These setups may offer low-risk entries when price respects the zone.
**Continuation Trading:**
* A **break of a zone** suggests strong directional bias.
* Use confirmed zone breaks to enter in the direction of momentum.
* Ideal in trending environments, especially with high volume and ATR movement.
---
### Key Inputs:
* **VWAP Length**: Moving VWAP period (default: 20)
* **Zone Width %**: Percentage size of zone buffer (default: 0.5%)
* **Min Touches**: How many times price must test a zone before alerts trigger
* **Zone Extension**: How far into the future zones are projected
* **Volume & ATR Filters**: Ensure only strong, valid crossovers create zones
---
### Alerts:
You can enable alerts for:
* **New zone creation**
* **Zone tests (after minimum touch count)**
* **Zone breaks**
* **VWAP crosses**
* **Active presence inside a zone (entry conditions)**
These alerts help automate market monitoring, making it suitable for discretionary or systematic workflows.
---
### Why It's a New Script:
This is not a cosmetic update. The internal logic, signal generation, filtering methodology, visual engine, and UX framework have been entirely rebuilt from the ground up. The result is a highly adaptive, precision-oriented tool — appropriate for intraday scalpers and swing traders alike. It goes far beyond the original in terms of functionality and reliability, justifying a fresh release.
---
### Suitable Markets and Timeframes:
* Works across all liquid markets (crypto, equities, futures, forex)
* Best used on timeframes where volume data is stable (5m and above recommended)
* Recalibrate inputs for optimal detection across instruments

Bollinger Free BarsIdentify Extreme Price Actions with Non-Overlay Visualization
Core Functionality
This indicator detects two types of Bollinger Band breakout patterns without cluttering your chart:
1 ️⃣ Half Breakout Bar (Blue Triangles)
- Triggers when both open & close prices are outside the Bollinger Bands
- Suggests strong directional momentum continuation
2 ️⃣ Complete Breakout Bar (Red Flags)
- Activates when entire price action (including wicks) stays outside the bands
- Signals extreme volatility exhaustion points
Feature Highlights
◾ Smart Band Display
Translucent bands (#2196F3 & #FF9800 with 70% transparency) maintain chart clarity while showing dynamic volatility ranges
◾ Parameter Customization
- Adjustable period (default 20) & deviation multiplier (default 2.0)
- Selectable price source (close/open/high/low)
◾ Statistical Validation
Based on Bollinger Band's 95.4% price containment principle, signals filter out 4.6% extreme market conditions for high-probability scenarios.
Recommended Usage
1. Combine with volume analysis (significant breakout with high volume increases signal reliability)
2. Confirm with trend lines or RSI divergence
3. Adjust transparency via "Style" tab for multi-indicator layouts
Code Safety
- No repainting: All calculations use historical price data only
- No external network requests
- Open-source logic compliant with Pine Script v6 standards
Disclaimer
This tool is for technical analysis education only. Past performance doesn't guarantee future results. Always validate signals with fundamental analysis and proper risk management.

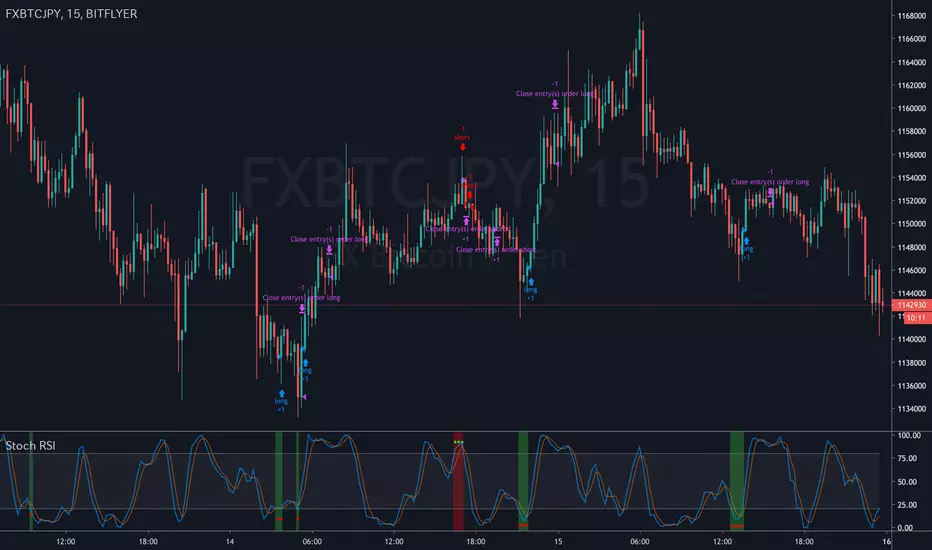
Multi Stochastic AlertHello Everyone,
I have created a Multi Stochastic Alert based on Scalping Strategy
The Strategy uses below 4 Stochastic indicator:
1. Stochastic (9,3)
2. Stochastic (14,3)
3. Stochastic (40,4)
4. Stochastic (60,10)
Trade entry become active when all of these goes below 20 or above 80, In this indicator you don't need to use all 4, this will show red and green background whenever all of them goes below 20 or above 80.
As shown in picture below, it works better when script is making a channel, Our indicator shows green or red signal, we wait for RSI Divergence and we enter. We book when blue line (9,3) goes above 80, as shown by arrow, and trail rest at breakeven or your own trailing method
Same Situation shown for Short side. We book 50% when Blue line (9,3) Goes below 20 and trail rest at breakeven or your own trailing method
Happy trading, Let me know if any improvements required.

Supply and DemandThis is a "Supply and Demand" script designed to help traders spot potential levels of supply (resistance) and demand (support) in the market by identifying pivot points from past price action.
Differences from Other Scripts:
Unlike many pivot point scripts, this one offers a greater degree of customization and flexibility, allowing users to determine how many ranges of pivot points they wish to plot (up to 10), as well as the number of the most recent ranges to display.
Furthermore, it allows users to restrict the plotting of pivot points to specific timeframes (15 minutes, 30 minutes, 1 hour, 4 hours, and daily) using a toggle input. This is useful for traders who wish to focus on these popular trading timeframes.
This script also uses the color.new function for a more transparent plotting, which is not commonly used in many scripts.
How to Use:
The script provides two user inputs:
"Number of Ranges to Plot (1-10)": This determines how many 10-bar ranges of pivot points the script will calculate and potentially plot.
"Number of Last Ranges to Show (1-?)": This determines how many of the most recent ranges will be displayed on the chart.
"Limit to specific timeframes?": This is a toggle switch. When turned on, the script only plots pivot points if the current timeframe is one of the following: 15 minutes, 30 minutes, 1 hour, 4 hours, or daily.
The pivot points are plotted as circles on the chart, with pivot highs in red and pivot lows in green. The transparency level of these plots can be adjusted in the script.
Market and Conditions:
This script is versatile and can be used in any market, including Forex, commodities, indices, or cryptocurrencies. It's best used in trending markets where supply and demand levels are more likely to be respected. However, like all technical analysis tools, it's not foolproof and should be used in conjunction with other indicators and analysis techniques to confirm signals and manage risk.
A technical analyst, or technician, uses chart patterns and indicators to predict future price movements. The "Supply and Demand" script in question can be an invaluable tool for a technical analyst for the following reasons:
Identifying Support and Resistance Levels : The pivot points plotted by this script can act as potential levels of support and resistance. When the price of an asset approaches these pivot points, it might bounce back (in case of support) or retreat (in case of resistance). These levels can be used to set stop-loss and take-profit points.
Timeframe Analysis : The ability to limit the plotting of pivot points to specific timeframes is useful for multiple timeframe analysis. For instance, a trader might use a longer timeframe to determine the overall trend and a shorter one to decide the optimal entry and exit points.
Customization : The user inputs provided by the script allow a technician to customize the ranges of pivot points according to their unique trading strategy. They can choose the number of ranges to plot and the number of the most recent ranges to display on the chart.
Confirmation of Other Indicators : If a pivot point coincides with a signal from another indicator (for instance, a moving average crossover or a relative strength index (RSI) divergence), it could provide further confirmation of that signal, increasing the chances of a successful trade.
Transparency in Plots : The use of the color.new function allows for more transparent plotting. This feature can prevent the chart from becoming too cluttered when multiple ranges of pivot points are plotted, making it easier for the analyst to interpret the data.
In summary, this script can be used by a technical analyst to pinpoint potential trading opportunities, validate signals from other indicators, and customize the display of pivot points to suit their individual trading style and strategy. Always remember, however, that no single indicator should be used in isolation, and effective risk management strategies should always be employed.

Remove Hodler [5ema]How it inputs:
Select the timframe to check.
Input the number of bars lookback (or the number of bars corresponding to the selected timeframe)
Input the percentage of change of the price during that time.
Input the number of shotting bars.
Input the symbols want to follow.
How it works:
Calculate the number of shotting bars on the number bars lookback.
Calculate rate of change (with high, low price).
How it uses:
If the returned result is less than the input values (number shooting bars, the price change percentage). A buy signal will be given.
The same calculation applies to the symbols in the input list to monitor and return the results to the table on the chart and send notifications.
I reused some functions, made by (i believe that):
@everget : The table position function.
©paaax : The RSI divergence function.
@QuantNomad : The function calculated value and array to show on table for input symbols.
I have commented in my code. Thanks so much!
----
This indicator is for reference only, you need your own method and strategy.
If you have any questions, please let me know in the comments.

WMA CrossoverNormally we have Moving average which is lagging indicator but in this script we have removed the lag and get signal upfront to maximize the profit and minimize the losses.
This is good for Entry purpose, for exit also it can be used but profit might be less. It is suggested to use one of the below method for exit
Target based
RSI divergence or
Price & Volume Based Analysis
VWAP (Volume for Index (Nifty & BankNifty is not available on Tradingview. Investing.com can be used for the same.)
If need more information on any of the above method, Please comment i will share more information on this either on tradingview or could be on the yourtube video.


