Stochastic RSI Divergences for short term trades @D4NN1_0C34N
Altcoin / Bitcoin -0.38% Stoch RSI Overlay signals:
Bull divergence
Bear divergence
Hidden bull divergence
Hidden bear divergence
All divergence signals are under special circumstances.
Later versions might include additional parameters.
Find me on Twitter: @D4NN1_0C34N
our german website: cointrend.de
or youtube: www.youtube.de
Komut dosyalarını "rsi divergence" için ara

RSI Shifting Band Oscillator | QuantMAC📊 RSI Shifting Band Oscillator | QuantMAC
🎯 Overview
The RSI Shifting Band Oscillator represents a breakthrough in adaptive technical analysis, combining the innovative dual-stage RSI processing with dynamic volatility bands to create an oscillator that automatically adjusts to changing market momentum conditions. This cutting-edge indicator goes beyond traditional static approaches by using smoothed RSI to dynamically shift band width based on momentum transitions, providing superior signal accuracy across different market regimes.
🔧 Key Features
Revolutionary Dual RSI Technology: Proprietary two-stage RSI calculation with exponential smoothing that measures momentum transitions in real-time
Dynamic Adaptive Bands: Self-adjusting volatility bands that expand and contract based on RSI distance from equilibrium
Dual Trading Modes: Flexible Long/Short or Long/Cash strategies for different trading preferences
Advanced Performance Analytics: Comprehensive metrics including Sharpe, Sortino, and Omega ratios
Smart Visual System: Dynamic color coding with 9 professional color schemes
Precision Backtesting: Date range filtering with detailed historical performance analysis
Real-time Signal Generation: Clear entry/exit signals with customizable threshold sensitivity
Position Sizing Intelligence: Half Kelly criterion for optimal risk management
📈 How The Dual RSI Technology Works
The Dual RSI system is the heart of this indicator's innovation. Unlike traditional RSI implementations, this approach analyzes the smoothed momentum transitions between different RSI states, providing early warning signals for momentum regime changes.
RSI Calculation Process:
Calculate traditional RSI using specified length and price source
Apply exponential moving average smoothing to reduce noise
Measure RSI distance from neutral 50 level to determine momentum strength
Use RSI deviation to dynamically adjust standard deviation multipliers
Create adaptive bands that respond to momentum conditions
Generate normalized oscillator values for clear signal interpretation
The genius of this dual RSI approach lies in its ability to detect when markets are transitioning between momentum and consolidation periods before traditional indicators catch up. This provides traders with a significant edge in timing entries and exits.
⚙️ Comprehensive Parameter Control
RSI Settings:
RSI Length: Controls the lookback period for momentum analysis (default: 14)
RSI Smoothing: Reduces noise in RSI calculations using EMA (default: 20)
Source: Price input selection (close, open, high, low, etc.)
Oscillator Settings:
Base Length: Foundation moving average for band calculations (default: 40)
Standard Deviation Length: Period for volatility measurement (default: 26)
SD Multiplier: Base band width adjustment (default: 2.7)
Oscillator Multiplier: Scaling factor for oscillator values (default: 100)
Signal Thresholds:
Long Threshold: Bullish signal trigger level (default: 90)
Short Threshold: Bearish signal trigger level (default: 56)
🎨 Advanced Visual System
Main Chart Elements:
Dynamic Shifting Bands: Upper and lower bands that automatically adjust width based on RSI momentum
Adaptive Fill Zone: Color-coded area between bands showing current market state
Basis Line: Moving average foundation displayed as subtle reference points
Smart Bar Coloring: Candles change color based on oscillator state for instant visual feedback
Oscillator Pane:
Normalized RSI Oscillator: Main signal line centered around zero with dynamic coloring
Threshold Lines: Horizontal reference lines for entry/exit levels
Zero Line: Central reference for oscillator neutrality
Color State Indication: Line colors change based on bullish/bearish conditions
📊 Professional Performance Metrics
The built-in analytics suite provides institutional-grade performance measurement:
Net Profit %: Total strategy return percentage
Maximum Drawdown %: Worst peak-to-trough decline
Win Rate %: Percentage of profitable trades
Profit Factor: Ratio of gross profits to gross losses
Sharpe Ratio: Risk-adjusted return measurement
Sortino Ratio: Downside-focused risk adjustment
Omega Ratio: Probability-weighted performance ratio
Half Kelly %: Optimal position sizing recommendation
Total Trades: Complete transaction count
🎯 Strategic Trading Applications
Long/Short Mode: ⚡
Maximizes profit potential by capturing both upward and downward price movements. The dual RSI technology helps identify when momentum is strengthening or weakening, allowing for optimal position switches between long and short.
Long/Cash Mode: 🛡️
Conservative approach ideal for retirement accounts or risk-averse traders. The indicator's adaptive nature helps identify the best times to be invested versus sitting in cash, protecting capital during adverse market conditions.
🚀 Unique Advantages
Traditional Indicators vs RSI Shifting Bands:
Static vs Dynamic: While most indicators use fixed parameters, RSI bands adapt in real-time
Lagging vs Leading: Dual RSI detects momentum transitions before they fully manifest
One-Size vs Adaptive: The same settings work across different market conditions
Simple vs Intelligent: Advanced momentum analysis provides superior market insight
💡 Professional Setup Guide
For Day Trading (Short-term):
RSI Length: 10-12
RSI Smoothing: 15-18
Base Length: 25-30
Thresholds: Long 85, Short 60
For Swing Trading (Medium-term):
RSI Length: 14-16 (default range)
RSI Smoothing: 20-25
Base Length: 40-50
Thresholds: Long 90, Short 56 (defaults)
For Position Trading (Long-term):
RSI Length: 18-21
RSI Smoothing: 25-30
Base Length: 60-80
Thresholds: Long 92, Short 50
🧠 Advanced Trading Techniques
RSI Divergence Analysis:
Watch for divergences between price action and smoothed RSI readings. When price makes new highs/lows but RSI doesn't confirm, it often signals upcoming reversals.
Band Width Interpretation:
Expanding Bands: Increasing momentum, expect larger price moves
Contracting Bands: Decreasing momentum, prepare for potential breakouts
Band Touches: Price touching outer bands often signals reversal opportunities
Multi-Timeframe Analysis:
Use RSI oscillator on higher timeframes for trend direction and lower timeframes for precise entry timing.
⚠️ Important Risk Disclaimers
Past performance is not indicative of future results. This indicator represents advanced technical analysis but should never be used as the sole basis for trading decisions.
Critical Risk Factors:
Market Conditions: No indicator performs equally well in all market environments
Backtesting Limitations: Historical performance may not reflect future market behavior
Momentum Risk: Adaptive indicators can be sensitive to extreme momentum conditions
Parameter Sensitivity: Different settings may produce significantly different results
Capital Risk: Always use appropriate position sizing and stop-loss protection
📚 Educational Benefits
This indicator provides exceptional learning opportunities for understanding:
Advanced RSI analysis and momentum measurement techniques
Adaptive indicator design and implementation
The relationship between momentum transitions and price movements
Professional risk management using Kelly Criterion principles
Modern oscillator interpretation and signal generation
🔍 Market Applications
The RSI Shifting Band Oscillator works across various markets:
Forex: Excellent for currency pair momentum analysis
Stocks: Individual equity and index trading
Commodities: Adaptive to commodity market momentum cycles
Cryptocurrencies: Handles extreme momentum variations effectively
Futures: Professional derivatives trading applications
🔧 Technical Innovation
The RSI Shifting Band Oscillator represents years of research into adaptive technical analysis. The proprietary dual RSI calculation method has been optimized for:
Computational Efficiency: Fast calculation even on high-frequency data
Noise Reduction: Advanced smoothing without excessive lag
Market Adaptability: Automatic adjustment to changing conditions
Signal Clarity: Clear, actionable trading signals
🔔 Updates and Evolution
The RSI Shifting Band Oscillator | QuantMAC continues to evolve with regular updates incorporating the latest research in adaptive technical analysis. The code is thoroughly documented for transparency and educational purposes.
Trading Notice: Financial markets involve substantial risk of loss. The RSI Shifting Band Oscillator is a sophisticated technical analysis tool designed to assist in trading decisions but cannot guarantee profitable outcomes.
---
Master The Markets With Adaptive Intelligence! 🎯📈

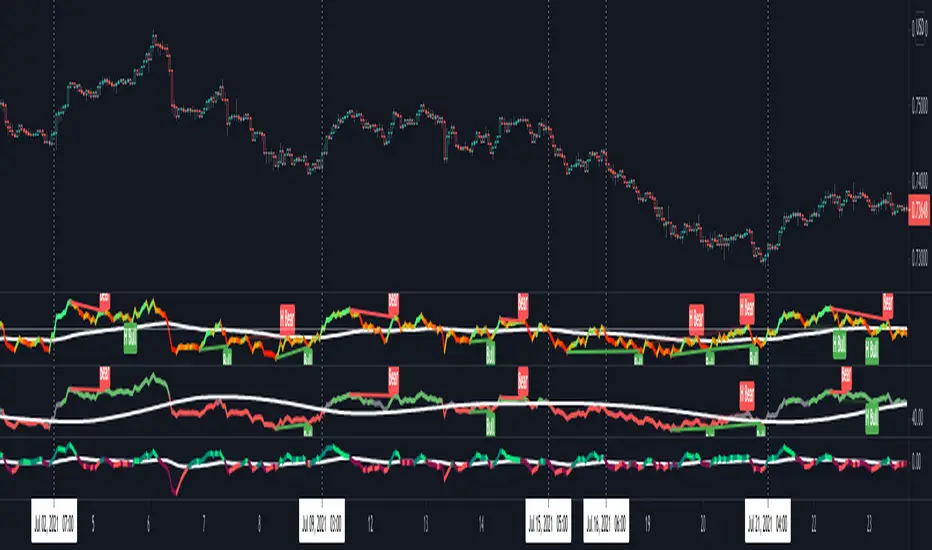
RSI Hybrid ProfileThis is a Hybrid Script designed on the basis of a well know Indicator RSI - Relative strength Index, ATR, Standard Deviations and Medians. Effort is being made to present RSI in a Profile based concept to leverage and elevate trading signals and identify potential trade while effectively managing the RISK.
Trend Colour Coding :-
Green = Bullish
Red = Bearish
Gray = Mean Reversion/ Rangebound Markets
The script includes the following Elements
1) Candlestick chart of RSI of current time frame in lower pane :-
It helps to effectively compare the price action with that of RSI to clearly identify early breakouts or breakdowns in RSI as compared to price chart and identify early trade opportunities as well as Divergences
2) Higher Time Frame RSI :-
The orange line in the lower pane to help take analysis of Higher Timeframe, to evaluate and assess trend in more refined manner.
3) Point of Control Zone :-
The middle horizontal band with colour coding to highlight the Point of Control of the price action based on its relative strength.
4) Black Circles - POC Change Markers - RSI profile Value area Shifts :-
All the Black Circles plotted on chart are RSI Point of Controls, which signal upcoming Trend and should be closely watched as it can help identify wonderful Entry/Exit Opportunities.
5) Value Area :-
The horizontal lines above and below the POC Zones are the Value areas, they are extremely useful to identify the potential support/resistance zones during the trending markets and potential target zones during the mean reverting markets. The width also helps assess the underlying volatility and risk and can help in determining the position size based on it. The setting can be adjusted based on Value area Range Multiplier. 1 is the ideal setting as it represents 1 Standard Deviation of Data.
6) Trailing Stops :-
The Green Trailing line helps as trailing stoploss in buying positions and Red Trailing Line helps as trailing SL in Selling Positions. These are especially useful when price is far away from the value area zones or when volatility is very high. The setting can be adjusted based on trail multiplier in the settings.
Here are the few examples of how to use the script on different asset classes
1) Gold Futures - Exhibiting the use of trend and SL and how to change positions based on retracement and RSI Interpretation.
2)Nifty 50 - Exhibiting the importance of POC , RSI Divergence and Breakout and SL Trail and POC Change Markers
3) Bitcoin/US Dollar - Showing the use of Value areas as support zones and using RSI overbought and oversold regions to manage pullbacks and retracement confirmations.
4) JSW Energy Limited - Stock - Showing the combined use of the scripts elements in trading environment.
Feel Free to use it on Charts and leverage the power of this wonderful Indicator.

Momentum Matrix (BTC-COIN)The Momentum Matrix (BTC-COIN) indicator analyzes the momentum relationship between Coinbase stock ( NASDAQ:COIN ) and Bitcoin ( CRYPTOCAP:BTC ). By combining RSI, correlation, and dominance metrics, it identifies bullish and bearish macro trends to align trades with market momentum.
How It Works
Price Inputs: Pulls weekly price data for CRYPTOCAP:BTC and NASDAQ:COIN for macro analysis.
Metrics Calculated:
• RSI Divergence: Measures momentum differences between CRYPTOCAP:BTC and $COIN.
• Price Ratio: Tracks the $COIN/ CRYPTOCAP:BTC relationship relative to its long-term average (SMA).
• Correlation: Analyzes price co-movement between CRYPTOCAP:BTC and $COIN.
• Dominance Impact: Incorporates CRYPTOCAP:BTC dominance for broader crypto trends.
Composite Momentum Score: Combines these metrics into a smoothed macro momentum value.
Thresholds for Trend Detection: Upper and lower thresholds dynamically adapt to market conditions.
Signals and Visualization:
• Buy Signal: Momentum exceeds the upper threshold, indicating bullish trends.
• Sell Signal: Momentum falls below the lower threshold, indicating bearish trends.
• Background Colors: Green (bullish), Red (bearish).
Strengths
Integrates multiple metrics for robust macro analysis.
Dynamic thresholds adapt to market conditions.
Effective for identifying macro momentum shifts.
Limitations
Lag in high volatility due to smoothing.
Less effective in choppy, sideways markets.
Assumes CRYPTOCAP:BTC dominance drives NASDAQ:COIN momentum, which may not always hold true.
Improvements
Multi-Timeframe Analysis: Add daily or monthly data for precision.
Volume Filters: Include volume thresholds for signal validation.
Additional Metrics: Consider MACD or Stochastics for further confirmation.
Complementary Tools
Volume Indicators: OBV or cumulative delta for confirmation.
Trend-Following Systems: Pair with moving averages for timing.
Market Breadth Metrics: Combine with CRYPTOCAP:BTC dominance trends for context.

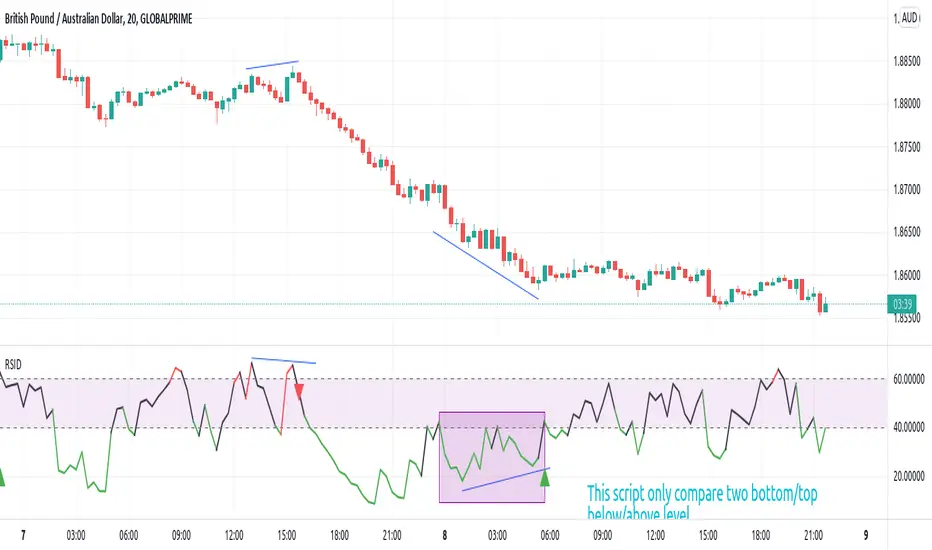
[JL] Relative Strength Index - Divergence AlertThis script displays rsi divergence alert.
Only compare two bottom/top.
Top: RSI decrease and high increase
Bottom: RSI increase and low decrease.
Warning: Please don't only use this signal to trade. Divergences are always early signals need to be confirmed.
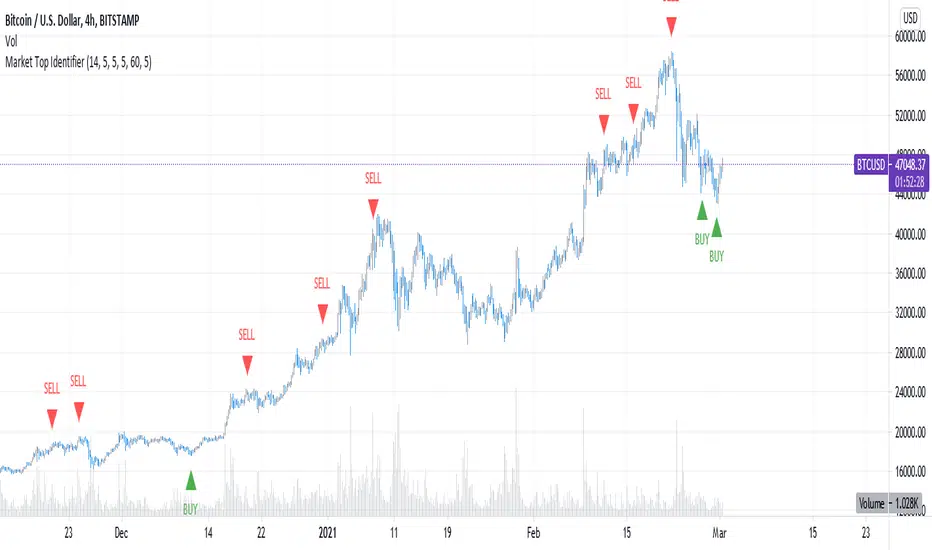
Market Turn IdentifierHow to identify tops and bottoms?
This script uses a combination of indicators to determine if it is a top or a bottom. It is best used in a bull market, where prices will extend in both directions. Good example is, cryptocurrencies.
Because prices extend on both directions, RSI divergences are great signs. Volume likewise. MACD is used as a final trigger. All of these signs don't have to necessarily happen on 1 exact candle, but should be spatially close.
List of requirements:
Top
MACD crossover
RSI bear divergence
Dropping volume (COMING SOON)
Bottom
MACD crossunder
RSI bullish divergence
Increasing volume (COMING SOON)
This works the best in a medium time frame, from 2h-12h chart.
9:45am NIFTY TRADINGTime Frame: 15 Minutes | Reference Candle Time: 9:45 AM IST | Valid Trading Window: 3 Hours
📌 Introduction
This document outlines a structured trading strategy for NIFTY & BANKNIFTY Options based on a 15-minute timeframe with a 9:45 AM IST reference candle. The strategy incorporates technical indicators, probability analysis, and strict trading rules to optimize entries and exits.
📊 Core Features
1. Reference Time Trading System
9:45 AM IST Candle acts as the reference for the day.
All signals (Buy/Sell/Reversal) are generated based on price action relative to this candle.
The valid trading window is 3 hours after the reference candle.
2. Signal Generation Logic
Signal Condition
Buy (B) Price breaks above reference candle high with confirmation
Sell (S) Price breaks below reference candle low with confirmation
Reversal (R) Early trend reversal signal (requires strict confirmation)
3. Probability Analysis System
The strategy calculates Win Probability (%) using 4 components:
Component Weight Calculation
Body Win Probability 30% Based on candle body strength (body % of total range)
Volume Win Probability 30% Current volume vs. average volume strength
Trend Win Probability 40% EMA crossover + RSI momentum alignment
Composite Probability - Weighted average of all 3 components
Probability Color Coding:
🟢 Green (High Probability): ≥70%
🟠 Orange (Medium Probability): 50-69%
🔴 Red (Low Probability): <50%
4. Timeframe Enforcement
Strictly 15-minute charts only (no other timeframes allowed).
System auto-disables signals if the wrong timeframe is selected.
📈 Technical Analysis Components
1. EMA System (Trend Analysis)
Short EMA (9) – Fast trend indicator
Middle EMA (20) – Intermediate trend
Long EMA (50) – Long-term trend confirmation
Rules:
Buy Signal: Price > 9 EMA > 20 EMA > 50 EMA (Bullish trend)
Sell Signal: Price < 9 EMA < 20 EMA < 50 EMA (Bearish trend)
2. Multi-Timeframe RSI (Momentum)
5M, 15M, 1H, 4H, Daily RSI values are compared for divergence/confluence.
Overbought (≥70) / Oversold (≤30) conditions help in reversal signals.
3. Volume Analysis
Volume Strength (%) = (Current Volume / Avg. Volume) × 100
Strong Volume (>120% Avg.) confirms breakout/breakdown.
4. Body Percentage (Candle Strength)
Body % = (Close - Open) / (High - Low) × 100
Strong Bullish Candle: Body > 60%
Strong Bearish Candle: Body < 40%
📊 Visual Elements
1. Information Tables
Reference Data Table (9:45 AM Candle High/Low/Close)
RSI Values Table (5M, 15M, 1H, 4H, Daily)
Signal Legend (Buy/Sell/Reversal indicators)
2. Chart Overlays
Reference Lines (9:45 AM High & Low)
EMA Lines (9, 20, 50)
Signal Labels (B, S, R)
3. Color Coding
High Probability (Green)
Medium Probability (Orange)
Low Probability (Red)
⚠️ Important Usage Guidelines
✅ Best Practices:
Trade only within the 3-hour window (9:45 AM - 12:45 PM IST).
Wait for confirmation (closing above/below reference candle).
Use probability score to filter high-confidence trades.
❌ Avoid:
Trading outside the 15-minute timeframe.
Ignoring volume & RSI divergence.
Overtrading – Stick to 1-2 high-probability setups per day.
🎯 Conclusion
This NIFTY Trading Strategy is optimized for 15-minute charts with a 9:45 AM IST reference candle. It combines EMA trends, RSI momentum, volume analysis, and probability scoring to generate high-confidence signals.
🚀 Key Takeaways:
✔ Reference candle defines the day’s bias.
✔ Probability system filters best trades.
✔ Strict 15M timeframe ensures consistency.
Happy Trading! 📈💰

RSI Screener / Heatmap - By LeviathanThis script allows you to quickly scan the market by displaying the RSI values of up to 280 tickers at once and visualizing them in an easy-to-understand format using labels with heatmap coloring.
📊 Source
The script can display the RSI from a custom timeframe (MTF) and custom length for the following data:
- Price
- OBV (On Balance Volume)
- Open Interest (for crypto tickers)
📋 Ticker Selection
This script uses a different approach for selecting tickers. Instead of inputting them one by one via input.symbol(), you can now copy-paste or edit a list of tickers in the text area window. This approach allows users to easily exchange ticker lists between each other and, for example, create multiple lists of tickers by sector, market cap, etc., and easily input them into the script. Full credit to @allanster for his functions for extracting tickers from the text. Users can switch between 7 groups of 40 tickers each, totaling 280 tickers.
🖥️ Display Types
- Screener with Labels: Each ticker has its own color-coded label located at its RSI value.
- Group Average RSI: A standard RSI plot that displays the average RSI of all tickers in the group.
- RSI Heatmap (coming soon): Color-coded rows displaying current and historical values of tickers.
- RSI Divergence Heatmap (coming soon): Color-coded rows displaying current and historical regular/hidden bullish/bearish divergences for tickers.
🎨 Appearance
Appearance is fully customizable via user inputs, allowing you to change heatmap/gradient colors, zone coloring, and more.

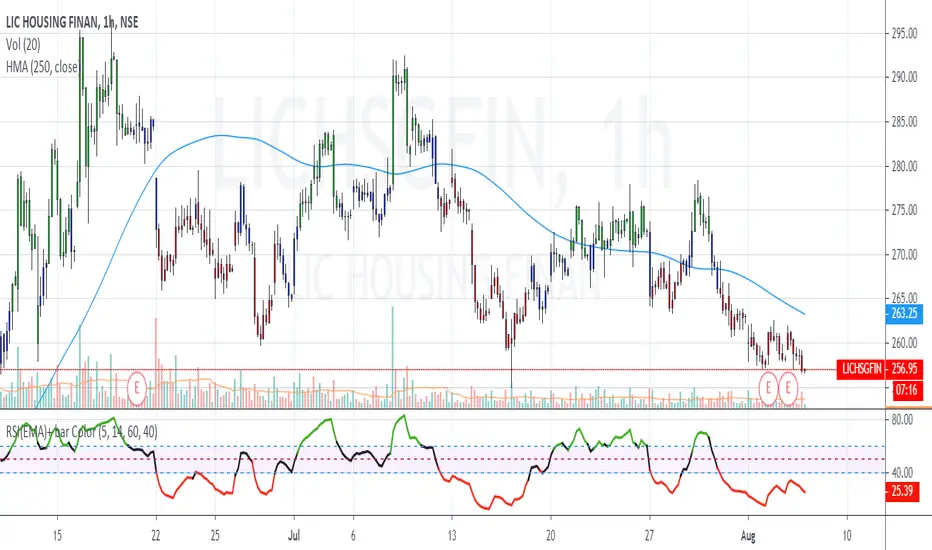
RSI(EMA) - Reducing Noise This script is a modified version of the Relative Strength Indicator ( RSI ). While using RSI to trade the markets, the signals generated are very choppy.
Approach 1. One way to reduce this noise is to use a higher period for the RSI calculation. (say 20 instead of 14 period). In this approach, the valid signal comes quite late.
Approach 2. My unique solution is to use a Exponential Moving Average as the input for the RSI calculation. Usually RSI calculations are based on close value of the candles. If we use an appropriate EMA value, then the signal efficiency will increase.
Using the approach 2, strategies similar to regular RSI can be utilized i.e. RSI breakout, RSI divergence, RSI Hidden divergence.
RSI Colors explained
GREEN = BULLISH momentum when RSI >60
RED = BEARISH momentum when RSI <40
BLACK = NEUTRAL market conditions when RSI is between 40 and 60
Breakout Strategy
LONGS - RSI color is GREEN + Price breaks a Resistance
SHORTS - RSI color is RED + Price breaks a Support
Recommended default settings: EMA =7 period , RSI =14 period
ADDITIONAL TIP: Works wonderfully with Pivot Points (standard)
I recommended to use on minimum 5 MINUTE timeframe for intraday trades . But you can use different timeframes as well.
Please leave comment below If you have any question or development idea.
Relative Strength Index - Divergences, Stoch, Reverse StochThis is aggregation of RSI indicators - RSI, Divergences, Reverse & Stochastic RSI
Thanks to ©JayTradingCharts and ©mohanee for the RSI Divergences code
Thanks to BApig - Motgench, balipour and Wugamlo for the reverse stoch code
Changes:
1. Add option to calc divs based on close or wicks or both (RSI is close based)
2. Add pivots (marking local high/low)
3. Update to Pine v5
4. Cleanup of unused code

Swiss Traders - Main IndicatorHey there,
This indicator is just a collection of indicators we found in the time we are trading that helped us with different kind of strategies, feel free to use it :)
It contains:
- Smoothed Moving Averages (21, 50, 200)
- Shows Engulfing Candles
- Shows 3-Line Strike
- Shows spikes in Volume (Silver Diamond)
- Shows the Trading Sessions on whatever place you are on this beautiful planet (and also the presession)
- VWAP
- RSI Divergence (the green and red bigger circles on the chart, but for this we also have a RSI Indicator that is seperate but helps you identify it even clearer)
It also has some basic Alert functions:
- Next Green/Red Candle (in case you want to know ^^)
- Engulfing
- 3-Line Strike
- Volume spikes
- RSI Divergences
It's always a work in progress.. we will develop it further and further the more you learn (we are never done learning!).

ASFX TDIThe TDI is the foundation of the ASFX systems. We use it to spot trends, RSI divergence, and beautiful entries. There are 3 components to the TDI -- the L50, the TL, and the RSI.
The L50 can be used to spot medium-term trend. When the L50 is in a certain zone since the beginning of the day, we know that the bias in the market is clear.
The TL can be used to spot short-term trend. We use the fact the slope of the TL to help us enter cleaner trades.
The RSI can be used to find divergences which may result in a reversal.
The following 3 components are nothing new to the ASFX traders. However, this version brings the RSI (At Open) to the traders as well. The new feature can be used to enter A1 trade (breakout trades) which has to take the RSI at the open into consideration whether it is above/below the L50 and the TL or not.
This can be used with the EMAs to detect trending moves as well.

[RS]RSI Divergence V5 Thank You Richard Santos!!!
This is a great indicator guys.Its good for measuring divergence in an objective way.
The idea is to measure the high to high and the low to low (stock vs. indicator) with the low to high and high to low (stock vs. indicator). This is the basis of divergence.
I love this one.
I would also add you can draw angles on the indicator and the stocks. All in all a great indicator.
Richard Santos was nice enough to modify one of his scripts for this one. Credit goes to him.
You can also use this for measuring volatility when the lines narrow or widen.

SKT's Volume Weighted Ichimoku Conviction Candle ColoringOverview
This indicator is a customized, volume-weighted variation of the classic Ichimoku Kinko Hyo system, designed to provide traders with an "at-a-glance" visualization of trend conviction and exhaustion. It overlays dynamic candle coloring on your chart, using a smooth gradient from deep green (strong bullish conviction) to gray (neutral or exhausted) to deep red (strong bearish conviction). The colors are driven by a composite score (-10 to +10, displayed as -100% to +100% strength), which quantifies probabilistic bias based on historical Ichimoku patterns, normalized for volatility and enhanced with volume dynamics.
Unlike standard Ichimoku, this version emphasizes "conviction strength" through gradients, helping identify not just trends but their reliability—e.g., fading colors signal potential reversals or pullbacks. It's particularly suited for trending assets like BTC/USD on daily or higher timeframes, where volume-weighted adjustments make lines hug price action during high-participation moves.
Key Benefits
Visual Heat Map: Candles shift colors based on score intensity, making it easy to spot weakening trends (pale shades) or strong continuations (deep shades).
Exhaustion Detection: Incorporates slope flattening, volume divergences, and cloud thinning to proactively desaturate colors near potential turns.
Strength Box: A persistent top-right label shows current % strength (e.g., "+75% Bull"), synced to the candle gradient for quick reference.
Adaptability: Works on any timeframe/asset; inputs allow tuning (e.g., for crypto's 24/7 volatility).
How It Works
The indicator computes a conviction score per bar, ranging from -10 (max bearish) to +10 (max bullish), then maps it to candle colors and a % strength display. The score is a weighted sum of five factors (total 100%), each normalized by ATR for scale-invariance:
Base: Normalized Price-Cloud Distance (40% Weight): Measures how far price is above (bullish) or below (bearish) the cloud. Calculation: Distance / ATR, clamped via tanh sigmoid for smoothness. Penalty: Fades score if distance <0.5 ATR (approaching cloud edge). Rationale: Large separations historically predict ~60-70% continuation; proximity hints at reversals.
Cloud Thickness & Color Alignment (15% Weight): Thickness = |Senkou A - B| / ATR; compared to SMA average. Boost if thick (>average: up to +3); penalty if thin (<0.5 average: up to -3). +1 bonus if cloud color aligns (green bull, red bear). Rationale: Thicker clouds act as stronger support/resistance; thinning signals exhaustion.
Other Lines: Chikou & Tenkan/Kijun Positions (15% Weight): Chikou distance from price/cloud ( / ATR): +4 if aligned far; -0.5 penalty if misaligned. Tenkan-Kijun separation ( / ATR): +3 if diverging (>0.5 ATR). Averaged for contribution. Rationale: Chikou confirms momentum from history; diverging lines indicate strength.
Exhaustion: Slope Calculation (Tenkan/Kijun) (15% Weight): Avg slope = (Tenkan linreg * 0.7 + Kijun linreg * 0.3) / ATR. Boost if steep (>0.2 abs: +3); penalty if flat (<0.1 abs: -3) or declining in trend (-4). Doubled if lines converging (<0.5 ATR sep). Rationale: Flattening/declining slopes detect fading momentum early.
Exhaustion: Volume Boost/Penalty (15% Weight): Dynamic thresholds: High = SMA(vol) + STD; Low = max(SMA - STD, 0). Boost if vol > high & slope aligns (up to +3). Penalty if vol < low or slope diverges (up to -3); skipped on new-bar first tick (barstate.isnew). Symmetric clamp: volContrib bounded ±3 to avoid spikes. Rationale: High aligning volume confirms conviction; low/diverging signals traps/exhaustion.
Score clamped ±10 overall. Gradients use RGB mixing: Deep colors for high abs(score), desaturated near 0 for smooth fades. Neutral bars vary gray shades by cloud thickness.
Inputs and Customization
All parameters are adjustable via TradingView's indicator settings:
Tenkan/Kijun/Senkou B Periods (9/26/52): Standard Ichimoku lengths; increase for smoother lines on volatile assets.
Displacement (26): Cloud shift; tweak for forward projection.
ATR Length (14): Volatility normalizer; longer for less sensitivity.
Slope/Volume/Thickness Lookbacks (5/20/20): Periods for slopes, vol SMA/STD, cloud avg—balance responsiveness vs. noise.
Scale Factor (2.0): Controls sigmoid clamping sharpness; lower for more gradual scores.
For BTC/USD: Try 20/60/120 periods on 1H/4H for crypto's non-stop trading.
Usage Instructions
Add to your chart via TradingView's Indicators menu.
Interpret Gradients: Deep Green: Strong bull (>+70% strength)—ride trends. Pale Green: Weakening bull (~+20-50%)—watch for exhaustion. Gray: Neutral (inside cloud)—avoid directionals. Symmetric for reds (bearish).
Strength Box: Top-right label shows live % (updates per tick).
Combine with: RSI/MACD for reversals (e.g., RSI divergence + pale gradient = potential turn).
Timeframes: Works on all; daily+ for best results. Test settings per asset/TF.
Notes and Disclaimer
- Performance: Backtest on your assets—score aligns with ~60% historical continuation in strong trends, but markets are unpredictable.
- Limitations: Volume-sensitive on low-TF or illiquid assets (fixed with clamps/barstate.isnew); no built-in alerts (add via TradingView).
- Disclaimer: For educational purposes only—not financial advice. Past performance ≠ future results; use with risk management.

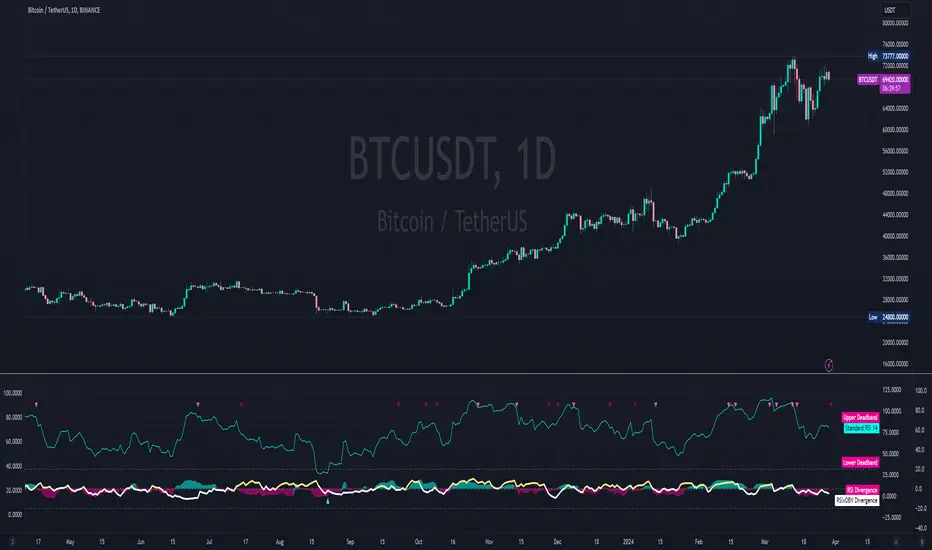
Relative Strength Index (OSC)Hello everyone, I'm sorry that the previous open-source version was hidden due to the house rules, I've re-edited the description and re-posted it
(1) Indicator introduction
This is RSI indicator with original divergence algorithm
This indicator is plotted on the RSI and can display the divergence locations and corresponding divergence intensity
The tolerance of N Klines at the top or bottom positions for price and indicator is supported, which is set by the "Tolerant Kline Number"
Support the display of divergence intensity, that is, the REG/HID value displayed on the label, which is less than 0. The smaller the intensity value, the more obvious divergence
Support the filtering of divergence intensity, which is set by "Cov Threshold". The divergence that REG/HID divergence intensity greater than this value will be ignored
In the label, REG indicates regular top/bottom divergence while HID indicates hidden top/bottom divergence
In the label, SRC(x-y) indicates a divergence occurred from the x-th kline to the y-th kline
In the label, OSC(x-y) indicates a divergence occurred from the indicator corresponding to the x-th kline to the y-th kline
(2) Parameter introduction
- RSI Settings
Source: The source to calculate RSI, close by default
RSI Length: The length of RSI, 14 by default
- RSI Divergence
Pivot Lookback Right: Number of K-line bars recalling the pivot top/bottom point to the right
Pivot Lookback Left: Number of K-line bars recalling the pivot top/bottom point to the left
Max of Lookback Range: Maximum number of retracing K-line bars to find the pivot top/bottom point
Min of Lookback Range: Minimum number of retracing K-line bars to find the pivot top/bottom point
Tolerant Kline Number: Maximum tolerance in indexing top/bottom points of Klines and indicators
Cov Threshold: Divergence intensity, which is less than 0. The smaller the intensity value, the more obvious divergence
Plot Bullish: Whether to draw regular bullish divergence label
Plot Hidden Bullish: Whether to draw hidden bullish divergence label
Plot Bearish: Whether to draw regular bearish divergence label
Plot Hidden Bearish: Whether to draw hidden bearish divergence label
Happy trading and enjoy your life!
————————————————————————————————————————
各位朋友大家好,很抱歉之前的开源版本因为规则原因被隐藏,我已经重新编辑了说明并重新发布
(1) 指标说明
该指标绘制于 RSI 上,并在对应位置显示背离点以及背离程度
支持顶底位置 N 根K线的容差,由 Tolerant Kline Number 参数设置
支持背离强度的显示,即标签上显示的 REG/HID 值,该值小于 0,且越小说明背离程度越大
支持背离强度的过滤,由 Cov Threshold 参数设置, REG/HID 值大于这个值的背离会被忽略
标签中,REG 表示常规顶/低背离,而 HID 表示隐藏顶/底背离
标签中,SRC(x-y) 表示从当前第 x 根 bar 开始到第 y 跟 bar 出现背离
标签中,OSC(x-y) 表示从当前第 x 根 bar 所对应的指标开始到第 y 跟 bar 所对应的指标出现背离
(2) 参数说明
- RSI Settings
Source: 计算 RSI 指标的 source,默认为 close
RSI Length: 计算 RSI 指标的长度,默认为 14
- RSI Divergence
Pivot Lookback Right: 枢纽顶/底点往右回顾的 K线 bar 数量
Pivot Lookback Left: 枢纽顶/底点往左回顾的 K线 bar 数量
Max of Lookback Range: 回寻找枢纽顶/底点的最大回溯 K线 bar 数量
Min of Lookback Range: 回寻找枢纽顶/底点的最小回溯 K线 bar 数量
Tolerant Kline Number: K线和指标的顶/底点索引的最大误差
Cov Threshold: 背离程度,该值小于 0,且越小说明背离程度越大
Plot Bullish: 是否绘制常规底背离提示
Plot Hidden Bullish: 是否绘制隐藏底背离提示
Plot Bearish: 是否绘制常规顶背离提示
Plot Hidden Bearish: 是否绘制隐藏顶背离提示
祝大家交易愉快

Relative Strength Index (SRC)Hello everyone, I'm sorry that the previous open-source version was hidden due to the house rules, I've re-edited the description and re-posted it
(1) Indicator introduction
This is RSI indicator with original divergence algorithm
This indicator is plotted on the klines and can display the divergence locations and corresponding divergence intensity
The tolerance of N Klines at the top or bottom positions for price and indicator is supported, which is set by the "Tolerant Kline Number"
Support the display of divergence intensity, that is, the REG/HID value displayed on the label, which is less than 0. The smaller the intensity value, the more obvious divergence
Support the filtering of divergence intensity, which is set by "Cov Threshold". The divergence that REG/HID divergence intensity greater than this value will be ignored
In the label, REG indicates regular top/bottom divergence while HID indicates hidden top/bottom divergence
In the label, SRC(x-y) indicates a divergence occurred from the x-th kline to the y-th kline
In the label, OSC(x-y) indicates a divergence occurred from the indicator corresponding to the x-th kline to the y-th kline
(2) Parameter introduction
- RSI Settings
Source: The source to calculate RSI, close by default
RSI Length: The length of RSI, 14 by default
- RSI Divergence
Pivot Lookback Right: Number of K-line bars recalling the pivot top/bottom point to the right
Pivot Lookback Left: Number of K-line bars recalling the pivot top/bottom point to the left
Max of Lookback Range: Maximum number of retracing K-line bars to find the pivot top/bottom point
Min of Lookback Range: Minimum number of retracing K-line bars to find the pivot top/bottom point
Tolerant Kline Number: Maximum tolerance in indexing top/bottom points of Klines and indicators
Cov Threshold: Divergence intensity, which is less than 0. The smaller the intensity value, the more obvious divergence
Plot Bullish: Whether to draw regular bullish divergence label
Plot Hidden Bullish: Whether to draw hidden bullish divergence label
Plot Bearish: Whether to draw regular bearish divergence label
Plot Hidden Bearish: Whether to draw hidden bearish divergence label
Happy trading and enjoy your life!
————————————————————————————————————————
各位朋友大家好,很抱歉之前的开源版本因为规则原因被隐藏,我已经重新编辑了说明并重新发布
(1) 指标说明
该指标绘制于 K线 上,并在对应位置显示背离点以及背离程度
支持顶底位置 N 根K线的容差,由 Tolerant Kline Number 参数设置
支持背离强度的显示,即标签上显示的 REG/HID 值,该值小于 0,且越小说明背离程度越大
支持背离强度的过滤,由 Cov Threshold 参数设置, REG/HID 值大于这个值的背离会被忽略
标签中,REG 表示常规顶/低背离,而 HID 表示隐藏顶/底背离
标签中,SRC(x-y) 表示从当前第 x 根 bar 开始到第 y 跟 bar 出现背离
标签中,OSC(x-y) 表示从当前第 x 根 bar 所对应的指标开始到第 y 跟 bar 所对应的指标出现背离
(2) 参数说明
- RSI Settings
Source: 计算 RSI 指标的 source,默认为 close
RSI Length: 计算 RSI 指标的长度,默认为 14
- RSI Divergence
Pivot Lookback Right: 枢纽顶/底点往右回顾的 K线 bar 数量
Pivot Lookback Left: 枢纽顶/底点往左回顾的 K线 bar 数量
Max of Lookback Range: 回寻找枢纽顶/底点的最大回溯 K线 bar 数量
Min of Lookback Range: 回寻找枢纽顶/底点的最小回溯 K线 bar 数量
Tolerant Kline Number: K线和指标的顶/底点索引的最大误差
Cov Threshold: 背离程度,该值小于 0,且越小说明背离程度越大
Plot Bullish: 是否绘制常规底背离提示
Plot Hidden Bullish: 是否绘制隐藏底背离提示
Plot Bearish: 是否绘制常规顶背离提示
Plot Hidden Bearish: 是否绘制隐藏顶背离提示
祝大家交易愉快

+ Breadth & Volumenote* If you've used my "+ Rate of Change Indicator", I am updating that without the OBV, which has been moved here. Just an FYI.
This "indicator" is basically a variety of indicators that measure volume, or accumulation/distribution. There's a bit of a story about how this came about but
it's not that interesting, so I'll spare you.
Indicators from which you may choose here are On Balance Volume (OBV), Money Flow Index (MFI), Chaikin Money Flow (CMF), Chaikin Oscillator, and Positive & Negative Net Volume.
I'll give a brief overview of these below, and if you want to educate yourself further on them you may. There are many web resources for that.
Most people are probably familiar with OBV. It's one of the more commonly used volume indicators, especially in the crypto crowd (at least amongst those traders I follow). It's basically a cumulative (doesn't oscillate around a midpoint) momentum indicator that measures volume of the current period versus volume of the previous period and adds it if price closed higher, but subtracts it if price closes lower. It's another way of using volume to confirm trend.
The MFI is a momentum indicator that measures the flow of money into and out of an asset over some period of time (user input). It's calculated using the RSI, so it can be used similarly to RSI (divergences, overbought, oversold, etc.), but of course unlike the RSI it's calculated primarily using volume and comparing the most recent candle close to the previous one (similar to OBV).
CMF is a volume-weighted average of accumulation and distribution over a some period of time (typically 21). It's a way of measuring accumulation versus
distribution in an asset, and oscillates around a zero line. You would use it similarly to any other oscillator, in that you can look for divergences, and general positive or negative momentum.
Chaikin Oscillator is basically a MACD (without signal line) of the accumulation and distribution index (or line--which is somehow different than simply accumulation and distribution). I haven't looked into these differences deeply, but if you look below at the calculations, and substituted 'ad' for 'accdist' you get very different readings. I actually did that, and what it looks like it would do is turn the actual Oscillator into a MACD signal line. So, by substituting 'ad' for 'accdist' (or the accumulation/distribution index) you produce a signal line of the Chaikin Oscillator.
Anyway, all that confusion out of the way, as I said, it's a MACD on the accumulation and distribution index, therefore it is another zero line oscillator, and similarly to CMF, it's a way of measuring price movements in the chart versus a/d. The zero line isn't just any old zero line, however, it is actually the accumulation distribution line. I've made an OBV version of this by substituting the OBV for AD, so if you prefer OBV maybe you will like that.
Pos. & Neg Net Volume is actually an indicator I had seen made by RafaelZioni. It basically takes net volume, calculates a cumulative of that, then subtracts a moving average of some period from the cumulative net volume in order to create a volume oscillator. Use it like the other oscillators!
Added Donchian Channels, moving averages, Bollinger Bands, colored everything, and alerts.
Enjoy!
Below I will post images with the different indicators, everything on default settings (except for lookback period, which I have adjusted to my personal preferences).
Above is an image with the MFI being compared to the RSI since they are very similar (MFI being basically a volume derivative of the RSI).
Chaikin Money Flow set to lookback of 13. You could probably extend that a bit if you wanted to smooth the line more.
Chaikin Oscillator and Chaikin Oscillator of OBV, with a zoomed in look below, to see the differences more clearly.
CO and COBV closer look.
Positive & Negative Net Volume.

3 Seas RSI Wave OscillatorTraditional Triple RSI Oscillator combining a Fast, Normal, and Slow RSI to achieve high accuracy entry and exit strategies. This indicator is UNIQUE because it uses a mathematical filter to trim false signals from the RSI, thus creating a reliable RSI driven entry and exit indicator represented by red and green arrows. For additional functionality divergences are identified and live plotted. UNIQUELY Alongside the 0 axis an OBV function is charted relative to the RSI to allow OBV and RSI divergences to be observed on equal mathematical scales, this is exceedingly useful to observe relative strength at pools of liquidity. The three main configured RSI's are also plotted for traditional usage case but can be removed.
Green arrow indicates a Buy opportunity optimized for standard Dollar Cost Averaging strategies.
Red arrow indicates a Sell opportunity optimized for standard Dollar Cost Averaging strategies.
Not Financial Advice.
Adaptive RSI and MACDHello guys,
this script provides a adaptive version of the RSI and MACD. Also you can check in the settings for the long-short-ratio of bitcoin and ethereum.
The indicator is adaptive, because it looks at historic price action of a specific period to define, wether the trend is bullish or bearish and therefore adapts the values.
What you need to look out for:
- MACD crosses, highs (top area) and lows (lower area)
- RSI divergences (e.g. adaptive rsi falls and price goes higher)
- long-short divergences (e.g. long-short ratio rises and price goes down)
- if macd or rsi is above the middle line, the trend is rising and other way around
Let me know, what you've been thinking bout the script :-)

TMA-LegacyThis is a script based on the original TMA- RSI Divergence indicator by PhoenixBinary.
The Phoenix Binary community and the TMA community built this version to be public code for the community for further use and revision after the reported passing of Phoenix Binary (The community extends our condolences to Phoenix's family.
The intended uses are the same as the original but some calculations are different and may not act or signal the same as the original.
Description of the indicator from original posting.
This indicator was inspired by Arty and Christy .
█ COMPONENTS
Here is a brief overview of the indicator from the original posting:
1 — RSI Divergence
Arty uses the RSI divergence as a tool to find entry points and possible reversals. He doesn't use the traditional overbought/oversold. He uses a 50 line. This indicator includes a 50 line and a floating 50 line.
The floating 50 line is a multi-timeframe smoothed moving average . Price is not linear, therefore, your 50 line shouldn't be either.
The RSI line is using a dynamic color algo that shows current control of the market as well as possible turning points in the market.
2 — Smoothed RSI Divergence
The Smoothed RSI Divergence is a slower RSI with different calculations to smooth out the RSI line. This gives a different perspective of price action and more of a long term perspective of the trend. When crosses of the floating 50 line up with the traditional RSI crossing floating 50.
3 — Momentum Divergence
This one will take a little bit of time to master. But, once you master this, and combined with the other two, damn these entries get downright lethal!

TMA - Divergence Indicator█ OVERVIEW
This indicator was inspired by Arty and Christy. I have taken what they teach and combined it into this amazing RSI Divergence Oscillator.
█ COMPONENTS
Here is a brief overview of the indicator:
1 — RSI Divergence
Arty uses the RSI divergence as a tool to find entry points and possible reversals. He doesn't use the traditional overbought/oversold. He uses a 50 line. This indicator includes a 50 line and a floating 50 line.
The floating 50 line is a multi-timeframe smoothed moving average. Price is not linear, therefore, your 50 line shouldn't be either.
The RSI line is using a dynamic color algo that shows current control of the market as well as possible turning points in the market. Think of it as a momentum indicator inside your momentum indicator, pretty cool, huh?
2 — Smoothed RSI Divergence
The Smoothed RSI Divergence is a slower RSI with different calculations to smooth out the RSI line. This gives a different perspective of price action and more of a long term perspective of the trend. When crosses of the floating 50 line up with the traditional RSI crossing floating 50, these are amazing entries!
3 — Momentum Divergence
This is my baby. This one will take a little bit of time to master, (and I will be doing videos for you). But, once you master this, and combined with the other two, damn these entries get downright lethal!
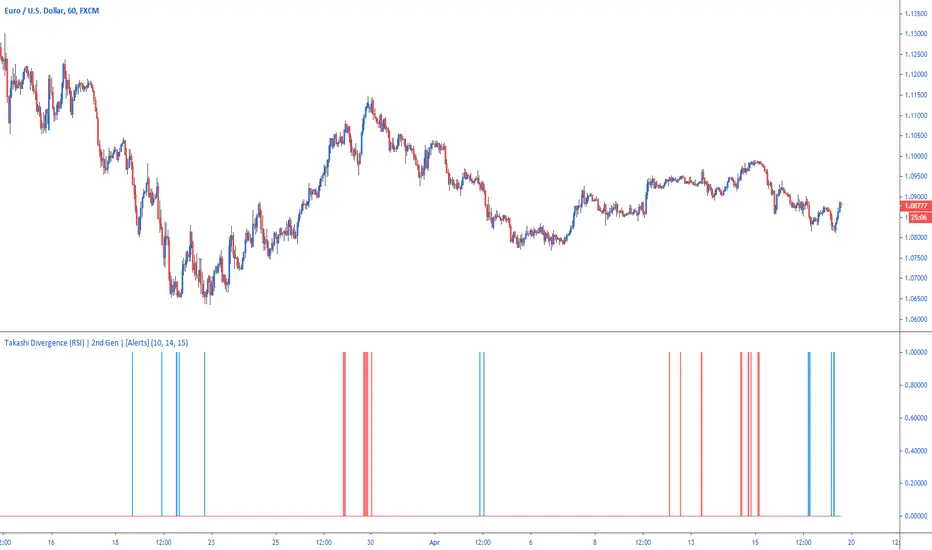
Takashi Divergence (RSI) | 2nd Gen | [Alerts]Easily highlight positive or negative divergence between price movement and RSI with Takashi-powered Divergence analysis.
Divergence strategy signals a potential reversal point because directional momentum does not confirm price. A bullish divergence occurs when the underlying market makes a lower low and RSI forms a higher low: RSI does not confirm the lower low and this shows strengthening momentum. A bearish divergence forms when the market records a higher high and RSI forms a lower high: RSI does not confirm the new high and this shows weakening momentum.
Inputs
Divergence Sensitivity
Float input. Sets a threshold after when the RSI divergence is triggered.
RSI Length
Integer input. The default setting used by most traders for the RSI is 14. That means that the indicator will go back 14 periods or time frames based on the chart being used (14 days on a Daily chart , 14 hours on an hourly chart and so forth) and make its calculation based on that.
Cross Distance
Integer input. Value from RSI that above or below 50 that classifies bullish or bearish levels. By default 15, that means the script will be checking for positive divergence when RSI is below 35 (50-15) and negative divergence when RSI is above 75 (50+15).
Use High & Low
Bool input. If true uses high and low values as RSI source.
To get access to this and other scripts check links below.
RSI and Smoothed RSI Bull Div Strategy [BigBitsIO]This strategy focuses on finding a low RSI value, then targeting a low Smoothed RSI value while the price is below the low RSI in the lookback period to trigger a buy signal.
Features Take Profit, Stop Loss, and Plot Target inputs. As well as many inputs to manage how the RSI and Smoothed RSI are configured within the strategy.
Explanation of all the inputs
Take Profit %: % change in price from position entry where strategy takes profit
Stop Loss %: % change in price from position entry where strategy stops losses
RSI Lookback Period: # of candles used to calculate RSI
Buy Below Lowest Low In RSI Divergence Lookback Target %: % change in price from lowest RSI candle in divergence lookback if set
Source of Buy Below Target Price: Source of price (close, open, high, low, etc..) used to calculated buy below %
Smoothed RSI Lookback Period: # of candles used to calculate RSI
RSI Currently Below: Value the current RSI must be below to trigger a buy
RSI Divergence Lookback Period: # of candles used to lookback for lowest RSI in the divergence lookback period
RSI Lowest In Divergence Lookback Currently Below: Require the lowest RSI in the divergence lookback to be below this value
RSI Sell Above: If take profit or stop loss is not hit, the position will sell when RSI rises above this value
Minimum SRSI Downtrend Length: Require that the downtrend length of the SRSI be this value or higher to trigger a buy
Smoothed RSI Currently Below: Value the current SRSI must be below to trigger a buy
