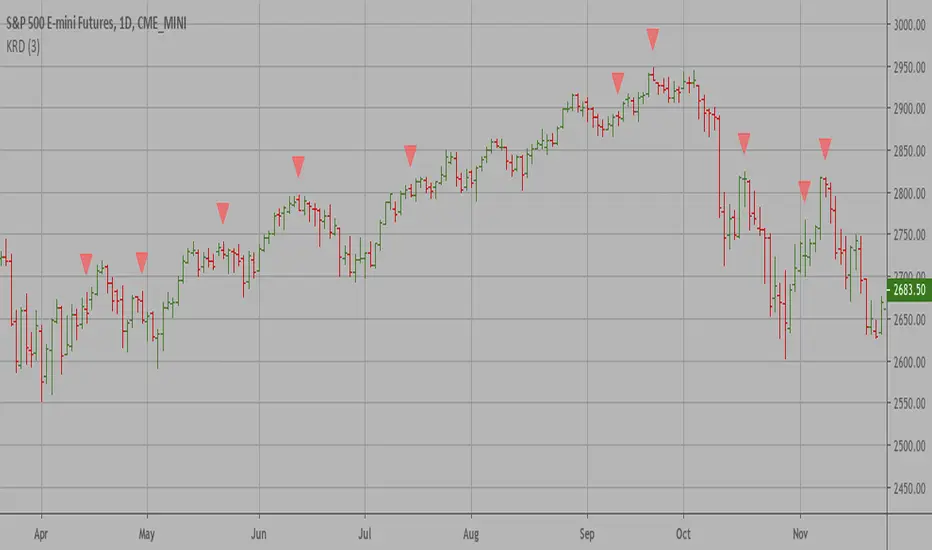
Key Reversal Down A key reversal is a one-day trading pattern that may signal the reversal of a trend.
Other frequently-used names for key reversal include "one-day reversal" and "reversal day."
How Does a Key Reversal Work?
Depending on which way the stock is trending, a key reversal day occurs when:
In an uptrend -- prices hit a new high and then close near the previous day's lows.
In a downtrend -- prices hit a new low, but close near the previous day's highs
"reversal" için komut dosyalarını ara
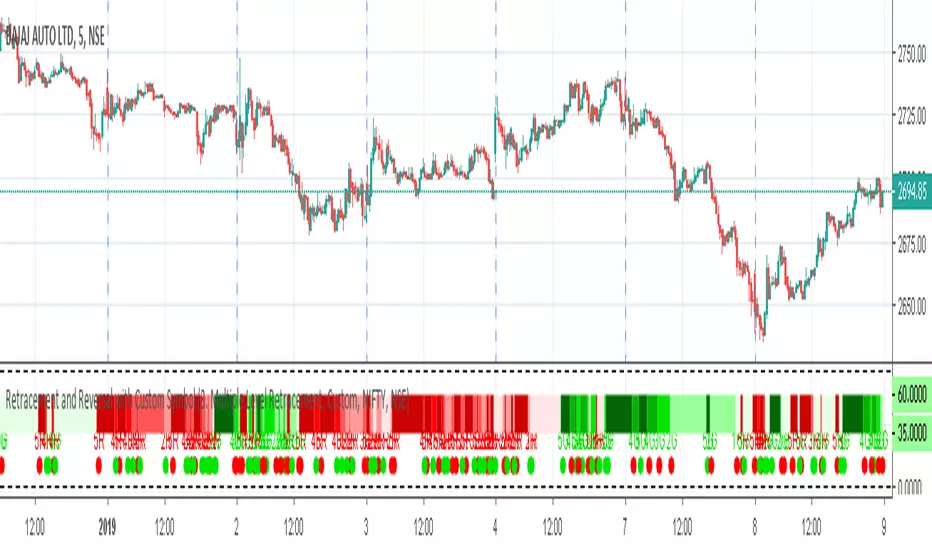
Retracement and Reversal with Custom SymbolRetracement and Reversal loaded with custom symbol feature, allowing traders to monitor multiple symbols at the same time.
For more details please see
1) Retracement and Reversal ,
2) Retracement and Reversal - Ver 1 ,https://in.tradingview.com/script/oO6UVPVo-Retracement-and-Reversal-Ver-1/
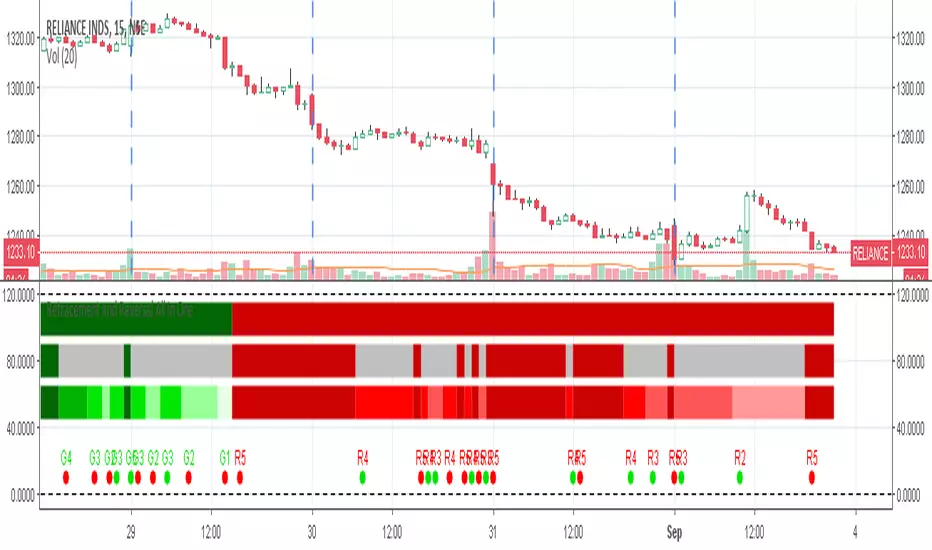
Retracement and Reversal All in OneAlready awesome Retracement and Reversal got even better.
All the 3 retracement options clubbed in one indicator.
For more details please see
1) Retracement and Reversal , and for
2) Retracement and Reversal - Ver 1 ,
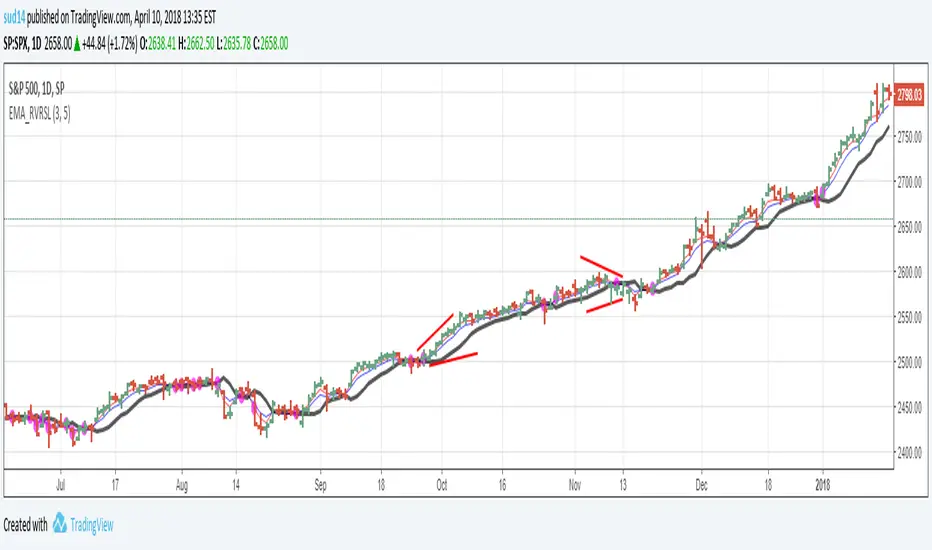
EMA Reversal PointEMA Reversal Point
The script calculates the "likely" reversal point of 2 EMAs (3 and 5 for example) and plots as a line. The points there the EMA cross are highlighted with a Purple circle.
The way I use this indicator is by visually confirming that the reversal line is diverting away from price in case of strong trends.
Divergences between reversal line and price line are good entry points.
Wait for the price bar to clear the reversal line completely before initiating trades. (No overlaps!)
This is my first indicator script so please be kind on the comments!!
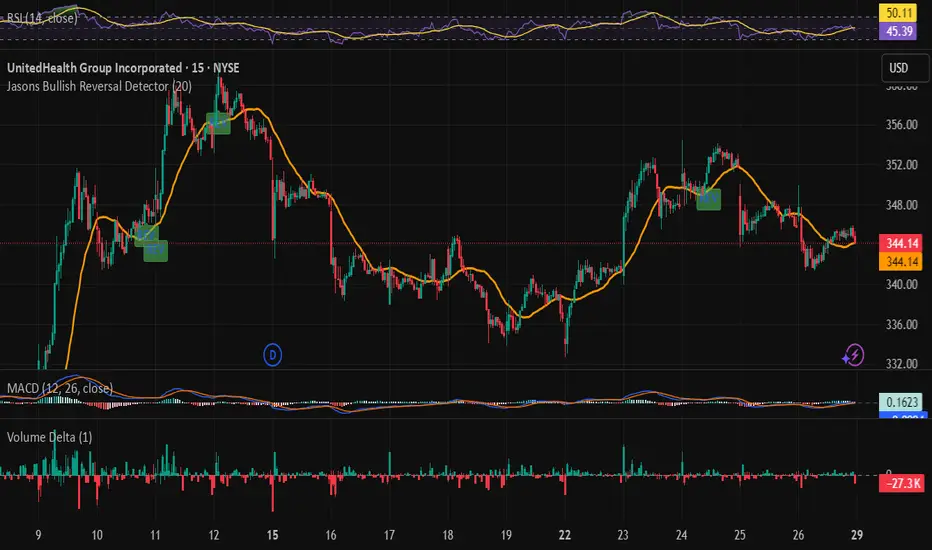
Jasons Bullish Reversal DetectorThis bullish reversal detector is designed to spot higher-quality turning points instead of shallow bounces. At its core, it looks for candles closing above the 20-period SMA, a MACD bullish crossover, and RSI strength above 50. On top of that, it layers in “depth” filters: price must reclaim and retest a long-term baseline (like the 200-period VWMA), momentum should confirm with RSI and +DI leading, short-term EMAs need to slope upward, and conditions like overheated ATR or strong downside ADX will block false signals. When all of these align, the script flags a depth-confirmed bullish reversal, aiming to highlight spots where structure, momentum, and volatility all support a sustainable shift upward.
ICT Setup 02 [TradingFinder] Breaker Blocks + Reversal Candles🔵 Introduction
The "Breaker Block" concept, widely utilized in ICT (Inner Circle Trader) technical analysis, is a crucial tool for identifying reversal points and significant market shifts. Originating from the "Order Block" concept, Breaker Blocks help traders pinpoint support and resistance levels. These blocks are essential for understanding market trends and recognizing optimal entry and exit points.
A Breaker Block is essentially a failed Order Block that changes its role when price action breaks through it. When an Order Block fails to hold as a support or resistance level, it reverses its function, becoming a Breaker Block.
There are two primary types : Bullish Breaker Blocks and Bearish Breaker Blocks. These Breaker Blocks align with the prevailing market trend and indicate potential entry points after a liquidity sweep or a shift in market structure.
Understanding and applying the Breaker Block strategy enables traders to capitalize on the behavior of institutional investors, enhancing their trading outcomes.
Bullish Setup :
Bearish Setup :
🔵 How to Use
The ICT Setup 02 indicator designed to automate the identification of Bullish and Bearish Breaker Blocks. This tool enables traders to easily spot these blocks on a chart and utilize them for entering or exiting trades. Below is a breakdown of how to use this indicator in both bullish and bearish setups.
🟣 Bullish Breaker Block Setup
A Bullish Breaker Block setup is identified in an uptrend, where it serves as a potential entry point. This setup occurs when a Bearish Order Block fails and the price moves above the high of that Order Block. In this scenario, the previously bearish Order Block turns into a Bullish Breaker Block, which now acts as a support level for the price.
To trade a Bullish Breaker Block, wait for the price to retest this newly formed support level. Confirmation of the uptrend can be achieved by analyzing lower time frames for further market structure shifts or other bullish indicators.
A successful retest of the Bullish Breaker Block provides a high-probability entry point for a long trade, as it signals institutional support. Traders often place their stop-loss below the low of the Breaker Block zone to minimize risk.
🟣 Bearish Breaker Block Setup
A Bearish Breaker Block setup, conversely, is used in a downtrend to identify potential sell opportunities. This setup forms when a Bullish Order Block fails, and the price moves below the low of that Order Block.
Once this Order Block is broken, it reverses its role and becomes a Bearish Breaker Block, providing resistance to the price as it pushes downward. For a Bearish Breaker Block trade, wait for the price to retest this resistance level.
A confirmation of the downtrend, such as a market structure shift on a lower time frame or additional bearish signals, strengthens the setup. The Bearish Breaker Block retest provides an opportunity to enter a short position, with a stop-loss placed just above the high of the Breaker Block zone.
🔵 Settings
Pivot Period : This setting controls the look-back period used to identify pivot points that contribute to the detection of Order Blocks. A higher period captures longer-term pivots, while a lower period focuses on more recent price action. Adjusting this parameter allows traders to fine-tune the indicator to match their trading time frame.
Breaker Block Validity Period : This setting defines how long a Breaker Block remains valid based on the number of bars elapsed since its formation. Increasing the validity period keeps Breaker Blocks active for a longer duration, which can be useful for higher time frame analysis.
Mitigation Level BB : This option lets traders choose the level of the Order Block at which the price is expected to react. Options like "Proximal," "50% OB," and "Distal" adjust the zone where a reaction may occur, offering flexibility in setting up the entry and stop-loss levels.
Breaker Block Refinement : The refinement option refines the Breaker Block zone to display a more precise range for aggressive or defensive trading approaches. The "Aggressive" mode provides a tighter range for risk-tolerant traders, while the "Defensive" mode expands the zone for those with a more conservative approach.
🔵 Conclusion
The Breaker Block indicator provides traders with a sophisticated tool for identifying key reversal zones in the market. By leveraging Breaker Blocks, traders can gain insights into institutional order flow and predict critical support and resistance levels.
Using Breaker Blocks in conjunction with other ICT concepts, like Fair Value Gaps or liquidity sweeps, enhances the reliability of trading signals. This indicator empowers traders to make informed decisions, aligning their trades with institutional moves in the market.
As with any trading strategy, it is crucial to incorporate proper risk management, using stop-losses and position sizing to minimize potential losses. The Breaker Block strategy, when applied with discipline and thorough analysis, serves as a powerful addition to any trader’s toolkit.

Divergence Signal [TradingFinder] RSI & MACD Reversal On Swing🔵 Introduction
Sometimes in analyzing price charts using indicators, you may observe a discrepancy. For instance, while the price of stocks, currencies, or commodities is increasing, the indicator shows a decrease. Such a phenomenon in technical analysis is termed "divergence." Divergences are categorized into three types based on their formation and the prediction they make about the continuation of the price trend: "Regular Divergence," "Hidden Divergence," and "Time Divergence."
🟣 Important :
• This indicator exclusively identifies regular divergences since its primary function is to detect reversal points.
• This indicator identifies divergences using three indicators: "Moving Average Convergence Divergence" (MACD), "Relative Strength Index" (RSI), and "Awesome Oscillator" (AO). The user can choose each of these indicators in the settings using the "Divergence Detection Method" dropdown menu for identifying divergences. These settings are by default set to the MACD mode.
🔵Types of Divergence
Divergences, as mentioned, offer different predictions about the continuation of price trends. Hence, they have various types. We will focus on explaining regular divergences based on this indicator.
🟣 Regular Divergence(RD) :
Regular divergence is a situation arising from contradictory behavior between the indicator and the price chart at the end of a trend. By identifying regular divergences, we anticipate a change in trend direction resembling a reversal pattern.
Regular divergence has two types based on the trend and prediction:
Negative Regular Divergence (RD-) :
This type occurs between two price peaks at the end of an uptrend. Despite forming a new high, the indicator fails to recognize it, indicating a negative regular divergence. The likelihood of a subsequent downtrend is high. Negative divergence suggests strong selling pressure and weak buying power, portraying an unfavorable future for the stock.
Positive Regular Divergence (RD+) :
In contrast, positive regular divergence happens at the end of a downtrend and between two price troughs. As depicted in the chart, although the price forms a new low, the indicator doesn't acknowledge it. Positive regular divergence indicates robust buying pressure and weak selling power. Upon identifying positive divergence in the chart, we expect a price increase for the stock under review
🔵 How to Use
Information from the indicator is displayed in two ways: Table and Label.
🟣 Table : The table displays information about the latest divergence. This includes the type of divergence, existence or absence of divergence, consecutive divergences, divergence quality, and change in indicator phase.
Type Divergence : Indicates the type of divergence, which can be either "Bullish Divergence" or "Bearish Divergence."
Exist : Indicates the presence of divergence with a "+" sign and absence with a "-" sign. A green color is used for bullish divergence and red for bearish divergence.
Consecutive : Shows the number of consecutive divergences. For example, if there are 3 consecutive divergences, the number 3 is displayed.
Divergence Quality : Displays the quality of the divergence based on the number of consecutive divergences. If there is 1 divergence, the quality is "Normal"; for 2 divergences, it's "Good"; and for 3 or more divergences, it's "Strong."
Change Phase Indicator : Indicates whether a phase change in the indicator has occurred with "+" for yes and "-" for no.
🟣 Label : Unlike the table, which only shows information about the latest divergence, labels display information about each divergence at the point where it occurs. The information includes the type of divergence, detection method, divergence quality, consecutive divergences, and change in phase indicator. The selected method of detection is also displayed. For example, if the chosen method is the "AO" indicator, the label will show "Method: AO."
🔵 Settings
Fractal Period : Determines the period of swings. The minimum and default value is 2.
Divergence Detect Method : Selects the indicator (MACD, RSI, or AO) used for detecting divergences. The default indicator is MACD.
Show Fractal : Chooses whether to display fractals or not. The default is "No."
Show Table : Determines whether to display the table or not. The default is "Yes."
Show Label : Chooses whether to display labels or not. The default is "Yes."
Label Size : Adjusts the size of the labels from "Tiny" to "Large."

ADX Thrust Reversal & Trend
Created by Love Sharma, CMT, CFTe
the idea is simple. there needs to be thrust in prices before adx goes above any barrier or level say 25/10 or even 10/ The Di plus or Di minus should be above ADX. This indicates the change in direction or change in underlying price and obviously followed by ADX indicator which is dependent on user which level it exceed.
The ADX - Shows Trend Strength
The =/- Di show Thrust or reversal in prices.
it helps in entering the directional change in prices early rather than waiting for ADX

K's Reversal Indicator IIIK's Reversal Indicator III is based on the concept of autocorrelation of returns. The main theory is that extreme autocorrelation (trending) that coincide with a technical signals such as one from the RSI, may result in a powerful short-term signal that can be exploited.
The indicator is calculated as follows:
1. Calculate the price differential (returns) as the current price minus the previous price.
2. the correlation between the current return and the return from 14 periods ago using a lookback of 14 periods.
3. Calculate a 14-period RSI on the close prices.
To generate the signals, use the following rules:
* A bullish signal is generated whenever the correlation is above 0.60 while the RSI is below 40.
* A bearish signal is generated whenever the correlation is above 0.60 while the RSI is above 60.

VIX Reversal Scalper by Trend Friend - Stocks OnlyVIX REVERSAL SCALPER BY TREND FRIEND - STOCKS ONLY
This indicator is built for scalping, but can be used for swing trades by adjusting the signal settings to a higher number.
This indicator is meant for stocks with a lot of price action and volatility, so for best results, use it on charts that move similar to the S&P 500 or other similar charts.
This indicator uses real time data from the stock market overall, so it should only be used on stocks and will only give a few signals during after hours. It does work ok for crypto, but will not give signals when the US stock market is closed.
**HOW TO USE**
When the VIX Volatility Index trend changes direction, it will give a bull or bear signal on the chart depending on which way the VIX is now trending. Follow these when price is near support/resistance or fibonacci levels.
For more signals with earlier entries, go into settings and reduce the number. 10-100 is best for scalping. For less signals with later entries, change the number to a higher value. Use 100-500 for swing trades. Can go higher for long swing trades.
***MARKETS***
This indicator should only be used on the US stock markets as signals are given based on the VIX volatility index which measures volatility of the US Stock Markets.
***TIMEFRAMES***
This indicator works on all time frames.
**NOTE**
Repainting does happen but it is seldom. If I get enough requests to remove repainting I will, but since it is built for early entries, preventing it from repainting will make the signals show up later than normal.
Due to various factors, this indicator might not give exit signals every time it should, so be sure to watch the price action for entries/exits and don't rely solely on this indicator.
**INVERSE CHARTS**
If you are using this on an inverse ETF and the signals are showing backwards, please comment with what chart it is and I will configure the indicator to give the correct signals. I have included over 50 inverse ETFs into the code to show the correct signals on inverse charts, but I'm sure there are some that I have missed so feel free to let me know and I will update the script with the requested tickers.
***TIPS***
Try using numerous indicators of ours on your chart so you can instantly see the bullish or bearish trend of multiple indicators in real time without having to analyze the data. Some of our favorites are our Auto Fibonacci, Directional Movement Index, Volume Profile, Auto Support And Resistance and Money Flow Index in combination with this Vix Reversal Scalper. They all have real time Bullish and Bearish labels as well so you can immediately understand each indicator's trend.

AJ Scalp Reversal Tops and Bottoms IndicatorReuploaded after TV took it down.
A free scalping reversal, top and bottom indicator. It prints signals in real time, and should be used for scalping.
Following candle will usually always follow the signal but from there closer management is required.
This script uses RSI, Volume, OBV, Pivots and a few more indicators to calculate the signals.
Use alongside other indicators and price action analysis for best results.
Only use on time frames above 1H, otherwise the signals fire too frequently.
*These signals are different compared to other scripts created by me

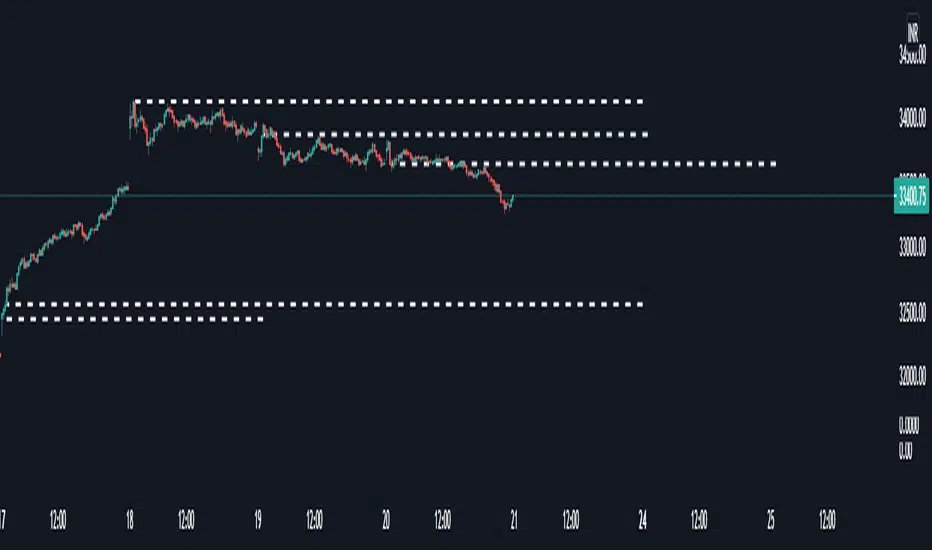
Dilip Reversal Points 1This indicator is very simple, but surprisingly effective, and I haven't found any mention of something similar, so here it is. I hope it helps you in your stock trading.
What's more, is that the stock would often respond to the high and low values of that candle later on in the day. It turned out to be quite an important support and resistance level indicator for stocks which I've used in my trading ever since I discovered it.
After testing it out day after day on multiple stocks, I decided to write this indicator, which not only projects the high and low values of the candle, but also the previous day's closing price.
If you find that there's another out there for Forex or Crypto, please let me know!
You have the option to set the to another time, if you want to experiment with things. White line will act as support and resistance
I hope it helps,
Note: Since Reversal Points Indicator works in ALL Segments only amounts vary across the board. The background height is set to readjust based on the highest bars. This lookback amount is adjustable by the user and it does not affect calculations what so ever.
For access, send me a DM on TradingView
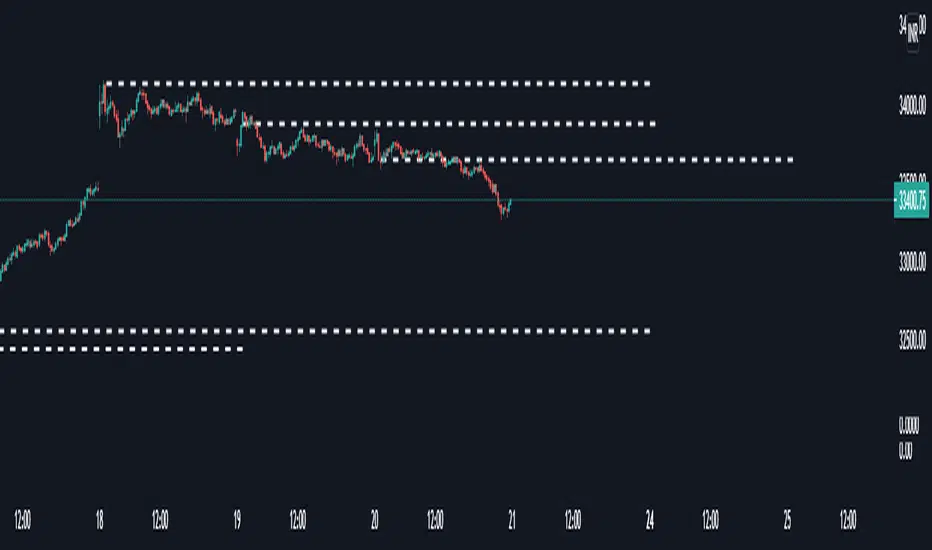
Dilip Reversal PointsThis indicator is very simple, but surprisingly effective, and I haven't found any mention of something similar, so here it is. I hope it helps you in your stock trading.
What's more, is that the stock would often respond to the high and low values of that candle later on in the day. It turned out to be quite an important support and resistance level indicator for stocks which I've used in my trading ever since I discovered it.
After testing it out day after day on multiple stocks, I decided to write this indicator, which not only projects the high and low values of the candle, but also the previous day's closing price.
If you find that there's another "magic candle" out there for Forex or Crypto, please let me know!
You have the option to set the "magic candle" to another time, if you want to experiment with things. White line will act as support and resistance
I hope it helps,
Note: Since Reversal Points Indicator works in ALL Segments only amounts vary across the board. The background height is set to readjust based on the highest bars. This lookback amount is adjustable by the user and it does not affect calculations what so ever.
For access, send me a DM on TradingView
Upside reversalUpside reversal is a condition when price takes down prior day's low but closes in an upper half on a daily range

Magic ReversalThis indicator can point out you monthly potential reversal range. This can be used for people who hold the trade more than couple of days to understand their Risk / Reward ratio. Even this can be used of people who does BTST or STBT trades as well.
Contact me for more information
Failed ReversalThis is built on False Reversal or say Profit Booking logic where price is moving in an direction and suddenly reverses but then fails to sustain on that reversal and comes back to original trend.This is a Trend Following system and the entry exits are based on price action using 2 candles wherein close of second candle defines Entry and low of previous is SL.This also has an Stop loss Filter so that user's can avoid the trades having big candles as per their risk appetite .

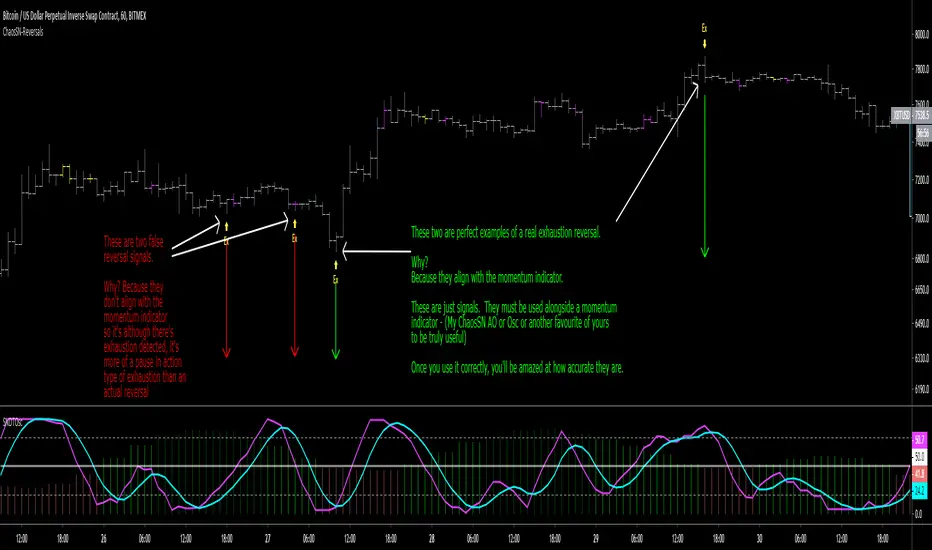
ChaosSN Reversal Signal v2I calculated various metrics to measure exhaustion and mean diversion to plot arrows for a likely reversal point.
Use the input window to tailor the sensitivity of the arrows based on the amount of volatility your chart is experiencing (lower = more sensistive). The most common inputs for me are 8, 13, 21.
v2 Update:
Tweaked under the hood and added some bar colors.
Purple Bar = a secondary reversal indicator. Alignment with an arrow makes it a very strong signal.
Yellow Bar = pause in the action and a large move may occur soon
Pivot Reversal Strategy + RSIPivot Reversal Strategy + RSI
A modified version of the standard PRS with an RSI overbought/oversold filter
Comment/uncomment "Study/Strategy" to easily switch to strategy() mode
As long as it is used in the study() version, the indicator is compatible with the Risk Management Wrapper
Separate Alerts for Buy & Sell signals
Single Alert for both Buy & Sell signals - it can also be used by another indicator as a source
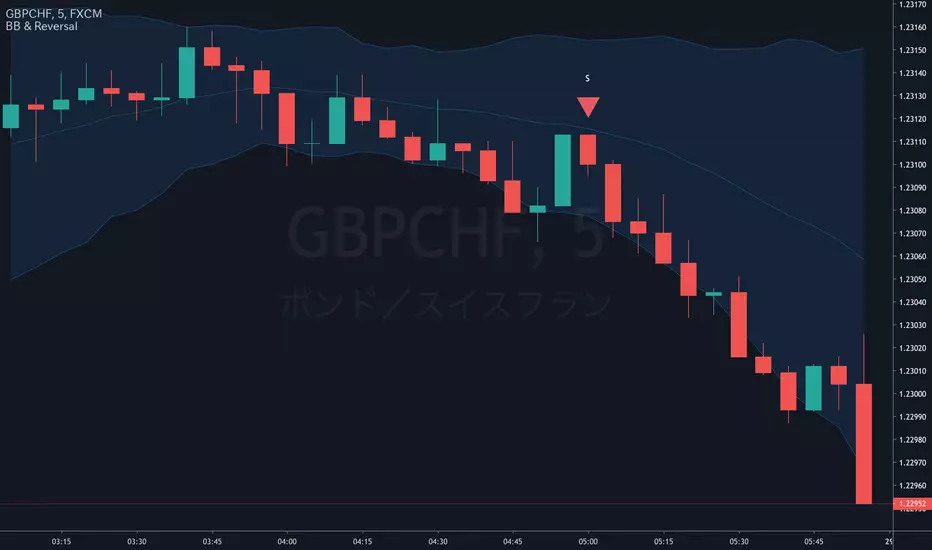
Bollinger Bands and Candlestick No Wick ReversalBollinger Bands and Candlestick No Wick Reversal
with alerts
Combo Strategies 123 Reversal and 3-Bar-Reversal-Pattern This is combo strategies for get
a cumulative signal. Result signal will return 1 if two strategies
is long, -1 if all strategies is short and 0 if signals of strategies is not equal.
First strategy
This System was created from the Book "How I Tripled My Money In The
Futures Market" by Ulf Jensen, Page 183. This is reverse type of strategies.
The strategy buys at market, if close price is higher than the previous close
during 2 days and the meaning of 9-days Stochastic Slow Oscillator is lower than 50.
The strategy sells at market, if close price is lower than the previous close price
during 2 days and the meaning of 9-days Stochastic Fast Oscillator is higher than 50.
Secon strategy
This startegy based on 3-day pattern reversal described in "Are Three-Bar
Patterns Reliable For Stocks" article by Thomas Bulkowski, presented in
January,2000 issue of Stocks&Commodities magazine.
That pattern conforms to the following rules:
- It uses daily prices, not intraday or weekly prices;
- The middle day of the three-day pattern has the lowest low of the three days, with no ties allowed;
- The last day must have a close above the prior day's high, with no ties allowed;
- Each day must have a nonzero trading range.
WARNING:
- This script to change bars colors.

Poseidon - [Swing High Low][Support and Resistance][Reversal]...A great indicator with tons of usages for technical analysis
Act as:
* Support and Resistance (It can be used as breakouts only if you drag the line manualy, it will never break it by itself)
* Swing points
* Reversal point (The candle will reverse in 90% in cases)
* Tops and Bottoms (It finds highest and lowest points)
... and many more TA for strategies
Combined with RSI will give even better overview of the chart
Play with values till you find what your needs are
The bigger value is, the more accurate points will be
(There is no such as magic indicators, you need to do your job, you need to know what are you doing before enter in real life!)
Cheers!
@Zekis

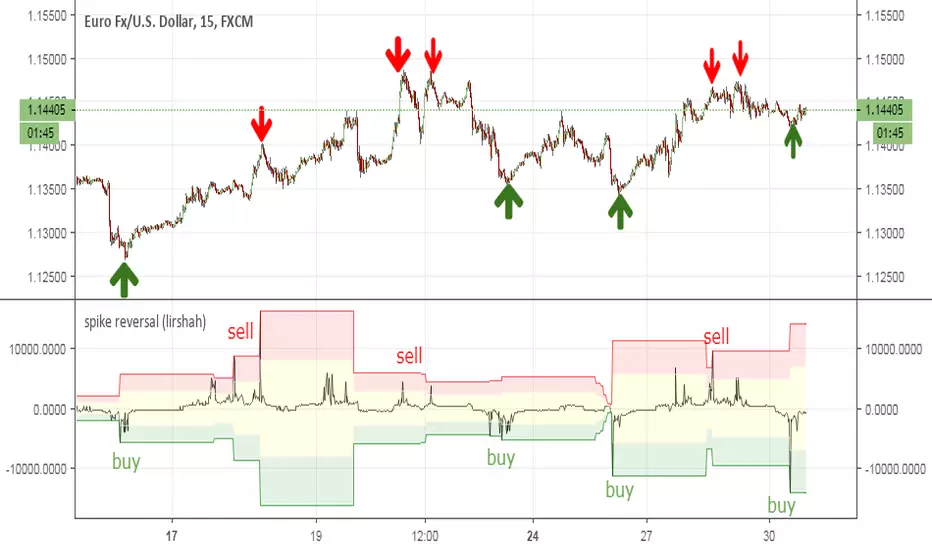
spike reversal (lirshah)spike reversal indicator is an innovation of lirshah programming team,
this indicator is combination of several indicators with candle sticks patterns.
good accuracy on reverse points and ease of interpretation are strong points of this indicator.
calculation of this indicator is based on opening price of each bar which means the value of indicator is constant on each candle and no repaints occur.
Trader Set - MTF Reversal Bar SignalsThis is Multi Tile Frame signalling of reversal bar strategy. Using this, you can easily Identify if you had a reversal bar signal in 1,2,3,4,5,10,15, and 30 minute based renko charts.
The more time frames get in sync with each other, the higher possibility for a more powerful signal.
The least you would need is for 1,2 and 3 minutes to have 2 out of 3 of them showing same signal.
Please don't ask for getting access, the licensing will be available for purchase soon in the website and I will announce it in the comment section.
