Institutional OrderBlock Pressure█ OVERVIEW
OrderBlocks are areas where Banks take a Short or Long position. So they create a movement that they would like to hide from us, but luckily for us they cannot. Take the example of Banks opening Short position for x reason. The Trend is already Bearish. The Price will fall and then make a Reversal
(most often to the price where they opened their positions) and it is at this precise moment that they will again resume a Short position twice as
large because for the moment, following this example it is not in their interest that the Price exceeds a certain Price since they are Seller.
As a result they create a solid Resistance (the strongest it is). There are several ways to interpret this logic, we can try to follow the movement of Banks
or on the contrary take advantage of the recovery of the course. Note that not having level 2 and access to the order book from TradingView we can only
make a rough estimate of the "OrderBlocks" through VPOC.
█ HOW TO INTERPRET?
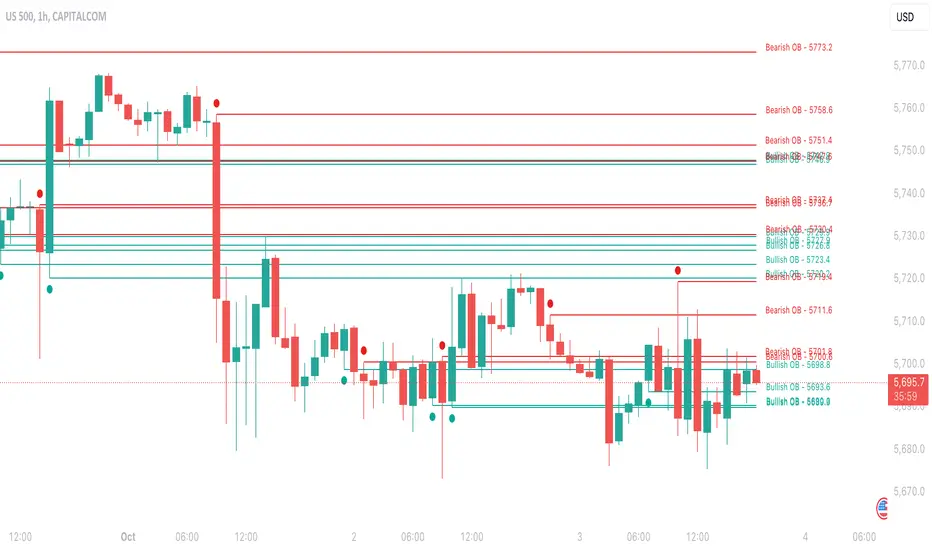
• The Labels displayed by "Red Arrow" and "Green Arrow" represent supposed Bearish or Bullish OrderBlock. Note that you should not in any way interpret these "Arrows" as Signals to Buy or Sell for the reasons mentioned above.
• The OB Line works according to detected OrderBlock Candle. These lines indicate the potential recovery area. (The highlighted lines and candles are white by default).
• It is better to use this indicator on Higher TimeFrame like 2H or 4H.
• You can change the Volume Ratio (here VPOC) which is 89 by default.
• There is a Customization section that allows you to change the colors of the Lines and Candles from White to Black depending on your background color (Light or Dark).
• YES the indicator is Repainting and YES you can have False Alerts since Labels appear in intra-bar!
█ ALERTS
• In fact we don't really need Alerts for the logic of this indicator except maybe to get the Price of the last OB Detected and to keep this price in your Alert History and may use it later. Some improvements will come in future with updates and we have already planned to add Alerts when a "Line Cross" gone occur.
If you notice any bugs or if you have any suggestions, don't be hateful gangs ;)
Happy trading everyone and remember, risk management is the most important!
"reversal" için komut dosyalarını ara
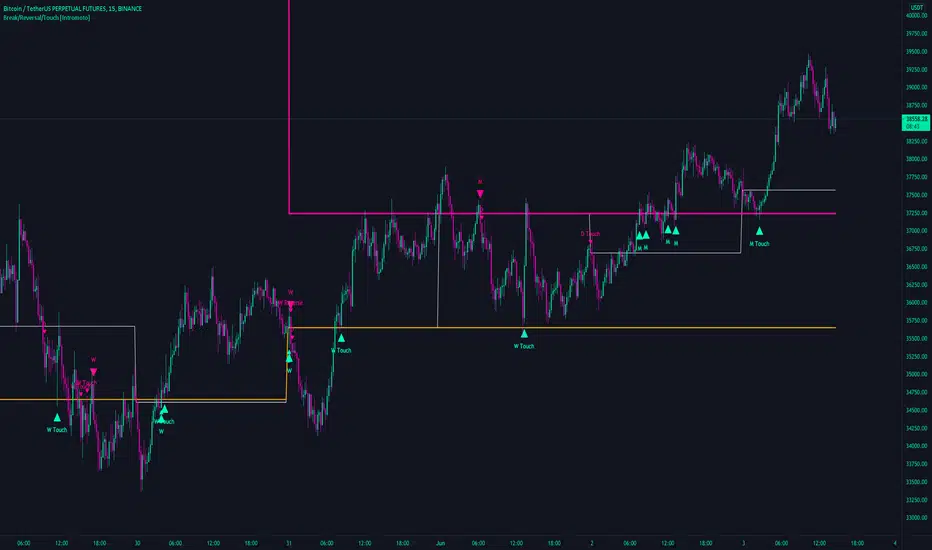
Break/Reversal/Touch [Intromoto]This script shows the engulfing breaks, touches and potential reversals for when prices arrives at certain time frame closes.
On publishing it shows the crossovers of the 6 hour, Daily, Weekly, and Monthly time frames.
The candle main signals are contingent on crossing over the closing level, and engulfing the previous candle. Secondary signals occur when the candle low or high touch the closing levels, in the directional color, i.e. you'll get a bearish touch signal if the candle high touches the level, and it's a red candle. Reversals occur when the subsequent candle breaks a closing level, but the current candle engulfs the previous candle in the opposing direction.
If a candles low or high hits a daily, weekly, or monthly close level it also will plot a "D/W/M Touch" in the according direction.
Thanks
Peak Reversal v2This is a brand new version of my Peak Reversal indicator. As with the older version, the idea behind this indicator is simple: identify potential price reversal areas, and identifying markets which are trending. In this new version I focused on improving on the old concept, but introduced a bunch of features heavily inspired by Adam Grimes' ideas from The Art and Science of Trading. (I also blatantly stole the way he colors candles outside of the bands. Sorry.)
As you can see below this indicator gives traders a plethora of tools to judge whether a market is trending, and might be mean reverting soon.
Follow me, join my group, like the script. You know the drill.
Basic functions:
You have a triplet of Keltner (ATR-based) bands in Peak Reversal. They are defined by a multiplier and an EMA, which is referred to as "the mean". There's a tight, normal, and an extreme band. The multiplier defines how far apart your bands are. By default the indicator uses 1.125, 2.25, and 3.375. The tight band is off by default, but you can turn it on in the options. The mean is also off by default. This is more a personal preference thing for me, because I happen to use a different indicator to show a couple of moving averages.
Band crosses:
Peak Reversal can indicate whenever price crosses one of the bands. This can help traders identify points where a mean reversal play could be an option. Triangles indicate these crosses. New in version 2 is the ability to choose which of the bands to use to show these crosses. If you are more of an aggressive trader, you might find it better to show tight band crosses. If you are looking for more extreme market conditions, then choose extreme. The default is "normal".
Free bars:
Indicating free bars is also a concept from the book. A "free bar" is one which stands "freely" above the bands, which means its low price is completely outside of the bands. It can be argued that a freely standing bar is an even more extreme mean deviation, than just a band cross. Traders can gain an additional advantage studying the markets this way. Free bars are not shown by default, when on, a star shape on the candles indicates free bars. Both band crosses and free bars can be shown at the same time, but there might be overlap.
Deviations:
Also based on a concept from The Art and Science of Trading, is an indication of price "deviations". You will notice that when a candle "touches" a band (high and close above band), its colored. The idea here is to show traders when a market is in motion, but also when a mean reversal might be coming next. To accomplish this, the more colors deviate, the darker the color is. The idea here is also simple, the more price deviates off the mean, the likelier it is to return to it. This uses three different shades to show these deviations. 1-2 is one shade, 3-4 another, and upwards of 5 there's only the darkest shade. I didn't make extensive studies, which color for how many candles would be appropriate to use, but I do believe it doesn't matter that much in usage. It's clear what traders gain from using this information: more deviation, the likelier a snapback becomes.
Advanced mode:
Last but not least, I decided to add an advanced mode for advanced traders. This does nothing more than flip all colors and shapes upside down. Everything that is red, becomes green. The idea is where some traders say "buy low, sell high" (standard mode), other traders might say "buy high, sell higher" (advanced mode). See for yourself, which one you like better.

The WWG Plan Indicator V2█ OVERALL
This indicator was specifically created for the Walsh Wealth Group.
In short it is a fusion of some of the most basic and widely used indicators to show overbought patterns and trend reversals.
Its best usage is with LTF scalping and agressive profit taking but can also be used to find HTF dips and buy-zones.
█ FEATURES
Buy Signal (Buy):
Printed only with all confirmations triggered
Small Buy Signal (B1 & B2)
Printed if some of the confirmations are triggered and can be treated as DCA entries or for further
confirmation with other indicators and basic TA.
Crayons (Color Bars):
Blue: RSI is oversold
Olive: RSI and Stoch RSI are oversold
Yellow: RSI, Stoch RSI are oversold and lower Bollinger Bands are crossed by Low
Orange: RSI, Stoch RSI and CCI are oversold
Trailing SL:
If activated in the config, a trailing SL can be displayed on the chart based on ATR.
█ SETTINGS
The underlying indicators used are RSI, Stoch RSI, Bollinger Bands, MACD and CCI.
All possible configs can be changed in the config settings.
█ GENERAL INFORMATION
Depending on the settings, the indicator performance will be highly affected.
This indicator is only displaying highly oversold areas and events of trend reversal it is not a *God*-Signal and will print false positives.
█ ALERTS
An alert for the main buy-signal is implemented and can be used via the TV alert functionality.

Trend Reversal Indicator (EMA of slopes)Good morning Traders
Inspirated by lukescream EMA-slope strategy, today I want to share with you this simple indicator whose possible use-case would be for detecting in advance possible trend reversals, specially on higher timeframes.
Once that you've chosen the desired source (RSI, EMA or Stochastic k or d), the indicator will calculate its "slope" approximating its first order derivative by the division between the last variation of the series and its last value.
You can see the slope as a white line by enabling the relative checkmark (it's disabled by default since it simply messes up the the graph)
Then, the slope itself becomes the source for two exponential moving averages: the fast one (in blue) has a period of 20 while the slow one (in red, it becomes similiar to a horizontal line actually) has a period of 500
Why the slope? Since all the sources mentioned before are directly or indirectly calculated on the price action, a more aggressiveness in the price movement would be translated into a more (positive/negative) steepness of those indicator (of course this effect would be far more evident if the indicators are calculated on low periods, but really low periods could compromise the consistency of the signals).
In this way, the slope would mirror the decisiveness of price movements and a comparison between two averages calculated from it (the first one based on more recent values, the second one that conisders also older values) could tell you in advance what direction the market is possibly about to take
The usage is simple: once that the fast moving average crosses upward the slow one, this could be a sign of potential trend reversal from bearish to bullish. On the contrary, if the fast EMA crosses downward the slow one, this could be a sign of potential trend reversal from bullish to bearish.
What I suggest you is to integrate this indicator with Exponential Moving Averages plotted on the price candles, in order to have a general bias for opening long or short positions, and with an oscillator as well such as the Stochastisc RSI in order to detect the overbought/oversold zones for opening/closing positions at the right moment.
Happy Trading!

KISS Strategy: SMA + EMA//Hello my fellow investors
//I am creating a simple non-cluttered strategy that uses 3(+1) simple means to determine: viability, entry, and exit
//1) Has a consistent trend been maintained for several days/weeks
//2) SH SMA crossover LG SMA = Bullish entry/LG SMA crossover SH SMA = Bearish entry
//3) Use the Slope factor & Weeks in Trend (WiT) to dertermine how strong of an entry signal you are comfortable with
//4) Exit position based on next SMA cross and trend reversal or stop loss%
//3+1) For added confidence in trend detection: Apply MACD check - buy--> MACD line above signal line and corssover below histogram \\ sell --> MACD line below signal line and crossover above histogram.
//*)This code also allows you to determine your desired backtesting date compliments of alanaster
The chart shown has:
Starting Capital: $10,000
Investment percent per trade: 1.5%
Stop Loss: 20%
Take Profit: 100%
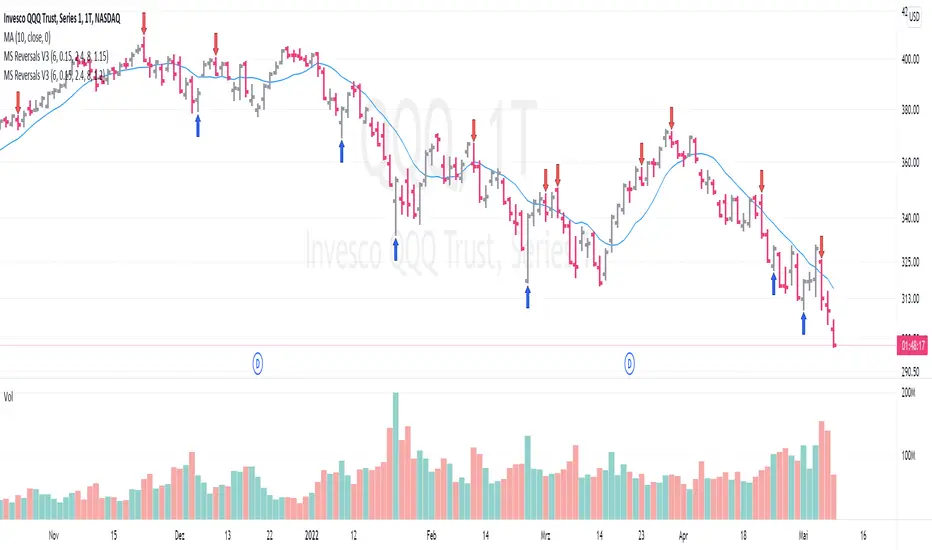
MS ReversalsDisplay of a certain type of reversal bars. Reversal formations have to be considered in market context. Basically downward signals in the uptrend are ignored, unless there is an non-correlated inversion setup. Similarly, upside signals in downtrends are ignored until a bullish reversal setup occurs.
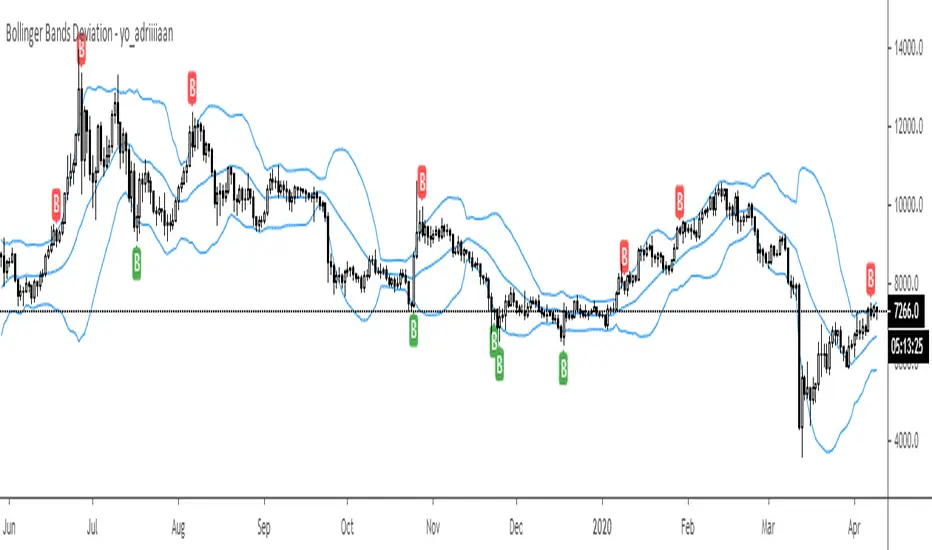
Bollinger Bands Deviation - yo_adriiiiaanBollinger Band Deviations
In theory price trades within 2 standard deviations 95% of the time. This is an attempt to capture that 5% that deviates from the bands.
Useful for taking profit or signaling a reversal.
Smart Envelope - Running Away From The TrendIntroduction
Envelopes indicators consist in displaying one upper and one lower extremity on the price chart. They are most of the time built by adding/subtracting a volatility estimator (rolling stdev, atr, range...etc) to a central tendency estimator (SMA, EMA, LSMA...etc) . Their interpretation is often subject to debate amongst technical analyst, some will use a support and resistance methodology, where price will start a downtrend once it cross the upper extremity, and a down trend once it cross the lower one. Others will prefer a breakout methodology, where price will reach higher highs once it cross the upper extremity, and lower lows when it cross the lower one. Because of price non stationarity its hard to select the best methodology, the support and resistance one will mostly work on ranging markets, while the breakout methodology mostly work on trending ones.
Therefore new methods where proposed, instead of using moving averages with a high lag, faster filters where used, such as the least squares moving average or zero lag exponential moving average, other band indicators where also created using adaptive filters, but improvements remain relatively low. The most difficult task would be to make extremities with the ability to return accurate support and resistances levels, and today i want to provide a new way to construct such extremities by using the recursive bands framework that allow extremely creative and efficient indicators.
The Main Idea
With classical bands indicators, the upper and lower extremity will still be correlated with the main trend, the problem behind such method is that we can't use a support and resistance methodology with trending markets, the fact that reversals exist tells us that our extremities will always be crossed by the main trend, here is an example :
Here the support is correlated with the main trend, in order for it to be accurate we must assume the trend will go on for ever, and will only detect higher lows, this is what we expect with the orange line, but we can see that a severe down trend totally destroy our plan.
In short we need to give some headroom to our extremities, and thus one extremity can't be correlated with the main trend.
The proposed Indicator
We want to minimize the correlation between the extremities, so if the upper extremity rise, the lower one must fall. This allow to give some headroom and allow the user to anticipate larger movements, this is how bands seeking to give support and resistances points should work.
The indicator has a length setting that control the wideness of the extremities, unlike other indicators low values such as 14 can still create really wide bands, take that into account.
length = 5. Lower length values allow for more motion from the extremities, but does not necessarily involve detecting shorter terms support and resistances levels. The factor setting is not that important, but it allow to return extremities with more motion when high, and really wide bands when below 1 and greater than 0.
Central Tendency Estimator
Something fun with the recursive band framework is that the bands are no longer based on the central tendency estimator but its the central tendency estimator who is based on the bands. The central tendency estimator can also provide support and resistances points with the price, like classical moving averages, altho its lack of motion is this time a downside.
Conclusion
Altho the extremities are more accurate than other band indicators, the problem remain the same, larger trend will always break the extremities and continue creating higher/lower highs/lows, at this point our stop loss would certainly be triggered. This is a huge downsides of contrarian strategy, we sure might anticipate reversals earlier, but we are exposed to larger price movements, therefore the risk is extreme.
But the proposed methodology might still prove useful to develop more robust support and resistances levels based on envelopes indicators.
Thanks for reading !

Breaker Blocks Signals [AlgoAlpha]🟠 OVERVIEW
This script automates the detection of Breaker Blocks, a popular smart money concept used to identify high-probability reversal zones. It monitors price action for aggressive impulses—measured through a normalized Z-Score—to identify Orderblocks. When these blocks are "broken" or invalidated by price moving through them, they transform into Breaker Blocks. These zones act as "flipped" support or resistance, offering traders specific areas to look for retests and trend continuations. By handling the complex management of zone life-cycles and mitigation, this script provides a clean, real-time map of institutional supply and demand shifts.
🟠 CONCEPTS
The indicator relies on the relationship between price momentum and structural invalidation. It first identifies "impulsive" candles by calculating a Z-Score of price distance covered over a specific window. A Z-Score above 4 marks an "Algorithmically Significant" move. When such a move occurs, the script identifies the last opposite-colored candle (the Orderblock) and draws a gray zone. The transformation happens when price closes entirely through one of these gray zones. This "mitigation" is what triggers the creation of a Breaker Block: an old bearish supply zone becomes a bullish demand zone, and vice versa. This transition reflects a shift in market regime where previous trapped participants are forced to exit, often leading to price rejections at these newly formed levels.
🟠 FEATURES
Automated Breaker Transformation : Instantly flips mitigated Orderblocks into colored Breaker Blocks (Bullish/Bearish).
Rejection Markers : Small arrow icons appear when price enters a Breaker Block and shows signs of respect/reversal.
Comprehensive Alerts : Notifications for both the formation of new breakers and real-time price rejections.
🟠 USAGE
Setup : Add the script to your chart. It is effective on most timeframes, but many traders prefer the 15m or 1h for intraday structure. Use the "Z-Score Window" to adjust sensitivity; 100 is standard, but lower values (e.g., 50) will find more frequent, smaller impulses.
Read the chart : Gray boxes are "Pending" blocks. If price closes above a gray bearish box, it turns into a Bullish Breaker (Green). If price closes below a gray bullish box, it turns into a Bearish Breaker (Red). Look for price to return to these colored zones; the "▲" and "▼" symbols indicate the script has detected a rejection from that level.
Settings that matter : Prevent Overlap is useful for avoiding "cluttered" zones in ranging markets. Max Box Age is critical; it ensures that very old, irrelevant zones are removed from your chart after a set number of bars, keeping your technical analysis current and focused on recent price action.

Advanced Momentum TrackerThe Advanced Momentum Tracker (AMT) is a technical indicator designed to identify high-probability trend reversals and momentum shifts in real-time. Unlike traditional indicators that rely solely on mathematical formulas, AMT analyzes price action structure and historical patterns to detect when market momentum is shifting from bullish to bearish (and vice versa).
Core Methodology:
The indicator tracks consecutive price movements and maintains a comprehensive database of historical momentum patterns. It identifies trend changes by analyzing:
Sequential candle relationships (opens and closes)
Break of key trailing stop levels formed by recent price action
Historical success rates of similar momentum patterns
Key Features
1. Dynamic Levels:
Automatically plots real-time dynamic trailing stop levels based on current momentum
Color-coded lines: Green for bullish momentum, Red for bearish momentum
These levels act as trigger points for potential trend changes
2. Entry Signal Markers:
Clear BUY (↑) and SELL (↓) arrows when momentum shifts are detected
Arrows positioned above/below candles for maximum visibility ,Signals only appear on confirmed trend changes
3. Momentum Score Display:
Shows statistical probability based on historical pattern analysis
Displays strength percentage of current momentum continuation
Helps traders assess confidence level of the current trend
4. Exit Zone Indicator:
Plots recommended exit levels for active positions
Dynamic color coding: Red for long exits, Green for short exits
Warning system (orange) when price breaches exit zones
5. Position Management Filter:
Optional risk filter to avoid trades with excessive distance from trigger level
Customizable position threshold percentage
Helps maintain consistent risk-reward ratios
6. Comprehensive Alert System:
Customizable alert messages for both long and short signals
Configurable alert frequency (once per bar or once per bar close)
Real-time notifications for all signal types
Customization Options-
Visual Settings:
Toggle visibility of current price level, momentum score, and exit zones
Customizable colors for all elements (bullish/bearish themes)
Adjustable line thickness for dynamic levels
Entry Markers:
Custom colors for long and short entry signals
Adjustable arrow distance from candles
Core Parameters:
Historical Depth: Amount of past data to analyze (default: 20,000 bars)
Sensitivity Level: Controls how strong a move must be to trigger signals (default: 4)
Higher values = fewer but stronger signals
Lower values = more signals with earlier entries
Position Management:
Enable/disable position filter
Set maximum acceptable risk threshold as percentage
How It Works:-
Momentum Detection Engine: The script continuously monitors price action, tracking each bullish and bearish leg. It maintains arrays of opens, closes, and counts to build a comprehensive picture of market structure.
Pattern Recognition: When price breaks key levels (minimum/maximum of recent candles based on sensitivity), the indicator recognizes a potential momentum shift.
Statistical Validation: The script compares the current pattern against its historical database to calculate the probability of momentum continuation.
Signal Generation: When a valid trend change is detected (and passes the position filter if enabled), entry signals are displayed with corresponding exit zones.
Best Use Cases:
Swing trading on any timeframe (works on 1m to 1D charts)
Trend reversal identification
Momentum trading strategies
Works on all markets: Forex, Stocks, Crypto, Indices, Commodities etc
Recommended Settings:
Scalping/Day Trading: Sensitivity 2-3, Historical Depth 10,000-20,000
Swing Trading: Sensitivity 3-4, Historical Depth 20,000-30,000
Position Trading: Sensitivity 4-5, Historical Depth 30,000+
Important Notes:
Signals appear only on confirmed bars (not on real-time candles unless confirmed)
The momentum score becomes more accurate as more historical data is processed
Position filter should be adjusted based on the volatility of the instrument being traded
Best used in conjunction with proper risk management and position sizing
What Makes This Indicator Unique:
Unlike indicators that simply apply mathematical formulas to price data, AMT learns from historical price behavior. It doesn't just tell you what happened—it tells you what's likely to happen next based on thousands of similar situations in the past. The statistical momentum score provides an edge that pure technical indicators cannot offer.
Disclaimer: This indicator is a tool for technical analysis and should not be used as the sole basis for trading decisions. Always use proper risk management and combine with your own analysis. Happy Trading !!

LuxyEnergyIndexThe Luxy Energy Index (LEI) library provides functions to measure price movement exhaustion by analyzing three dimensions: Extension (distance from fair value), Velocity (speed of movement), and Volume (confirmation level).
LEI answers a different question than traditional momentum indicators: instead of "how far has price gone?" (like RSI), LEI asks "how tired is this move?"
This library allows Pine Script developers to integrate LEI calculations into their own indicators and strategies.
How to Import
//@version=6
indicator("My Indicator")
import OrenLuxy/LuxyEnergyIndex/1 as LEI
Main Functions
`lei(src)` → float
Returns the LEI value on a 0-100 scale.
src (optional): Price source, default is `close`
Returns : LEI value (0-100) or `na` if insufficient data (first 50 bars)
leiValue = LEI.lei()
leiValue = LEI.lei(hlc3) // custom source
`leiDetailed(src)` → tuple
Returns LEI with all component values for detailed analysis.
= LEI.leiDetailed()
Returns:
`lei` - Final LEI value (0-100)
`extension` - Distance from VWAP in ATR units
`velocity` - 5-bar price change in ATR units
`volumeZ` - Volume Z-Score
`volumeModifier` - Applied modifier (1.0 = neutral)
`vwap` - VWAP value used
Component Functions
| Function | Description | Returns |
|-----------------------------------|---------------------------------|---------------|
| `calcExtension(src, vwap)` | Distance from VWAP / ATR | float |
| `calcVelocity(src)` | 5-bar price change / ATR | float |
| `calcVolumeZ()` | Volume Z-Score | float |
| `calcVolumeModifier(volZ)` | Volume modifier | float (≥1.0) |
| `getVWAP()` | Auto-detects asset type | float |
Signal Functions
| Function | Description | Returns |
|---------------------------------------------|----------------------------------|-----------|
| `isExhausted(lei, threshold)` | LEI ≥ threshold (default 70) | bool |
| `isSafe(lei, threshold)` | LEI ≤ threshold (default 30) | bool |
| `crossedExhaustion(lei, threshold)` | Crossed into exhaustion | bool |
| `crossedSafe(lei, threshold)` | Crossed into safe zone | bool |
Utility Functions
| Function | Description | Returns |
|----------------------------|-------------------------|-----------|
| `getZone(lei)` | Zone name | string |
| `getColor(lei)` | Recommended color | color |
| `hasEnoughHistory()` | Data check | bool |
| `minBarsRequired()` | Required bars | int (50) |
| `version()` | Library version | string |
Interpretation Guide
| LEI Range | Zone | Meaning |
|-------------|--------------|--------------------------------------------------|
| 0-30 | Safe | Low exhaustion, move may continue |
| 30-50 | Caution | Moderate exhaustion |
| 50-70 | Warning | Elevated exhaustion |
| 70-100 | Exhaustion | High exhaustion, increased reversal risk |
Example: Basic Usage
//@version=6
indicator("LEI Example", overlay=false)
import OrenLuxy/LuxyEnergyIndex/1 as LEI
// Get LEI value
leiValue = LEI.lei()
// Plot with dynamic color
plot(leiValue, "LEI", LEI.getColor(leiValue), 2)
// Reference lines
hline(70, "High", color.red)
hline(30, "Low", color.green)
// Alert on exhaustion
if LEI.crossedExhaustion(leiValue) and barstate.isconfirmed
alert("LEI crossed into exhaustion zone")
Technical Details
Fixed Parameters (by design):
Velocity Period: 5 bars
Volume Period: 20 bars
Z-Score Period: 50 bars
ATR Period: 14
Extension/Velocity Weights: 50/50
Asset Support:
Stocks/Forex: Uses Session VWAP (daily reset)
Crypto: Uses Rolling VWAP (50-bar window) - auto-detected
Edge Cases:
Returns `na` until 50 bars of history
Zero volume: Volume modifier defaults to 1.0 (neutral)
Credits and Acknowledgments
This library builds upon established technical analysis concepts:
VWAP - Industry standard volume-weighted price measure
ATR by J. Welles Wilder Jr. (1978) - Volatility normalization
Z-Score - Statistical normalization method
Volume analysis principles from Volume Spread Analysis (VSA) methodology
Disclaimer
This library is provided for **educational and informational purposes only**. It does not constitute financial advice. Past performance does not guarantee future results. The exhaustion readings are probabilistic indicators, not guarantees of price reversal. Always conduct your own research and use proper risk management when trading.

CCI [Hash Adaptive]Adaptive CCI Pro: Professional Technical Analysis Indicator
The Commodity Channel Index is a momentum oscillator developed by Donald Lambert in 1980. CCI measures the relationship between an asset's price and its statistical average, identifying cyclical turns and overbought/oversold conditions. The indicator oscillates around zero, with values above +100 indicating overbought conditions and values below -100 suggesting oversold conditions.
Standard CCI Formula: (Typical Price - Moving Average) / (0.015 × Mean Deviation)
This indicator transforms the traditional CCI into a sophisticated visual analysis tool through several key enhancements:
Implements dual exponential moving average smoothing to eliminate market noise
Preserves signal integrity while reducing false signals
Adaptive smoothing responds to market volatility conditions
Dynamic Color Visualization System
Continuous gradient transitions from red (bearish momentum) to green (bullish momentum)
Real-time color intensity reflects momentum strength
Eliminates discrete color jumps for fluid visual interpretation
Adaptive Intelligence Features
Dynamic overbought/oversold thresholds adapt to market conditions
Reduces false signals during high volatility periods
Maintains sensitivity during low volatility environments
Momentum Vector Analysis
Incorporates velocity calculations for early trend identification
Crossover detection with momentum confirmation
Advanced signal filtering reduces market noise
Extreme Level Analysis
Values above +100: Strong overbought conditions, potential reversal zones
Values below -100: Strong oversold conditions, potential buying opportunities
Zero-line crossovers: Momentum shift confirmation
Optimization Parameters
CCI Period (Default: 14)
Shorter periods (10-12): Increased sensitivity, more signals
Standard periods (14-20): Balanced responsiveness and reliability
Longer periods (21-30): Reduced noise, stronger signal confirmation
Smoothing Factor (Default: 5)
Lower values (1-3): Maximum responsiveness, suitable for scalping
Medium values (4-6): Balanced approach for swing trading
Higher values (7-10): Institutional-grade smoothness for position trading
Signal Sensitivity (Default: 6)
Conservative (7-10): High-probability signals, reduced frequency
Balanced (5-6): Optimal risk-reward ratio
Aggressive (1-4): Maximum signal generation, requires additional confirmation
Strategic Implementation
Oversold reversals in red zones with momentum confirmation
Zero-line breaks with sustained color transitions
Extreme readings followed by momentum divergence
Risk Management
Use extreme levels (+100/-100) for position sizing decisions
Monitor color intensity for momentum strength assessment
Combine with price action analysis for comprehensive market view
Market Context Application
Trending markets: Focus on momentum direction and extreme readings
Range-bound markets: Utilize overbought/oversold levels for mean reversion
Volatile markets: Increase smoothing parameters and signal sensitivity
Professional Advantages
Instantaneous momentum assessment through color visualization
Reduced cognitive load compared to traditional oscillators
Professional presentation suitable for client reporting
Adaptive Technology
Self-adjusting parameters reduce manual optimization requirements
Consistent performance across varying market conditions
Advanced mathematics eliminate common CCI limitations
The Adaptive CCI Pro represents the evolution of momentum analysis, combining Lambert's foundational CCI concept with modern computational techniques to deliver institutional-grade market intelligence through an intuitive visual interface.

Three-Bar Reversal/ContinuationThis indicator identifies a three-bar expansion pattern based on range and volume, designed to highlight moments when the market pushes strongly, pauses, and then resumes with confirmation.
Detection Logic
* Bar (two bars ago) must show sufficient strength, determined by the number of conditions met.
* Bar (one bar ago) must be neutral (strength = 0), marking a brief pause.
*Bar (current bar) must continue the expansion, with range and volume greater than the prior bar.
(Bar is used as a safeguard to prevent repeated detection during ongoing strong moves)
Strength Scoring
Each bar is scored 0–3 based on which of the following conditions it satisfies:
* Range exceeds a multiple of the recent average
* Volume exceeds a multiple of the recent average
* Range × volume exceeds a multiple of the recent average
The detection level input controls how many of these conditions must hold to classify a bar as “strong.” This allows tuning from permissive (1 condition) to strict (all 3 conditions).
Parameters & Utility
* length: Lookback period for moving averages of span, volume, and span×volume. Larger values smooth the averages, reducing false positives; smaller values increase sensitivity.
* coeff: Multiplicative threshold to define an unusually strong bar. Higher values reduce frequency but increase reliability.
* detectLevel: Minimum number of conditions that must be met for a bar to count as “strong.”
* showCont: Whether to allow continuation signals away from local extrema (if false, only reversals near highs/lows are considered).
* symbolUp / symbolDown: Customizable plotting symbols for bullish/bearish signals.
* showStrength: Plots tiny dots indicating the strength of each bar (1–3).
Rationale
This structure captures a recurring market motif: strong push → brief pause → renewed push, where the renewed activity is confirmed by both price expansion and volume. Using a combination of statistical thresholds (range, volume, range×volume) and price structure ensures that signals are both measurable and visually interpretable.
Usage Notes
* This setup allows traders to visually or systematically identify potential reversal or continuation points while controlling sensitivity to noise.
* Designed as a mechanical filter rather than a fully automated trading system. Signals highlight notable activity but do not dictate entry, exit, or risk management.
* Works best when combined with trend/context filters or higher-timeframe analysis.
* Adjust the parameters based on the volatility of the instrument and timeframe.

VRD-5: Volume Reversal Detector (5 Bars)Overview
This Pine Script indicator detects potential trend reversals based on volume patterns over a 5-bar period. It identifies accumulation (bullish) and distribution (bearish) patterns using volume analysis combined with price action.
Key Features
Volume Analysis:
Compares current volume to a 34-period SMA
Identifies strong/weak volume using configurable thresholds
Calculates volume "energy" as a 5-bar average ratio
Pattern Detection:
Bearish Signal: Looks for decreasing volume after a strong volume bar
Bullish Signal: Looks for increasing volume after weak volume bars
Visualization:
Colored volume histogram (bullish/bearish/neutral)
SMA volume line
Labels for detected signals
Customization Options:
Adjustable lookback period (3-10 bars)
Configurable thresholds for volume strength
Strict mode requiring confirming price action
Suggested Improvements
Performance Optimization:
Reduce the max_labels_count (currently 500) to improve performance
Consider using barstate.isconfirmed for more efficient calculations
Enhanced Visualization:
Add arrows on price chart for better visibility
Include a background color highlight for signal periods
Add option to display the energy level as a separate line
Additional Features:
Incorporate RSI or MACD for confirmation
Add multi-timeframe analysis capability
Include a strategy version for backtesting
Code Structure:
Separate the logic into distinct functions for better readability
Add more detailed comments for complex calculations
Consider using varip for real-time updates if needed
User Experience:
Add input options for label text size/position
Include sound options for alerts
Add a toggle for the information table
This indicator provides a solid foundation for volume-based reversal detection that could be further enhanced with these improvements while maintaining its core functionality.

SM Trap Detector – Liquidity Sweeps & Institutional ReversalsOverview:
This script is designed to help traders detect Smart Money traps, liquidity grabs, and false breakouts with high precision.
Inspired by institutional trading logic (SMC, ICT, Wyckoff), this tool combines:
🟦 Liquidity Zone Mapping – Detects stop hunt targets near highs/lows
🚨 Trap Candle Detection – Identifies fakeouts using wick + volume logic
✅ Reversal Confirmation – Entry signals based on real market structure
🧭 Dashboard Panel – Always see the last trap type, price, and confirmation
🔔 Real-Time Alerts – Stay notified of traps and entry points
🧠 Logic Breakdown:
Trap Candle = Large wick, small body, volume spike, and sweep of a liquidity zone
Confirmed Entry = Reversal price action following the trap (engulfing-style)
📈 Best Used On:
Markets: Crypto, Forex, Stocks
Timeframes: No limitation but works best on 1H, 4H, Daily
🛠 Suggested Use:
Trade only confirmed entries for best results
Place stops beyond wick highs/lows
Target previous structure or use RR-based exits
📊 Backtest Tip:
Use alerts + replay mode to manually validate past traps.
Note: Please backtest before using it for entry.

True Breakout Pattern [TradingFinder] Breakout Signal Indicator🔵 Introduction
In many market conditions, what initially appears to be a decisive breakout often turns out to be nothing more than a false breakout or fake breakout. Price breaks through a key swing level or an important support and resistance zone, only to quickly return to its previous range.
These failed breakouts, which are often the result of liquidity traps or market manipulation, serve more as a warning sign of structural weakness than confirmation of a new trend.
This indicator is designed around the concept of the fake breakout.
The logic is simple but precise : when price breaks a swing level and returns to that level within a maximum of five candles, the move is considered a false breakout. At this point, a Fibonacci retracement is applied to the recent price swing to evaluate the pullback area.
If price, within ten candles after the return to the breakout level, enters the Fibonacci zone between 0.618 and 1.0, the setup becomes valid for a potential entry. This area is identified as a long entry zone, with the stop loss placed just beyond the 1.0 level and the take profit defined based on the desired risk-to-reward ratio.
By combining accurate detection of false breakouts, analysis of price reaction to swing levels, and alignment with Fibonacci retracement logic, this framework allows traders to identify opportunities often missed by others. In a market where failed breakouts are a common and recurring phenomenon, this indicator aims to transform these traps into measurable trading opportunities.
Long Setup :
Short Setup :
🔵 How to Use
This indicator operates based on the recognition of false breakouts from structural levels in the market, specifically swing levels, and combines that with Fibonacci retracement analysis.
In this strategy, trades are only considered when price returns to the broken level within a defined time window and reacts appropriately inside a predefined Fibonacci range. Depending on the direction of the initial breakout, the system outlines two scenarios for long and short setups.
🟣 Long Setup
In the long setup, price initially breaks below a support level or swing low. If the price returns to the broken level within a maximum of five candles, the move is identified as a fake breakout.
At this stage, a Fibonacci retracement is drawn from the recent high to the low. If price, within ten candles of returning to the level, moves into the 0.618 to 1.0 Fibonacci zone, the conditions for a long entry are met.
The stop loss is placed slightly below the 1.0 level, while the take profit is set based on the trader’s preferred risk-reward ratio. This setup aims to capture deeply discounted entries at low risk, aligned with smart money reversals.
🟣 Short Setup
In the short setup, the price breaks above a resistance level or swing high. If the price returns to that level within five candles, the move is again treated as a false breakout. Fibonacci is then drawn from the recent low to the high to observe the retracement area.
Should price enter the 0.618 to 1.0 Fibonacci range within ten candles of returning, a short entry is considered valid. In this case, the stop loss is placed just above the 1.0 level, and the take profit is adjusted based on the intended risk-reward target. This method allows traders to identify high-probability short setups by focusing on failed breakouts and deep pullbacks.
🔵 Settings
🟣 Logical settings
Swing period : You can set the swing detection period.
Valid After Trigger Bars : Limits how many candles after a fake breakout the entry zone remains valid.
Max Swing Back Method : It is in two modes "All" and "Custom". If it is in "All" mode, it will check all swings, and if it is in "Custom" mode, it will check the swings to the extent you determine.
Max Swing Back : You can set the number of swings that will go back for checking.
🟣 Display settings
Displaying or not displaying swings and setting the color of labels and lines.
🟣 Alert Settings
Alert False Breakout : Enables alerts for Breakout.
Message Frequency : Determines the frequency of alerts. Options include 'All' (every function call), 'Once Per Bar' (first call within the bar), and 'Once Per Bar Close' (final script execution of the real-time bar). Default is 'Once per Bar'.
Show Alert Time by Time Zone : Configures the time zone for alert messages. Default is 'UTC'.
🔵 Conclusion
A sound understanding of the false breakout phenomenon and its relationship to structural price behavior is essential for technical traders aiming to improve precision and consistency. Many poor trading decisions stem from misinterpreting failed breakouts and entering too early into weak signals.
A structured approach, grounded in the analysis of swing levels and validated through specific price action and timing rules, can turn these misleading moves into valuable trade opportunities.
This indicator, by combining fake breakout detection with time filters and Fibonacci-based retracement zones, helps traders only engage with the market when multiple confirming factors are in alignment. The result is a strategy that emphasizes probability, risk control, and clarity in decision-making, offering a solid edge in navigating today’s volatile markets.

Momentum Trail Oscillator [AlgoAlpha]🟠 OVERVIEW
This script builds a Momentum Trail Oscillator designed to measure directional momentum strength and dynamically track shifts in trend bias using a combination of smoothed price change calculations and adaptive trailing bands. The oscillator aims to help traders visualize when momentum is expanding or contracting and to identify transitions between bullish and bearish conditions.
🟠 CONCEPTS
The core idea combines two methods. First, the script calculates a normalized momentum measure by smoothing price changes relative to their absolute values, which creates a bounded oscillator that highlights whether moves are directional or choppy. Second, it uses a trailing band mechanism inspired by volatility stops, where bands adapt to the oscillator’s volatility, adjusting the thresholds that define a shift in directional bias. This dual approach seeks to address both the magnitude and persistence of momentum, reducing false signals in ranging markets.
🟠 FEATURES
The momentum calculation applies Hull Moving Averages and double EMA smoothing to price changes, producing a smooth, responsive oscillator.
The trailing bands are derived by offsetting a weighted moving average of the oscillator by a multiple of recent momentum volatility. A directional state variable tracks whether the oscillator is above or below the bands, updating when the momentum crosses these dynamic thresholds.
Overbought and oversold zones are visually marked between fixed levels (+30/+40 and -30/-40), with color fills to highlight when momentum is in extreme areas. The script plots signals on both the oscillator pane and optionally overlays markers on the main price chart for clarity.
🟠 USAGE
To use the indicator, apply it to any symbol and timeframe. The “Oscillator Length” controls how sensitive the momentum line is to recent price changes—lower values react faster, higher values smooth out noise. The “Trail Multiplier” sets how far the adaptive bands sit from the oscillator mid-line, which affects how often trend state changes occur. When the momentum line rises into the upper filled area and then crosses back below +40, it signals potential overbought exhaustion. The opposite applies for the oversold zone below -40. The plotted trailing bands switch visibility depending on the current directional state: when momentum is trending up, the lower band acts as the active trailing stop, and when trending down, the upper band becomes active. Trend changes are marked with circular symbols when the direction variable flips, and optional overlay arrows appear on the price chart to highlight overbought or oversold reversals. Traders can combine these signals with their own price action or volume analysis to confirm entries or exits.

HA Reversal StrategyCertainly! Here's a detailed **description (elaboration)** for the **"HA Candle Test"** (i.e., the Heikin Ashi strategy script I just gave you):
---
### 📌 **Script Name**: HA Candle Test
### 📖 **Description**:
This script visualizes **Heikin Ashi candles** and identifies **trend reversal signals** using classic momentum candle behavior — particularly the appearance of **no-wick candles**, which are known to reflect strong directional pressure in Heikin Ashi charts.
It aims to **capture high-probability trend reversals** with minimal noise, relying on the natural smoothing behavior of Heikin Ashi candles.
---
### ✅ **Buy Signal Conditions**:
* At least **two consecutive red Heikin Ashi candles** (indicating a short-term downtrend).
* Followed by a **green Heikin Ashi candle** that has **no lower wick** (i.e., open == low).
* This suggests that **buyers have taken full control**, with no push from sellers — a potential start of an uptrend.
📍 **Interpreted as**: “Market was selling off, but now buyers stepped in strongly — time to consider buying.”
---
### ✅ **Sell Signal Conditions**:
* At least **two consecutive green Heikin Ashi candles** (short-term uptrend).
* Followed by a **red Heikin Ashi candle** that has **no upper wick** (i.e., open == high).
* This implies **sellers are dominating**, with no attempt from buyers to push higher — possible start of a downtrend.
📍 **Interpreted as**: “Market was rallying, but sellers just took over decisively — time to consider selling.”
---
### 📊 **Visual Aids Included**:
* Plots **Heikin Ashi candles** on your main chart for clarity.
* Uses **Buy** and **Sell** label markers (green & red) at signal points.
* Compatible with any timeframe — higher timeframes typically yield stronger signals.
---
### 💡 **Suggested Use**:
* Combine with **support/resistance**, **volume**, or **trend filters** for more robust setups.
* Works well on **1H, 4H, and Daily charts** in trending markets.
* Can be used manually or turned into an automated strategy for backtesting or alerts.
---
Would you like this script packaged as a **strategy()** for backtesting, or would you like me to add **alerts** so you can get notified in real-time when signals appear?

BB Vicinity Reversal SignalsThis indicator detects potential intraday reversal opportunities based on price action near the outer edges of Bollinger Bands (±2.7 std dev). Unlike traditional Bollinger Band signals that require strict band touches or crossings, this tool identifies reversals that occur in the vicinity of the outer bands, increasing signal frequency while maintaining logical precision.
✅ Key Features:
Buy Signal: Triggered when a bullish candle with a strong body forms near the lower Bollinger Band.
Sell Signal: Triggered when a bearish candle with a strong body forms near the upper Bollinger Band.
Vicinity logic: User-adjustable % range from the outer bands (default: 20%) to define how close price must be.
Body-to-candle ratio filter: Ensures that only meaningful directional candles trigger signals.
No repainting: All signals are generated in real-time based on confirmed candle closes.
Built-in alerts: Receive instant notifications for buy and sell setups.
This tool is ideal for traders looking to capture high-probability mean-reversion trades without being overly restrictive. It works well on intraday timeframes like 5m, 15m, and 1h.

Trend Classifier [ChartPrime]Trend Classifier
This is a multi-level trend classification tool that detects bullish, bearish, and ranging conditions using an adaptive smoothing method. It highlights trend strength through color-coded candles and layered bands, making it easy to interpret market momentum visually.
⯁ KEY FEATURES
Classifies trend strength using 3 bullish and 3 bearish levels relative to an adaptive trend line.
Neutral (range) zones are marked when price stays between key bands, often signaling low volatility or consolidation.
Automatically filters band visibility based on current trend direction:
In uptrends, only levels below the price are displayed.
In downtrends, only levels above the price are shown.
Color-coded candles:
Aqua candles for bullish conditions.
Red candles for bearish conditions.
Orange candles during neutral or ranging conditions.
Includes a trend direction change marker (diamond), plotted when a shift in trend is detected.
Plots a central smoothed trend line to anchor the trend bands dynamically.
Displays a trend strength dashboard in the top-right corner with real-time bull and bear scores (0 to 3).
Labels with arrows (▲/▼) show current trend direction and strength on the chart.
⯁ HOW TO USE
Use bull and bear levels (1–3) to assess the momentum of the current trend.
When bull = 0 and bear = 0 , market is considered ranging or consolidating – consider fading or waiting for breakout confirmation.
Trend bands can be used as dynamic support/resistance during trending phases.
Monitor the trend change diamonds to spot potential early reversals.
Combine with volume or oscillator tools for confirmation of strength shifts.
⯁ CONCLUSION
Trend Classifier helps traders stay aligned with the dominant trend while visually breaking down market momentum into levels. Its clean color-coded design and strength dashboard make it ideal for both trend following and range trading strategies.

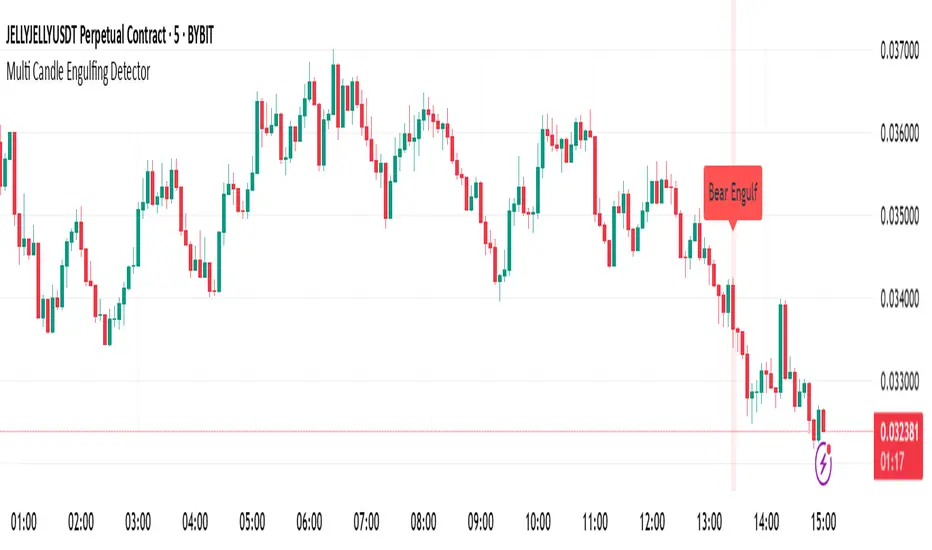
Multi Candle Engulfing Detector🔍 Multi Candle Engulfing Detector
This indicator identifies powerful engulfing candles that consume three or more previous candles — a signal often tied to strong market reversals or continuation moves.
🧠 Features
Detects candles that fully engulf the previous 3 or more candles
Optional filtering: only trigger when the engulfed candles are of the opposite color
Customizable engulf count for greater pattern control
Clear bullish and bearish signal labels on the chart
Alerts integrated: get notified the moment a setup forms
Background highlighting for enhanced visibility
⚙️ Settings
Minimum Number of Candles to Engulf: Default is 3, but can be adjusted
Require Opposite Color: When enabled, the engulfing candle must be opposite in color to the engulfed ones (e.g., green engulfing red)
📈 Use Cases
Spot strong reversal signals at tops and bottoms
Confirm breakout momentum on trend continuation
Use in confluence with other tools like volume or support/resistance
🚨 Alerts
Alerts fire when a bullish or bearish engulfing pattern is detected, allowing for mobile, email, or webhook notifications.
✅ Notes
This script is fully customizable and can be extended into a strategy or scanning tool. Feedback and suggestions are always welcome!
Smarter Money Concepts - OBs [PhenLabs]📊 Smarter Money Concepts - OBs
Version: PineScript™ v6
📌 Description
Smarter Money Concepts - OBs (Order Blocks) is an advanced technical analysis tool designed to identify and visualize institutional order zones on your charts. Order blocks represent significant areas of liquidity where smart money has entered positions before major moves. By tracking these zones, traders can anticipate potential reversals, continuations, and key reaction points in price action.
This indicator incorporates volume filtering technology to identify only the most significant order blocks, eliminating low-quality signals and focusing on areas where institutional participation is likely present. The combination of price structure analysis and volume confirmation provides traders with high-probability zones that may attract future price action for tests, rejections, or breakouts.
🚀 Points of Innovation
Volume-Filtered Block Detection : Identifies only order blocks formed with significant volume, focusing on areas with institutional participation
Advanced Break of Structure Logic : Uses sophisticated price action analysis to detect legitimate market structure breaks preceding order blocks
Dynamic Block Management : Intelligently tracks, extends, and removes order blocks based on price interaction and time-based expiration
Structure Recognition System : Employs technical analysis algorithms to find significant swing points for accurate order block identification
Dual Directional Tracking : Simultaneously monitors both bullish and bearish order blocks for comprehensive market structure analysis
🔧 Core Components
Order Block Detection : Identifies institutional entry zones by analyzing price action before significant breaks of structure, capturing where smart money has likely positioned before moves.
Volume Filtering Algorithm : Calculates relative volume compared to a moving average to qualify only order blocks formed with significant market participation, eliminating noise.
Structure Break Recognition : Uses price action analysis to detect legitimate breaks of market structure, ensuring order blocks are identified only at significant market turning points.
Dynamic Block Management : Continuously monitors price interaction with existing blocks, extending, maintaining, or removing them based on current market behavior.
🔥 Key Features
Volume-Based Filtering : Filter out insignificant blocks by requiring a minimum volume threshold, focusing only on zones with likely institutional activity
Visual Block Highlighting : Color-coded boxes clearly mark bullish and bearish order blocks with customizable appearance
Flexible Mitigation Options : Choose between “Wick” or “Close” methods for determining when a block has been tested or mitigated
Scan Range Adjustment : Customize how far back the indicator looks for structure points to adapt to different market conditions and timeframes
Break Source Selection : Configure which price component (close, open, high, low) is used to determine structure breaks for precise block identification
🎨 Visualization
Bullish Order Blocks : Blue-colored rectangles highlighting zones where bullish institutional orders were likely placed before upward moves, representing potential support areas.
Bearish Order Blocks : Red-colored rectangles highlighting zones where bearish institutional orders were likely placed before downward moves, representing potential resistance areas.
Block Extension : Order blocks extend to the right of the chart, providing clear visualization of these significant zones as price continues to develop.
📖 Usage Guidelines
Order Block Settings
Scan Range : Default: 25. Defines how many bars the indicator scans to determine significant structure points for order block identification.
Bull Break Price Source : Default: Close. Determines which price component is used to detect bullish breaks of structure.
Bear Break Price Source : Default: Close. Determines which price component is used to detect bearish breaks of structure.
Visual Settings
Bullish Blocks Color : Default: Blue with 85% transparency. Controls the appearance of bullish order blocks.
Bearish Blocks Color : Default: Red with 85% transparency. Controls the appearance of bearish order blocks.
General Options
Block Mitigation Method : Default: Wick, Options: Wick, Close. Determines how block mitigation is calculated - “Wick” uses high/low values while “Close” uses close values for more conservative mitigation criteria.
Remove Filled Blocks : Default: Disabled. When enabled, order blocks are removed once they’ve been mitigated by price action.
Volume Filter
Volume Filter Enabled : Default: Enabled. When activated, only shows order blocks formed with significant volume relative to recent average.
Volume SMA Period : Default: 15, Range: 1-50. Number of periods used to calculate the average volume baseline.
Min. Volume Ratio : Default: 1.5, Range: 0.5-10.0. Minimum volume ratio compared to average required to display an order block; higher values filter out more blocks.
✅ Best Use Cases
Identifying high-probability support and resistance zones for trade entries and exits
Finding optimal stop-loss placement behind significant order blocks
Detecting potential reversal areas where price may react after extended moves
Confirming breakout trades when price clears major order blocks
Building a comprehensive market structure map for medium to long-term trading decisions
Pinpointing areas where smart money may have positioned before major market moves
⚠️ Limitations
Most effective on higher timeframes (1H and above) where institutional activity is more clearly defined
Can generate multiple signals in choppy market conditions, requiring additional filtering
Volume filtering relies on accurate volume data, which may be less reliable for some securities
Recent market structure changes may invalidate older order blocks not yet automatically removed
Block identification is based on historical price action and may not predict future behavior with certainty
💡 What Makes This Unique
Volume Intelligence : Unlike basic order block indicators, this script incorporates volume analysis to identify only the most significant institutional zones, focusing on quality over quantity.
Structural Precision : Uses sophisticated break of structure algorithms to identify true market turning points, going beyond simple price pattern recognition.
Dynamic Block Management : Implements automatic block tracking, extension, and cleanup to maintain a clean and relevant chart display without manual intervention.
Institutional Focus : Designed specifically to highlight areas where smart money has likely positioned, helping retail traders align with institutional perspectives rather than retail noise.
🔬 How It Works
1. Structure Identification Process :
The indicator continuously scans price action to identify significant swing points and structure levels within the specified range, establishing a foundation for order block recognition.
2. Break Detection :
When price breaks an established structure level (crossing below a significant low for bearish breaks or above a significant high for bullish breaks), the indicator marks this as a potential zone for order block formation.
3. Volume Qualification :
For each potential order block, the algorithm calculates the relative volume compared to the configured period average. Only blocks formed with volume exceeding the minimum ratio threshold are displayed.
4. Block Creation and Management :
Valid order blocks are created, tracked, and managed as price continues to develop. Blocks extend to the right of the chart until they are either mitigated by price action or expire after the designated timeframe.
5. Continuous Monitoring :
The indicator constantly evaluates price interaction with existing blocks, determining when blocks have been tested, mitigated, or invalidated, and updates the visual representation accordingly.
💡 Note:
Order Blocks represent areas where institutional traders have likely established positions and may defend these zones during future price visits. For optimal results, use this indicator in conjunction with other confluent factors such as key support/resistance levels, trendlines, or additional confirmation indicators. The most reliable signals typically occur on higher timeframes where institutional activity is most prominent. Start with the default settings and adjust parameters gradually to match your specific trading instrument and style.
