First FVG Custom Time RangeFirst FVG — Opening Range Fair Value Gap Detector
Smart Money Opening Imbalance Strategy Tool
This script automatically detects and highlights the first Fair Value Gap (FVG) that forms between 9:30 and 10:00 AM Eastern Time (New York session open) — a critical period often referred to as the Opening Range. It’s designed for Smart Money traders looking to isolate early-morning inefficiencies that may influence market behavior throughout the trading day.
🔍 What This Script Does:
Automatically Detects the First FVG in the Opening Range
Scans price action between 9:30 and 10:00 AM ET and identifies the first valid bullish or bearish FVG that forms.
Only one FVG is shown per day — ensuring a clean, focused view.
Draws a Visual Zone
Once detected, the FVG zone is extended forward on the chart (customizable duration).
A labeled zone helps users track how price reacts to it throughout the session.
Optional Retest Alerts
Alerts you when price re-enters the zone — a potential reaction point used by SMC traders.
Customization Options
Set your preferred session time window
Adjust zone duration (in bars)
Customize label font size, colors, and visibility
Enable/disable alert on retest
📈 Why the First FVG Matters:
Time-Sensitive Setup: The first FVG typically forms no earlier than 9:31 AM ET and represents a potential “time distortion” or imbalance zone created by aggressive market participants during the open.
Behavioral Study: Many traders journal how price behaves around this zone each day — whether it acts as support, resistance, or gets traded through later in the session.
Predictive Value: Observing how this zone is respected or broken can provide anticipatory insight into intraday price action, rather than reactive analysis.
Great for New Traders: This opening FVG is often recommended as a starting reference point for building trade models and understanding how institutional imbalances unfold.
🚀 What Makes It Unique:
This tool doesn’t spam your chart with every FVG. It laser-focuses on a single, time-bound zone backed by institutional logic — the first presented imbalance of the day during the opening range.
Use it to:
Monitor price behavior around early inefficiencies
Plan journal entries and pattern recognition
Align intraday setups with a high-probability SMC model
Whether you’re scalping, journaling market structure, or refining entries based on liquidity behavior — this script helps you make the first 30 minutes count.
"retest" için komut dosyalarını ara

cd_full_poi_CxOverview
This indicator tracks the price in 16 different time frames (optional) in order to answer the question of where the current price has reacted or will react.
It appears on the chart and in the report table when the price approaches or touches the fvg or mitigations (order block / supply-demand), the rules of which will be explained below.
In summary, it follows the fvg and mitigations in the higher timeframe than the lower timeframe.
Many traders see fvg or mitigates as an point of interest and see the high, low swept in those zones as a trading opportunity. Key levels, Session high/lows and Equal high and lows also point of interest.
If we summarise the description of the point of interest ;
1- Fair value gaps (FVG) (16 time frames)
2- Mitigation zones (16 time frames)
3- Previous week, day, H4, H1 high and low levels
4- Sessions zones (Asia, London and New York)
5- Equal high and low levels are in indicator display.
Details:
1- Fair Value Gaps : It is simply described as a price gap and consists of a series of 3 candles. The reaction of the price to the gap between the 1st and 3rd candle wicks is observed.
The indicator offers 3 options for marking. These are :
1-1- ‘Colours are unimportant’: candle colours are not considered for marking. Fvg formation is sufficient.(Classical)
1-2- ‘First candle opposite colour’ : when a price gap occurs, the first candle of a series of 3 candles must be opposite.
For bullish fvg : bearish - bullish - free
For Bearish fvg : bullish - bearish - free
1-3- ‘All same colour’ : all candles in a series of 3 candles must be the same direction.
For bullish fvg: bullish - bullish - bullish
For bearish fvg : bearish - bearish – bearish
Examples:
2- Mitigation zones: Opposite candles with a fvg in front of them or candles higher/lower than the previous and next candle and with the same colour as the fvg series are marked.
Examples :
3- Previous week, day, H4, H1 high and low levels
4- Sessions regions (Asia, London and New York)
5- Equal high and low levels:
Annotation: Many traders want to see a liquidity grab on the poi, then try to enter the trade with the appropriate method.
Among the indicators, there is also the indication of grabs/swepts that occur at swing points. It is also indicated when the area previously marked as equal high/low is violated (grab).
At the end, sample setups will be shown to give an idea about the use of the indicator.
Settings:
- The options to be displayed from the menu are selected by ticking.
- 1m, 2m, 3m, 5m, 5m, 10m, 15m, 30m, h1, h4, h4, h6, h8, h12, daily, weekly, monthly and quarterly, 16 time zones in total can be displayed.
- The ‘Collapse when the price touches mitigate’ tab controls whether to collapse the box as the price moves into the inner region of the mitigate. If not selected, the size of the mitigate does not change.
- ‘Approach limit =(ATR / n)’ tab controls how close the price is to the fvg or mitigate. Instant ATR(10) value is calculated by dividing by the entered ‘n’ value.
- All boxes and lines are automatically removed from the screen when the beyond is closed.
- Colour selections, table, text features are controlled from the menu.
- Sessions hours are set as standard hours, the user can select special time zones. Timezone is set to GMT-4.
- On the candle when the price touches fvg or mitigate, the timeframe information of the POI is shown in the report table together with the graphical representation.
The benefits and differences :
1- We can evaluate the factors we use for setup together.
2- We are aware of what awaits us in the high time frame in the following candles.
3- It offers the user the opportunity to be selective with different candle selection options in fvg selection.
4- Mitige areas are actually unmitige areas because they have a price gap in front of them. The market likes to retest these areas.
5- Equal high/low zones are the levels that the price creates to accumulate liquidity or fails to go beyond (especially during high volume hours). Failure or crossing of the level may give a reversal or continuation prediction.
Sample setup 1:
Sample setup 2:
Sample setup 3:
Cheerful trades…
Enjoy…

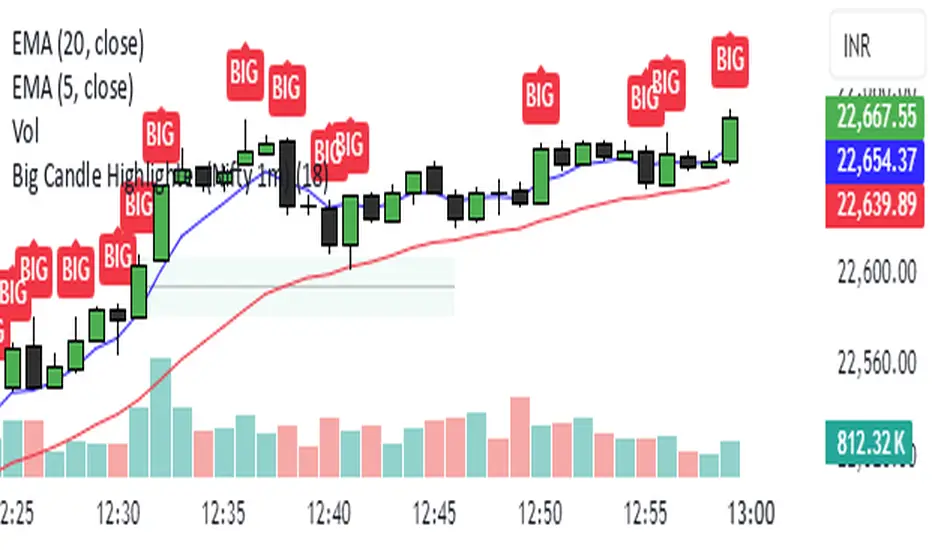
Big Candle Highlighter (Nifty 1m)This indicator will help option buyers to avoid taking trade in impulsive candles.
For Example :
Normal 1m candle: ~10–15 pts
Big candle (possible liquidity/impulse): >18 pts
Very large / avoid chasing: >25 pts
If you see a candle that breaks structure with a 25-30 point range and closes strong, it’s often:
A liquidity sweep
A news spike
Or the start of an impulsive leg — in which case entering at close can be risky without a retest
HILO Interpolation | QuantEdgeB🚀 Introducing HILO Interpolation by QuantEdgeB
🛠️ Overview
HILO Interpolation is a dynamic price-action based signal engine crafted to adapt across trending and ranging conditions. By leveraging percentile-based price band interpolation, it identifies high-confidence breakout and breakdown zones. This indicator is designed to serve both as a momentum trigger in trend phases and as a price-reactive entry system during range-bound consolidation.
By intelligently switching between percentile thresholds and interpolated logic, HILO minimizes noise and whipsaws commonly seen in traditional crossover systems.
✨ Key Features
🔹 Percentile Interpolation Engine
Tracks price breakouts using percentile thresholds, making it adaptable to volatility and asset-specific structure.
🔹 Price-Based Signal Confirmation
Signals are only triggered when price meaningfully crosses through key percentile thresholds (based on historical high/low logic).
🔹 Visual Trend Encoding
Color-coded candles, dynamic interpolation bands, and optional long/cash labels give clear visual cues for trend and trade direction.
🔹 Dynamic Threshold Switching
Interpolated threshold flips based on where price sits relative to percentile bands—providing adaptive long/short logic.
📊 How It Works
1️⃣ Percentile Zone Definition
HILO defines two key percentiles from the historical high and low:
• Upper Threshold: 75th Percentile of Highs
• Lower Threshold: 50th Percentile of Lows
These are calculated using linear interpolation to ensure smoother transitions across lookback periods.
2️⃣ Adaptive Signal Line
Instead of using static crossovers, HILO dynamically flips its signal based on whether price exceeds the upper threshold or falls below the lower one.
📌 If price > upper → Signal = Short threshold
📌 If price < lower → Signal = Long threshold
📌 If price remains between thresholds → no flip (trend continuation)
3️⃣ Signal Logic
✅ Long Signal → Price exceeds upper bound while lower bound acts as ceiling
❌ Short Signal → Price breaks below lower percentile while upper bound flips
This simple yet powerful mechanism creates early entries while maintaining high signal confidence.
👁 Visual & Custom Features
• 🎨 Multiple Color Modes: Strategy, Solar, Warm, Cool, Classic, Magic
• 🔄 Dynamic Candle & Band Coloring
• 🏷️ Signal Labels: Optional “𝓛𝓸𝓷𝓰” and “𝓢𝓱𝓸𝓻𝓽” tags when trend flips
• 💬 Alerts Ready: Long/Short crossover conditions can trigger alerts instantly
👥 Who Should Use HILO?
✅ Breakout Traders – Catch early trend starts using percentile filters
✅ Swing Traders – Identify directional bias shifts in advance
✅ Range Strategists – Use band confluence zones to play reversions
✅ Quant & Rule-Based Traders – Incorporate percentile logic into broader systems
⚙️ Customization & Default Settings
Percentile Length:(Default 35) Lookback for calculating percentile thresholds
Lookback Period:(Default 4) Lag factor for interpolation responsiveness
Upper % Threshold: (Default 75) Defines breakout zone from historical highs
Lower % Threshold: (Default 50) Defines retest/accumulation zone from historical lows
📌 How to Use HILO in Trading
1️⃣ Trend-Following Strategy
✔ Enter long when price flips above the adaptive support line
✔ Exit or go short when price breaks below the interpolated resistance
✔ Continue position as long as trend color persists
2️⃣ Range-Reversion Strategy
✔ Buy when price tests the lower threshold and no short signal is triggered
✔ Sell or reduce when price hits the upper range boundary
🧠 Why It Works
HILO operates on the principle that historical price structure creates natural probabilistic thresholds. By interpolating between these using percentile logic, the system maintains adaptability to changing market conditions—without the lag of moving averages or the noise of fixed bands.
🔹 Conclusion
HILO Interpolation is a minimalist yet powerful signal engine built for adaptive breakout and reversion detection. Its percentile-based logic offers a novel way to identify structure shifts, giving traders an edge in both trend and range markets.
🔹 Key Takeaways:
1️⃣ Breakout Entry Logic – Uses percentile interpolation instead of static bands
2️⃣ Color-Driven Clarity – Visual clarity via gradient zone overlays
3️⃣ Trend Integrity – Avoids overfitting and responds only to significant price movements
📌 Disclaimer: Past performance is not indicative of future results. No trading strategy can guarantee success in financial markets.
📌 Strategic Advice: Always backtest, optimize, and align parameters with your trading objectives and risk tolerance before live trading.

Auto TrendLines [TradingFinder] Support Resistance Signal Alerts🔵 Introduction
The trendline is one of the most essential tools in technical analysis, widely used in financial markets such as Forex, cryptocurrency, and stocks. A trendline is a straight line that connects swing highs or swing lows and visually indicates the market’s trend direction.
Traders use trendlines to identify price structure, the strength of buyers and sellers, dynamic support and resistance zones, and optimal entry and exit points.
In technical analysis, trendlines are typically classified into three categories: uptrend lines (drawn by connecting higher lows), downtrend lines (formed by connecting lower highs), and sideways trends (moving horizontally). A valid trendline usually requires at least three confirmed touchpoints to be considered reliable for trading decisions.
Trendlines can serve as the foundation for a variety of trading strategies, such as the trendline bounce strategy, valid breakout setups, and confluence-based analysis with other tools like candlestick patterns, divergences, moving averages, and Fibonacci levels.
Additionally, trendlines are categorized into internal and external, and further into major and minor levels, each serving unique roles in market structure analysis.
🔵 How to Use
Trendlines are a key component in technical analysis, used to identify market direction, define dynamic support and resistance zones, highlight strategic entry and exit points, and manage risk. For a trendline to be reliable, it must be drawn based on structural principles—not by simply connecting two arbitrary points.
🟣 Selecting Pivot Types Based on Trend Direction
The first step is to determine the market trend: uptrend, downtrend, or sideways.
Then, choose pivot points that match the trend type :
In an uptrend, trendlines are drawn by connecting low pivots, especially higher lows.
In a downtrend, trendlines are formed by connecting high pivots, specifically lower highs.
It is crucial to connect pivots of the same type and structure to ensure the trendline is valid and analytically sound.
🟣 Pivot Classification
This indicator automatically classifies pivot points into two categories :
Major Pivots :
MLL : Major Lower Low
MHL : Major Higher Low
MHH : Major Higher High
MLH : Major Lower High
These define the primary structure of the market and are typically used in broader structural analysis.
Minor Pivots :
mLL: minor Lower Low
mHL: minor Higher Low
mHH: minor Higher High
mLH: minor Lower High
These are used for drawing more precise trendlines within corrective waves or internal price movements.
Example : In a downtrend, drawing a trendline from an MHH to an mHH creates structural inconsistency and introduces noise. Instead, connect points like MHL to MHL or mLH to mLH for a valid trendline.
🟣 Drawing High-Precision Trendlines
To ensure a reliable trendline :
Use pivots of the same classification (Major with Major or Minor with Minor).
Ensure at least three valid contact points (three touches = structural confirmation).
Draw through candles with the least deviation (choose wicks or bodies based on confluence).
Preferably draw from right to left for better alignment with current market behavior.
Use parallel lines to turn a single trendline into a trendline zone, if needed.
🟣 Using Trendlines for Trade Entries
Bounce Entry: When price approaches the trendline and shows signs of reversal (e.g., a reversal candle, divergence, or support/resistance), enter in the direction of the trend with a logical stop-loss.
Breakout Entry: When price breaks through the trendline with strong momentum and a confirmation (such as a retest or break of structure), consider trading in the direction of the breakout.
🟣 Trendline-Based Risk Management
For bounce entries, the stop-loss is placed below the trendline or the last pivot low (in an uptrend).
For breakout entries, the stop-loss is set behind the breakout candle or the last structural level.
A broken trendline can also act as an exit signal from a trade.
🟣 Combining Trendlines with Other Tools (Confluence)
Trendlines gain much more strength when used alongside other analytical tools :
Horizontal support and resistance levels
Moving averages (such as EMA 50 or EMA 200)
Fibonacci retracement zones
Candlestick patterns (e.g., Engulfing, Pin Bar)
RSI or MACD divergences
Market structure breaks (BoS / ChoCH)
🔵 Settings
Pivot Period : This defines how sensitive the pivot detection is. A higher number means the algorithm will identify more significant pivot points, resulting in longer-term trendlines.
Alerts
Alert :
Enable or disable the entire alert system
Set a custom alert name
Choose how often alerts trigger (every time, once per bar, or on bar close)
Select the time zone for alert timestamps (e.g., UTC)
Each trendline type supports two alert types :
Break Alert : Triggered when price breaks the trendline
React Alert : Triggered when price reacts or bounces off the trendline
These alerts can be independently enabled or disabled for all trendline categories (Major/Minor, Internal/External, Up/Down).
Display :
For each of the eight trendline types, you can control :
Whether to show or hide the line
Whether to delete the previous line when a new one is drawn
Color, line style (solid, dashed, dotted), extension direction (e.g., right only), and width
Major lines are typically thicker and more opaque, while minor lines appear thinner and more transparent.
All settings are designed to give the user full control over the appearance, behavior, and alert system of the indicator, without requiring manual drawing or adjustments.
🔵 Conclusion
A trendline is more than just a line on the chart—it is a structural, strategic, and flexible tool in technical analysis that can serve as the foundation for understanding price behavior and making trading decisions. Whether in trending markets or during corrections, trendlines help traders identify market direction, key zones, and high-potential entry and exit points with precision.
The accuracy and effectiveness of a trendline depend on using structurally valid pivot points and adhering to proper market logic, rather than relying on guesswork or personal bias.
This indicator is built to solve that exact problem. It automatically detects and draws multiple types of trendlines based on actual price structure, separating them into Major/Minor and Internal/External categories, and respecting professional analytical principles such as pivot type, trend direction, and structural location.

Supply & Demand Zones + Order Block (Pro Fusion) SuroLevel up your trading edge with this all-in-one Supply and Demand Zones + Order Block TradingView indicator, built for precision traders who focus on price action and smart money concepts.
🔍 Key Features:
Automatic detection of Supply & Demand Zones based on refined swing highs and lows
Dynamic Order Block recognition with customizable thresholds
Highlights Breakout signals with volume confirmation and trend filters
Built-in EMA 50 trend detection
Take Profit (TP1, TP2, TP3) projection levels
Clean visual labels for Demand, Supply, and OB zones
Uses smart box plotting with long extended zones for better zone visibility
🔥 Ideal for:
Traders who follow Smart Money Concepts (SMC)
Supply & Demand strategy practitioners
Breakout & Retest pattern traders
Scalpers, swing, and intraday traders using Order Flow logic
📈 Works on all markets: Forex, Crypto, Stocks, Indices
📊 Recommended timeframes: M15, H1, H4, Daily
✅ Enhance your trading strategy using this powerful zone-based script — bringing structure, clarity, and automation to your chart.
#SupplyAndDemand #OrderBlock #TradingViewScript #SmartMoney #BreakoutStrategy #TPProjection #ForexIndicator #SMC

ThinkTech AI SignalsThink Tech AI Strategy
The Think Tech AI Strategy provides a structured approach to trading by integrating liquidity-based entries, ATR volatility thresholds, and dynamic risk management. This strategy generates buy and sell signals while automatically calculating take profit and stop loss levels, boasting a 64% win rate based on historical data.
Usage
The strategy can be used to identify key breakout and retest opportunities. Liquidity-based zones act as potential accumulation and distribution areas and may serve as future support or resistance levels. Buy and sell zones are identified using liquidity zones and ATR-based filters. Risk management is built-in, automatically calculating take profit and stop loss levels using ATR multipliers. Volume and trend filtering options help confirm directional bias using a 50 EMA and RSI filter. The strategy also allows for session-based trading, limiting trades to key market hours for higher probability setups.
Settings
The risk/reward ratio can be adjusted to define the desired stop loss and take profit calculations. The ATR length and threshold determine ATR-based breakout conditions for dynamic entries. Liquidity period settings allow for customized analysis of price structure for support and resistance zones. Additional trend and RSI filters can be enabled to refine trade signals based on moving averages and momentum conditions. A session filter is included to restrict trade signals to specific market hours.
Style
The strategy includes options to display liquidity lines, showing key support and resistance areas. The first 15-minute candle breakout zones can also be visualized to highlight critical market structure points. A win/loss statistics table is included to track trade performance directly on the chart.
This strategy is intended for descriptive analysis and should be used alongside other confluence factors. Optimize your trading process with Think Tech AI today!

Support and Resistance LevelsSupport and Resistance Levels with Breaks – Amin & Taufik
The Support and Resistance Levels with Breaks indicator is designed to automatically detect support and resistance levels based on pivots (high and low points within a given period). It also highlights breakouts of these levels, confirmed by increased volume for additional validation.
Key Features:
✅ Automatic Support & Resistance Detection
Uses pivothigh and pivotlow to identify key support and resistance levels.
Red lines indicate resistance, while blue lines represent support.
✅ Breakout Confirmation with Volume
The indicator generates breakout signals when price breaks support or resistance with high volume.
A downside breakout is marked with a red "B" label above the candlestick.
An upside breakout is marked with a green "B" label below the candlestick.
✅ Bullish & Bearish Wick Detection (Rejections)
Additional signals for long wicks (candlestick shadows) indicating possible price reversals.
Bullish Wick (rejection at support) is marked with a green label.
Bearish Wick (rejection at resistance) is marked with a red label.
✅ Automatic Breakout Alerts
The indicator can send automatic notifications when support or resistance is broken with high volume.
How to Use:
1️⃣ Adjust the Left Bars and Right Bars parameters to fine-tune pivot sensitivity for detecting support & resistance.
2️⃣ Enable the Show Breaks option to see breakout confirmations with high volume.
3️⃣ Use this indicator alongside price action analysis and other indicators to confirm trade decisions.
🚀 Ideal for:
✔️ Scalping & Intraday Trading
✔️ Swing Trading & Trend Following
✔️ Breakout & Retest Confirmation
ℹ️ Note:
This indicator does not provide direct buy or sell signals. It is recommended to use it alongside other technical analysis tools, such as candlestick patterns, moving averages, and RSI, for more accurate decision-making.
📌 Developed by: Amin & Taufik
🔗 License: Attribution-NonCommercial-ShareAlike 4.0 (CC BY-NC-SA 4.0)
💬 If you find this indicator useful, don’t forget to like and comment on TradingView! 🚀

Hidden Order BlockThe Crystal Order Block Indicator is designed to help traders identify institutional order blocks with precision and reliability. By analyzing price action and volume behavior, this tool highlights high-probability zones where smart money has likely placed orders.
🔹 Key Features:
✅ Automated Order Block Detection – Identifies valid bullish & bearish order blocks based on price structure and volume dynamics.
✅ Unmitigated Order Block Filtering – Highlights fresh order blocks that haven’t been tapped, helping traders find high-probability trade setups.
✅ Smart Money Concepts (SMC) & ICT-Based Logic – Uses institutional trading principles to refine entry and exit points.
✅ Multi-Timeframe Compatibility – Works effectively on all timeframes, making it suitable for scalping, intraday, and swing trading.
✅ Customizable Alerts – Stay notified when a new order block forms, ensuring you never miss an opportunity.
✅ Risk Management Enhancement – Helps traders set precise stop-loss and take-profit levels based on institutional trading zones.
📌 How It Works:
The indicator scans price movements and detects areas where significant buying or selling pressure occurred, forming institutional order blocks. It then checks for mitigated vs. unmitigated order blocks, ensuring only the most relevant zones are displayed.
✔️ Bullish Order Blocks: Marked when a strong buying zone is detected, often acting as support.
✔️ Bearish Order Blocks: Identified in areas of strong selling pressure, often acting as resistance.
The indicator is optimized for Smart Money trading strategies, making it a valuable tool for traders who follow ICT, SMC, and VSA concepts.
🎯 How to Use It Effectively:
🔹 Entry Strategy: Wait for price to retest a fresh order block and confirm entry with additional confluences (e.g., volume spikes, price action signals).
🔹 Exit Strategy: Use order blocks as take-profit targets or stop-loss levels, improving risk-reward ratios.
🔹 Timeframe Recommendation: Best results on M30 and higher, but can be used on lower timeframes with additional confirmations.
🚀 What’s New in the Updated Version?
🔹 More Accurate Order Block Detection – Improved filtering for better precision.
🔹 Mitigation Tracking – Helps traders focus on fresh order blocks for higher success rates.
🔹 Better Visualization – Enhanced clarity for quick decision-making.
This indicator is a must-have for traders who want to trade like institutions and refine their trading strategy using smart money concepts.
FVG Reversal Sentinel🔵 FVG Reversal Sentinel – Multi-Timeframe Fair Value Gap Indicator
The FVG Reversal Sentinel is a powerful TradingView indicator designed to help traders identify and track Fair Value Gaps (FVGs) across multiple timeframes, all within a single chart.
This tool allows you to select up to five separate timeframes, ensuring you never miss key market shifts, whether you are scalping, day trading, or swing trading. You can use this indicator in any asset (Cryptos, Futures, Indices, Forex Pairs, etc.).
🔵 - Key Features -
Multi-Timeframe FVG Tracking – Select and display up to five different timeframes on one chart, providing a comprehensive view of market structure.
Customizable Colors – Adjust bullish and bearish FVG colors to match your chart theme for a seamless trading experience.
Enhanced Market Context – Quickly identify key liquidity zones and refine your entries and exits with precision.
Hide the lower timeframes FVGs to get a clear view in a custom timeframe.
Show or hide mitigated FVGs to declutter the chart.
FVGs boxes are going to be displayed only when the candle bar closes
FVGs are going to be mitigated only when the body of the candle closes above or below the FVG area.
No repainting
Whether you're looking to fine-tune your entries or gain a broader market perspective, the FVG Reversal Sentinel indicator ensures you have the tools to stay ahead of price action and capitalize on market inefficiencies.
🔵 - Customization-
You can change the indicator settings as you see fit to achieve the best results for your use case.
TIMEFRAMES
This indicator provides the ability to select up to 5 timeframes. These timeframes are based on the trader's timeframes including any custom timeframes.
Select the desired timeframe from the options list.
Add the label text you would like to show for the selected timeframe.
Check or uncheck the box to display or hide the timeframe from your chart.
FVG SETTINGS
Length of boxes: allows you to select the length of the box that is going to be displayed for the FVGs.
Delete boxes after fill?: allows you to show or hide mitigated FVGs on your chart.
Hide FVGs lower than enabled timeframes?: allows you to show or hide lower timeframe FVGs on your chart. Example - You are in a 15 minutes timeframe chart, if you choose to hide lower timeframe FVGs you will not be able to see 5 minutes FVG defined in your Timeframes Settings, only 15 minutes or higher timeframe FVGs will be displayed on your chart.
BOX VISUALS
Bullish FVG box color: the color and opacity of the box for the bullish FVGs.
Bearish FVG box color: the color and opacity of the box for the bearish FVGs.
LABELS VISUALS
Bullish FVG labels color: the color for bullish labels.
Bearish FVG labels color: the color for bearish labels.
Labels size: the size of the text displayed in the labels.
Labels position: the position of the label inside the FVGs boxes (right, left or center).
BORDER VISUALS
Border width: the width of the border (the thickness).
Bullish FVG border color: the color and the opacity of the bullish box border.
Bearish FVG border color: the color and the opacity of the bearish box border.
🔵 - How to use the indicator -
Just add the indicator in your chart and click in the settings option to customize it.
Make sure you select the desired timeframes and set the colors and opacity for the FVGs boxes.
This indicator can be used in many trading strategies, such as:
SILVER BULLET
iFVG
iFVG RETEST
These strategies are based on the use of FVGs, this tool can help you analyze the market and make the right decision.
🔵 - How was the indicator designed? -
I have spent a lot of time testing other open source indicators from the community. All of these indicators do a great job, but they have a problem, they not only mitigate FVGs when a candle closes above or below the FVG, they also mitigate FVGs when the candle closes exactly to the tick (not above or below the FVG). This is a problem for many strategies that rely on FVGs mitigation.
What makes this indicator different is that it focuses on just mitigating imbalances at the right time for these strategies.
I have taken ideas and some pieces of code from many community indicator developers, such as:
@twingall
@tflab
@marktools
@nacho-fx
@pmk07
... and many other people, to whom I thank for their valuable work and have allowed me to create this tool by making modifications to their source code.
🔵 - Disclaimer -
This tool is intended solely for informational and educational purposes and should not be regarded as financial, investment, or trading advice. It's not designed to predict market movements or offer specific recommendations. Users should be aware that past performance is not indicative of future results and should not rely on any indicator for financial decisions.

Unicorn Setup Detector (aziz abid)Look for the formation of a higher high followed by a lower low. Bearish unicorn model begins with the market forming a higher high. Subsequently, the market makes a lower low by breaking the previous bullish structure. It signals an early shift in direction.
Second most important thing is to look for bearish breaker block and bearish fair value gap. The overlap between the breaker block and FVG creates a zone of confluence. This is known as bearish unicorn zone. There is a possibility that price is likely to react when retraces to the area.
Final step is to look for retest and confirmation. Price retraces to the overlapped area and confirm its validity as resistance. The successful retest of the area strengthens the bearish unicorn setup. The model offers high-probabilities trade entries.
for abetter entries try to use the entries during london or new york killzones

Advanced 1-Minute Open Range Breakout IndicatorThis indicator is designed for the market on a 1-minute chart. It calculates the open range based on the first 5 minutes after the market open (09:30 – 09:35) and plots the high and low of this period as the daily resistance and support levels respectively. Additionally, the indicator displays the previous day’s high and low as blue horizontal lines, providing extra reference levels.
Trade signals are generated only during the active trading session (09:35 – 16:00). The advanced trade logic works as follows:
• For long entries:
- When the price first breaks above the open range high, the indicator enters a “breakout” state.
- If the price then retraces to (or below) the open range high, it moves to a “retest” state.
- Finally, if the price breaks above the open range high again, a long signal is issued.
• For short entries:
- When the price first breaks below the open range low, the indicator enters a “breakdown” state.
- If the price then retraces to (or above) the open range low, it moves to a “retest” state.
- Finally, if the price breaks below the open range low again, a short signal is issued.
All signals and the open range lines are only displayed during the trading session (09:35 to 16:00).
Use this indicator to help identify high-probability breakout setups in the early part of the trading day.

Enhanced Retail vs Institutional ActivityThis script highlights market activity in real-time, making it easier to infer the type of market participants driving price and volume changes.
Here’s a list of what the script analyzes:
Volume:
Current volume of the candle.
Moving average of volume over a specified number of periods.
Volume spikes: Current volume compared to a threshold multiple of the moving average.
Price Movement:
Percentage change in price between the current and previous candle.
Identifies significant price changes based on a user-defined threshold.
Institutional Activity:
High volume spikes combined with significant price movements.
Retail Activity:
Periods without volume spikes or significant price changes.
VWAP (Volume-Weighted Average Price):
The average traded price over a specified lookback period, weighted by volume, used as a benchmark.
Market Context Visualization:
Background colors to differentiate institutional (red) and retail (green) activity.
Overlays for:
-Volume bars.
-Average volume line.
-VWAP line.
In summary:
Red = Institutional activity: High volume + significant price change.
Green = Retail activity: Low volume or insignificant price change.
---------------------------------------------------------------------------------------------------------------------
Analysis Explanation:
I’m forecasting that Bitcoin will retest its November 12th low (~$85,098.75) around January 20th, 2025, where the horizontal support line intersects with the downtrend line. This conclusion is based on the following:
Trend Analysis:
The chart shows a clear downtrend with price respecting the descending trendline.
The intersection of the horizontal support and the downtrend line on January 20th indicates a confluence point where price action may gravitate.
Volume and Activity Insights:
Using the Retail vs Institutional Activity indicator, the chart highlights periods dominated by institutional (red background) or retail (green background) activity.
Current price action is in a green zone, suggesting predominantly retail participation with lower volume and insignificant price movements.
Retail vs Institutional Dynamics:
Institutional activity (red zones) aligns with significant price movements and volume spikes, often marking key turning points or trends.
The recent green retail-dominated periods suggest a lack of strong momentum, which may lead to continued price decline until institutions re-enter around the confluence area.
Volume Observations:
Volume remains relatively low during the current retail phase, indicating weak buying pressure.
A potential surge in institutional activity (red zones) near the support level could trigger a rebound or breakdown.
I expect Bitcoin’s price to drop further and test the November 12th low near $85,098.75 on January 20th, 2025. This projection is supported by the convergence of the downtrend line and horizontal support, low retail-driven volume, and historical institutional activity patterns observed using the "Retail vs Institutional Activity" indicator.

Order blocksHi all!
This indicator will show you found order blocks that can be used as supply or demand. It's my take on trying to create good order blocks and I hope it makes sense.
First off I suggest to verify the current trend before using an order block. This can be done in a variety of ways, one way could be to use my other script "Market structure" () which I use and suggest.
You can configure the indicator to behave differently depending on settings. These are the settings available:
• The order blocks created can be found in any higher timeframe defined in "Timeframe"
• The number of active order blocks are defined in "Count". If an order block is found the earliest order block will be replaced
• You can choose the type of order blocks that are found ("Bullish", "Bearish " or "Both") in "Type"
• The old order blocks can be kept if "Keep history" is checked
• Order blocks that are found are not removed when mitigated (entered) but when a new one appears. They can be removed when they are broken by price if "Remove broken zones" are checked
There is also a setting section called "Requirements" that defines what is required for an order block to be created. These are the settings:
• "Take out"
Check this if you want the base of the order block (the candle where the zone is drawn from (high and low)) to have to take out the previous candle (be higher or lower depending if the order block is bullish or bearish).
• "Consecutive rising/falling"
Each following candle in the reaction (the 3 reaction candles) needs to reach higher or lower (depending on bullish or bearish). Check this if you want that to be true.
• "Reaction"
Some sort of reaction is needed from the 3 candles creating the order block. This reaction is based on the value of the Average True Length (ATR) of length 14. You can here define a factor of the value from the ATR that these 3 candles needs to move in price. A higher need for a reaction (higher factor of the ATR) will create lesser zones. You can also choose to show this limit with the checkbox.
• "Fair Value Gap"
The reaction needs to create a gap (imbalance) in price. This gap is known as a "Fair Value Gap" and is created when the last candle's wick does not meet with the base candle's wick. Check this if you want this to be needed.
After these settings you can also choose the colors of the created zones. The ones that are active (called "Zones"), the ones that are replaced ("Replaced zones") and the ones that are broken ("Broken zones") (if this is enabled in "Remove broken zones").
I'm using my library "Touched" to be able to show you labels when the order blocks have a retest, false breakout and breakout. These labels can be hidden if you disable the labels under the style tab in the indicator settings.
The concept of order blocks is widely used among traders and can provide you with good supply or demand zones. I hope that this indicator makes sense.
My todo-list has a few things, but top of that list is adding alerts for zone interactions or creations. Please feel free to say what you want to be coded!
The order blocks in the publication chart are found in weekly timeframe but are shown on the daily timeframe. Other than that the image shows you zones from the default settings (which are based on the daily timeframe).
Best of luck trading!
Moving Average Pullback Signals [UAlgo]The "Moving Average Pullback Signals " indicator is designed to identify potential trend continuation or reversal points based on moving average (MA) pullback patterns. This tool combines multiple types of moving averages, customized trend validation parameters, and candlestick wick patterns to provide reliable buy and sell signals. By leveraging several advanced MA methods (such as TEMA, DEMA, ZLSMA, and McGinley-D), this script can adapt to different market conditions, providing traders with flexibility and more precise trend-based entries and exits. The addition of a gradient color-coded moving average line and wick validation logic enables traders to visualize market sentiment and trend strength dynamically.
🔶 Key Features
Multiple Moving Average (MA) Calculation Methods: This indicator offers various MA calculation types, including SMA, EMA, DEMA, TEMA, ZLSMA, and McGinley-D, allowing traders to select the MA that best fits their strategy.
Trend Validation and Pattern Recognition: The indicator includes a customizable trend validation length, ensuring that the trend is consistent before buy/sell signals are generated. The "Trend Pattern Mode" setting provides flexibility between "No Trend in Progress," "Trend Continuation," and "Both," tailoring signals to the trader’s preferred style.
Wick Validation Logic: To enhance the accuracy of entries, this indicator identifies specific wick patterns for bullish or bearish pullbacks, which signal potential trend continuation or reversal. Wick length and validation factor are adjustable to suit various market conditions and timeframes.
Gradient Color-coded MA Line: This feature provides a quick visual cue for trend strength, with color changes reflecting relative highs and lows of the MA, enhancing market sentiment interpretation.
Alerts for Buy and Sell Signals: Alerts are triggered when either a bullish or bearish pullback is detected, allowing traders to receive instant notifications without continuously monitoring the chart.
Visual Labels for Reversal Points: The indicator plots labels ("R") at potential reversal points, with color-coded labels for bullish (green) and bearish (red) pullbacks, highlighting pullback opportunities that align with the trend or reversal potential.
🔶 Disclaimer
Use with Caution: This indicator is provided for educational and informational purposes only and should not be considered as financial advice. Users should exercise caution and perform their own analysis before making trading decisions based on the indicator's signals.
Not Financial Advice: The information provided by this indicator does not constitute financial advice, and the creator (UAlgo) shall not be held responsible for any trading losses incurred as a result of using this indicator.
Backtesting Recommended: Traders are encouraged to backtest the indicator thoroughly on historical data before using it in live trading to assess its performance and suitability for their trading strategies.
Risk Management: Trading involves inherent risks, and users should implement proper risk management strategies, including but not limited to stop-loss orders and position sizing, to mitigate potential losses.
No Guarantees: The accuracy and reliability of the indicator's signals cannot be guaranteed, as they are based on historical price data and past performance may not be indicative of future results.

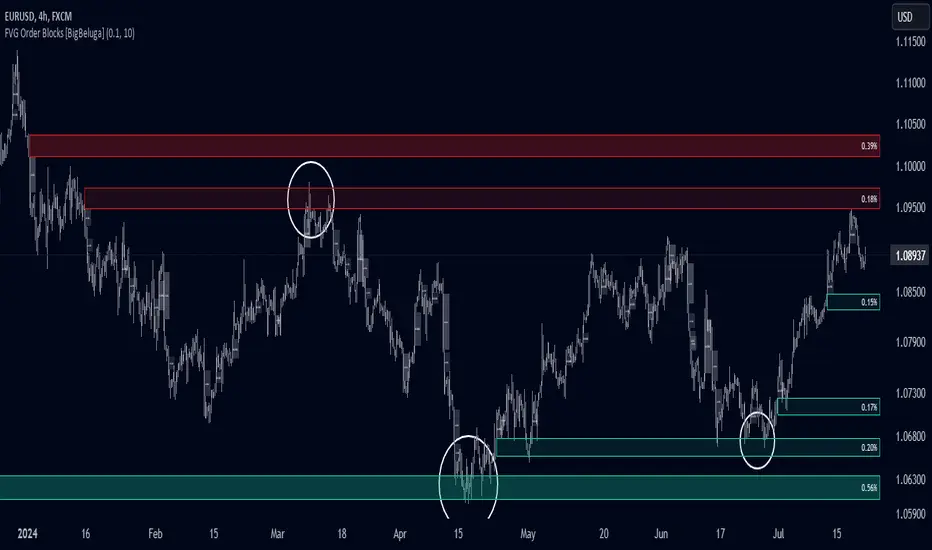
FVG Order Blocks [BigBeluga]This indicator is an advanced tool designed to detect and visualize market FVGs with order blocks, where the price action has created gaps due to strong buying or selling pressure. These FVG often act as critical support and resistance levels, giving traders strategic points for potential entries and exits. The indicator not only identifies these imbalances but also displays their relative strength by size %, helping traders prioritize order blocks that are more likely to hold or break.
The indicator works on various pairs and stocks, it also works on charts that do not provide volume data
Forex (JPY/USD):
Stocks (NVDA):
🔵 KEY FEATURES & USAGE
● FVGs Detection and Visualization:
The indicator detects bullish and bearish FVGs. Bullish FVG occur when there is significant buying, and order block is plotted below the FVG zone:
Conversely, bearish FVG are plotted with an order block above the zone, indicating potential resistance.
Traders can use these order blocks to anticipate price reactions when the market revisits these areas, making them ideal for setting up trades.
● FVG Filtering:
The indicator includes a FVG % filter that allows traders to only display strong order blocks. This ensures that only significant FVG order blocks are shown, reducing noise and focusing on the most impactful areas.
● Highlighting Broken Levels:
When an imbalance level is broken—either breached by price action or no longer relevant—the indicator can either delete the level or mark it with a gray color areas. This provides a clear visual cue that the level has been compromised, allowing traders to adjust their strategies accordingly.
● Order Blocks Signals:
When price retest the blocks, indicator display potential sell or buy signals. Which can be an opportunity for trades
🔵 CUSTOMIZATION
● FVG Filter:
Adjust the strength filter to control which FVGs are displayed based on their percentage size. This filter helps in focusing only on significant blocks that are likely to impact price action.
● Order Blocks Amount Displayed:
Set the maximum number of Order Blocks to be displayed on the chart. This customization helps keep the chart clean and ensures that only the most important blocks are in view.
● Broken Order Blocks Display:
Choose whether to display order blocks that have been broken by the price. This feature helps in maintaining a focus on blocks that are still valid while filtering out those that are no longer relevant.
● Color Customization:
You can customize the colors for bullish and bearish Order Blocks to match your chart's overall color scheme. Additionally, strength bars can be color-coded based on their percentage to quickly identify high-priority order blocks.
Traders who are confident in the settings of the indicator can confidently use it on various types of markets
DTFX Algo Zones [LuxAlgo]DTFX Algo Zones are auto-generated Fibonacci Retracements based on market structure shifts.
These retracement levels are intended to be used as support and resistance levels to look for price to bounce off of to confirm direction.
🔶 USAGE
Due to the retracement levels only being generated from identified market structure shifts, the retracements are confined to only draw from areas considered more important due to the technical Break of Structure (BOS) or Change of Character (CHoCH).
The simple action that causes a market structure shift occurs is price breaking above or below a specific swing point. When a market structure shift happens, a retracement is drawn from the point of break to the highest or lowest point since that point. Due to the price action necessary for a market structure shift, these retracements will not always be immediately actionable.
These retracement levels are intended to be used as points to watch for price to retrace to and bounce from, confirming the current direction of price.
In the example below, after the retracement is initiated, by bouncing off of the retracement levels formed from the previous market structure shift it would further confirm the bias of the market structure shift. A break going through these levels would display a weakness from the current market structure shift, implying that it could simply be noise.
🔶 DETAILS
The script uses standard SMC Market structure identification to determine Break of Structures (BOS) and Change of Characters (CHoCH). The specific swing points can be identified by the shapes placed above or below the specific swing high/low candle.
By unchecking the "Display All Zones" setting, users are able to specify the exact number of retracement zones to display using the "Show Last" parameter. This is handy for cleaning up the chart to stay focused on the most recent retracements.
Additionally, when displaying multiple zones, the "Clean-Up Level Overlap" setting may be helpful for decluttering as well. This option optimizes the display of retracement levels to minimize their overlap on other adjacent zones.
The script allows for up to 5 Fib levels to be displayed from each zone, with options for display, value, line style, and color for each of the 5.
The calculation for Fib Levels changes depending on the direction of market structure shifts. When an upwards (Bullish) zone is generated, the retracement is drawn with the bottom of the zone being 0 and the top of the zone being 1. This is reversed for downwards (Bearish) zones.
🔶 SETTINGS
Structure Length: Sets the SMC structure length to use for finding MMS.
Show Last: Displays this number of retracement zones. (Display All Zones Must be Unchecked)
Display All Zones: Ignores "Show Last" number and displays all historical MMS Retracement Zones.
Zone Display: Choose which zones to display, only bearish, only bullish, or both.
Clean-Up Level Overlap: Minimizes overlap between adjacent zones and levels.
Fib Levels: Settings to display and customize up to 5 Fib levels for each zone.

ICT Market Structure Screener (Zeiierman)█ Overview
The ICT Market Structure Screener (Zeiierman) is designed to identify and display key market structure levels and patterns based on Smart Money Concepts. It highlights bullish and bearish structures, premium and discount levels, and generates alerts for significant market structure changes, making it a valuable tool for traders looking to understand institutional trading behaviors and market trends. A key feature of this indicator is its screener function, which allows traders to monitor multiple symbols simultaneously. This feature provides a consolidated view of the market structure for various assets, making it easier to identify trading opportunities across a diverse portfolio.
█ How It Works
The ICT Market Structure Screener operates by identifying high and low pivot points within a specified period, then analyzing these pivots to determine changes in market structure. The indicator tracks price movements and categorizes them into bullish or bearish structures, indicating potential trend reversals or continuations. By plotting premium and discount levels, it helps traders identify overbought and oversold conditions. The indicator also provides real-time updates and alerts for significant changes in the market structure.
█ Terminology
ChoCH (Change of Character): Indicates a potential reversal in market direction. It is identified when the price breaks a significant high or low, suggesting a shift from a bullish to bearish trend or vice versa.
SMS (Smart Money Shift): Represents the transition phase in market structure where smart money begins accumulating or distributing assets. It typically follows a BMS and indicates the start of a new trend.
BMS (Bullish/Bearish Market Structure): Confirms the trend direction. Bullish Market Structure (BMS) confirms an uptrend, while Bearish Market Structure (BMS) confirms a downtrend. It is characterized by a series of higher highs and higher lows (bullish) or lower highs and lower lows (bearish).
Premium: A zone where the price is considered overbought. It is calculated as the upper range of the current market structure and indicates a potential area for selling or shorting.
Mid Range: The midpoint between the high and low of the market structure. It often acts as a support or resistance level, helping traders identify potential reversal or continuation points.
Discount: A zone where the price is considered oversold. It is calculated as the lower range of the current market structure and indicates a potential area for buying or going long.
█ How to Use
The ICT Market Structure Screener allows traders to follow smart money moves in the market more effectively. By identifying key market levels and monitoring bullish and bearish structures, traders can easily spot trend changes and strong trends. The indicator's premium and discount levels help identify overbought and oversold conditions, providing valuable entry and exit points. Alerts for ChoCH, SMS, and BMS keep traders informed about significant market changes, enabling real-time adjustments to trading strategies.
The screener functionality is particularly valuable for monitoring multiple markets simultaneously. The screener table displays critical information such as current price, trend direction, signal type, and premium/discount levels for each symbol. This makes it easier to track the market structure of various assets at a glance and quickly identify trading opportunities across different markets.
Example Strategies:
⚪ Trend Following: Use the indicator to identify the current market trend (bullish or bearish) and trade in the direction of the trend. Enter trades on pullbacks to premium (for shorts) or discount (for longs) levels.
⚪ Reversal Trading: Look for ChoCH signals to identify potential trend reversals. Enter trades when the price breaks a significant high or low and confirms a change in market structure, or wait for a retest of the nearest Orderblock that was formed.
⚪ Support and Resistance: Utilize the mid-range, premium, and discount levels as support and resistance zones. Enter trades when the price approaches these levels and shows signs of reversal or continuation.
⚪ Multi-Symbol Analysis: Use the screener table to monitor multiple symbols and quickly assess their market structure. This helps in diversifying trading opportunities and managing a portfolio of assets efficiently.
█ Settings
Period: The pivot period for calculating the structure. Increasing the period captures broader trends, making the structure more representative of long-term movements. Decreasing the period focuses on shorter-term trends, increasing sensitivity.
Response: Enabling this option uses the response period instead of the pivot period, providing more flexibility in capturing short-term or long-term structures. The period for the response, which determines the structure's sensitivity. Increasing the response period smoothens the structure, making it less reactive to short-term fluctuations. Decreasing the response period makes the structure more responsive to short-term changes.
Structure Display: Choose between displaying the active range or the previous range. 'Active Range' shows real-time premium, discount, and mid-range levels based on the current structure. 'Previous Range' displays past ranges, useful for analyzing historical support/resistance levels.
Ticker Symbols: List of symbols to include in the screener. Enabling the option includes the symbol in the screener, allowing the user to track its structure. Disabling it excludes the symbol from the screener, reducing the number of tracked symbols.
-----------------
Disclaimer
The information contained in my Scripts/Indicators/Ideas/Algos/Systems does not constitute financial advice or a solicitation to buy or sell any securities of any type. I will not accept liability for any loss or damage, including without limitation any loss of profit, which may arise directly or indirectly from the use of or reliance on such information.
All investments involve risk, and the past performance of a security, industry, sector, market, financial product, trading strategy, backtest, or individual's trading does not guarantee future results or returns. Investors are fully responsible for any investment decisions they make. Such decisions should be based solely on an evaluation of their financial circumstances, investment objectives, risk tolerance, and liquidity needs.
My Scripts/Indicators/Ideas/Algos/Systems are only for educational purposes!

Inversion Fair Value Gaps [TradingFinder] IFVG ICT Signal| Alert🔵 Introduction
🟣 Inversion Fair Value Gap (IFVG)
An ICT Inversion Fair Value Gap, or reverse FVG, occurs when a fair value gap fails to hold its price, resulting in the price moving beyond and breaking the gap. This situation marks the initial change in price momentum.
Generally, prices respect fair value gaps and continue in their trend direction. However, when a fair value gap is breached, it transforms into an inversion fair value gap, signaling a potential short-term reversal or a subsequent change in direction.
🔵 How to Use
🟣 Identifying an Inversion Fair Value Gap
To spot an IFVG, you must first identify a fair value gap.
Inversion fair value gaps can be categorized into two types :
🟣 Bullish Inversion Fair Value Gap
A bullish IFVG occurs when a bearish fair value gap is invalidated by the price closing above it.
Steps to identify it :
Identify a bearish fair value gap.
When the price closes above this gap, it becomes a bullish inversion fair value gap.
This gap acts as a support level, pushing the price upwards and indicating a shift in momentum from sellers to buyers.
🟣 Bearish Inversion Fair Value Gap
A bearish IFVG happens when a bullish fair value gap fails, with the price closing below it.
Steps to identify it :
Identify a bullish fair value gap.
When the price closes below this gap, it becomes a bearish inversion fair value gap.
This gap acts as a resistance level, pushing the price downwards and indicating a shift in momentum from buyers to sellers.
🔵 Settings
🟣 Global Settings
Show All Inversion FVG: If disabled, only the most recent FVG will be displayed.
IFVG Validity Period (Bar): Determines the maximum duration (in number of candles) that the FVG and IFVG remain valid.Switching Colors Theme Mode: Includes three modes: "Off", "Light", and "Dark". "Light" mode adjusts colors for light mode use, "Dark" mode adjusts colors for dark mode use, and "Off" disables color adjustments.
🟣 Logic Settings
FVG Filter : This refines the number of identified FVG areas based on a specified algorithm to focus on higher quality signals and reduce noise.
Types of FVG filters :
Very Aggressive Filter : Adds a condition where, for an upward FVG, the last candle's highest price must exceed the middle candle's highest price, and for a downward FVG, the last candle's lowest price must be lower than the middle candle's lowest price. This minimally filters out FVGs.
Aggressive Filte r: Builds on the Very Aggressive mode by ensuring the middle candle is not too small, filtering out more FVGs.
Defensive Filter : Adds criteria regarding the size and structure of the middle candle, requiring it to have a substantial body and specific polarity conditions, filtering out a significant number of FVGs.
Very Defensive Filter : Further refines filtering by ensuring the first and third candles are not small-bodied doji candles, retaining only the highest quality signals.
Mitigation Level FVG and IFVG : Options include "Proximal", "Distal", or "50 % OB" modes, which you can choose based on your needs. The "50 % OB" line is the midpoint between distal and proximal.
🟣 Display Settings
Show Bullish IFVG : Toggles the display of demand-related boxes.
Show Bearish IFVG : Toggles the display of supply-related boxes.
🟣 Alert Settings
Alert Inversion FVG Mitigation : Enables alerts for Inversion FVG mitigation.
Message Frequency : Determines the frequency of alerts. Options include 'All' (every function call), 'Once Per Bar' (first call within the bar), and 'Once Per Bar Close' (final script execution of the real-time bar). Default is 'Once per Bar'.
Show Alert Time by Time Zone : Configures the time zone for alert messages. Default is 'UTC'.
Display More Info : Provides additional details in alert messages, including price range, date, hour, and minute. Set to 'Off' to exclude this information.

Support and Resistance (High Volume Boxes) [ChartPrime]Support and Resistance (High Volume Boxes)
◆ Overview:
The "Support and Resistance" indicator identifies key support and resistance levels using pivot points and volume analysis. It visually represents these levels with dynamically colored boxes, indicating the strength of the volume. This helps traders recognize potential price reversals and key zones for buy and sell opportunities.
◆ Key Features:
Dynamic Support and Resistance Boxes:
The indicator plots support and resistance boxes based on pivot points and volume above threshold for positive volume boxes and below lower threshold for negative volume boxes.
Box colors change from transparent to more intense based on volume, reflecting the strength of support or resistance.
Boxes expands until a new box of the same type appears.
Volume-Based Color Coding:
Boxes are color-coded based on the amount of volume:
Green boxes indicate support levels with positive volume.
Red boxes indicate resistance levels with negative volume.
Hold Signals:
Green diamonds (◆) indicate when support holds, signaling potential buy opportunities.
Red diamonds (◆) indicate when resistance holds, signaling potential sell opportunities.
Breakout Labels:
If the price falls below a support level, that level will become resistance. If the price rises above a resistance level, it will often become support. As the price moves past a level of support or resistance, it is thought that supply and demand has shifted, causing the breached level to reverse its role.
Labels "Break Sup" and "Break Res" are displayed when support or resistance levels are broken, indicating significant market movements.
◆ Break Resistance:
◆Break Support:
◆ Usage Notes:
This indicator helps traders identify strong support and resistance levels, offering visual cues for potential price reversals.
By analyzing volume at these levels, traders can gauge the strength of these zones and make more informed trading decisions.
◆ Settings:
Lookback Period: The number of bars to look back for pivot points.
Delta Volume Filter Length: The length of the volume filter for more accurate volume analysis. (Higher input, will filter low volume boxes)
Adjust Box Width: Adjusts the width of the support and resistance boxes.
This indicator is designed to enhance your trading by providing clear visual cues for support and resistance levels based on volume, making it easier to spot potential price reversals and key trading opportunities.

Advanced Stochastic [CryptoSea]The Advanced Stochastic Indicator is a sophisticated tool designed to enhance market analysis through detailed stochastic calculations. This tool is built for traders who seek to identify market divergences and pivot points with higher accuracy.
Key Features
Multi-Layer Stochastic Analysis: Tracks both standard and smoothed stochastic values to provide a granular view of market momentum.
Divergence Detection: Automatically detects both regular and hidden bullish and bearish divergences, offering critical insights into potential market reversals.
Adaptive Oscillator Display: Features customizable display options for the stochastic oscillator, allowing traders to view data in Default, Histogram, or Both modes.
Customizable Lookback Periods: Users can set specific lookback periods for divergence analysis and stochastic calculations, tailoring the tool to fit various trading strategies.
In the example below, there is a bearish divergence above 0. You would first want the stoch to break below the 0 level as a show of strength, this would be an aggressive entry, a higher probability option would be to wait for the stoch to retest and reject from 0 which is what we have a few candles later.
How it Works
Stochastic Calculation: Computes the stochastic oscillator by smoothing the %K line over a user-defined period, then applying a second smoothing for the %D line.
Pivot Point Analysis: Utilizes advanced algorithms to find low and high pivot points based on the oscillator values, crucial for spotting trend reversals.
Colour-Coded Divergence Alerts: Utilizes color codes to highlight divergence signals directly on the chart, aiding in quick visual analysis.
Responsive Threshold Settings: Includes options to adjust the sensitivity of divergence detection, ensuring that only significant divergences are highlighted.
In the example below, we have 2 divergence signals. The first a bullish one which fails to break above 0. The second signal is given above 0 so you would want a retest and a show of strength when the stoch returns to 0 but it fails to hold. Both of these divergence signals are invalidated.
Application
Strategic Decision-Making: Assists traders in making informed decisions by providing detailed analysis of stochastic movements and divergence.
Trend Confirmation: Reinforces trading strategies by confirming potential reversals with pivot point detection and divergence analysis.
Customized Analysis: Adapts to various trading styles with extensive input settings that control the display and sensitivity of oscillator data.
The Advanced Stochastic Indicator by is an invaluable addition to a trader's toolkit, offering depth and precision in market trend analysis to navigate complex market conditions effectively.

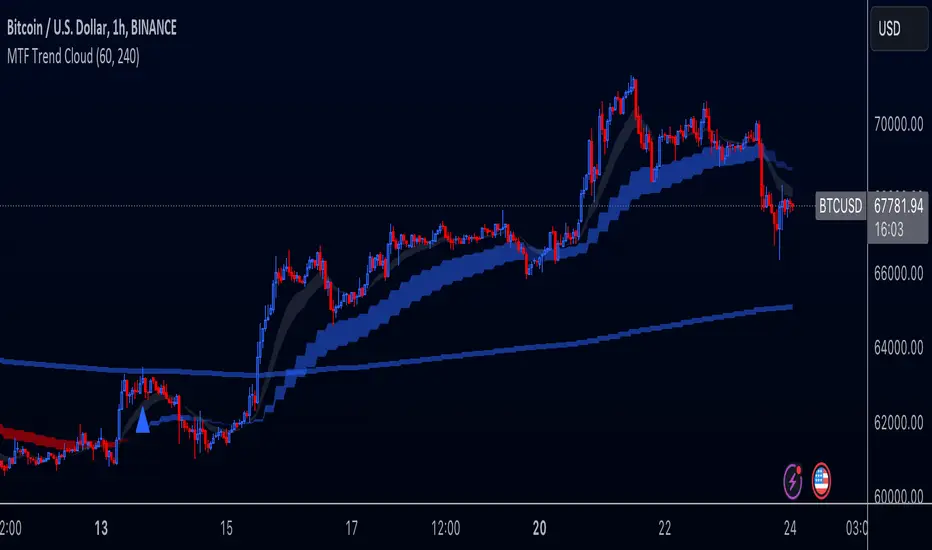
Multi-Timeframe Trend Cloud (EMA13/21) with Alerts Purpose:
This indicator combines trend analysis across multiple timeframes with alerts to help identify general trends and market shifts. It visualizes trends by creating EMA clouds (The area between EMA13 & EMA21), detects confirmed EMA crossovers, and can alert users when the price re-enters the cloud or interacts with the EMA200.
Input Parameters:
Lower Timeframe (LTF): Allows you to select the lower timeframe for trend analysis (e.g., 1 hour, 4 hours).
Higher Timeframe (HTF): Allows you to select the higher timeframe for the main trend reference (e.g., 4 hours, 1 day).
Fill Colors: You can customize the colors used to fill the areas between the EMA lines in both the higher and lower timeframes. Note: The LTF cloud defaults to transparent white so if you have a light background change the color in style settings.
The EMA's default to transparent but can be turned on in the style settings.
Calculating & Plotting EMAs:
The indicator calculates two Exponential Moving Averages (EMAs) on both the LTF and HTF: a faster 13-period EMA and a slower 21-period EMA.
Additionally, it calculates a 200-period EMA on the HTF.
These EMAs are plotted on your chart, providing a visual representation of the trend.
Identifying Trend States:
The script uses the relationships between the price and the 13-period and 21-period EMAs on the Higher Time Frame (HTF) to identify four distinct trend states, each depicted by a specific color to create the "Trend Cloud":
Strong Bull Trend: The 13-period EMA is above the 21-period EMA, and the price is above both EMAs. --- "Color 0" in HTF Trend style settings.
Broken Bullish Trend: The 13-period EMA is above the 21-period EMA but price has broken below both EMA's. --- "Color 3" in HTF Trend style settings.
Strong Bear Trend: The 13-period EMA is below the 21-period EMA, and the price is below both EMAs. --- "Color 2" in HTF Trend style settings.
Broken Bearish Trend: The 13-period EMA is below the 21-period EMA but price has broken above both EMA's. --- "Color 1" in HTF Trend style settings.
Important Note: The 200-period EMA is plotted for reference but is not directly used in determining the current trend state within this script.
Confirmed Crossover Signals:
The indicator plots upward or downward triangles to signal confirmed crossovers of the EMA13 and EMA21 on the HTF. A crossover is considered "confirmed" when it's followed by a candle closing on the same side of the crossing point, adding an extra layer of confidence to the signal.
Cloud Re-entry Alerts:
Receive alerts whenever the price re-enters the HTF cloud - aka "Trend".
EMA200 Retest Alerts:
Get alerts when the price touches the 200 EMA on the HTF. These alerts can be valuable for identifying potential trend reversals or trend continuation scenarios.
Benefits:
Clear Visual Representation: Easily visualize trends on both the lower and higher timeframes.
Confirmed Signals: Filter out false signals by focusing on confirmed crossovers.
Timely Alerts: Get instant notifications for important price actions, allowing you to react quickly to market opportunities.
Customizable: Tailor the indicator's appearance and alert settings to your preferences.
How to Use:
Add the indicator to your chart.
Select your desired LTF and HTF in the Inputs tab.
Customize the fill colors (and optional EMA line colors) in the Style tab.
Enable the alerts you want to receive in the Alerts tab.
Note: This indicator is a great tool for trend analysis, but it should be used with other forms of analysis and risk management techniques to make informed trading decisions.
Fixed volume profile & zonesHi all!
If you like volume profile and like to create zones, where the price might react, this indicator might be for you. It plots a fixed volume profile and creates a user defined number of zones (shelves) of high volume.
If you want to know more about volume profile you can about it here on TradingView: se.tradingview.com
To do
• Add possiblity to create alerts for zone entries, breakouts and retest
• The importance of zones are now based on high volume slots only. It might be changed to include the slots around the 'master slot' to determine if the area is of high importance or not, your suggestions here are welcome!
• Show total volume in 'values'
• Error if the data cannot be fetched
• Add value area
• Make earlier (more important shelves) more visible (less transparent)
• Add possiblity to skip zones
Known issues
• Script execution is long when the volume profile is created (should be none)
• In some cases you can get overlapping shelves, avoid this
Settings
• Main
• Start/end bar of the volume profile (this is required)
• Data
• Timeframe (for getting the volume data)
• Levels (the number of slots in the volume profile)
• Shelves (the number of zones with high volume to plot) and it's color
• Max slot (have this enabled if you want the shelf's highest volume slot to have a dotted line and choose it's color
• Show info (show the order of the plotted zone)
• Style (how the volume profile will look)
• Histogram box (the color of the background of the volume profile)
• Up (the color of bullish volume)
• Down (the color of bearish volume)
• Point of control (color and if it should be extended or not)
• Values and text color (show bullish and bearish volume values)
The defaults on all settings are based on the daily timeframe. This indicator is not 'complete' and I plan to work on it when I get the time.
Note that the precision for the volume profile is per candle, so some levels can have visuals as others but lower volume.
The slot (level) volume has to have a lower difference to the volume included in the shelf than the next volume to be checked to be included. If the level being checked for inclusion in a shelf is at the end of boundaries (high and low) of the volume profile, the volume has to be higher than the golden ratio of the volume before.
You can also use this indicator if you just want a volume profile to show, just set the the number of zones to plot (in 'Shelves') to 0.
I hope I haven't forgotten anything and that it's clear, let me know otherwise.
Best of trading luck!
