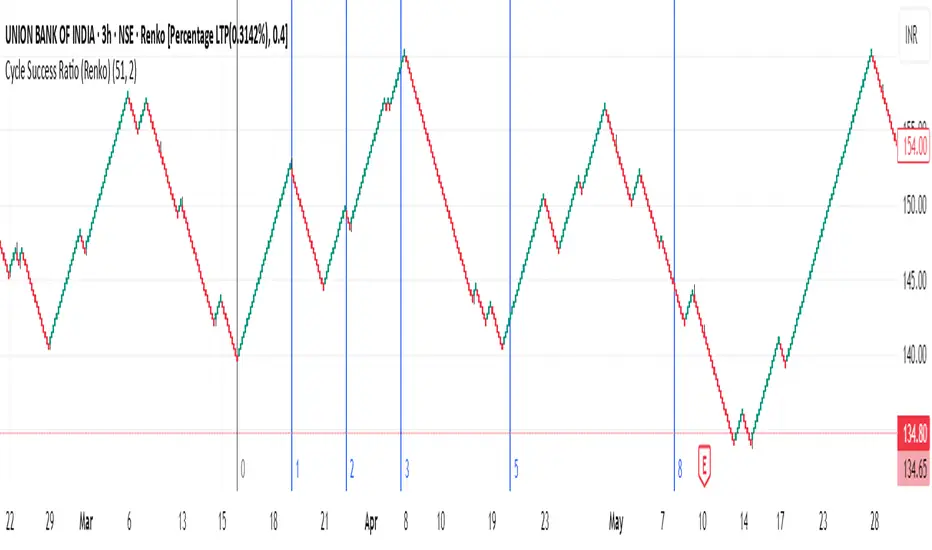
Previous Day/Week/Month OHLC for renko (from Regular Candles)this indiactor gives you previous day/week/month levels on a renko chart based on the ohlc data of normal candles
"renko" için komut dosyalarını ara

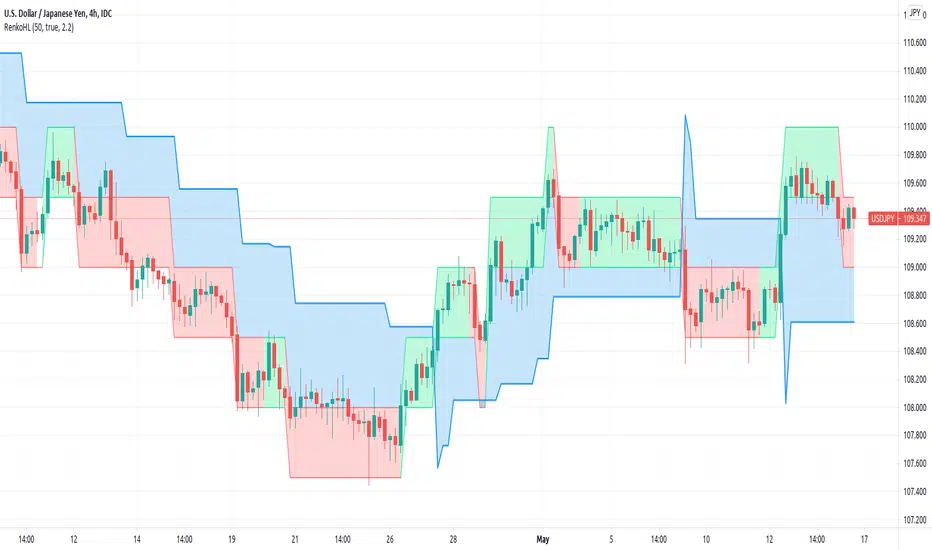
[JL] 3-Color Renko High-Low AlertI am playing Renko and made this script.
- Ignore ATR mode because it will repaint. Instead setting the boxsize and SL index by wathching ATR Labels
- pipmode is because I always trading forex. Normally I use pips. If you are trading others just set it to false.
- Set up box size and SL index based on ATR Labels
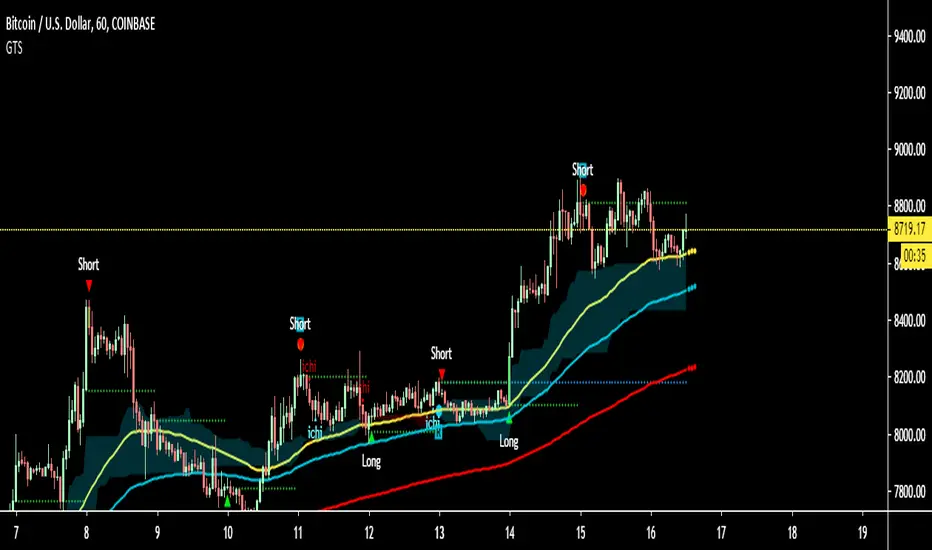
GODMODE reversal points Script shows reversal points on renko candles
Green shape = buy point
Red shape = sell point
Ema's works as support and resistance
Also ema's can be useful as a stoploss
Ema's available
55 = yellow
99 = aqua
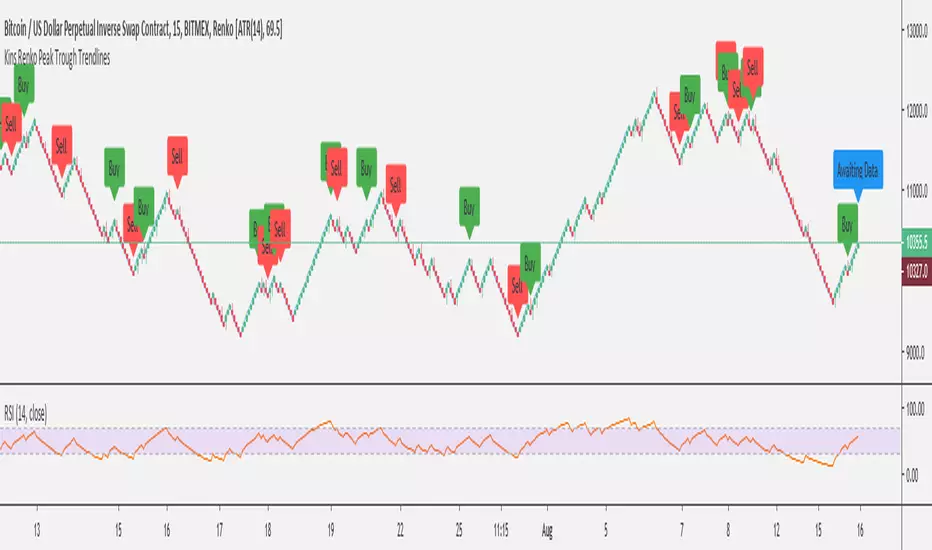
Kins Renko Peak Trough TrendlinesScript is built on the Renko Chart for Bitmex XBT. Looks for swing high/low and RSI divergences as well as some other bits.
This is my first week with Pine Script so there's probably some terrible coding practices in here but the functionality seems acceptable.
Wyckoff Trend Tracking Renko with TimeWyckoff Trend Tracking Renko with Time 该指标用于计算砖形图每个砖块的时间。必须与砖形图配合使用效果才会体现。

Wyckoff Trend Tracking Renko VolumeWyckoff Trend Tracking Renko Volume 该指标用于计算砖形图每个砖块的交易量。必须与砖形图配合使用效果才会体现。

Stochastic RSI Signal LinesThis script is for private use only. I created it as step 1 for my Renko Trading Strategy.
Tested on BitMex on XBTUSD.


Trader Set - MTF Reversal Bar SignalsThis is Multi Tile Frame signalling of reversal bar strategy. Using this, you can easily Identify if you had a reversal bar signal in 1,2,3,4,5,10,15, and 30 minute based renko charts.
The more time frames get in sync with each other, the higher possibility for a more powerful signal.
The least you would need is for 1,2 and 3 minutes to have 2 out of 3 of them showing same signal.
Please don't ask for getting access, the licensing will be available for purchase soon in the website and I will announce it in the comment section.

#102f Renko OBZ [bionis]Indicator #102f is an attempt to measure Normalized Price Movement/Volume adding Renko capabilities in order to filter out noise. Very similar to the RSI, this indicator can be categorized as an oscillator - type one and should be used to detect overbought/oversold conditions, as well as divergences with main price.
Access to the indicator is granted to all CryptoSociety Members and Team.


[AGHYAD]EMA-CROSS+CCI_BASED_ON_RENKO////////////////////////////////////////////
// 4 HOURS
// -------------------------- BUY --------------------------
// 1. MUST: Set Time_Frame To 1D
// 2. STRONG: Any Green Signal!!
////////////////////////////////////////////
EMA-CROSS + CCI SIGNALS BASED ON RENKO WITH CUSTOM TIME-FRAME


CryptoPeep Renko StudyCryptoPeep Renko Study
If you would like to be kept up to date please FOLLOW us and try our indicators and strategies here: uk.tradingview.com
Please click the LIKE button if you use it.
