Super Guppy R1.0 by JustUncleLThis indicator is a Super Guppy version of standard Guppy GMMA as used in "CM_GUPPY_EMA Revised R2 by JustUncleL". Guppy MAs are designed to capture the inferred behaviour of traders and investors by using two groups of averages.
In this version of Super Guppy Traders Group of EMAs are:
EMA3 to EMA23 step 2 (Aqua=Uptrend, Blue=downtrend)
and Investors Group EMAs are:
EMA25 to EMA70 step 3 (Lime=Uptrend, Red=downtrend)
(Gray=Trend not established or in a Pull Back).
The idea of Guppy EMAs is to use fractal repetitions to identify points of agreement and disagreement which precede significant trend changes. For further info on how Guppy/Super Guppy can be used in trading please refer to
www.guppytraders.com
and many other articles available on the subject.
This indicator provides the following :
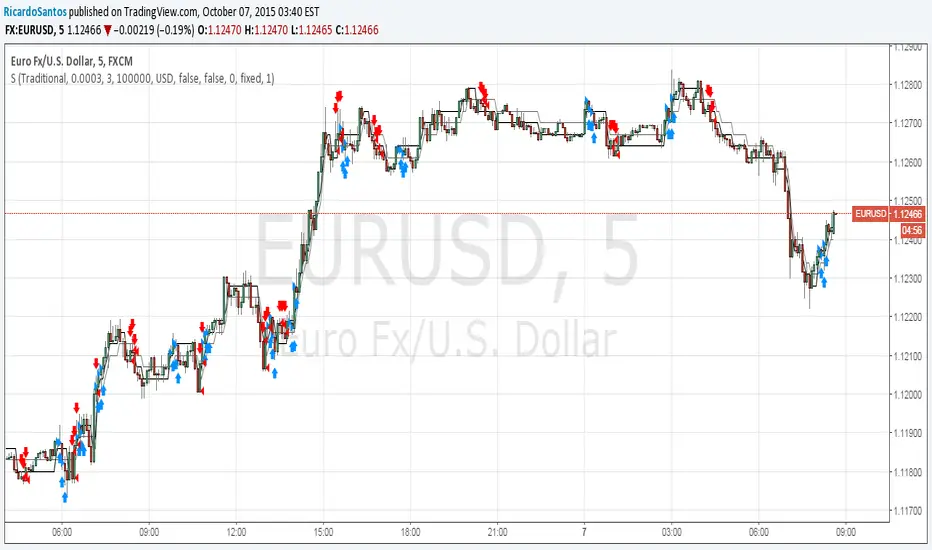
Swing Arrow Alerts (Red for Sell and Green for Buy) to indicate PullBack entries after new trend has been established. Also have option to wait for both fast and slow to completely separate (Confluence). Another option is to show alerts when show arrows when Candle colour changes, this is handy when using Heikin Ashi or Renko Charts.
Trend Break Arrow Alerts (Blue for Sell and Aqua for Buy) to indicate entries for aggressive trend swing point and is calculated by cross over of the average Traders EMA with the average Investors EMA. This was suggested option by Guppy.
Anchor Time frame (0=current), is the time frame that the Guppy EMAs are calculated for. In this way the 60min Guppy can be viewed on say 15min chart and help with setting up tighter Stop Loss conditions.
Alert conditions are also created for the TradingView Alarm subsystem. Only alerts for the selected alert options are generated.
"renko" için komut dosyalarını ara

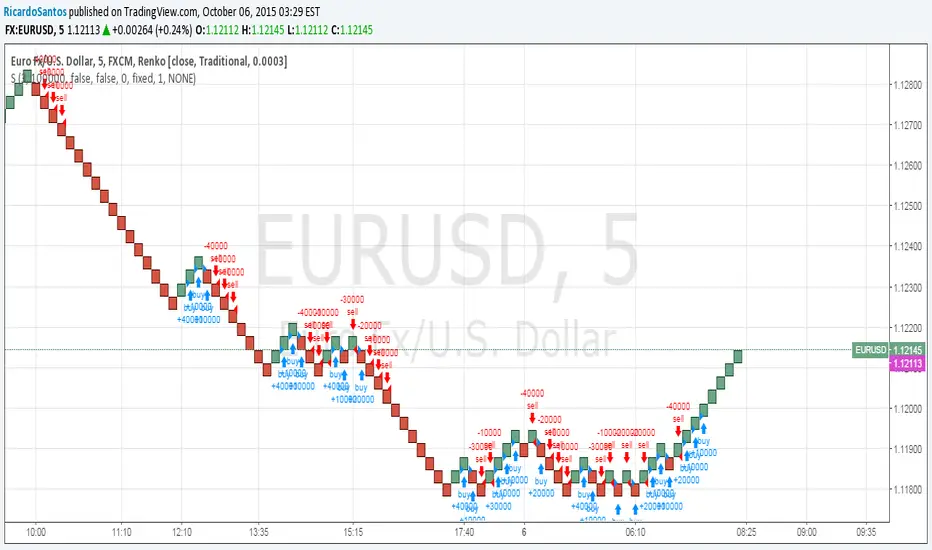
Trend Volume Accumulation R1 by JustUncleLThis simple indicator shows the Accumulated Volume within the current uptrend or downtrend. The uptrend/downtrend is detected by a change in direction of the candles which works very well with Heikin Ashi and Renko charts. Alternatively you can use a Moving average direction to indicate trend direction, which should work on any candle type.
You can select between 11 different types of moving average:
SMA = Simple Moving Average.
EMA = Exponential Moving Average.
WMA = Weighted Moving Average
VWMA = Volume Weighted Moving Average
SMMA = Smoothed Simple Moving Average.
DEMA = Double Exponential Moving Average
TEMA = Triple Exponential Moving Average.
HullMA = Hull Moving Average
SSMA = Ehlers Super Smoother Moving average
ZEMA = Near Zero Lag Exponential Moving Average.
TMA = Triangular (smoothed) Simple Moving Average.
Here is a sample chart using EMA length 6 for trend Direction:

[STRATEGY][RS]The Truth Strategy V0Experimental:
this is what really happens with "The Illusion Strategy"
[STRATEGY][RS]The Illusion Strategy V0EXPERIMENTAL:
WARNING: this strategy does not work!!
one of the fallacy's of backtesting, renko chars signals usually will give signals when price is allready out of range.
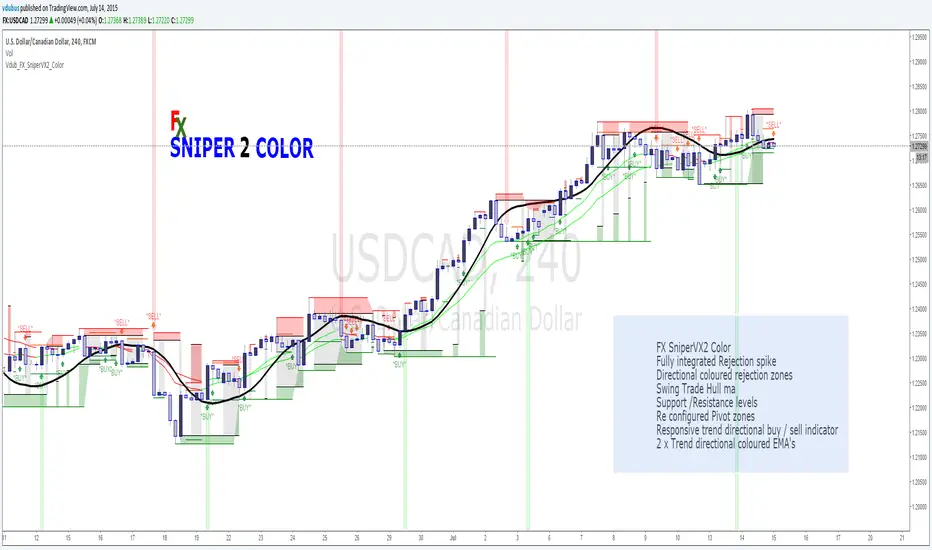
Vdub FX SniperVX2 Color v2FX SniperVX2 Color
Fully integrated Rejection spike
Directional coloured rejection zones
Swing Trade Hull ma
Support /Resistance levels
Re configured Pivot zones
Responsive trend directional buy / sell indicator
2 x Trend directional coloured EMA's
Sniper series
Vdub FX SniperVX v1Vdub FX SniperVX v1
Notes on chart
Please note the Trend directional Buy sell signals generated are configure to be super fast on candle opening. The down side to this is signals may switch direction mid stream.
ITM candlesticks signals generated went 6/300 Losses on a 1 min chart.
the blue line indicates reversal zones. Buy / sell targets are at the next projected line Change TF settings to suit
Sniper series


Ichimoku_on_steroids v 1.0 (Scalper's) OLAgain, ichimoku based signal generator, this time using the Kijun-sen (Base line) and the Tenkan-sen (Conversion line) to assess price action.
Works best on timeless charts (e.g. Point & Figure, Renko's, ...).
Use with caution !! ... or with very small TP targets !!

Ichimoku_on_steroids v 1.0 OLBased on the original Ichimoku formula, this indicator provides decent long/short entries/exit signals. It takes into account an EMA on price as well as the two leading lines (without the future projection). Works on all timeframes, on all bar style's (incl. Renko & PnF). Configurable to your taste in the settings.
Black line = EMA on close // Green line = Leading Span A // Red line = Leading Span B
Green = Long bias // Red = Short bias // Yellow = Neutral bias or close position
The cautious trader might want to wait for confirmation (red or green) before entering a position ; the riskier trader might want to enter as soon as neutral territory is reached.
As usual : use it at your own risk ;)
Comments / suggestions welcome
PS: there are more scripts in the pipeline ... :)
