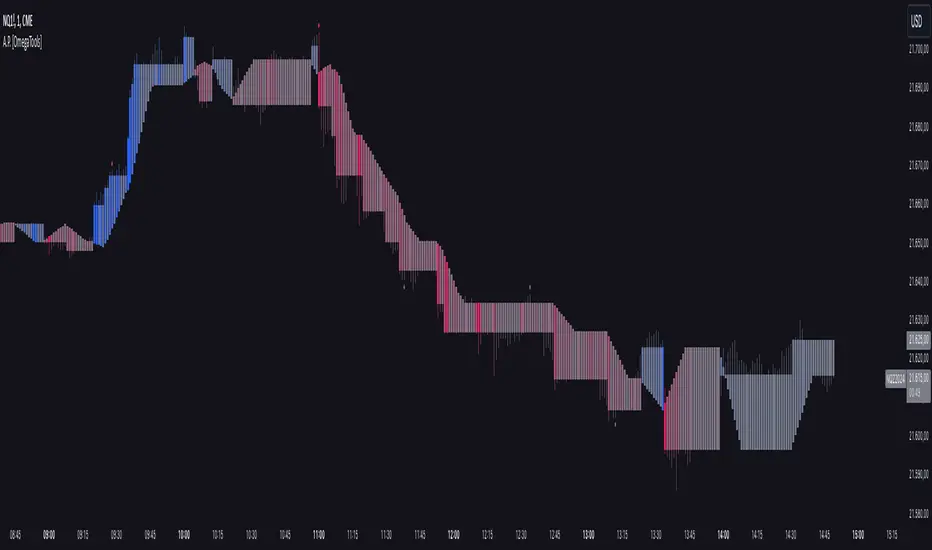
Alternative Price [OmegaTools]The Alternative Price script is a sophisticated and flexible indicator designed to redefine how traders visualize and interpret price data. By offering multiple unique charting modes, robust customization options, and advanced features, this tool provides a comprehensive alternative to traditional price charts. It is particularly useful for identifying market trends, detecting patterns, and simplifying complex data into actionable insights.
This script is highly versatile, allowing users to choose from five distinct charting modes: Candles, Line, Channel, Renko, and Bubbles. Each mode serves a unique purpose and presents price information in an innovative way. When using this script, it is strongly recommended to hide the platform’s default price candles or chart data. Doing so will eliminate redundancy and provide a clearer and more focused view of the alternative price visualization.
The Candles mode offers a traditional candlestick charting style but with added flexibility. Users can choose to enable smoothed opens or smoothed closes, which adjust the way the open and close prices are calculated. When smoothed opens are enabled, the opening price is computed as the average of the actual open price and the closing prices of the previous two bars. This creates a more gradual representation of price transitions, particularly useful in markets prone to sudden spikes or irregularities. Similarly, smoothed closes modify the closing price by averaging it with the previous close, the high-low midpoint, and an exponential moving average of the high-low-close mean. This technique filters out noise, making trends and price momentum easier to identify.
In the Line mode, the script displays a simple line chart that connects the smoothed closing prices. This mode is ideal for traders who prefer minimalism or need to focus on the overall trend without the distraction of individual bar details. The Channel mode builds upon this by plotting additional lines representing the highs and lows of each bar. The resulting visualization resembles a price corridor that helps identify support and resistance zones or price compression areas.
The Renko mode introduces a more advanced and noise-filtering method of visualizing price movements. Renko charts, constructed using the ATR (Average True Range) as a baseline, display blocks that represent a specific price range. The script dynamically calculates the size of these blocks based on ATR, with separate thresholds for upward and downward movements. This makes Renko mode particularly effective for identifying sustained trends while ignoring minor price fluctuations. Additionally, the open and close values of Renko blocks can be smoothed to further refine the visualization.
The Bubbles mode represents price activity using circles or bubbles whose size corresponds to relative volume. This mode provides a quick and intuitive way to assess market participation at different price levels. Larger bubbles indicate higher trading volumes, while smaller bubbles highlight periods of lower activity. This visualization is particularly valuable in understanding the relationship between price movements and market liquidity.
The coloring of candles and other chart elements is a core feature of this script. Users can select between two color modes: Normal and Volume. In Normal mode, bullish candles are displayed in the user-defined bullish color, while bearish candles use the bearish color. Neutral elements, such as midpoints or undecided price movements, are shaded with a neutral color. In Volume mode, the candle colors are dynamically adjusted based on trading volume. A gradient color scale is applied, where the intensity of the bullish or bearish colors reflects the volume for that particular bar. This feature allows traders to visually identify periods of heightened activity and associate them with specific price movements.
Engulfing patterns, a popular technical analysis tool, are automatically detected and marked on the chart when the corresponding setting is enabled. The script identifies long engulfing patterns, where the current bar's range completely encompasses the previous bar’s range and indicates a potential bullish reversal. Similarly, short engulfing patterns are identified where the current bar fully engulfs the previous bar in the opposite direction, suggesting a bearish reversal. These patterns are visually highlighted with circular markers to draw the trader’s attention.
Each feature and mode is highly customizable. The colors for bullish, bearish, and neutral movements can be personalized, and the thresholds for patterns or smoothing can be fine-tuned to match specific trading strategies. The script's ability to toggle between various modes makes it adaptable to different market conditions and analysis preferences.
In summary, the Alternative Price script is a comprehensive tool that redefines the way traders view price charts. By offering multiple visualization modes, customizable features, and advanced detection algorithms, it provides a powerful way to uncover market trends, volume relationships, and significant patterns. The recommendation to hide default chart elements ensures that the focus remains on this innovative tool, enhancing its usability and clarity. This script empowers traders to gain deeper insights into market behavior and make informed trading decisions, all while maintaining a clean and visually appealing chart layout.
Keep in mind that some of the modes of this indicator might not reflect the actual closing price of the underlying asset, before opening a trade, check carefully the actual price!
"relative volume" için komut dosyalarını ara
Market Core [BigBeluga]MARKET CORE Toolkit
The BigBeluga Market Core Toolkit is a comprehensive suite of advanced trading indicators designed to provide traders with a holistic view of market dynamics, structure, and potential opportunities.
In an ever-evolving market, relying on a single indicator can leave traders vulnerable to gaps in their analysis. The BigBeluga Market Core Toolkit addresses this challenge by integrating a range of complementary indicators that work synergistically to reveal the full picture. From detecting key support and resistance levels to identifying market structure shifts, volume imbalances, inefficiencies or analysis of money flow, this toolkit covers every aspect of market behavior.
⬤ Order Blocks
BigBeluga Order Blocks revolutionize the way traders visualize potential areas of significant market activity. Unlike traditional order block indicators that often result in cluttered, noisy charts, these Order Blocks are designed for clarity and effectiveness. They simulate and predict where large areas of market orders may rest by analyzing volume and volatility, providing excellent support or resistance areas.
The blocks offer cleaner chart presentation with reasonable distribution, volume ratio visualization within each block, and categorization into Strong, High and Balanced blocks.
Additionally, a third line has been introduced to rank order blocks by volume using a modified percent rank method for more precise ranking.
This ranking system uses percentile ranks, a concept commonly used in standardized tests. In the context of order blocks, the percentile rank of a particular order block's volume is interpreted as the percentage of the order blocks strength. This method provides a more nuanced and statistically robust way of comparing and prioritizing order blocks.
Key features:
Cleaner chart presentation with reasonable distribution of blocks
Volume ratio visualization within each block (bullish vs bearish)
Categorization into High and Balanced blocks for easy identification of significant levels
Relative volume percentage and volume delta display
Advanced ranking system using modified percent rank method for volume comparison
These Order Blocks help traders:
Forecast excellent support or resistance areas
Gain insight into the balance of the market at specific levels
Identify significant market levels at a glance
Visualize market imbalances through volume delta
Prioritize order blocks based on their relative volume importance
Make more informed decisions about potential entry and exit points
⬤ Beluga Profile
The Beluga Profile is a revolutionary market analysis tool that transforms complex market data into a clear, intuitive visual narrative. At its core, it combines a Dual-Profile Analysis, merging Delta Volume Profile with Money Flow Profile to give traders a comprehensive view of market dynamics.
The percentage scale on the left side aren't just numbers; they represent the Levels Strength Percentage, a crucial ranking system that immediately draws your attention to the most significant price zones. Complementing this, a heat map overlay brings these strength levels to life, offering an instant, color-coded representation of where the market's most influential areas lie.
To the right, a detailed breakdown of volume and money flow for each level provides the hard data behind the visual cues. This granular information allows you to dive deep into the market's structure, understanding not just where the significant levels are, but why they matter.
Below the main chart, the Delta Volume Bar serves as a foundation, showing the average delta of the volume profile. This bar is more than just a measure of volume – it's a window into the underlying forces driving price movement. Just above this bar, a macro trend indicator in the form of an arrow offers a quick, clear signal of the overall market direction based on these delta volume calculations.
But the Beluga Profile doesn't just show you what's happening – it helps you understand the 'why' and 'how'. The Adaptive Points of Interest feature allows you to customize your analysis, focusing on the areas that matter most to your trading strategy. You can select from various options including Money Flow, Delta+, Delta-, Volume+, and Level % (Highest), tailoring the display to your specific analytical needs. This flexibility ensures you can focus on the most relevant data for your trading style. Real-time Active Price Tracking ensures you're always in sync with the latest market movements.
All of these elements work in concert, creating a symphony of market information. They empower you to:
Spot key price levels with uncanny precision
Foresee potential market turns before they happen
Grasp the quality and strength of price moves
Adjust your strategy on the fly as market conditions shift
Develop a holistic understanding of market structure and participant behavior
Make informed decisions backed by a clear view of the overall market trend
In essence, the Beluga Profile isn't just a tool – it's your market storyteller, translating the complex language of price, volume, and money flow into a narrative that you can understand and act upon with confidence.
⬤ Smart Money Concepts (SMC)
The Smart Money Concepts component of the toolkit focuses on automatically detecting key market structures crucial in technical analysis. It identifies and visualizes Break of Structure (BOS) and Change of Character (CHOCH) patterns, helping traders spot potential trend reversals and significant market movements. This includes BOS identification when price breaks previous support or resistance and CHOCH detection for potential trend reversals, with automatic detection of both bullish and bearish patterns.
The latest enhancement to this feature adds a new layer of analysis through Delta Volume Calculation. When a BOS or CHOCH is detected, the toolkit calculates the delta volume within the range from the high or low point to the break point. This analysis considers all the candles in this range and determines whether the volume is predominantly bullish, bearish, or neutral.
Bullish Volume: If the delta volume is bullish, a green diamond is plotted at the high or low point, indicating potential upward momentum.
Bearish Volume: If the delta volume is bearish, a red diamond is plotted, suggesting downward pressure.
Neutral Volume: When the volume is neutral, a yellow diamond is displayed, indicating a balance in buying and selling forces.
This visual representation of volume dynamics provides an additional layer of insight, helping traders assess the strength and direction of price movements following a structure break. You can see an example of this on the attached image, where the diamonds clearly indicate the type of volume driving the breakout.
The toolkit also incorporates Fair Value Gap (FVG) Detection. Fair Value Gaps represent inefficiencies in the market, where there is an imbalance between buy and sell orders. These gaps often act as magnets for price, potentially leading to future reversals or continuations when filled. The toolkit identifies and highlights these gaps, allowing traders to recognize areas where the market may seek to rebalance.
Additionally, Double Top and Bottom Pattern Detection has been integrated, identifying potential reversal points at these classic price formations. Double tops signal potential bearish reversals after a price peak, while double bottoms suggest potential bullish reversals after a price dip. These patterns can be crucial indicators for traders looking to capitalize on upcoming trend changes.
Smart Money Concepts help traders:
Identify potential trend reversals early with a clearer view of market structure.
Recognize significant changes in market structure and volume participation.
Differentiate between temporary pullbacks and genuine trend changes using volume insights (color coded diamonds).
Shows Fair Value gaps which helps to identify price momentum and inefficiencies in the market.
This enhancement ensures that traders can not only see structural changes but also understand the volume behind those moves, leading to more informed and confident trading decisions.
⬤ Support and Resistance Levels
This powerful tool is designed to identify key price levels in the market, providing traders with a clear visual representation of potential support and resistance areas. It goes beyond simple level identification by incorporating a sophisticated ranking system and adjustable sensitivity.
The grading system of levels is a unique feature that evaluates the significance of high and low points in the price action. It takes into consideration how many times the price has touched or interacted with specific levels. This means that levels which have been tested multiple times are given higher importance in the ranking. For example, a price level that has acted as support or resistance three times will be ranked higher than a level that has only been touched once.
By leveraging this grading system, traders can focus on the most significant levels that have repeatedly influenced price action, potentially improving the accuracy of their trading decisions and risk management strategies.
This Support and Resistance Levels indicator helps traders:
Identify and prioritize potential reversal points based on their historical significance and frequency of price interaction
Set more accurate entry and exit points aligned with key market levels, focusing on those with higher ranking
Understand the hierarchical structure of market support and resistance, distinguishing between major and minor levels
Plan stop-loss and take-profit levels with greater precision, using the ranking to gauge the strength of each level
Adapt their analysis to varying market strengths and volatilities, with the ability to filter out less significant levels
Recognize recurring price patterns and potential breakout levels based on the ranked historical price interactions
⬤ How to Use the Toolkit
Each of these indicators, while powerful on its own, works synergistically with the others to provide a more complete picture of the market.
The strength of this toolkit lies in its ability to analyze the market from multiple perspectives
Combining these advanced trading indicators into a cohesive toolkit empowers traders with a comprehensive, multi-dimensional view of the market that no single indicator could provide on its own. The market's complexity demands an approach that goes beyond relying on just one aspect, such as price action, volume, or order flow. Integrating these diverse indicators creates a robust analytical framework that captures the market from multiple angles, leading to more accurate insights and better-informed decision-making.
Analyze Order Blocks to identify potential support/resistance and volume imbalances
Use Beluga Profile for comprehensive market structure and trend analysis
Monitor SMC indicators for potential trend reversals and breakouts
Utilize Support and Resistance Levels for precise entry/exit points and risk management
Combine insights from all tools for a multi-dimensional view of market conditions
⬤ Customization
Each component of the toolkit offers various customization options to suit different trading styles and preferences. These inputs allow traders to adjust settings to better fit their analysis needs and strategies:
Order Blocks
- Order Blocks : Set the amount of Order Blocks on the chart.
- Color Selection : Choose the color for highlighting the order blocks on your chart.
Market Structure
- Sensitivity : Adjust the sensitivity for detecting market structure breaks. Higher sensitivity will detect more granular breaks, while lower sensitivity focuses on more significant movements.
- Data : Enable or disable the display of market structure data.
- Zigzag Option : Toggle Zigzag displays from highs and lows.
S/R (Support and Resistance)
- Sensitivity : Control how sensitive the tool is in detecting support and resistance levels. Lower sensitivity will highlight fewer but stronger levels, while higher sensitivity may reveal more levels.
- Width % : Adjust the width of the support and resistance zones to visually emphasize their importance.
- Color Selection : Choose colors for both support and resistance levels for better clarity.
FVG (Fair Value Gap)
- Max : Set the maximum number of fair value gaps to display. Higher values will show more gaps, while lower values will focus on the most prominent ones.
- Color Selection : Customize the color for the fair value gap areas.
Volume Profile
- Length : Define the look-back period for the volume profile analysis. A longer length considers more historical data, while a shorter length focuses on recent data.
- Levs : Choose the number of volume levels to display, allowing for more or fewer volume bars within the profile.
- BG : Enable or disable background shading for the volume profile.
- HeatMap : Activate or deactivate the heat map overlay for volume intensity visualization.
- POC (Point of Control) : Toggle the Point of Control display and choose between different metrics, such as volume+, money flow, Delta+ and Delta-, Level % (Highesr), to base the POC on.
- Color Selection : Customize the color for the Point of Control line.
These customization options provide traders with the flexibility to tailor the toolkit to their specific trading strategies, enhancing their ability to identify key market signals with precision.
Each component of the toolkit offers various customization options to suit different trading styles and preferences.
The BigBeluga Market Core Toolkit synthesizes complex market data into clear, actionable formats, providing traders with professional-level insights. It's a comprehensive market analysis system that can give traders a significant edge in understanding market behavior and identifying high-probability trade setups. While highly effective, it's recommended to use this toolkit in conjunction with fundamental analysis and sound risk management practices for optimal trading results.

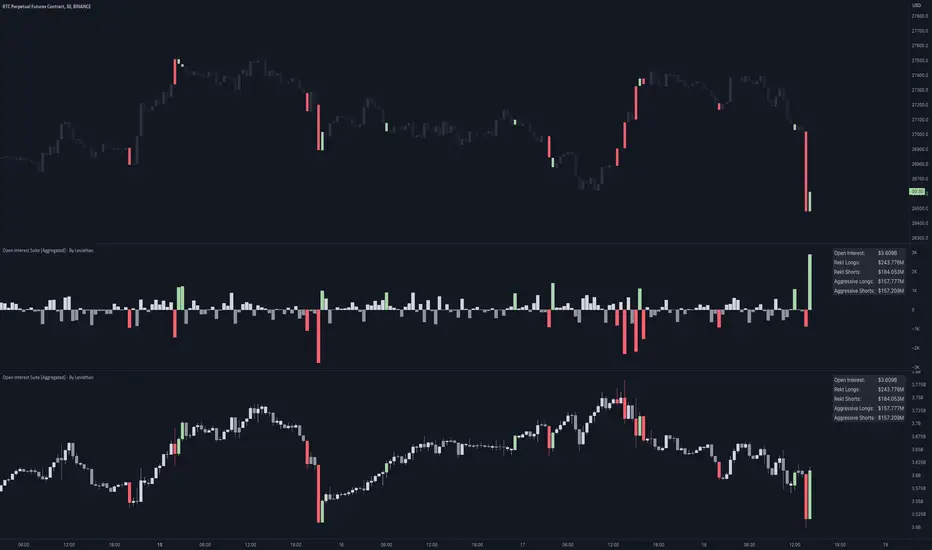
Open Interest Suite [Aggregated] - By LeviathanThis script is an all-in-one indicator that uses aggregated Open Interest data to plot OI candles, Open Interest Delta, OI x rVOL, and OI RSI. It also includes tools such as an OI Distribution profile, large OI increase/decrease coloring, a Stats Screener, and much more.
You can select and have the script plot the following:
- Open Interest in the form of OHLC candles
- Open Interest Delta in the form of a histogram
- Open Interest x Relative Volume in the form of a histogram
- Open Interest RSI in the form of a line
Additional features include:
- OI Distribution Profile (It shows the distribution of open interest in the visible range on y axis. This makes it easier to identify when Open Interest is relatively high or low and at which values most of the action took place)
- Stats screener (The screener includes the real-time net Open Interest value, Rekt Longs/Rekt Shorts based on large OI decreases and Aggressive Longs/Shorts based on large OI increases)
- Coloring (You can color OI Delta nodes, background and chart candles based on large OI increases/decreases)
- more
Instructions for the settings will be provided in the tooltips shortly.
Full credit goes to @KioseffTrading for the profile generation code.
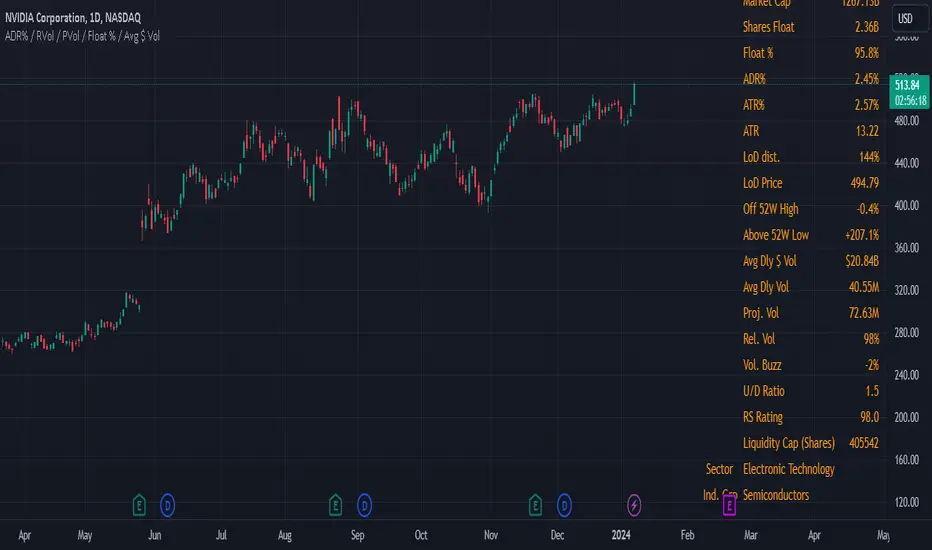
Swing Data - ADR% / RVol / PVol / Float % / Avg $ VolThis table presents consolidated data that swing traders can refer to quickly for their benefit. I am of the firm belief that the information provided in this uncomplicated table is precisely what you require to optimize your trading efficiency, and ultimately, profitability.
The data includes;
1. Market Capitalization - a measure of the total value of a publicly traded company's outstanding shares.
2. Float % - the percentage of a company's outstanding shares that are available for trading on the open market. It is calculated by dividing the number of a company's outstanding shares that are available for trading on the open market by the total number of outstanding shares. A lower float percentage generally means that there are fewer shares available for trading, which can lead to increased volatility in the stock price. On the other hand, a higher float percentage generally means that there are more shares available for trading, which can lead to greater stability in the stock price.
3. ADR% - a technical analysis indicator that measures the average daily price movement as a percentage of its current price. It is calculated by taking the difference between the average high and low prices for a time period, and then dividing it by the current price. The resulting value is then multiplied by 100 to give the ADR% for that day. The ADR% can be useful for traders to assess the potential volatility of a stock. A higher ADR% indicates a greater potential for price movement.
4. ATR - measures the range of price movements of an asset over a specified period of time, taking into account any gaps in price. It is calculated by taking the highest value of the following three values:
The difference between the current high and the current low
The absolute value of the difference between the current high and the previous close
The absolute value of the difference between the current low and the previous close
The resulting value is then averaged over the specified period of time to create the ATR value. This indicator is reflects the average volatility of the asset over the specified period of time.
5. LoD dist. - also refer to Low Of Day distance, a range level gauge of current price based on historical volatility of the price movement, in this case I use ATR. for the historical volatility. Please find below as example for the calculation.
eg. LoD dist. = 104%
Current price (A) = $24.49
Low Price (B) = $22.16
Difference (A) - (B) = $2.33
ATR = $2.25
LoD dist = $2.33 / $2.25 = 103.55% (round up to nearest whole number = 104%)
6. Average Daily $ Volume - used to measure the average amount of money that is traded in a stock or a security over a particular period of time, typically a day. It is calculated by multiplying the average daily trading volume of a security by its average price.
7. Average Daily Volume - used to measure the average no. of share that is traded in a stock or a security over a particular period of time, typically a day.
8. Projected Volume - an estimate of the total volume of trading activity that is expected to occur for the day (from the specific time data), based on an average volume over a specific period of time. Projected volume can be used by traders and investors to help make informed decisions about buying or selling securities, and can also be used as an indicator of market sentiment and volatility. However, it's important to note that projected volume is an estimate and actual trading activity may vary.
9. Relative Volume - a measure of the volume of a stock that is trading at the specific time, relative to its average trading volume over a longer period. It is expressed as a percentage and is often used by traders and investors to identify stocks that are trading with higher or lower than usual volume.
Advanced VolumeThis simple indicator improves upon the built in volume indicator by adding the following:
-Option to use an EMA instead of SMA
-Advanced Coloring: Lighter bars show growing volume, darker bars show falling volume. Gray bars show very low relative volume (less than or equal to 50% of the moving average), while bars which have a highlighted background have a high relative volume( you can choose the threshold level, default is 2 times the RVOL).
Enjoy!

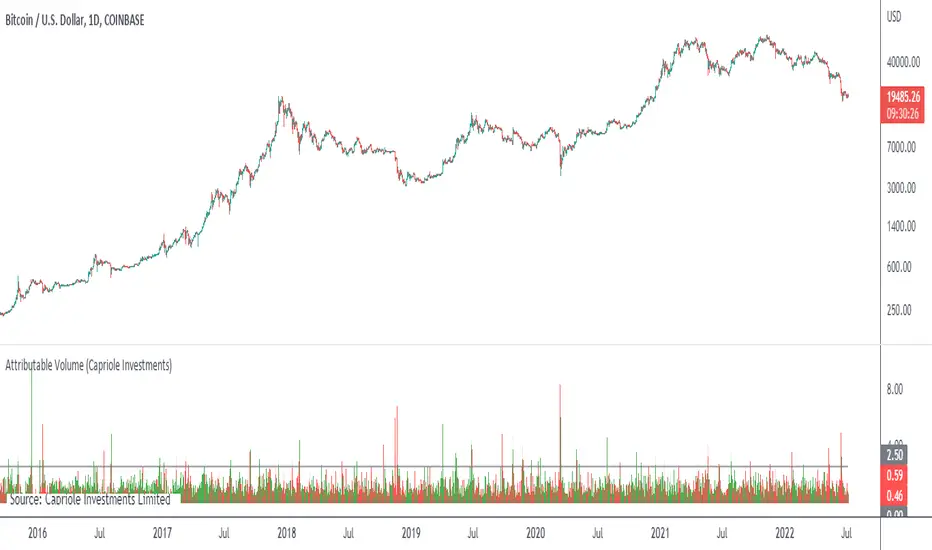
Attributable VolumeA volume indicator which calculates "Attributable Volume”, the portion of volume which contributed to the direction in which the candle moved.
Attributable Volume is calculated as: Total volume excluding the "counter wick" volume.
Where for a green (up) candle, the "counter wick" volume is the top wick volume.
In theory, Attributable Volume should better represent the effort of directional thrust of each candle.
By default, this indicator displays “Attributable RVOL”, but can be set to:
Attributable RVOL
RVOL
Attributable Volume
Volume
Note: RVOL = Relative Volume, the current volume divided by the Volume moving average. RVOL can be used to identify major moves, and potential starts/ends to trends.
Rolling Relative VolumeThis script sums the volume for the selected period and compares it to the selected period before that. It works on a rolling basis, so it is suitable for 24/7 markets such as crypto. That is the main difference between this and the regular RVOL indicator. Of course lower timeframes can also be selected for comparing changes in volume, but you should be aware how the times when markets are closed affect the calculation. For example, if used on stocks, the indicator will use the data that is available, meaning that the amount of data needed to calculate daily cumulative volume can be stretched out over a few days. If the stock session is 8 hours long, that comes out to 3 days.
There are 2 windows of reference when summing the volume:
1) The Recent volume window -> sums the volume between the current candle and the start of the window
2) The previous volume window -> sums the volume from the start of the current window until the start of the previous window
An example follows at the end :)
How to set up:
1) In settings, select the Timeframe; weekly, daily and hourly (W,D,H) are supported.
2) Choose the multiplier of the recent timeframe (for example 4 for cumulative volume over the last 4h)
3) Choose the multiplier of the previous timeframe (for example 8, if you want cumulative volume of the 8h before the start of the recent window)
Example:
Settings:
Timeframe: D
Recent volume multiplier: 3
Previous volume multiplier: 1
The chart set to 1h timeframe
This will calculate the cumulative volume for the past 24h, starting at the recent candle. Then it will calculate the cumulative volume for 72 hours before the start of the recent (24h) window. So in total it will need 24 + 72 = 96 hours of data to calculate.
After that it will compare the volume of the recent window with the average of the previous window. If values are above 1 the volume is increasing, if below 1 it is decreasing.
Why is this useful?
It's easy to spot changes in the volume and see if the volume is increasing and by how much, compared to previous days. Of course volume also drives liquidity. If volume is picking up, that could be the start of a bigger move.
WARNING!!!
Use on very low timeframes (1m, 3m) with big lookback periods (W) can break the script or make it execute very slowly due to the nature of the indicator.
Because this works on bar data it's possible that changing timeframes will change the calculation slightly. Generally, lower timeframes produce more accurate results, but take longer to calculate. The selected timeframe for the indicator should always be higher than the timeframe of the chart, otherwise the calculations won't make sense.
Leave a comment or send a DM for any improvements, bugs or ideas for automation / algo trading.

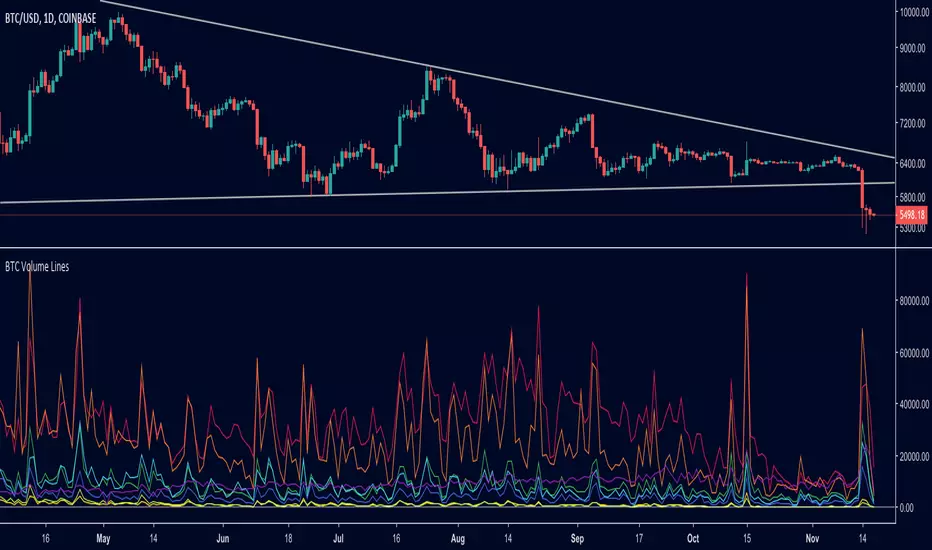
BTC Volume Lines [v2018-11-17] @ LekkerCryptisch.nlCombine the volume of 8 BTCUSD exchanges in one graph.
Three use cases:
1) See the absolute volumes in one graph
2) See the relative volumes in one graph
3) See the deviation of the EMA the volumes in one graph
(JS) RSI Divergence Volume Weighted (v1.1)Okay so I added all kinds of stuff - not sure you've ever been able to customize RSI like this before. The goal here was to allow the user to be able to play around and find the RSI formula that suits them the best.
There's still the obvious features from version 1.0 which are RSI Length and Relative Volume Length, but I really expanded upon the first one. Here's the list of new features:
- RSI Input: 0-6 are the options and they allow you to use - Close, Open, High, Low, HL2, HLC3, and OHLC4. Now you can plug any of these choices into the RSI formula.
- RV x Divergence?: This is how I calculated the original formula, but you can leave this unchecked to turn Relative Volume off, or apply elsewhere.
- RV x RS?: Another way to calculate the function. There's two sides, Divergence RS and Standard RS - these check marks allow you to select which part you prefer to be multiplied by Relative Volume. Check neither to turn off RV multiplication, check both to add it on both sides of the equation.
* Relative Volume Note - when looking at longer term charts, be aware that if a candle JUST began, it's obviously going to have really low RV and will throw off the current candle (which is why I added the option to turn off/on). Best usage is at candle close (or ignore the current candle).
-Divergence Weight: So as it stands, the Standard RS and Divergence RS are both equal weight ( /2). This allows you to change the weight at increments of 0.1 on a scale of 0-2. Making 2 purely Divergence, and 0 purely Standard RSI. With RV left off on both options, and a weight setting of 0, this becomes a regular RSI again.
-SMA Divergence?: This is the option to leave the Divergence equation unsmooth, or to smooth it over. SMA is an unsmoothed average, whereas leaving it unchecked runs it through an RMA smoothing the same way standard RSI is calculated.
-Fractal Divergence Lines: I added fractal lines to spot divergence in the indicator vs. the price. This was meant to help you spot divergence easier.
-Show Fractal Labels?: This adds "Bull" and "Bear" labels on said divergence.
-Show Fractal Channel?: This allows you to see the whole fractal channel.
-Added Horizontals: I added horizontal lines at 40 and 60, to make viewing the RSI values a bit easier.
-Added Trend BG: I also added a feature where the BG color will change with the ongoing trend. I removed the previous colors I had in the BG.
Enjoy!

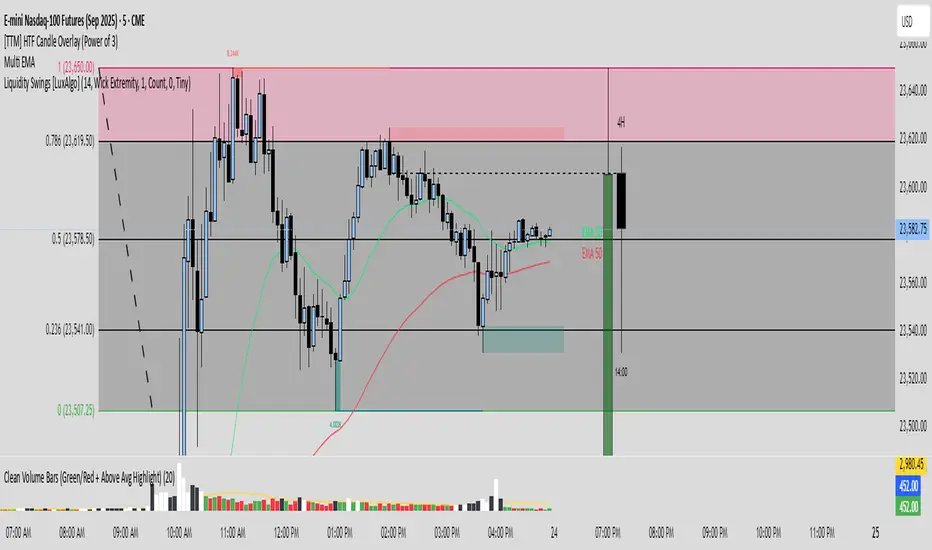
Clean Volume Bars (Green/Red + Above Avg Highlight)📊 Clean Volume Bars (Green/Red + Above Avg Highlight)
This script provides a clearer view of market volume by combining standard green/red volume bars with dynamic highlights for above-average activity.
Features:
✅ Green / Red Volume Bars – standard visualization:
Green when the candle closes higher than it opened
Red when the candle closes lower than it opened
✅ Average Volume Line – a simple moving average (default 20 periods) to track relative volume.
✅ Above Average Highlights – bars that exceed the average volume are emphasized:
White for above-average bullish volume
Black for above-average bearish volume
How to Use:
Look for white volume spikes during up candles → potential strong bullish activity.
Watch for black volume spikes during down candles → potential strong bearish pressure.
Combine with price action, trend, or other indicators for confluence (this is not a standalone trading system).
Key Indicators Dashboard (KID)Key Indicators Dashboard (KID) — Comprehensive Market & Trend Metrics
📌 Overview
The Key Indicators Dashboard (KID) is an advanced multi-metric market analysis tool designed to consolidate essential technical, volatility, and relative performance data into a single on-chart table. Instead of switching between multiple indicators, KID centralizes these key measures, making it easier to assess a stock’s technical health, volatility state, trend status, and relative strength at a glance.
🛠 Key Features
⦿ Average Daily Range (ADR %): Measures average daily price movement over a specified period. It is calculated by averaging the daily price range (high - low) over a set number of days (default 20 days).
⦿ Average True Range (ATR): Measures volatility by calculating the average of a true range over a specific period (default 14). It helps traders gauge the typical extent of price movement, regardless of the direction.
⦿ ATR%: Expresses the Average True Range as a percentage of the price, which allows traders to compare the volatility of stocks with different prices.
⦿ Relative Strength (RS): Compares a stock’s performance to a chosen benchmark index (default NIFTYMIDSML400) over a specific period (default 50 days).
⦿ RS Score (IBD-style): A normalized 1–100 rating inspired by Investor’s Business Daily methodology.
How it works: The RS Score is based on a weighted average of price changes over 3 months (40%), 6 months (20%), 9 months (20%), and 12 months (20%).
The raw value is converted into a percentage return, then normalized over the past 252 trading days so the lowest value maps to 1 and the highest to 100.
This produces a percentile-style score that highlights the strongest stocks in relative terms.
⦿ Relative Volume (RVol): Compares a stock's current volume to its average volume over a specific period (default 50). It is calculated by dividing the current volume by the average historical volume.
⦿ Average ₹ Volume (Turnover): Represents the total monetary value of shares traded for a stock. It's calculated by multiplying a day's closing price by its volume, with the final value converted to crores for clarity. This metric is a key indicator of a stock's liquidity and overall market interest.
⦿ Moving Average Extension: Measures how far a stock's current price has moved from from a selected moving average (EMA or SMA). This deviation is normalized by the stock's volatility (ATR%), with a default threshold of 6 ATR used to indicate that the stock is significantly extended and is marked with a selected shape (default Red Flag).
⦿ 52-Weeks High & Low: Measures a stock's current price in relation to its highest and lowest prices over the past year. It calculates the percentage a stock is below its 52-week high and above its 52-week low.
⦿ Market Capitalization: Market Cap represents the total value of all outstanding.
⦿ Free Float: It is the value of shares readily available for public trading, with the Free Float Percentage showing the proportion of shares available to the public.
⦿ Trend: Uses Supertrend indicator to identify the current trend of a stock's price. A factor (default 3) and an ATR period (default 10) is used to signal whether the trend is up or down.
⦿ Minervini Trend Template (MTT): It is a set of technical criteria designed to identify stocks in strong uptrends.
Price > 50-DMA > 150-DMA > 200-DMA
200-DMA is trending up for at least 1 month
Price is at least 30% above its 52-week low.
Price is within at least 25 percent of its 52-week high
Table highlights when a stock meets all above criteria.
⦿ Sector & Industry: Display stock's sector and industry, provides categorical classification to assist sector-based analysis. The sector is a broad economic classification, while the industry is a more specific group within that sector.
⦿ Moving Averages (MAs): Plot up to four customizable Moving Averages on a chart. You can independently set the type (Simple or Exponential), the source price, and the length for each MA to help visualize a stock's underlying trend.
MA1: Default 10-EMA
MA2: Default 20-EMA
MA3: Default 50-EMA
MA4: Default 200-EMA
⦿ Moving Average (MA) Crossover: It is a trend signal that occurs when a shorter-term moving average crosses a longer-term one. This script identifies these crossover events and plots a marker on the chart to visually signal a potential change in trend direction.
User-configurable MAs (short and long).
A bullish crossover occurs when the short MA crosses above the long MA.
A bearish crossover occurs when the short MA crosses below the long MA.
⦿ Inside Bar (IB): An Inside Bar is a candlestick whose entire price range is contained within the range of the previous bar. This script identifies this pattern, which often signals consolidation, and visually marks bullish and bearish inside bars on the chart with distinct colors and labels.
⦿ Tightness: Identifies periods of low volatility and price consolidation. It compares the price range over a short lookback period (default 3) to the average daily range (ADR). When the lookback range is smaller than the ADR, the indicator plots a marker on the chart to signal consolidation.
⦿ PowerBar (Purple Dot): Identifies candles with a strong price move on high volume. By default, it plots a purple dot when a stock moves up or down by at least 5% and has a minimum volume of 500,000. More dots indicate higher volatility and liquidity.
⦿ Squeezing Range (SQ): Identifies periods of low volatility, which can often precede a significant price move. It checks if the Bollinger Bands have narrowed to a range that is smaller than the Average True Range (ATR) for a set number of consecutive bars (default 3).
(UpperBB - LowerBB) < (ATR × 2)
⦿ Mark 52-Weeks High and Low: Marks and labels a stock's 52-Week High and Low prices directly on the chart. It draws two horizontal lines extending from the candles where the highest and lowest prices occurred over the past year, providing a clear visual reference for long-term price extremes.
⏳PineScreener Filters
The indicator’s alert conditions act as filters for PineScreener.
Price Filter: Minimum and maximum price cutoffs (default ₹25 - ₹10000).
Daily Price Change Filter: Minimum and maximum daily percent change (default -5% and 5%).
🔔 Built-in Alerts
Supports alert creation for:
ADR%, ATR/ATR %, RS, RS Rating, Turnover
Moving Average Crossover (Bullish/Bearish)
Minervini Trend Template
52-Week High/Low
Inside Bars (Bullish/Bearish)
Tightness
Squeezing Range (SQ)
⚙️ Customizable Visualization
Switchable between vertical or horizontal layout.
Works in dark/light mode
User-configurable to toggle any indicator ON or OFF.
User-configurable Moving (EMA/SMA), Period/Lengths and thresholds.
⦿ (Optional) : For horizontal table orientation increase Top Margin to 16% in Chart (Canvas) settings to avoid chart overlapping with table.
⚡ Add this script to your chart and start making smarter trade decisions today! 🚀

Volume-Based Candle ShadingThe Volume Shading indicator dynamically adjusts the color brightness of each price bar based on relative volume levels. It helps traders quickly identify whether a candle formed on low, average, or high volume without needing to reference a separate volume pane.
Candles are shaded dynamically as they form, so you can watch volume flow into them in real time. This indicator is designed to be as minimally intrusive as possible, allowing you to visualize volume levels without extra clutter on your charts.
The additional volume indicator in the preview above is there just for a point of reference to allow you to see how the shading on the bars correlates to the volume.
⸻
SETTINGS:
Bullish and bearish base colors — These serve as the midpoint (average volume) for shading.
Brightness mapping direction — Optionally invert the shading so that either high volume appears darker or lighter.
Volume smoothing length — Defines how many bars are averaged to determine what constitutes “normal” volume.
Candles with volume above average will appear darker or lighter depending on user preference, while those with average volume will be painted the chosen colors, giving an intuitive gradient that enhances volume awareness directly on the chart.
⸻
USES:
Confirming price action: Highlight when breakout candles or reversal bars occur with high relative volume, strengthening signal conviction.
Spotting low-volume moves: Identify candles that lack volume support, potentially signaling weak continuation or false breakouts.
Enhancing visual analysis: Overlay volume dynamics directly onto price bars, reducing screen clutter and aiding faster decision-making.
Custom visual workflows: Adapt the visual behavior of candles to your trading style by choosing color direction and base tones.

Intradayscanner - RvolThis indicator delivers a session-precise Relative Volume (RVol) metric using an advanced, performance-optimized method that goes beyond standard volume-vs-average calculations:
Session-Aligned Cumulative Volume
Tracks intraday volume from each session’s true open using a rolling array of session start bar indices.
Prunes old sessions to maintain high performance even on long history (max_bars_back=5000).
Binary-Search History Lookup
Employs a binary-search algorithm to find the exact bar corresponding to each prior session’s close, accounting for weekends/holidays.
Ensures the N-day average is built from perfectly aligned session volumes rather than simple bar-counts.
Configurable Threshold & Coloring
Computes RVol = (today’s cumulative volume) ÷ (N-day average cumulative volume).
Highlights high-volume conditions when RVol exceeds a user-defined threshold (High Volume Threshold).
Optional line-coloring by price direction (up/down) for immediate visual context.
Background Shading for Volume Spikes
Applies semi-transparent colored backgrounds when RVol > 1 (and above the threshold), making significant volume surges unmissable.
Customizable Lookback & Precision
User inputs for N-day average length, threshold multiplier, and color-by-previous-close toggle.
Designed for up to 5000 bars of history without performance degradation.

Mariam Market DashboardMariam Market Dashboard – A Quick Guide
Purpose:
Shows if the market is trending, volatile, or stuck so you can decide when to trade or wait.
How to Use
Add the indicator to your chart. Adjust basic settings like EMA, RSI, ATR lengths, and timezone if needed. Use it before entering any trade to confirm market conditions.
What Each Metric Means (with general ranges)
Session: Identifies which market session is active (New York, London, Tokyo).
Trend: Shows current market direction. “Up” means price above EMA and VWAP, “Down” means price below. Use this to confirm bullish or bearish bias.
HTF Trend: Confirms trend on a higher timeframe for stronger signals.
ATR (Average True Range): Measures market volatility or price movement speed.
Low ATR (e.g., below 0.5% of price) means quiet or slow market; high ATR (above 1% of price) means volatile or fast-moving market, good for active trades.
Strong Bar: A candlestick closing near its high (above 75% of range) indicates strong buying momentum; closing near its low indicates strong selling momentum.
Higher Volume: Volume higher than average (typically 10-20% above normal) means more market activity and stronger moves.
Volume / Avg Volume: Ratio above 1.2 (120%) shows volume is significantly higher than usual, signaling strong interest.
RVol % (Relative Volume %): Above 100% means volume is hotter than normal, increasing chances of strong moves; below 50% means low activity and possible indecision.
Delta: Difference between buying and selling volume (if available). A positive delta means buyers dominate; negative means sellers dominate.
ADX (Average Directional Index): Measures trend strength:
Below 20 means weak or no trend;
Above 25 means strong trend;
Between 20-25 is moderate trend.
RSI (Relative Strength Index): Momentum oscillator:
Below 30 = oversold (potential buy);
Above 70 = overbought (potential sell);
Between 40-60 means neutral momentum.
MACD: Confirms momentum direction:
Positive MACD histogram bars indicate bullish momentum;
Negative bars indicate bearish momentum.
Choppiness Index: Measures how much the market is ranging versus trending:
Above 60 = very choppy/sideways market;
Below 40 = trending market.
Consolidation: When true, price is stuck in a narrow range, signaling indecision. Avoid breakout trades during this.
Quick Trading Reminder
Trade only when the trend is clear and volume is above average. Avoid trading in low volume or choppy markets.

Volume Momentum [BackQuant]Volume Momentum
The Volume Momentum indicator is designed to help traders identify shifts in market momentum based on volume data. By analyzing the relative volume momentum, this indicator provides insights into whether the market is gaining strength (uptrend) or losing momentum (downtrend). The strategy uses a combination of percentile-based volume normalization, weighted moving averages (WMA), and exponential moving averages (EMA) to assess volume trends.
The system focuses on the relationship between price and volume, utilizing normalized volume data to highlight key market changes. This approach allows traders to focus on volume-driven price movements, helping them to capture momentum shifts early.
Key Features
1. Volume Normalization and Percentile Calculation:
The signed volume (positive when the close is higher than the open, negative when the close is lower) is normalized against the rolling average volume. This normalized volume is then subjected to a percentile interpolation, allowing for a robust statistical measure of how the current volume compares to historical data. The percentile level is customizable, with 50 representing the median.
2. Weighted and Smoothed Moving Averages for Trend Detection:
The normalized volume is smoothed using weighted moving averages (WMA) and exponential moving averages (EMA). These smoothing techniques help eliminate noise, providing a clearer view of the underlying momentum. The WMA filters out short-term fluctuations, while the EMA ensures that the most recent data points have a higher weight, making the system more responsive to current market conditions.
3. Trend Reversal Detection:
The indicator detects momentum shifts by evaluating whether the volume momentum crosses above or below zero. A positive volume momentum indicates a potential uptrend, while a negative momentum suggests a possible downtrend. These trend reversals are identified through crossover and crossunder conditions, triggering alerts when significant changes occur.
4. Dynamic Trend Background and Bar Coloring:
The script offers customizable background coloring based on the trend direction. When volume momentum is positive, the background is colored green, indicating a bullish trend. When volume momentum is negative, the background is colored red, signaling a bearish trend. Additionally, the bars themselves can be colored based on the trend, further helping traders quickly visualize market momentum.
5. Alerts for Momentum Shifts:
The system provides real-time alerts for traders to monitor when volume momentum crosses a critical threshold (zero), signaling a trend reversal. The alerts notify traders when the market momentum turns bullish or bearish, assisting them in making timely decisions.
6. Customizable Parameters for Flexible Usage:
Users can fine-tune the behavior of the indicator by adjusting various parameters:
Volume Rolling Mean: The period used to calculate the average volume for normalization.
Percentile Interpolation Length: Defines the range over which the percentile is calculated.
Percentile Level: Determines the percentile threshold (e.g., 50 for the median).
WMA and Smoothing Periods: Control the smoothing and response time of the indicator.
7. Trend Background Visualization and Trend-Based Bar Coloring:
The background fill is shaded according to whether the volume momentum is positive or negative, providing a visual cue to indicate market strength. Additionally, bars can be color-coded to highlight the trend, making it easier to see the trend’s direction without needing to analyze numerical data manually.
8. Note on Mean-Reversion Strategy:
If you take the inverse of the signals, this indicator can be adapted for a mean-reversion strategy. Instead of following the trend, the strategy would involve buying assets that are underperforming and selling assets that are overperforming, based on volume momentum. However, it’s important to note that this approach may not work effectively on highly correlated assets, as their price movements may be too similar, reducing the effectiveness of the mean-reversion strategy.
Final Thoughts
The Volume Momentum indicator offers a comprehensive approach to analyzing volume-based momentum shifts in the market. By using volume normalization, percentile interpolation, and smoothed moving averages, this system helps identify the strength and direction of market trends. Whether used for trend-following or adapted for mean-reversion, this tool provides traders with actionable insights into the market’s volume-driven movements, improving decision-making and portfolio management.

Volume Candle Color (Continuous)Volume-Based Candle Color Indicator (Continuous Gradient)
Overview
Transform your charts with this advanced volume visualization tool that colors candles based on relative volume intensity using a smooth, continuous gradient . Unlike traditional step-based volume indicators, this script provides nuanced color transitions that make volume anomalies instantly visible.
Key Features
Continuous Color Gradient
Smooth transitions - No more discrete color steps
High volume = Bright, opaque colors that demand attention
Low volume = Faded, transparent colors that blend into background
Real-time adaptation to market conditions
Full Customization Control
Volume Range Settings: Define min/max volume ratios for optimal sensitivity
Transparency Control: Adjust brightness levels from 0-95%
Custom Colors: Choose your preferred bullish/bearish base colors
Moving Average Period: Customize the volume comparison timeframe (default: 30)
Enhanced Visualization
Optional Info Panel: Real-time display of volume metrics
Volume Ratio Plot: Additional pane showing volume ratio trends
Clean Interface: Non-intrusive overlay that enhances price action
How It Works
The indicator calculates relative volume by comparing current volume to a Simple Moving Average (SMA) of volume over your chosen period. This ratio is then mapped to a continuous color scale:
Volume Ratio > 2.0: Maximum intensity (brightest colors)
Volume Ratio 1.0: Average volume (medium intensity)
Volume Ratio < 0.5: Below average (most transparent)
Bullish Candles (Close > Open): Green gradient
Bearish Candles (Close < Open): Red gradient
Trading Applications
Volume Spread Analysis (VSA)
Perfect companion for VSA traders who need to quickly identify:
Climactic volume at key support/resistance levels
No demand situations with low volume
Professional money accumulation/distribution patterns
Breakout Confirmation
High volume breakouts: Immediately visible with bright colors
False breakouts: Revealed by low volume (faded colors)
Volume divergences: Spotted instantly through color intensity changes
Market Structure Analysis
Support/Resistance tests: Volume validation through color brightness
Trend strength: Continuous color feedback on volume participation
Market phases: Easy identification of accumulation vs distribution
Why Choose This Indicator?
Advantages Over Traditional Volume Indicators:
Instant Visual Feedback: No need to look at separate volume bars
Continuous Scale: More precise than discrete level systems
Customizable Sensitivity: Adapt to any market or timeframe
Clean Charts: Maintains focus on price action while adding volume context
Universal Application: Works on all instruments and timeframes
Settings Guide
Essential Settings:
Volume MA Period (30): Longer periods = smoother baseline, shorter = more sensitive
Min Volume Ratio (0.2): Lower values = more sensitivity to low volume
Max Volume Ratio (3.0): Higher values = accommodate extreme volume spikes
Transparency Range (10-85%): Adjust visual contrast to your preference
Pro Tips:
Day Trading: Use 10-20 period MA for quick volume changes
Swing Trading: Use 30-50 period MA for broader volume context
Lower transparency range (0-70%) for subtle effects
Higher transparency range (20-90%) for dramatic contrasts
Best Practices
Combine with Price Action: Use volume colors to confirm price patterns
Multiple Timeframes: Apply on different timeframes for comprehensive analysis
Market Context: Adjust sensitivity based on market volatility periods
Backtesting: Test settings on historical data before live trading
Perfect For:
Volume Spread Analysis practitioners
Breakout traders seeking confirmation
Market structure analysts
Anyone wanting cleaner, more intuitive volume visualization
Technical Specifications
Pine Script v6 - Latest version compatibility
Overlay Indicator - Works directly on price charts
Minimal Performance Impact - Optimized calculations
All Market Types - Stocks, Forex, Crypto, Futures
Transform your volume analysis today! Experience the difference continuous color gradients make in identifying high-probability trading opportunities.
Like and follow for more innovative trading tools!
Relative Directional Volume Indicator# Relative Directional Volume Indicator (RelDirVol)
## Overview
The Relative Directional Volume Indicator (RelDirVol) is a powerful volume analysis tool that measures current trading volume relative to historical volume while differentiating between bullish and bearish volume flows. This indicator helps traders identify unusual volume activity and determine whether it's coming from buyers or sellers, providing deeper insights into market participation and potential trend strength.
## Features
- **Relative Volume Calculation**: Compares current volume to historical averages
- **Directional Volume Analysis**: Separates and visualizes bullish vs bearish volume
- **Multiple Moving Average Options**: Customize smoothing with various MA types (SMA, EMA, WMA, HMA, VWMA)
- **Split Moving Averages**: View distinct moving averages for bullish and bearish volume flows
- **Reference Lines**: Visual guides for normal volume (1.0x) and key deviation levels (0.5x, 2.0x, 3.0x)
- **Customizable Colors**: Adjust visual appearance for improved chart readability
## How It Works
The indicator calculates the relative volume by dividing the current bar's volume by the average volume over a specified lookback period. It then categorizes this volume as either bullish (when price closes above the open) or bearish (when price closes below or equal to the open).
1. **Relative Volume**: Current volume ÷ Average volume from previous N bars
2. **Directional Classification**: Assigns volume to bullish or bearish categories based on price action
3. **Moving Averages**: Applies user-selected moving average to smooth the data
The result is displayed as color-coded histogram bars showing the relative volume magnitude, with optional moving average lines for both overall and direction-specific volume trends.
## Interpretation
### Volume Magnitude
- **Above 1.0**: Higher than average volume (more participation than normal)
- **Below 1.0**: Lower than average volume (less participation than normal)
- **2.0+**: Volume twice the normal level (significant participation)
- **3.0+**: Volume three times normal (exceptional participation, often at key events)
### Directional Analysis
- **Strong Green Bars**: Heavy bullish participation driving prices up
- **Strong Red Bars**: Heavy bearish participation driving prices down
- **Bullish MA > Bearish MA**: Overall buying pressure dominating
- **Bearish MA > Bullish MA**: Overall selling pressure dominating
### Key Signals
- **Volume Spikes with Price Breakouts**: Confirms strength of the move
- **Divergence Between MAs**: Early warning of potential shift in market control
- **Sustained Above-Average Volume**: Strong trend continuation likely
- **Volume Decline After Spike**: Potential exhaustion of trend
## Settings
- **Relative Volume Lookback**: Comparison period for average volume (default: 20)
- **Moving Average Type**: Method used for smoothing (default: SMA)
- **Moving Average Length**: Smoothing period (default: 5)
- **Show Moving Average**: Toggle overall volume MA visibility
- **Show Baseline**: Toggle 1.0 reference line visibility
- **Show Bullish/Bearish MAs**: Toggle direction-specific MA visibility
## Best Practices
This indicator performs best when combined with price action analysis and other indicators. Look for:
1. Volume confirmation of breakouts and trend changes
2. Divergence between price movement and volume direction
3. Shifts in the relationship between bullish and bearish MAs
4. Unusual volume patterns during consolidation phases
Particularly effective for swing trading, day trading, and identifying institutional participation in market moves across multiple timeframes.
Pro Volume By TradeINskiOverview
The Pro Volume By TradeINski indicator is a comprehensive trading tool designed to enhance volume analysis, position sizing, and trend identification. It integrates multiple trading metrics into a single dashboard, helping traders make informed decisions based on volume dynamics, momentum bursts, trend intensity, and risk management.
Key Features
1. Position Size Calculator
Helps traders determine optimal position sizes based on risk parameters:
Capital & Risk Amount: Set account size and risk per trade.
Lot Size Adjustments: Automatically calculates nearest lot size for futures trading.
Stop Loss-Based Quantity: Computes position size based on distance from stop-loss levels (LOD or mid-price).
Standard Stop Losses: Predefined stop-loss levels (1%, 1.25%, 1.5%, 1.75%) for quick risk assessment.
Reverse Pyramiding: Enhances position sizing with adjustable risk multipliers (25%, 50%).
Closing Range & Range Expansion: Measures price strength and volatility expansion.
2. Volume Analysis & Bar Coloring
Default Bar Colors: Green for bullish bars, red for bearish bars.
Dry Volume Detection: Highlights low-volume bars (below 20-period SMA) in gray.
3. Momentum Burst (MB)
Identifies high-momentum moves:
Bullish Momentum: Volume surge + price rise ≥ user-defined threshold (default: 4%).
Bearish Momentum: Volume surge + price drop ≥ user-defined threshold (default: -4%).
4. Trend Intensity (TI)
Measures trend strength using moving averages:
Fast MA (7) vs. Slow MA (65): Highlights strong bullish/bearish trends when deviation exceeds sensitivity threshold (default: 5%).
5. Anticipation (ANTS)
Detects consolidation before potential breakouts:
Price Change Range: Filters minor price fluctuations (default: -0.4% to +0.4%).
Trend Confirmation: Requires TI_65 sensitivity (default: 5%) for validation.
6. Episodic Pivot (EP)
Flags unusually high-volume bars (default: 9M+ volume) as potential trend reversal or continuation signals.
7. Data Metrics Table
Displays key trading metrics:
Trend Intensity (TI): 21-period SMA comparison.
Industry & Sector: Stock classification.
Market Cap & Free Float: Fundamental liquidity metrics.
Volume × Price (VP): Monetary value of traded volume.
Relative Volume (RV): Today’s volume vs. previous day.
Persistent Intensity (PI): Count of consecutive up closes (default: 21-period).
Use Cases for Traders
✅ Day Traders: Identify momentum bursts and high-volume breakouts.
✅ Swing Traders: Use trend intensity and episodic pivots to confirm trends.
✅ Position Traders: Optimize risk with dynamic position sizing.
✅ Risk Managers: Set stop-loss levels and reverse pyramiding for controlled exposure.
Settings & Customization Overview
The Pro Volume By TradeINski indicator is a comprehensive trading tool designed to enhance volume analysis, position sizing, and trend identification. It integrates multiple trading metrics into a single dashboard, helping traders make informed decisions based on volume dynamics, momentum bursts, trend intensity, and risk management.
Key Features
1. Position Size Calculator
Helps traders determine optimal position sizes based on risk parameters:
Capital & Risk Amount: Set account size and risk per trade.
Lot Size Adjustments: Automatically calculates nearest lot size for futures trading.
Stop Loss-Based Quantity: Computes position size based on distance from stop-loss levels (LOD or mid-price).
Standard Stop Losses: Predefined stop-loss levels (1%, 1.25%, 1.5%, 1.75%) for quick risk assessment.
Reverse Pyramiding: Enhances position sizing with adjustable risk multipliers (25%, 50%).
Closing Range & Range Expansion: Measures price strength and volatility expansion.
2. Volume Analysis & Bar Coloring
Default Bar Colors: Green for bullish bars, red for bearish bars.
Dry Volume Detection: Highlights low-volume bars (below 20-period SMA) in gray.
3. Momentum Burst (MB)
Identifies high-momentum moves:
Bullish Momentum: Volume surge + price rise ≥ user-defined threshold (default: 4%).
Bearish Momentum: Volume surge + price drop ≥ user-defined threshold (default: -4%).
4. Trend Intensity (TI)
Measures trend strength using moving averages:
Fast MA (7) vs. Slow MA (65): Highlights strong bullish/bearish trends when deviation exceeds sensitivity threshold (default: 5%).
5. Anticipation (ANTS)
Detects consolidation before potential breakouts:
Price Change Range: Filters minor price fluctuations (default: -0.4% to +0.4%).
Trend Confirmation: Requires TI_65 sensitivity (default: 5%) for validation.
6. Episodic Pivot (EP)
Flags unusually high-volume bars (default: 9M+ volume) as potential trend reversal or continuation signals.
7. Data Metrics Table
Displays key trading metrics:
Trend Intensity (TI): 21-period SMA comparison.
Industry & Sector: Stock classification.
Market Cap & Free Float: Fundamental liquidity metrics.
Volume × Price (VP): Monetary value of traded volume.
Relative Volume (RV): Today’s volume vs. previous day.
Persistent Intensity (PI): Count of consecutive up closes (default: 21-period).
Use Cases for Traders
✅ Day Traders: Identify momentum bursts and high-volume breakouts.
✅ Swing Traders: Use trend intensity and episodic pivots to confirm trends.
✅ Position Traders: Optimize risk with dynamic position sizing.
✅ Risk Managers: Set stop-loss levels and reverse pyramiding for controlled exposure.
Settings & Customization
Trade Direction: Long, Short, or Both (auto-detects based on % change).
Table Positioning: Adjust location (Top/Middle/Bottom, Left/Center/Right).
Color Customization: Modify bar colors, table lines, and background.
Trade Direction: Long, Short, or Both (auto-detects based on % change).
Table Positioning: Adjust location (Top/Middle/Bottom, Left/Center/Right).
Color Customization: Modify bar colors, table lines, and background.

Highest Volume Candle Analysis @MaxMaserati# Highest Volume Candle Analysis Indicator - Trading View Publication Summary
## What is the HVC Indicator?
The "Highest Volume Candle Analysis" indicator by MaxMaserati helps traders identify significant volume events and their subsequent breakouts. This tool detects high-volume candles that exceed a customizable threshold above the average volume and tracks how price interacts with these levels.
## Core Principle: Volume-Based Support & Resistance
The fundamental concept behind this indicator is that the highest volume candles represent significant market participation and create powerful support and resistance zones. These high-volume candles should be able to push price up or down, and price should not be able to close above (bearish HVC) or below (bullish HVC) these levels.
While price may temporarily breach these levels with a wick to take liquidity, it should not be able to close beyond them if the original volume-based level is truly significant. When price does close beyond these levels, it signals a violation of supply and demand principles and indicates a significant shift in market strength - a key trading opportunity.
EXAMPLE
## Key Features
- **High Volume Detection**: Automatically identifies candles with volume exceeding your specified threshold
- **Support & Resistance Levels**: Creates dynamic support (bullish HVC) and resistance (bearish HVC) levels
- **Breakout Detection**: Tracks and visualizes when price breaks through established HVC levels
- **Volume Comparison**: Shows volume ratios between breakout candles and their corresponding HVC levels
- **VWAP Integration**: Uses Volume Weighted Average Price to filter for more significant volume events
## Customizable Parameters
- **Trend Length**: Period for EMA calculation (default: 20)
- **Volume Threshold Multiplier**: Minimum volume multiplier above average (default: 1.5)
- **VWAP Length**: Period for VWAP calculation (default: 20)
## Visual Elements
- Green lines mark bullish HVC levels (high volume bullish candles)
- Red lines mark bearish HVC levels (high volume bearish candles)
- Blue lines indicate bullish breakouts of bearish HVC levels
- Red lines indicate bearish breakouts of bullish HVC levels
- Triangle markers highlight high-volume candles
- Labels display volume information in a clean, easy-to-read format
# How to Use the HVC Indicator
## Trading with HVC Levels
- **Support & Resistance**: Green lines mark bullish HVC support levels; red lines mark bearish HVC resistance levels.
- **Respect the Close**: While price may wick through HVC levels to grab liquidity, the key signal is whether it can close beyond these levels.
- **Bounce Trades**: When price approaches but respects an HVC level on close, consider trading in the direction of the rejection.
- **Breakout Trades**: When price closes beyond an HVC level, it indicates a significant shift in market strength - a potential trend change or continuation.
- **Volume Validation**: Check the volume ratio on breakouts; higher relative volume suggests a more reliable signal.
## Quick Tips
1. Use tight stops beyond HVC levels for bounce trades.
2. Look for false breakouts (wicks beyond but closes respecting the level) for counter-trend opportunities.
3. Combine with trend analysis - HVC breakouts in the direction of the larger trend offer higher probability setups.
4. Pay attention to how aggressively price approaches HVC levels - hesitation often indicates the level will hold.
5. The most powerful signals occur when price respects multiple HVC levels or when breakouts happen with exceptional volume.

RVOL Color-Coded VolumeRVOL Color-Coded Volume Indicator
This tool visualizes volume intensity through color-coded bars in a separate panel, making it easy to identify significant market moves driven by unusual volume.
Key Features:
- Displays volume bars with varying colors and intensities based on RVOL (Relative Volume)
- Shows a customizable moving average line for volume reference
- Includes alert conditions for different RVOL thresholds
Color System:
Blue shades (Bullish):
- Light: Normal volume (RVOL < 1)
- Medium: Above average volume
- Dark: Heavy buying volume
- Solid: Extreme volume surge
Pink shades (Bearish):
- Light: Normal volume (RVOL < 1)
- Medium: Increased selling
- Dark: Heavy selling
- Solid: Extreme selling pressure
Gray shades (Neutral):
- Used when opening and closing prices are equal
- Intensity varies with RVOL level
Additional Features:
- Dotted threshold lines for easy reference
- Background highlighting for extreme volume events
- Data window shows exact RVOL values
- Multiple alert conditions for volume thresholds
The indicator helps traders spot potential trend changes and momentum shifts by highlighting unusual volume patterns without interfering with price analysis.

Volume, Volatility, and Momentum Metrics IndicatorVolume, Volatility, and Momentum Metrics Indicator
Welcome to our comprehensive TradingView indicator designed to provide traders with essential volume, volatility, and momentum metrics. This powerful tool is ideal for traders looking to enhance their market analysis by visualizing key indicators in a concise and easy-to-read format.
Key Features
1. Volume Metrics:
• Daily Dollar Volume: Understand the monetary value of the traded volume each day.
• Relative Volume (RVOL) Day: Compare the current volume to the previous day’s volume to gauge trading activity.
• Relative Volume (RVOL) 30D: Assess the average trading volume over the past 30 days.
• Relative Volume (RVOL) 90D: Evaluate the average trading volume over the past 90 days.
2. Volatility and Momentum Metrics:
• Average Daily Range (ADR) %: Measure the average daily price range as a percentage of the current price.
• Average True Range (ATR): Track the volatility by calculating the average true range over a specified period.
• Relative Strength Index (RSI): Determine the momentum by analyzing the speed and change of price movements.
3. Customizable Table Positions:
• Place the volume metrics table and the volatility/momentum metrics table in the bottom-left or bottom-right corners of your chart for optimal visibility and convenience.
Why Use This Indicator?
• Enhanced Market Analysis: Quickly assess volume trends, volatility, and momentum to make informed trading decisions.
• User-Friendly Interface: The clear and concise tables provide at-a-glance information without cluttering your chart.
• Customization Options: Choose where to display the tables to suit your trading style and preferences.
How It Works
This indicator uses advanced calculations to provide real-time data on trading volume, price range, and momentum. By displaying this information in separate, neatly organized tables, traders can easily monitor these critical metrics without diverting their focus from the main chart.
Who Can Benefit?
• Day Traders: Quickly gauge intraday trading activity and volatility.
• Swing Traders: Analyze longer-term volume trends and momentum to identify potential trade setups.
• Technical Analysts: Utilize comprehensive metrics to enhance technical analysis and trading strategies.
Get Started
To add this powerful indicator to your TradingView chart, simply search for “Volume, Volatility, and Momentum Metrics” in the TradingView public library, or use the provided link to add it directly to your chart. Enhance your trading analysis and make more informed decisions with our comprehensive TradingView indicator.

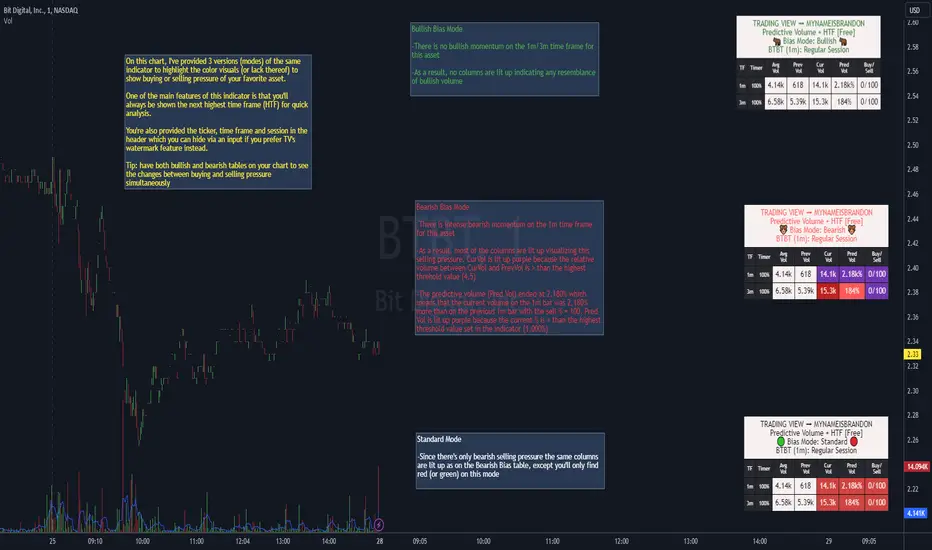
*Predictive Volume + HTF [Free]*"Predictive Volume + HTF " is a predictor of real-time to near-future volume % change on the current chart and the next highest time frame. The script calculates the volume's % change (Pred Vol) between Current Volume vs. Previous Volume by predicting whether Pred Vol will be higher or lower at the end of the current bar using an "elapsed time" vs "volume so far" concept. This gives the benefit of the most up-to-date information without artificial low/high comparisons when a bar has just formed. For example, it would be common to see -100% in a lot of instances when a new bar is just forming which would be normal because volume at the start of a new candle will generally be lower than where it was when the last bar closed. Where this indicator shines is during this old to new bar formation and the volume that's carried over to the new bar. As a result, it will now be common to see Pred Vol values starting much higher because the calculation is dividing up the bar and analyzing fractions of it instead of the entire bar that would otherwise lead to these incorrect volume % change calculations.
A few examples of Predictive Volume % Change:
In addition, this indicator uses many advanced and dynamic features:
⚡ Matrices that create the table, allowing you to add and remove columns to customize the table to show only the information that's important to you
⚡ View 2 time frames at once - meaning every time you switch time frames, the table will auto-adjust to show the next highest time frame, or "HTF"
⚡ Header function that keeps you aware of the ticker, time frame and session that you're on at all times (can use in lieu of TV's watermark feature, or use together)
⚡ Timer that shows you when a bar will begin/end
⚡ Includes the following popular time frames: 1m, 3m, 5m, 10m, 15m, 30m, 1h, 2h, 4h, 8h, 1d, week, month
⚡ 3 "bias mode" choices that use Relative Volume (RVOL) from calculations between Current, Previous & Average Volume that provide a visual with varying degrees of color representing buying & selling momentum of your favorite asset. Traders generally have an innate bias when it comes to their trading methodology. Of course it can change quickly depending on current market structure. The script's author created separate modes to account for these biases. One way to utilize the indicator is to use 2 on your chart with 1 Bullish bias \"middle right\" and another Bearish bias \"lower right\" to see if volume pressure is skewed towards your particular bias by showing how many colored boxes there are on each table.
⏩ Standard - 🟢🔴 - displays green and red to depict volume momentum using same RVOL calculations as Bullish & Bearish modes
⏩ Bullish - 🐂🐂 - displays 5 colors to represent the levels of intensity of the Buy/Sell/RVOL data (light blue, green, yellow, light orange, dark orange)
⏩ Bearish - 🐻🐻 - displays 5 colors to represent the levels of intensity of the Buy/Sell/RVOL data (light red to dark purple)
Ex. of all 3 bias modes during a burst of bullish volume momentum:
Ex. of all 3 bias modes during a burst of bearish volume momentum:
⚡ 2 alert types: 1 bullish & 1 bearish with 2 levels for each
⏩ The PREDEFINED ALERTS consist of 2 Bullish & Bearish levels with Lvl 1 designed to be less sensitive than Lvl 2
⏩ Configurable for every time frame, "On Close" or "Each Bar". On Close could be a better choice on lower time frames so that you're not getting a bunch of triggers over a short duration & Each Bar could be a better option for higher time frames so that you don't miss a move mid bar for instance
⏩ Creating a PREDEFINED BULLISH/BEARISH ALERT saves a snapshot of the alert's settings. You can then change the settings and create another alert. In this way, you can create multiple unique alerts
⏩ Create one alert for any alert type (bull and/or bear), for every time frame all at once, or you can create multiple & separate alerts, giving each one a unique name with the time frame that it's for: ex. BTC - Bullish Vol Lvl1 (1m)
In this example, you'll see what causes the alerts to trigger as well as how to create them and how they'll look when they do fire.
////////////////////////////////
It is with a sense of gratitude, appreciation and indebtedness to the coder of this script ©SimpleCryptoLife that I'm able to present this indicator to you after months of hard work. We hope that you find it invaluable during your own trading journey! Should you have any questions, feedback or critiques please do not hesitate to leave a comment.
RVol LabelThis Code is update version of Code Provided by @ssbukam, Here is Link to his original Code and review the Description
Below is Original Description
1. When chart resolution is Daily or Intraday (D, 4H, 1H, 5min, etc), Relative Volume shows value based on DAILY. RVol is measured on daily basis to compare past N number of days.
2. When resolution is changed to Weekly or Monthly, then Relative Volume shows corresponding value. i.e. Weekly shows weekly relative volume of this week compared to past 'N' weeks. Likewise for Monthly. You would see change in label name. Like, Weekly chart shows W_RVol (Weekly Relative Volume). Likewise, Daily & Intraday shows D_RVol. Monthly shows M_RVol (Monthly Relative Volume).
3. Added a plot (by default hidden) for this specific reason: When you move the cursor to focus specific candle, then Indicator Value displays relative volume of that specific candle. This applies to Intraday as well. So if you're in 1HR chart and move the cursor to a specific candle, Indicator Value shows relative volume for that specific candlestick bar.
4. Updating the script so that text size and location can be customized.
Changes to Updated Label by me
1. Added Today's Volume to the Label
2. Added Total Average Volume to the Label
3. Comparison vs Both in Single Line and showing how much volume has traded vs the average volume for that time of the day
4. Aesthetic Look of the Label
How to Use Relative Volume for Trading
Using Relative Volume (RVol) in trading can be a valuable tool to help you identify potential trading opportunities and gain insight into market behavior. Here are some ways to use RVol in your trading strategy:
Identifying High-Volume Breakouts: RVol can help you spot potential breakouts when the volume surges significantly above its average. High RVol during a breakout suggests strong market interest, increasing the probability of a sustained move in the direction of the breakout.
Confirming Trends and Reversals: RVol can act as a confirmation tool for trends and reversals. A trend accompanied by rising RVol indicates a strong and sustainable move. Conversely, a trend with declining RVol might suggest a weakening trend or potential reversal.
Spotting Volume Divergence: When the price is moving in one direction, but RVol is declining or not confirming the move, it may indicate a divergence. This discrepancy could suggest a potential reversal or trend change.
Support and Resistance Confirmation: High RVol near key support or resistance levels can indicate potential price reactions at those levels. This confirmation can be valuable in determining whether a level is likely to hold or break.
Filtering Trade Signals: Incorporate RVol into your existing trading strategy as a filter. For example, you might consider taking trades only if RVol is above a certain threshold, ensuring that you focus on high-impact trading opportunities.
Avoiding Low-Volume Traps: Low RVol can indicate a lack of interest or participation in the market. In such situations, price movements may be erratic and less reliable, so it's often wise to avoid trading during low RVol periods.
Monitoring News Events: Around significant news events or earnings releases, RVol can help you gauge the market's reaction to the information. High RVol during such events can present trading opportunities but be cautious of increased volatility and potential gaps.
Adjusting Trade Size: During periods of extremely high RVol, it might be prudent to adjust your position size to account for higher risk.
Using Relative Volume in Morning Session
If the Volume traded in first 15 minute to 30 Minutes is already at 50% or 100% depending upon the ticker, it means that it is going to have very high Volume vs average by end of the day.
This gives me conviction for Long or Short Trades
Remember that RVol is not a standalone indicator; it works best when used in conjunction with other technical and fundamental analysis tools. Additionally, RVol's effectiveness may vary across different markets and trading strategies. Therefore, backtesting and validating the use of RVol in your trading approach is essential.
Lastly, risk management is crucial in trading. While RVol can provide valuable insights, it cannot guarantee profitable trades. Always use appropriate risk management strategies, such as setting stop-loss levels, and avoid overexposing yourself to the market based solely on RVol readings.
