Titan X 📈 Titan X – Optimized Trend Strategy with Gradient ZLEMA, RMI, CCI, ROC, and Volume Confirmation
Titan X is a precision-engineered trend-following strategy designed for crypto markets and high-volatility assets. It is not just a combination of indicators, but a carefully constructed, non-repainting system where each component plays a specific role in confirming high-probability trade setups. The strategy detects strong directional moves, confirms them with momentum and volume, and manages trade exits without relying on traditional stop losses.
🔍 How the Indicators Work Together
✅ 1. ZLEMA Baseline + Gradient Filter
A Zero Lag Exponential Moving Average (ZLEMA) is used to track directional trend with minimal lag.
A gradient (slope) is calculated from the ZLEMA to measure trend acceleration. This confirms whether a trend is gaining strength or losing momentum.
Entries are only taken when the ZLEMA gradient exceeds a user-defined threshold, ensuring trades are only taken in strong, developing trends.
✅ 2. RMI – Relative Momentum Index (with Memory)
RMI captures sustained momentum direction over time.
It helps validate that price isn't just spiking, but truly trending.
Titan X uses RMI as a trend memory filter, requiring consistent momentum alignment before entry.
✅ 3. Momentum Timing – ROC + CCI
The Rate of Change (ROC) determines the strength and direction of recent momentum.
The Commodity Channel Index (CCI) checks price deviation from a moving average baseline, identifying whether momentum is aligned with market structure.
This combo prevents trades in weak, flat, or conflicting conditions.
✅ 4. Volume Spike Confirmation
Titan X uses a relative volume filter, requiring the current bar’s volume to exceed a moving average threshold.
This ensures trades are only triggered when there is clear breakout interest from market participants, helping avoid fakeouts and low-volume moves.
🎯 Trade Entry & Exit Rules
✅ Entry Conditions:
All five filters must align:
Trend direction (ZLEMA slope)
Momentum (ROC & CCI)
Trend memory (RMI)
Volume (Spike filter)
Trades are entered on the next bar after all confirmations, ensuring 100% non-repainting behavior.
✅ Take Profit System (Multi-Level TP):
TP1: Closes 50% of the position at a user-defined % gain (default: 2%)
TP2: Closes the remaining 50% of the position at a higher % gain (default: 4%)
Each TP is executed via limit order to ensure realistic and backtestable fills.
❌ No Stop Loss Used
Instead of using fixed stop losses, Titan X closes positions early when trend conditions weaken.
This dynamic exit logic is based on a reversal in ZLEMA gradient, which serves as a weak trend detection system.
⏱️ Cooldown Logic
A 1-bar cooldown is enforced between trades to avoid same-bar exit/entry violations on TradingView.
This improves execution accuracy and avoids overtrading on choppy price action.
📊 Real-Time Strategy Dashboard
Titan X includes a live dashboard that provides full transparency:
Current Position (Long / Short / Flat)
Entry Price
TP1 Hit? / TP2 Hit?
Bars Since Entry
Win Rate (%)
Profit Factor
Ideal for both manual monitoring and automated bot strategies.
🔔 Bot-Ready Multi-Exchange Alerts
Alerts can be configured for:
ENTER-LONG, ENTER-SHORT
EXIT-LONG, EXIT-SHORT
TP1 / TP2 targets
Messages are fully customizable and designed for platforms like:
WonderTrading
3Commas
TradingConnector
⚙️ Designed For:
Timeframes: 1H and 4H (optimized for crypto)
Markets: Altcoins, BTC/ETH, high-volatility pairs
Traders: Trend-followers, momentum scalpers, algo bot users
Goal: High accuracy entries, structured exits, zero repainting, and flexible trade management
⚠️ TradingView Disclosure
This strategy is provided for educational purposes only. It does not constitute investment advice, nor does it guarantee any returns. Trading carries risk; test thoroughly before using in live environments.
"relative volume" için komut dosyalarını ara

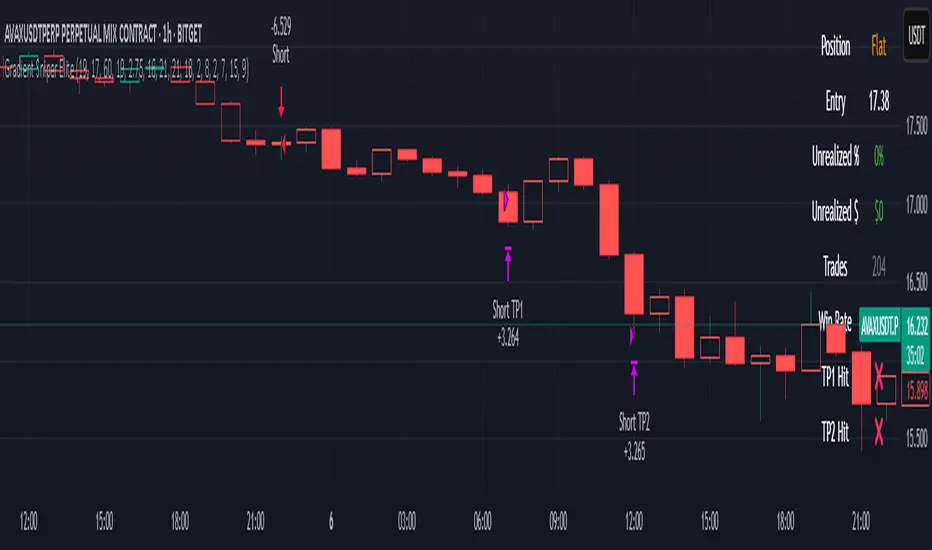
Gradient Sniper Elite🧠 Gradient Sniper Elite — Precision Trend Detection and Tactical Trade Execution for Crypto
Gradient Sniper Elite is a high-performance crypto trend strategy engineered for accuracy, adaptability, and smart execution on the 1-hour timeframe. This script is not just a mashup — it's a purpose-built system that combines trend, momentum, and volume filters in a structured and non-repainting framework designed for optimal entry and exit timing.
🔍 What Makes It Original?
This strategy combines several proven concepts into a unified, precision-calibrated trade engine:
✅ ZLEMA Gradient Filter: A slope-based trend filter that captures the direction and strength of momentum shifts without repainting.
✅ TEMA Confirmation: Triple EMA logic confirms trend acceleration or exhaustion by analyzing layered EMA cross-smoothing.
✅ RMI-Based Trend Direction: Replaces traditional RSI with a Relative Momentum Index (RMI), which smooths price momentum and avoids lag.
✅ ROC & Smoothed CCI: Dual momentum filters ensure that trades align with both velocity and structure of price moves.
✅ Volume Spike Filter: Filters out false breakouts and manipulation by confirming entries only during statistically significant volume surges.
✅ TP1/TP2 Split Take Profit Logic: 50% partial exit at TP1 and full exit at TP2. Ensures flexible profit-taking while maximizing trend continuation gains.
✅ Trend Weakness Exit: Trades are exited cleanly when the trend begins to weaken (as confirmed by RMI flip), preventing overstay and drawdown.
✅ 1-Bar Reversal Delay: The system enforces a 1-bar delay between a trade closure and any potential reversal entry, ensuring clean trend reversals and realistic live trading behavior.
✅ No Stop Loss: This strategy does not use a stop loss. Instead, it exits trades based on trend weakness or TP2 being hit. This avoids premature exits in volatile crypto environments, while maintaining controlled and dynamic trade management logic.
⚙️ How It Works
This strategy uses multi-layered confirmation:
Trend Structure
ZLEMA Gradient: Captures the slope of price action.
White Line + Fast/Slow Tether Lines: Define macro trend structure and act as dynamic S/R filters.
Momentum Alignment
Rate of Change (ROC): Measures directional velocity.
Smoothed CCI: Refines entry timing within the trend.
TEMA: Adds second-layer trend confirmation.
Volume Confirmation
Entry signals are validated by detecting relative volume spikes compared to a moving average baseline, avoiding entries on low-volume or fake breakouts.
Trade Management
Dynamic take-profits (TP1/TP2).
Immediate exit on trend weakening.
No same-bar entry/exit — reversal entries are delayed until after full exit confirmation.
No stop loss — trade management is handled via trend logic and take profit levels.
📊 Dashboard Overview
Gradient Sniper Elite includes a built-in dashboard in the top-right corner of the chart. It dynamically updates on each bar and shows:
📍 Position: Displays "Long", "Short", or "Flat" depending on the active trade
💰 Entry Price: The exact price where the trade was entered
📈 Unrealized %: Current profit/loss as a percentage
💵 Unrealized $: Estimated PnL in dollars, scaled to your backtest capital
📊 Trades / Win Rate: Live counter for total trades, win/loss count, and win rate
🎯 TP1 Hit / TP2 Hit: Shows ✅ or ❌ depending on whether each target level was reached during the current trade
This dashboard helps you monitor trade status, track live performance, and validate signal behavior in real time — all without repainting or relying on external tools.
📈 How to Use
Timeframe: Optimized for the 1-hour timeframe, but adaptable.
Asset Class: Primarily built for crypto markets, especially fast-moving alts like AVAX, LINK, QNT, etc.
Trade Mode: Supports long and short trades with clean reversal logic.
Dashboard: Live stats including position status, TP1/TP2 hit, win rate, and real-time PnL tracking.
Backtest Ready: Built with full compliance to TradingView backtest engine — results are realistic and match live-bar behavior.
⚠️ No Repainting — No Guesswork
Every element in this script is designed to work with confirmed bar data only. There is zero forward-looking logic. This makes Gradient Sniper Elite fully compatible with both backtesting and live algo execution.
🧩 Why This Isn’t Just a Mashup
Each indicator in this strategy has a specific role:
ZLEMA: Core trend slope engine.
TEMA: Trend reinforcement.
RMI: Directional decision layer.
CCI & ROC: Entry timing refinement.
Volume Filter: Risk filtering.
They’re not merged randomly, but combined in sequence to eliminate noise and optimize entries.
📌 Disclaimer
This script is for informational and educational purposes only. It does not constitute financial advice or a recommendation to buy or sell any asset. Always do your own research and use appropriate risk management when trading. Past performance does not guarantee future results.
Psych Level ScreenerThis Script is intended for Pine Screener and is not designed as a indicator!!!
Pine Screener is something TradingView has recently added and is still only a Beta version.
Pine Screener itself is currently only available to members that are Premium and above.
What it does:
This screener will actively look for tickers that are close to Pysch level in your watchlist.
Psych level here refers to price levels that are round numbers such as 50,100,1000.
Users can specify the offset from a psych level (in %) and scanner will scan for tickers that are within the offset. For example if offset is set at 5% then it will scan for tickers that are within +/-5% of a ticker. (for $100 psych level it will scan for ticker in $95-105 range)
Once scan is completed you will be able to see:
- Current price of ticker
- Closest psych level for that ticker
- % and $ move required for it to hit that psych level
- Ticker's day range and Average range (with % of average range completed for the day)
- Ticker volume and average volume
Setting up:
www.tradingview.com
Above link will help you guide how to setup Pine screener.
Use steps below to guide you the setup for this specific screener:
1. Open Pine Screener (open new tab, select screener the "Pine")
2. At the top, click on "Choose Indicator" and select "Psych Level Screener"
3. At the top again, click "Indicator Psych Level Screener" and select settings.
4. Change setting to your needs. Hit Apply when done.
a)"% offset from Psych Level" will scan for any stocks in your watchlist which are +/- from the offset you chose for any given psych level. Default is 5. (e.g. If offset is 5%, it will scan for stocks that are between $95-$105 vs $100 psych level, $190-$210 for $200 psych level and so on)
b) ATR length is number of previous trading days you want to include in your calculation. Moving Average Type is calculation method.
c) Rvol length is number of previous trading days you want to include in your calculation.
5. On top left, click "Price within specified offset of Psych. Level" and select true. Then select "Scan" which is located at the top next to "Indicator Psych Level Screener". This will filter out all the stock that meets the condition.
6. At the end of the column on the right there is a "+" symbol. From there you can add/remove columns. 30min/1hr/4hr/1D Trend are disabled by default so if this is needed please enable them.
7. You can change the order of ticker by ascending and descending order of each column label if needed. Just click on the arrow that comes up when you move the cursor to any of the column items.
8. You can specify advanced filter settings based on the variables in the column. (e.g., set price range of stock to filter out further) To do so, click on the column variable name in interest, located above the screener table (or right below "scan") and select "manual setup".
How to read the column:
Current Price: Shows current price of the ticker when scan was done. Currently Pine Screener does NOT support pre/post-hours data so no PM and AH price.
Psych Level: Psych level the current price is near to.
% to Psych Level: Price movement in % necessary to get to the Psych level.
$ to Psych Level: Price movement in $ necessary to get to the Psych level.
DTR: Daily True Range of the stock. i.e. High - Low of the ticker on the day.
ATR: Average True Range of stock in the last x days, where x is a value selected in the setting. (See step 3 in Previous section)
DTR vs ATR: Amount of DTR a ticker has done in % with respect to ATR. (e.g., 90% means DTR is 90% of ATR)
Vol.: Volume of a ticker for the day. Currently Pine Screener does NOT support pre/post-hours data so no PM and AH volume.
Avg. Vol: Average volume of a ticker in the last x days, where x is a value selected in the setting. (See step 3 in Previous section)
Rvol: Relative volume in percentage, measured by the ratio of day's volume and average volume.
30min/1hr/4hr/1D Trend: Trend status to see if the chart is Bullish or Bearish on each of the time frame. Bullishness or Bearishness is defined by the price being over or under the 34/50 cloud on each of the time frame. Output of 1 is Bullish, -1 is Bearish. 0 means price is sitting inside the 34/50 cloud. Currently Pine Screener does NOT support pre/post-hours data so 34/50 cloud is based on regular trading hours data ONLY.
Some things user should be aware of:
- Pine Screener itself is currently only available to TradingView members with Premium Subscription and above. (I can't to anything about this as this is NOT set by me, I have no control) For more info: www.tradingview.com
- The Pine Screener itself is a Beta version and this screener can stop working anytime depending on changes made by TradingView themselves. (Again I cannot control this)
- Pine Screener can only run on Watchlists for now. (as of 03/31/2025) You will have to prepare your own watchlists. In a Watchlist no more than 1000 tickers may be added. (This is TradingView rules)
- Psych level included are currently 50 to 1500 in steps of 50. If you need a specific number please let me know. Will add accordingly.
- Unfortunately this screener does not update automatically, so please hit "scan" to get latest screener result.
- I cannot add 10min trend to the column as Pine Screener does NOT support 10min timeframe as of now. (03/31/2025)
- This code is only meant for Pine Screener. I do NOT recommend using this as an indicator.
- Currently Pine Screener does NOT support pre/post-hours data. So data such as Price, Volume and EMA values are based on market hours data ONLY! (If I'm wrong about this please correct me / let me know and will make look into and make changes to the code)
Other useful links about Pine Screener:
Quick overview of the Screener’s functionality: www.tradingview.com
what do you need to know before you start working? : www.tradingview.com
These links will go over the setting up with GIFs so is easier to understand.
-----------------------------------------------------------------------------------------------------------------
If there are other column variables that you think is worth adding please let me know! Will try add it to the screener!
If you have any questions let me know as well, will reply soon as I can!
Have a good trading day and hope it helps!

Gabriel's Global Market CapGabriel's Global Market Cap is a comprehensive financial indicator designed to track and analyze the total market capitalization across multiple asset classes. It incorporates various financial markets, including stocks, bonds, real estate, cryptocurrencies, commodities, derivatives, private equity, insurance, OTC markets, and natural resources, to provide a holistic view of global market dynamics.
This indicator integrates Ehlers' Adaptive Dominant Cycle Detection and a custom VIX formula to adjust market values based on volatility and volume fluctuations, allowing for a more refined understanding of market conditions.
Key Features
✅ Multi-Market Analysis – Tracks 10+ global financial sectors, each represented by a key ETF or index.
✅ Normalization & Readability – Converts market cap values into an easy-to-read format (Millions, Billions, Trillions, Quadrillions).
✅ Volatility & Volume Adjustments – Optional VIX-based smoothing and relative volume adjustment for more dynamic readings.
✅ Ehlers’ Cycle Detection – Utilizes dominant cycle length detection to uncover market rhythms and cyclic behavior.
✅ Risk Thresholds & Background Coloring – Identifies overbought and oversold conditions with cyclic bands and background shading.
✅ Customizable Inputs – Users can toggle different market categories on/off for focused analysis.
✅ Interactive Data Table – Displays real-time values for each asset class in a structured table format.
Market Categories & Data Sources
📈 Global Stock Market – iShares MSCI ACWI ETF (ACWI)
💰 Global Bond Market – Vanguard Total World Bond ETF (BNDW)
🏡 Real Estate Market – iShares Global REIT ETF (REET)
₿ Cryptocurrency Market – Total Crypto Market Cap (CRYPTOCAP:TOTAL)
🌾 Commodities Market – Invesco DB Commodity Index Fund (DBC)
📊 Derivatives Market – CME Group (CME)
🏦 Private Equity & VC – ProShares Global Listed Private Equity ETF (PEX)
🛡️ Insurance Market – SPDR S&P Insurance ETF (KIE)
💹 OTC Markets – OTC Markets Group (OTCM)
⛽ Natural Resources – iShares Global Energy ETF (IXC)
Technical Enhancements
1️⃣ Custom Volatility Index (VIX) Calculation (Work In Progress)
Adjusts asset values based on volatility conditions using Ehlers' Cycle Detection.
Higher VIX reduces market cap, while lower VIX stabilizes it.
2️⃣ Adaptive Market Normalization
Converts absolute market values into a relative strength scale (0-100) for better visual analysis.
Uses historical min/max values to adjust dynamically.
3️⃣ Cyclic Analysis & Overbought/Oversold Levels
Detects hidden market rhythms & time cycles.
Calculates upper and lower risk bands based on dominant cycle length.
Applies background shading for visualizing low or high risk periods.
Customization Options
🔧 Enable/Disable Market Categories – Select which asset classes to track.
📊 Toggle VIX & Volume Smoothing – Adjust how market cap reacts to volatility & volume.
🎨 Cyclic Risk Bands – Highlight overbought/oversold conditions with dynamic background colors.
Visual Elements
📉 Market Cap Trends – Each category is plotted with a unique color.
🌎 Total Global Value (TGV) – A combined index representing all selected markets.
🎨 Background Coloring – Indicates high/low risk periods.
📋 Real-Time Data Table – Displays normalized & raw market cap values in an easy-to-read format.
Practical Applications
📊 Macroeconomic Analysis – Track global liquidity and investment shifts across asset classes.
💹 Volatility & Risk Assessment – Identify high-risk market conditions based on cyclic behavior.
📈 Cross-Market Comparisons – See which sectors are leading or lagging in value growth.
🔍 Crypto & Stock Market Trends – Analyze how traditional and digital assets correlate.

Zanger Volume Ratio (ZVR)Zanger Volume Ratio (ZVR)
Credits:
Most of the underlying code and logic in this script have been adapted from the work originally published by The_Peaceful_Lizard
Overview
The Zanger Volume Ratio (ZVR) is a powerful indicator designed to reveal market dynamics by comparing current cumulative volume to an average determined over a historical look-back period. It uses the concept of relative volume to not only highlight unusual volume spikes, but also uses color to illustrate how today's trading compares to typical levels. This unique method of volume analysis was popularized by Dan Zanger - a trader known for turning $10,775 into $18,000,000 in less than two years - by identifying key shifts in market interest and volume behavior.
Key Features
Volume Pacing Analysis:
The script calculates a volume delta by comparing the cumulative volume at any given moment to an average derived over a user-defined lookback period (Default 20-day). The resulting percentage difference offers a clear visualization and insight into unusual volume activity.
Dynamic Visual Representation:
Choose between either “Columns” or “Area” plot styles to display the percent difference. Additionally, you have the option to switch between a standard plot or a background color display, with customizable transparency, ensuring the indicator fits seamlessly with your chart’s aesthetics.
Dashboard Integration:
A simple dashboard table is displayed on the chart, showcasing the current ZVR value in real-time. With user-configurable position, text size, alignment, and color options, this feature ensures that the key metric is always visible and easy to interpret.
Why Use the Zanger Volume Ratio?
The ZVR is more than just a volume indicator. It acts as a window into market sentiment by highlighting days when trading interest intensifies. Many traders believe that an unusually high volume ratio may confirm trend strength or signal a reversal, making the indicator a valuable tool when used in conjunction with other technical analysis methods.
Whether you’re monitoring stocks, commodities, or forex markets, the Zanger Volume Ratio offers an accessible yet sophisticated method to decode volume dynamics. Its practical design and real-time visual feedback provide traders of all experience levels with critical data to spot high-potential setups.
Chart Description
First Pane: normal Volume Indicator on the foreground, ZVR as Background colors
Second Pane: ZVR Indicator with Column Style (default)
First panel: normal volume indicator in foreground, ZVR as background colors
Second panel: ZVR indicator with column style (default)
Note: This indicator is intended for use on intraday charts only!

Quaterly Earnings,Sectors/Industry,Moving AveragesDescription:
The EPS & Revenue indicator is designed to provide detailed financial insights into a company's performance by displaying key financial metrics such as Earnings Per Share (EPS), Total Revenue, Free Float, Operating Income, and Return on Equity (ROE). The indicator also calculates and visualizes the percentage changes in these metrics over different quarters, offering a comprehensive view of the company's financial health.
Features:
Table Display:
A customizable table that can be positioned in various locations on the chart (e.g., top left, top center, bottom right, etc.).
Color-coded cells to indicate positive and negative changes in financial metrics.
Dynamic text size and color for better readability.
Financial Metrics:
EPS (Earnings Per Share): Displays the EPS values for the current and previous quarters.
Total Revenue: Shows revenue values in crores (Cr) for multiple quarters.
Free Float: Represents the number of freely floating shares.
Operating Income (OP): Indicates the operating income for the company.
Return on Equity (ROE): Displays the ROE values for multiple quarters.
Calculations:
EPS Year-over-Year (YoY) Change: Calculates the YoY percentage change in EPS.
Quarter-over-Quarter (QoQ) Change: Computes the percentage change in EPS and sales for different quarters.
Sales in Crores: Displays sales values in crores (Cr) and calculates the QoQ changes.
Operating Profit Margin (OPM): Calculates the operating profit margin as a percentage of sales.
52-Week High/Low: Shows the highest and lowest prices over the past 52 weeks.
Average Daily Range (ADR): Computes the average daily range percentage.
Turnover: Displays the average turnover period and current turnover values.
Relative Volume (Rvol): Indicates the relative trading volume compared to the average.
Color Coding:
Uses different colors to highlight significant changes in metrics (e.g., dark green for strong positive changes, light green for moderate positive changes, red for negative changes).
Adjustable transparency based on the magnitude of the change.
Customization:
User inputs for table position, color settings, and calculation periods for turnover and relative volume.
Text labels for various columns and rows in the table to enhance clarity.
How to Use:
Add the EPS & Revenue indicator to your TradingView chart.
Customize the table position and color settings as per your preference.
Analyze the displayed financial metrics and percentage changes to gain insights into the company's performance.
Use the color-coded cells to quickly identify significant changes and trends in EPS, revenue, operating income, and other key metrics.
Example Output:
The table will display current and past EPS values, percentage changes in EPS and sales, operating profit margins, ROE values, turnover, relative volume, and the percentage up from 52-week low and down from 52-week high.
The data will be color-coded to indicate positive and negative changes, making it easier to interpret the company's financial performance at a glance.
This indicator is ideal for investors and traders who want to keep a close eye on a company's financial health and make informed decisions based on detailed financial data.

Enhanced Volume Profile [TFO]The Enhanced Volume Profile analyzes volume by price to find potential inflection points that we can reference in future price action.
The volume profiles altogether are simply an estimation from price/volume data that TradingView is capable of providing. Below is an example of 1 day volume profiles. The left chart uses 50 rows for each profile, while the right chart uses 500 rows. As a result, the right chart is capable of providing much greater detail.
Profile Timeframe specifies the timeframe of the profile to be constructed. When set to 1 day for example, then each profile represents the price/volume data from 1 daily bar.
Resolution Timeframe is the timeframe of price/volume data used to construct the profile. Lower timeframes result in higher resolution, but also greater computation time.
Below is an example of 1 day volume profiles. Both charts are using 250 rows for every profile, but the left chart is using a 15m resolution timeframe, while the right chart is using a 1m resolution timeframe. The lower timeframe data on the right chart allows for greater detail than the left.
Volume Point of Control (VPOC) shows the price level where the most volume was traded during a given session. Show VPOCs will draw these levels on each volume profile, with the corresponding color. In the following chart, each solid blue line represents a VPOC for the corresponding session.
Extend Recent VPOCs will track the N most recent VPOC levels, and extend them to the right side of the chart for easy visual reference. Show VPOC Labels will annotate each VPOC extension with the date (and time, for lower timeframes) that each corresponding profile began. Below is an example where Extend Recent VPOCs and Show VPOC Labels are both enabled.
Show Previous HVN will show High Volume Nodes from previous sessions, and extend them until price trades through them. When a session ends, any new HVNs located above that close price will be red while any HVNs below will be green (default colors).
HVNs are validated with a strength parameter that compares the peak volume to its neighboring levels to determine local extremes, along with a percentile filter to optionally specify if valid nodes must contain a peak volume greater than X% of the volume traded at VPOC.
The same capabilities exist for Low Volume Nodes as well. Show Previous LVN will extend these Low Volume Nodes from previous sessions until price trades through them.
The default color scheme will color nodes proportionate to the individual session. For example, a HVN derived from VPOC would always result in the deepest possible color because the node's peak contains the highest volume traded for that session. Every lesser node would be colored lighter than this, proportional to that session's VPOC.
We can also choose to color these nodes in a way that reflects their relative volume compared to recent sessions. For HVNs, darker colors imply more volume was traded at said nodes while lighter colors imply less volume. In the following example, the left chart uses the session based color scheme while the right chart uses the historical color scheme.

Liquidation Levels with Liquidity Sweeps/Breakouts [AlgoAlpha]🌊📈 Dive into the depths of market liquidity with "Liquidation Levels with Liquidity Sweeps/Breakouts" - your ultimate tool for navigating the turbulent waters of trading! 🧹💹 Crafted by the wizards at AlgoAlpha, this Pine Script™ masterpiece illuminates the unseen liquidity levels and sweeps, guiding you through the financial seas with insight. 🚀🔍
Key Features:
🕒 Timeframe Flexibility: Customize your analysis with a TimeFrame Multiplier, allowing the indicator to operate on higher timeframes for broader market insight.
💥 Dynamic Volume Threshold: Set your sensitivity to breakouts with the High Volume Threshold, ensuring you catch significant market movements while avoiding fakeouts.
👀 Visibility Controls: Toggle the display of swept liquidity and highlight liquidity breakouts with customizable background colors for clear, actionable insights.
🎨 Custom Appearance: Personalize your chart with bullish, bearish, and breakout colors to match your trading style.
How to Use the Liquidity Levels with Liquidation Sweeps Indicator:
Maximize your trading efficiency with the Liquidity Levels with Liquidation Sweeps Indicator by following these simple steps! 🚀🌟
⚙️ Customize Settings: Access the indicator settings to personalize the TimeFrame Multiplier, High Volume Threshold, and Relative Volume Period. Tailor these settings to match your trading strategy and chart preferences.
👁️ Analyze Liquidity Levels: Monitor the chart for liquidity levels and sweeps. Bullish sweeps are marked with green labels, bearish sweeps with red, and breakouts highlighted by the chart background.
🔔 Set Alerts: Enable alert conditions for liquidity breakouts and sweeps within the indicator's settings. This feature allows you to receive real-time notifications, helping you to act promptly on trading opportunities.
How It Works:
The heart of this indicator lies in its ability to track and highlight liquidity levels derived from swing pivots, and sweeps across multiple timeframes. By calculating relative volume against a user-defined threshold, it identifies strong volume movements indicative of liquidity breakouts, this helps filter out fake-outs. When a liquidity level is breached but not completely mitigated, it's either marked as a bullish or bearish sweep, which come with the option to show an estimate of the number of liquidations during the sweep.
if peakform and peakprinted != 1
aR.push(line.new(bar_index-mult, h.get(1), bar_index+1, h.get(1), color = red))
aRv.push(h.get(1))
peakprinted := 1
if valleyform and valleyprinted != 1
aS.push(line.new(bar_index-mult, l.get(1), bar_index+1, l.get(1), color = green))
aSv.push(l.get(1))
valleyprinted := 1

RVOL/ExpVol/ATR/ExpRGives 4 values:
- Relative Volume: needs the first 5M candle to have closed to give a good value then updates every 5 minute throughout the day. Compares to the historical Volume on the last 30 days on the SAME time period from Open.
Most indicators compare to the average volume on any 30min period, thus highly overestimating the RVOL at Open when Volume is higher.
- Expected Volume on the day in Million of shares given the RVOL.
- Average True Range on the last 14 days
- Expected Range on the day given the ATR & the RVOL.
Warning: Expected Range is just an estimation from data I gathered but the Day's range can be way higher or lower than that. Also if RVOL > 3 then the estimation works less & less.
As this was originally coded just for me I don't ask user input for things like the lookback period or the refresh period. You have to make a copy & go in the code and modify it if you want to change it.
Also the data displayed is given for the candle on which your cursor is !
Works best on 5-minute and above chart timeframes.

[TTI] Zanger Volume Ratio - Intraday––––HISTORY & CREDITS 🏦
The Zanger Volume Ratio - Intraday indicator is inspired by the work of Dan Zanger, a renowned trader and creator of the Zanger Volume Ratio tool. This specific adaptation of the ratio is designed for the TradingView platform and focuses on intraday trading. Dan Zanger used this same method of reading the chart to establish a world record in turning HKEX:10 ,775 into HKEX:18 ,000,000 in under 2 years.
––––WHAT IT DOES 💡
The Zanger Volume Ratio - Intraday indicator measures the estimated end-of-day volume percentage based on intraday (depending on the timeframe of your chart) comparisons for the last X days (input in the settings). It provides insights into the stock's trading volume in real-time throughout the trading day, giving traders an idea of the stock's relative volume compared to its recent trading history. For instance if you add it to a 5min chart the ratio represents the estimated end of day volume percent based on the last 3 days, the indicator will compare the cumulative volume of the current day to the X days back cumulative average up to that same point in time and tell you how it is around the thresholds.
The indicator categorizes the volume into five levels: Extreme, High, Average, Light, and Dry Up, each represented by different colors on the chart. It also displays a pace indicator, which shows whether the volume is increasing or decreasing during the trading session.
There is also a label that shows the current reading and its pace. The pace is the indication wether the volume ratio pace is increasing and picking up or it is slowing down.
Thesholds
👉EXTREME (red): >200, means "Volume is 200% of average daily volume
👉HIGH (magenta): 110
👉AVERAGE (peach): 85
👉LIGHT (orange): 60
👉DRY (gray): <60
––––HOW TO USE IT 🔧
To use the Zanger Volume Ratio - Intraday indicator effectively, follow these steps:
1️⃣ Apply the indicator to your TradingView chart with an intraday timeframe (>=1min and less than 1 day).
2️⃣Observe the real-time volume levels and their corresponding categories (Extreme, High, Average, Light, and Dry Up) to understand the current volume dynamics.
3️⃣Keep an eye on the pace indicator (arrows) to see if the volume is increasing or decreasing during the session.
4️⃣Use the information provided by the indicator to confirm trade setups, identify potential breakouts, or detect possible reversals. For example, a stock breaking out of a key area with high or extreme volume and an increasing pace arrow may indicate a strong upward move. Conversely, a stock pulling back on light or dry up volume could signal a continuation of the trend once the volume picks up again.
Remember to combine the Zanger Volume Ratio - Intraday indicator with other technical analysis tools and your own trading strategy to make informed decisions.

Equivolume - volume as candle widthDo price action and volume really need to be on separate graphs? Why not display them both on a single graph and reduce the clutter? Presenting Equivolume candles here on TradingView - inspired by the NinjaTrader implementation
This indicator allows you to view traditional OHLC candles but with the additional ability to see relative volume through variations of width and/or transparency
Explanation
- Wide and/or full colour candles have the highest volume
- Thin and/or highly transparent candles have the lowest volume
- The following diagram shows the Equivolume indicator as well as a traditional volume graph along the bottom. You can see that when the volume is highest, the candle is widest and also the most intense color.
- The `Lookback candle count` user parameter specifies the number of candles to use in order to locate the highest volume within that range. All other candle widths in the range will be adjusted relative to this highest volume
Tips
- Toggle off the visibility of the original graph for the instrument to get the best view of the candles when using variable transparency
Gotchas
- Due to a Pine Script limitation a maximum of 500 variable width candles can be drawn on the chart
- If `Lookback candle count` is higher than the total number of available candles for the instrument, then the indicator will fail and not display anything. I’m still investigating how to handle this case better
- Be aware if you are using the `High` setting for the `Transparency range` parameter, candles with the lowest volume will be virtually invisible

[KL] Relative Volume StrategyThis strategy will Long when:
Confirmation #1: when volume is relatively high
Confirmation #2: during periods of price consolidation (See )
It exits when either (a) stop loss limit is reached, or when (b) price actions suggest trend is bearish.
Measuring price volatility to assume consolidation:
For each candlestick, we quantify price volatility by referring to the value of standard deviations (2x) of closing prices over a look-back period of 20 candles. This is exactly what the Bollinger Band (“BOLL”) indicates by default.
Knowing the value of standard deviation (2x) of prices (aka the width of lower/upper BOLL bands), we then compare it with ATR (x2) over a user-defined length (can be configured in settings). Volatility is considered to be low, relatively, when the standard deviation (x2) of prices is less than ATR (2x).

Spread AnalyzerThis script plots the relative performance of the viewed security with respect to a selected benchmark. It can be used to identify assets higher than market average potential.
- The plot above is the relative volume.
- The plot below is the relative performance.
Computation is done by applying stochastic to the spread of the asset's current price/obv value to the benchmark defined by the Part1, 2 and 3.
The benchmark can be a portfolio as well:
Part1 = 4*SPY+2*QQQ
Part2 = XAUUSD+EURUSD
-PS: Each part may contain up to 10 symbols.
- The spread is calculated with the following formula
close / (Part1 + Part2 + Part3)
- Color code is based on the stochastic of macd of the spread.
The inputs:
length : lookback length for the stochastic
lenk : Smoothing factor(K) for stochastic
lend : EMA length(D)
MACD Fast / Slow / Smooth : MACD parameters used to determine the color code

Volume+ (RVOL/Alerts)This indicator colors the volume bars based on any of the three follow criteria:
- Volume Amount
- RVOL (Relative Volume)
- Lookback (Highest Over Period)
You can use one, two or all three of these settings at the same time.
You can also set alerts with this indicator. The script will trigger an alert whenever any of the three specified flags are triggered.
RVOL is calculated as: Volume divided by Moving Average value. You can change the moving average period (and type) in the settings.
BTC Volume Stacked [v2018-11-17] @ LekkerCryptisch.nlCombine the volume of 8 BTCUSD(T) exchanges in one graph.
Two use cases:
1) Stack the absolute volume to see the combined volume in BTC over time.
2) Stack the relative volume to see the relative size of exchange change over time.

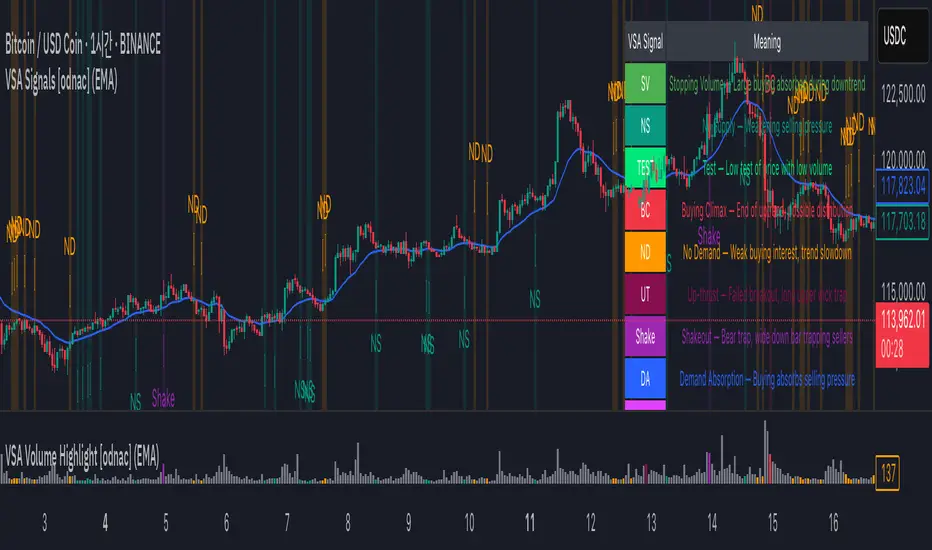
VSA Signals [odnac]This indicator applies Volume Spread Analysis (VSA) concepts to highlight important supply and demand events directly on the chart. It automatically detects common VSA patterns using price spread, relative volume, and candle structure, with optional trend filtering for higher accuracy.
Features:
Stopping Volume (SV): Signals potential end of a downtrend when heavy buying appears.
Buying Climax (BC): Indicates exhaustion of an uptrend with heavy volume near the top.
No Supply (NS): Weak selling pressure, often a bullish sign in an uptrend.
No Demand (ND): Weak buying interest, often a bearish sign in a downtrend.
Test: Low-volume test bar probing for supply.
Up-thrust (UT): Failed breakout with long upper wick, often a bearish trap.
Shakeout: Bear trap with high-volume wide down bar closing low.
Demand Absorption (DA): Demand absorbing heavy selling pressure.
Supply Absorption (SA): Supply absorbing heavy buying pressure.
Additional Options:
Background highlights for detected signals.
Configurable moving average (SMA, EMA, WMA, VWMA) as a trend filter.
Adjustable multipliers for volume and spread sensitivity.
Legend table for quick reference of signals and meanings.
Alerts available for all signals.
This tool is designed to help traders spot professional accumulation and distribution activity and to improve trade timing by recognizing supply/demand imbalances in the market.
Breakout Volume Momentum [5m]Breakout Volume Momentum Indicator (Pine Script v5)
This TradingView Pine Script v5 indicator plots a green dot below a 5-minute price bar whenever all the breakout and volume conditions are met. It is optimized for live intraday trading (not backtesting) and includes customizable inputs for thresholds and trading session times. Key features and conditions of this indicator:
Gap Up Threshold: Current price is up at least X% (default 20%) from the previous day’s close (uses higher-timeframe daily data) before any signal can trigger.
Relative Volume (RVOL): Current bar’s volume is at least Y× (default 2×) the average volume of the last 20 bars. This ensures unusually high volume is present, indicating strong interest.
Trend Alignment: Price is trading above the VWAP (Volume-Weighted Average Price) and above a fast EMA. In addition, the fast EMA (default 9) is above the slower EMA (default 20) to confirm bullish momentum
tradingview.com
tradingview.com
. These filters ensure the stock is in an intraday uptrend (above the average price and rising EMAs).
Intraday Breakout (optional): Optionally require the price to break above the recent intraday high (default last 30 bars). If enabled, a signal only occurs when the stock exceeds its prior range high, confirming a breakout. This can be toggled on/off in the settings.
Avoid Parabolic Spikes: The script skips any bar with an excessively large range (default >12% from low to high), to avoid triggering on spiky or unsustainable parabolic candles.
Time Window Filter: Signals are restricted to a specific session window (by default 09:30 – 11:00 exchange time, typically the morning session) and will not trigger outside these hours. The session window is adjustable via inputs
stackoverflow.com
.
Alerts: An alert condition is provided so you can set a Trading View alert to send a push notification when a green dot signal fires. The alert message includes the ticker and price at the time of signal.

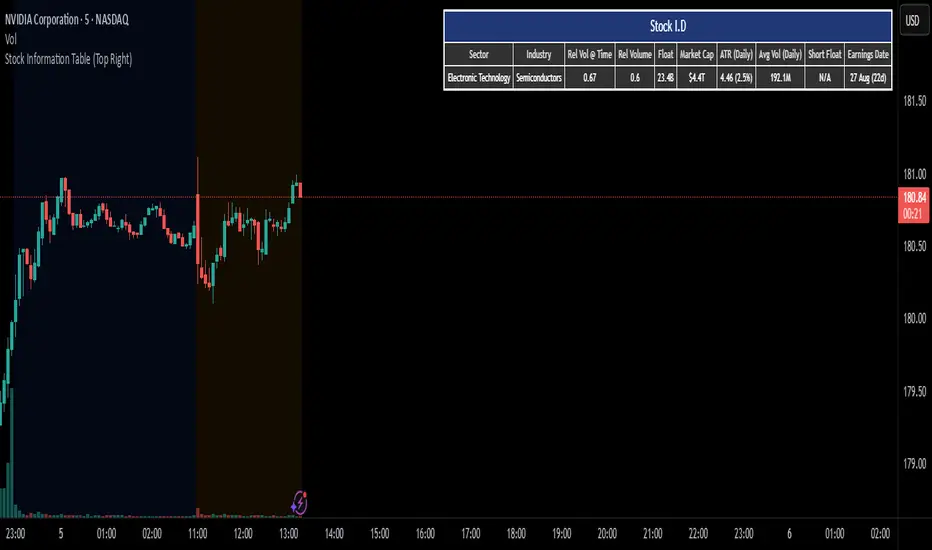
Stock I.Dshows information on a given stock for intra day trading
1. sector
2. industry
3. relative volume at time
4. relative volume
5. float
6. market cap
7. average true range(daily)
8. average volume (daily)
9. short float
10. earnings date
Realistic Trader Volume, Consolidation, Zones v.2Realistic Trader Volume, Consolidation, Zones v.2
This volume-focused indicator gives you a clean, high-resolution view of market momentum and consolidation, without relying on a traditional volume panel.
A more intuitive volume tool that highlights relative volume conditions directly on candles
Surge bars color-coded based on context:
→ Green = Bullish Volume
→ Red = Bearish Volume
→ Gray = Continuation / Decline
Consolidation zones shown with white candles, identifying both currently forming and historical bases
Yellow arrows indicate consolidation breaks with volume surges, suggesting key shifts in momentum
Can help confirm when the market is likely to accelerate during a session
Useful for spotting early signs of reversals: Green after selloffs = potential buyers stepping in; Red after rallies = potential sellers stepping in
Zones can be manually drawn around a yellow arrow and its preceding white candle for more visual clarity
The bigger the green or red surge bar following a yellow arrow, the more powerful the zone
Works across all timeframes
Best used in combination with:
Realistic Trader Prior Days Levels & Zones
Realistic Trader Intraday Dynamic Zones & Levels
Realistic Trader Early Price Breaks & Confirmation (15min Only)
Realistic Trader Directional Bias
Pro Tip:
Yellow arrows mark key moments when consolidation ends and volume spikes begin. The taller the breakout candle that follows the yellow arrow, the stronger and more reliable the resulting zone is likely to be.
NQ Phantom Scalper Pro# 👻 NQ Phantom Scalper Pro
**Advanced VWAP Mean Reversion Strategy with Volume Confirmation**
## 🎯 Strategy Overview
The NQ Phantom Scalper Pro is a sophisticated mean reversion strategy designed specifically for Nasdaq 100 (NQ) futures scalping. This strategy combines Volume Weighted Average Price (VWAP) bands with intelligent volume spike detection to identify high-probability reversal opportunities during optimal market hours.
## 🔧 Key Features
### VWAP Band System
- **Dynamic VWAP Bands**: Automatically adjusting standard deviation bands based on intraday volatility
- **Multiple Band Levels**: Configurable Band #1 (entry trigger) and Band #2 (profit target reference)
- **Flexible Anchoring**: Choose from Session, Week, Month, Quarter, or Year-based VWAP calculations
### Volume Intelligence
- **Volume Spike Detection**: Only triggers entries when volume exceeds SMA by configurable multiplier
- **Relative Volume Display**: Real-time volume strength indicator in info panel
- **Optional Volume Filter**: Can be disabled for testing alternative setups
### Advanced Time Management
- **12-Hour Format**: User-friendly time inputs (9 AM - 4 PM default)
- **Lunch Filter**: Automatically avoids low-liquidity lunch period (12-2 PM)
- **Visual Time Zones**: Color-coded background for active/inactive periods
- **Market Hours Focus**: Optimized for peak NQ trading sessions
### Smart Risk Management
- **ATR-Based Stops**: Volatility-adjusted stop losses using Average True Range
- **Dual Exit Strategy**: VWAP mean reversion + fixed profit targets
- **Adjustable Risk-Reward**: Configurable target ratio to opposite VWAP band
- **Position Sizing**: Percentage-based equity allocation
### Optional Trend Filter
- **EMA Trend Alignment**: Optional trend filter to avoid counter-trend trades
- **Configurable Period**: Adjustable EMA length for trend determination
- **Toggle Functionality**: Enable/disable based on market conditions
## 📊 How It Works
### Entry Logic
**Long Entries**: Triggered when price touches lower VWAP band + volume spike during active hours
**Short Entries**: Triggered when price touches upper VWAP band + volume spike during active hours
### Exit Strategy
1. **VWAP Mean Reversion**: Early exit when price returns to VWAP center line
2. **Profit Target**: Fixed target based on percentage to opposite VWAP band
3. **Stop Loss**: ATR-based protective stop
### Visual Elements
- **VWAP Center Line**: Blue line showing volume-weighted fair value
- **Green Bands**: Entry trigger levels (Band #1)
- **Red Bands**: Extended levels for target reference (Band #2)
- **Orange EMA**: Trend filter line (when enabled)
- **Background Colors**: Yellow (lunch), Gray (after hours), Clear (active trading)
- **Info Panel**: Real-time metrics display
## ⚙️ Recommended Settings
### Timeframes
- **Primary**: 1-5 minute charts for scalping
- **Validation**: Test on 15-minute for swing applications
### Market Conditions
- **Best Performance**: Ranging/choppy markets with good volume
- **Trend Markets**: Enable trend filter to avoid counter-trend trades
- **High Volatility**: Increase ATR multiplier for stops
### Session Optimization
- **Pre-Market**: Generally avoided (low volume)
- **Morning Session**: 9:30 AM - 12:00 PM (high activity)
- **Lunch Period**: 12:00 PM - 2:00 PM (filtered by default)
- **Afternoon Session**: 2:00 PM - 4:00 PM (good volume)
- **After Hours**: Generally avoided (wide spreads)
## ⚠️ Risk Disclaimer
This strategy is for educational purposes only and does not constitute financial advice. Past performance does not guarantee future results. Trading futures involves substantial risk of loss and is not suitable for all investors. Users should:
- Thoroughly backtest on historical data
- Start with small position sizes
- Understand the risks of leveraged trading
- Consider transaction costs and slippage
- Never risk more than you can afford to lose
## 📈 Performance Tips
1. **Volume Threshold**: Adjust volume multiplier based on average NQ volume patterns
2. **Band Sensitivity**: Modify band multipliers for different volatility regimes
3. **Time Filters**: Customize trading hours based on your timezone and preferences
4. **Trend Alignment**: Use trend filter during strong directional markets
5. **Risk Management**: Always maintain consistent position sizing and risk parameters
**Version**: 6.0 Compatible
**Asset**: Optimized for NASDAQ 100 Futures (NQ)
**Style**: Mean Reversion Scalping
**Frequency**: High-Frequency Trading Ready

BT Bar - 1.0 BTBar Description
BTBar is a visual script designed to identify and highlight candles with abnormally high volume, making it easier for traders to spot pressure imbalances and key price areas during live market action.
🔍 The script compares the current candle’s volume to the previous one, and highlights candles that exceed specific percentage thresholds (customizable by the user) using distinct colors.
Rather than relying on generic trend or scalping strategies, BTBar is based on relative volume intensity detection — a concept rooted in order flow analysis — to help traders identify:
Candles with unusual volume spikes (possible absorption or exhaustion),
Medium/high volume continuation signals,
Areas where price might reverse or accelerate.
🛠️ It also offers the option to automatically draw horizontal lines from the open of the highest-volume candles, helping traders track potential institutional decision levels throughout the day.
⚙️ How to use:
Apply BTBar to a clean chart.
Customize the volume threshold levels (e.g., 300%, 400%, etc.).
Watch for highlighted candles — these indicate moments when volume significantly broke previous levels, marking potential points of interest or behavior shifts.
Use the optional horizontal lines as visual support/resistance levels derived from volume extremes.
🧠 Underlying concept:
BTBar uses a percentage-based volume comparison approach, inspired by techniques in footprint charts and volume spike detection.
This allows traders to visually spot key market reactions without relying on numeric overload or complex setups.
A+ Trade CheckList with Comprehensive Relative StrengthThe indicator designed for traders who need real-time market assessment across multiple timeframes and benchmarks. This comprehensive tool combines traditional technical analysis with sophisticated relative strength measurements to provide a complete market picture in one convenient table display.
The indicator tracks essential trading levels including:
QQQ and SPY trend analysis using exponential moving averages
Previous day and week high/low levels for key support and resistance
Market open levels from the first 5 and 15 minutes of trading (9:30 AM ET)
VWAP positioning for institutional price reference
Short-term EMA positioning for momentum assessment
Advanced Relative Strength Analysis
The standout feature of this indicator is its comprehensive 8-metric relative strength scoring system that compares your current ticker against both QQQ (Nasdaq-100) and SPY (S&P 500) benchmarks.
The 4-Metric Relative Strength System Explained
Metric 1: Relative Strength Ratio (RSR)
Purpose: Measures whether your ticker is outperforming or underperforming relative to its historical relationship with the benchmarks.
How it works:
Calculates the ratio of your ticker's price to QQQ/SPY prices
Compares current ratio to a 20-period moving average of the ratio
Scores +1 if ratio is above average (relative strength), -1 if below (relative weakness)
Trading significance: Identifies when a stock is breaking out of its normal correlation pattern with major indices.
Metric 2: Percentage-Based Relative Performance
Purpose: Compares short-term percentage changes to identify immediate relative momentum.
How it works:
Calculates 5-day percentage change for your ticker and benchmarks
Subtracts benchmark performance from ticker performance
Scores +1 if outperforming by >1%, -1 if underperforming by >1%, 0 for neutral
Trading significance: Captures recent momentum shifts and identifies stocks moving independently of market direction.
Metric 3: Beta-Adjusted Relative Strength (Alpha)
Purpose: Measures risk-adjusted performance by accounting for the ticker's natural volatility relationship with benchmarks.
How it works:
Calculates rolling beta (correlation and variance relationship)
Determines expected returns based on benchmark moves and beta
Measures alpha (excess returns above/below expectations)
Scores based on whether alpha is consistently positive or negative
Trading significance: Identifies stocks generating returns beyond what their risk profile would suggest, indicating fundamental strength or weakness.
Metric 4: Volume-Weighted Relative Strength
Purpose: Incorporates volume analysis to validate price-based relative strength signals.
How it works:
Compares VWAP-based percentage changes between ticker and benchmarks
Applies volume weighting factor based on relative volume strength
Enhances score when high relative volume confirms price movements
Trading significance: Distinguishes between genuine institutional-driven moves and low-volume price action that may not sustain.
Combined Scoring System
The indicator generates 8 individual scores (4 metrics × 2 benchmarks) that combine into a single strength assessment:
Score Interpretation
Strong (4-8 points): Ticker significantly outperforming both benchmarks across multiple methodologies
Moderate Strong (1-3 points): Ticker showing good relative strength with some mixed signals
Neutral (0 points): Balanced performance relative to benchmarks
Moderate Weak (-1 to -3 points): Ticker showing relative weakness with some mixed signals
Weak (-4 to -8 points): Ticker significantly underperforming both benchmarks
Display Format
The indicator shows results as: "Strong (6/8)" indicating the ticker scored 6 out of 8 possible points.

Volume CandlesVolume Candles — Context-Aware Candle Color
Description:
This visual indicator colors your price candles based on relative volume intensity, helping traders instantly detect low, medium, and high volume activity at a glance. It supports two modes — Percentile Ranking and Volume Average — offering flexible interpretation of volume pressure across all timeframes.
It uses a 3-tiered color system (bright, medium, dark) with customizable tones for both bullish and bearish candles.
How It Works:
You can choose between two modes for volume classification:
Ranking Mode (Default):
Measures current volume’s percentile rank over a lookback period. Higher percentiles = stronger color intensity.
Percentile thresholds:
< 50% → light color (low volume)
50–80% → medium intensity
> 80% → high volume
Volume Average Mode:
Compares current volume against its simple moving average (SMA).
Volume thresholds:
< 0.5× SMA → light color
Between 0.5× and 1.5× → medium
> 1.5× → high intensity
Candle Paint:
Candles are colored directly on the chart, not in a separate pane. Bullish candles use green shades, bearish use red. All colors are fully customizable.
How to Interpret:
Bright Colors = High volume (potential strength or climax)
Muted/Transparent Colors = Low or average volume (consolidation, traps)
Example Use Cases:
Spot fakeouts with large price movement on weak volume (dark color)
Confirm breakout strength with bright candles
Identify stealth accumulation/distribution
Inputs & Settings:
Mode: Ranking Percentile or Volume Average
Lookback Period for ranking and SMA
Custom Colors for bullish and bearish candles at 3 intensity levels
Best For:
Price action traders wanting context behind each candle
Scalpers and intraday traders needing real-time volume feedback
Anyone using volume as a filter for entries or breakouts
Pro Tips:
Combine with Price Action, Bollinger Bands or VWAP/EMA levels to confirm breakout validity and intent behind a move.
Use alongside RSI/MACD divergences for high-volume reversal signals.
For swing trading, expand the lookback period to better normalize volume over longer trends.
