Relative strength of a stock against the sugar index (Top 18)This indicator can be used for sugar stocks to compare their relative strength with that of their respective industry. It can also be used to gauge the momentum in sugar stocks against the other indexes like Nifty, Bank Nifty, CNXIT, CNXAUTO and check which index is outperforming the other.
Made with reference to the index published by Stef @Scheplick
"relative strength" için komut dosyalarını ara

Relative Strength Index w/ STARC Bands and PivotsThis is an old script that I use with some useful RSI strategies from "Technical Analysis for the Trading Professional" 2nd edition by Constance Brown.
The base RSI comes with the option for custom length, and has some pre-configured ranges for looking at exits and entrances. The idea is to be bullish when bounces happen in the red zone during an already bullish trend or when the indicator enters green without a rejection. Be bearish if the indicator falls through the red zone or fails to enter green during an already bearish trend.
I have added the formulas used for creating STARC bands (just think fancier volatility bands) with adjustable tolerances. The idea is to look out for when the RSI touches one of the bands and reverses. This is usually indicative of a strong reversal (though the timing will be up to the trader). Best use this on shorter time frames during a volatile time of a stock's price action.
Although a little messy, there is a small segment of the script which includes pivot points. I like to use these because they make indicating local highs/lows for finding divergences easier.
Finally, I have added a couple of customizable EMAS for the RSI itself. Useful when combined with the other features!

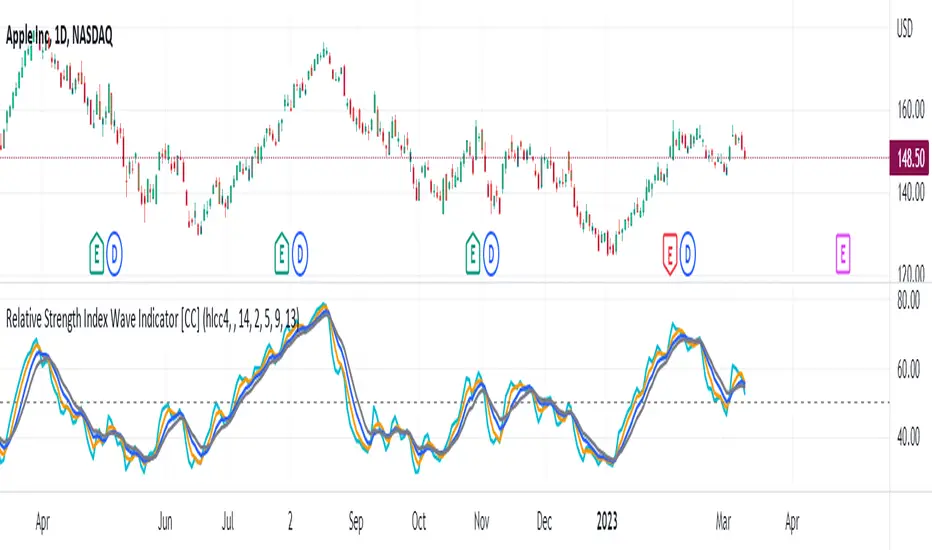
Relative Strength Index Wave Indicator [CC]The Relative Strength Index Wave Indicator was created by Constance Brown (Technical Analysis for the Trading Professional), and this is a unique indicator that uses the weighted close formula, but instead of using the typical price values, it uses the RSI calculated from the various prices. It then creates a rainbow by smoothing the weighted RSI with four different lengths. As far as the buy or sell signals with this indicator go, I did change things from the original source, so feel free to experiment and let me know if anything works better for you. I decided to do a variation of the original source and create buy and sell signals based on crossovers, but my version only uses the first and second smoothed RSI lines. You could also average all of the lines and buy when the average is rising and sell when it starts to fall. I have used my typical buy and sell signals to use darker colors for strong signals and lighter colors for normal signals. Because of the rainbow effect from the wave, the color changes will only appear for the bar itself when you enable that setting.
Let me know if there is any other script you would like to see me publish! I will have plenty more RSI scripts to publish in the next week. Let me know if you like this indicator series.
Relative Strength Index with fast and slow MAsThis is the typical Relative Strength Index indicator with two moving averages, one slow (length 50 by default) and one fast (length 20 by default). Additionally, there are four lines, which mark the oversold/overbought signals at different levels, there are two inner bands with values at the levels 40, and 60, and two outer bands at the levels 20, and 80. The presence of the fast and slow moving averages and their crossover/crossunder with the oversold/overbought levels or the RSI can provide more insightful and faster signals. The indicator has a slightly different colouring mechanism.
The views of the RSI indicator on the above the price chart in both dark and light modes:

Relative Strength Exponential Moving Average [CC]The Relative Strength Exponential Moving Average was created by Vitali Apirine (Stocks and Commodities Jan 2022 pgs 22-25) and this is a handy moving average that combines a typical overbought/oversold mechanic with an overall trend indicator. Even though the typical length is so large it reacts extremely quickly when the stock becomes overbought or oversold. Because of this the indicator by itself doesn't work as well during choppy periods so Vitali recommends using a moving average crossover system during choppy so do one indicator with the default length of 50 and use a different length of 10 so when the shorter length crosses over the longer length then buy and vice versa you would sell. Generally speaking buy when the line turns green and sell when it turns red. I have used strong buy and sell signals in addition to normal signals so strong signals are darker in color and normal signals are lighter in color.
Let me know if there are any other scripts or indicators you would like me to publish!

Relative Strength Improved (Premal Parekh ASR Version)This script is improved over the existing script developed by Mr. modhelius
I have added ASR Concept of Mr. Premal Parekh.
This script will remove manual calculation of Trading Days from ASR Date.

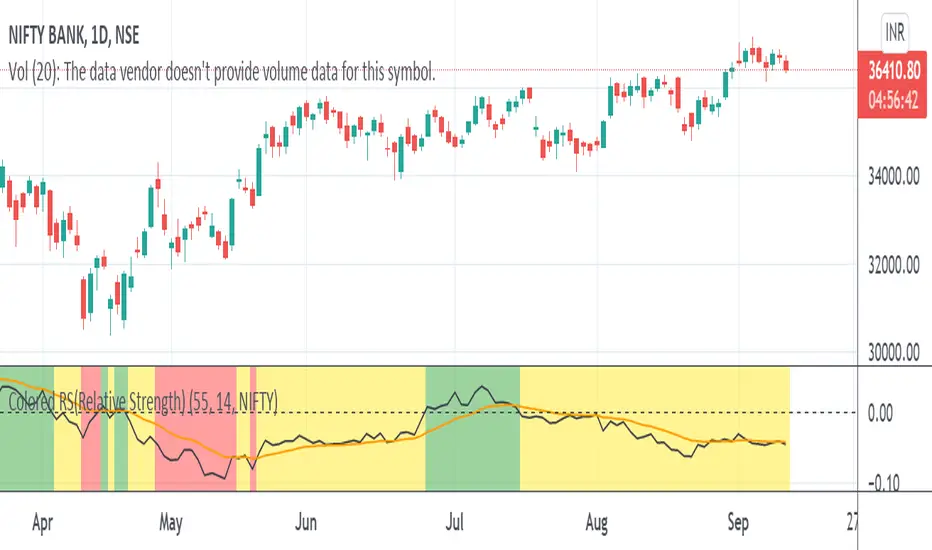
Colored RS(Relative Strength)Relative strength is a calculation of the price trend of a stock or a financial instrument in comparison to another instrument, stock, or industry.
Color indication
Red :: Benchmark returns is -ve and the RS_Value is below 0.
Yellow :: Benchmark returns is +ve and RS_Value is below 0.
Green :: Becnhmark returns is +ve and RS_Value is above 0.
Blue :: Benchmark returns is -ve and RS_Value is above 0.
Relative Strength Index 2x maThe relative strength index, represented as two moving averages with periods, one of which will be a multiple of the longer moving average by the amount you set.
The indicator can work both in automatic and manual mode. In automatic mode, the optimal periods are selected, in my opinion, depending on which timeframe is being analyzed at the current moment. In manual mode, you can set the required period yourself.
You can also set the method of smoothing the moving averages yourself and apply them to the opening or closing, the minimum of the bar, etc.
An important point: it is possible to enable/disable graphical functions that may not be required - just check the box next to the function that you want to see on your indicator.
Show ConDiv? - enabling / disabling the convergence/divergence function of the moving averages of the RSI indicator (not to be confused with the MACD for the asset price chart)
Show ma? - enabling/disabling the graphical display of the moving averages of the RSI indicator
Show RSI? - enabling / disabling the standard RSI indicator (if you want to see only it, check the box opposite; in this case, you need to remove the other two checkboxes)
I wish you good luck in building your trading plans, and remember: such indicators do not predict the future price movement on the chart, they only determine the characteristics of the price movement at the current time, taking into account historical data.

Relative Strength ComparisonThis indicator compares the difference in percentage change between two symbols
over a user-specified number of bars.
Default settings will show the difference between the current symbol and the
S&P 500 ETF (SPY) over 10 bars. It can be used to determine if the stock is
showing relative strength or weakness compared to the overall market.

RELATIVE STRENGTHstudy(" RELATIVE STRENGTH", shorttitle="RS")
a = tickerid
b = input("NIFTY",type=symbol)
as = security(a,period,close)
bs = security(b,period,close)
plot(as/bs, title="RS" ,color=blue)

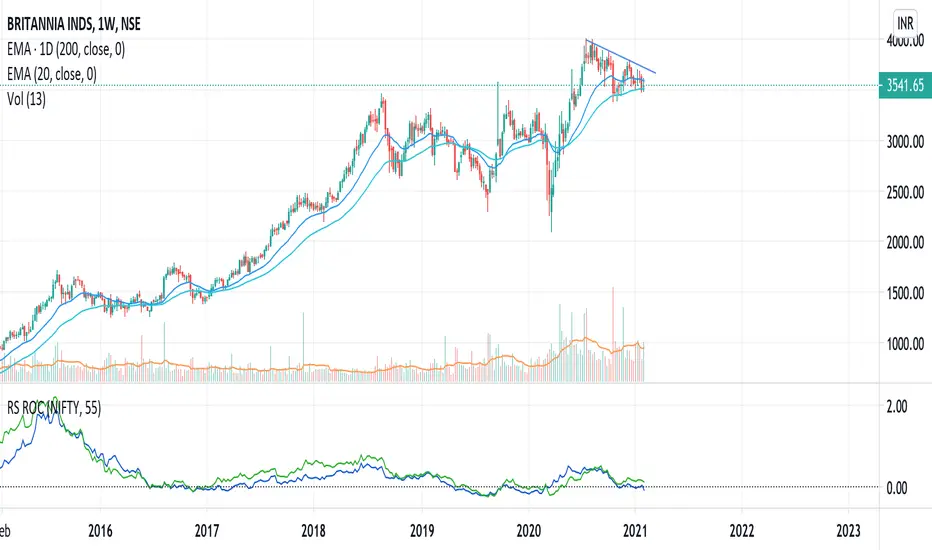
Relative Strength (RS) and Rate of Change (ROC) Combined in oneThis indicator combines Relative Strength and Rate of Change (ROC) in one plot. Change the period and comparative symbol (defaulted to NSE:NIFTY) in settings.

Relative Strength of a stockDetermine the relative strength of a stock vis-a-vis a larger benchmark. Default is NIFTY50.
Relative Strength Auto ComparisonRelative Strength Comparison with automatic selection of relevant index
Added support for most european and north american exchanges.
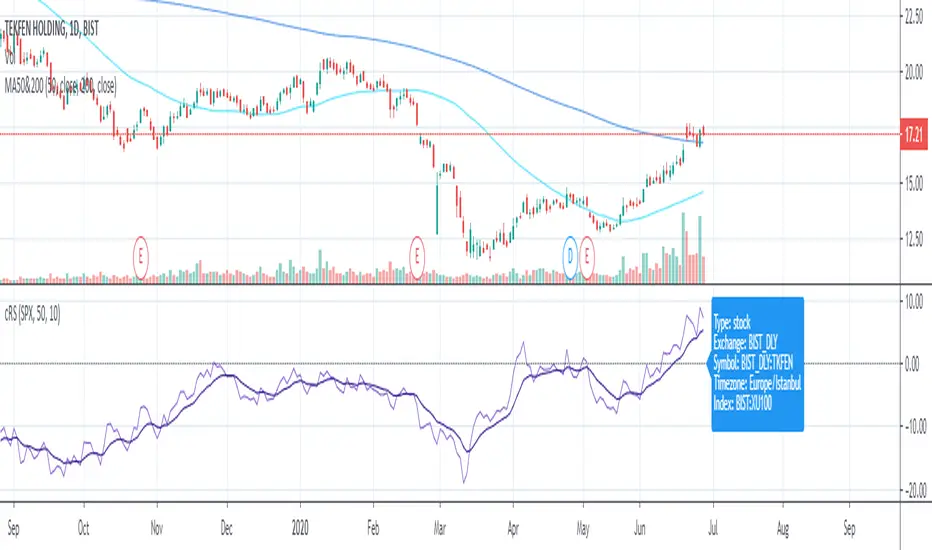
Relative Strength Comparison (RSC) Indicator SignalsThis Relative Strength Comparison (RSC) indicator overlays a simple moving average (SMA) of the prior days values and changes color when the RSC crosses above and below that value as an indicator with bearish and bullish signals in comparison to another symbol.
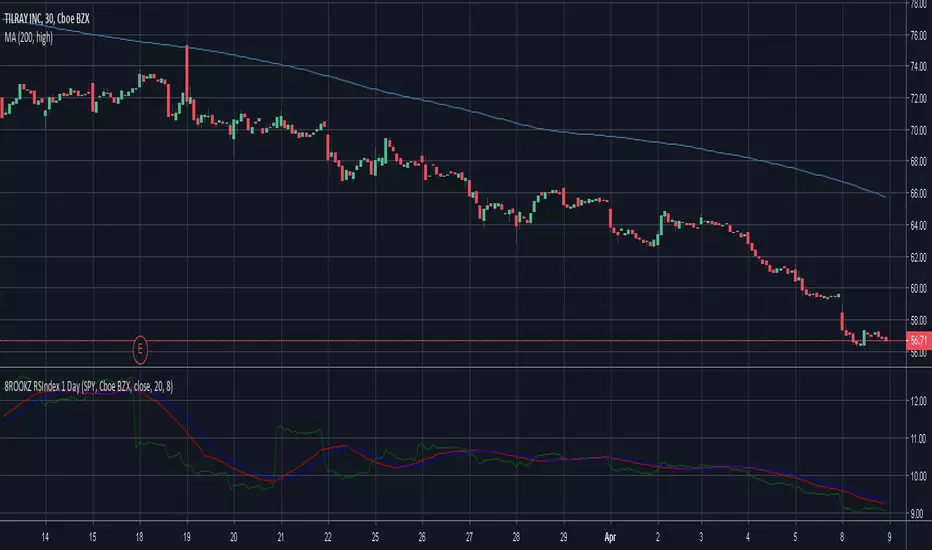
8ROOKZ Rel Strength to index - 1 DayRelative Strength to Index
- use to understand the correlation between stock and the index
- Calculated on one day close
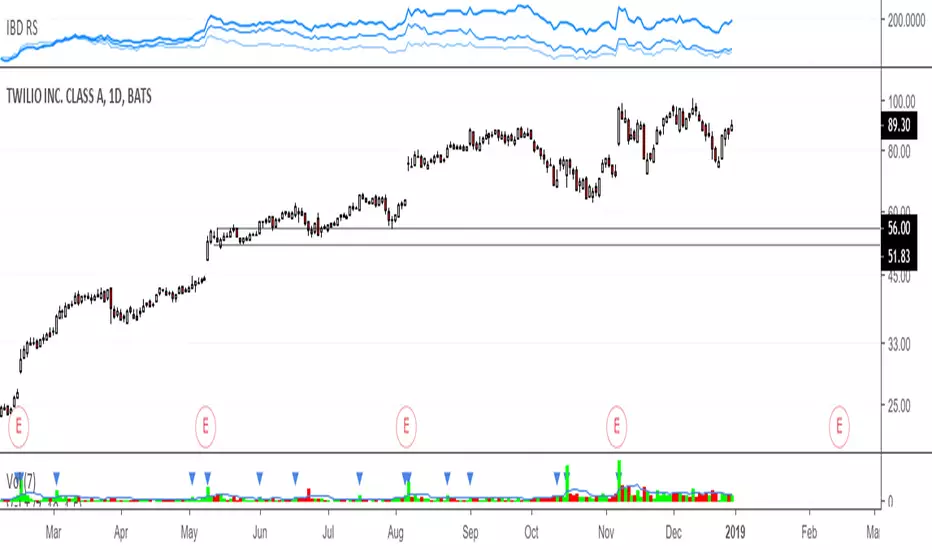
IBD RS, Relative strengthRelative Strength calculation of 3 time periods: 12 months, 6 months and 3 months.
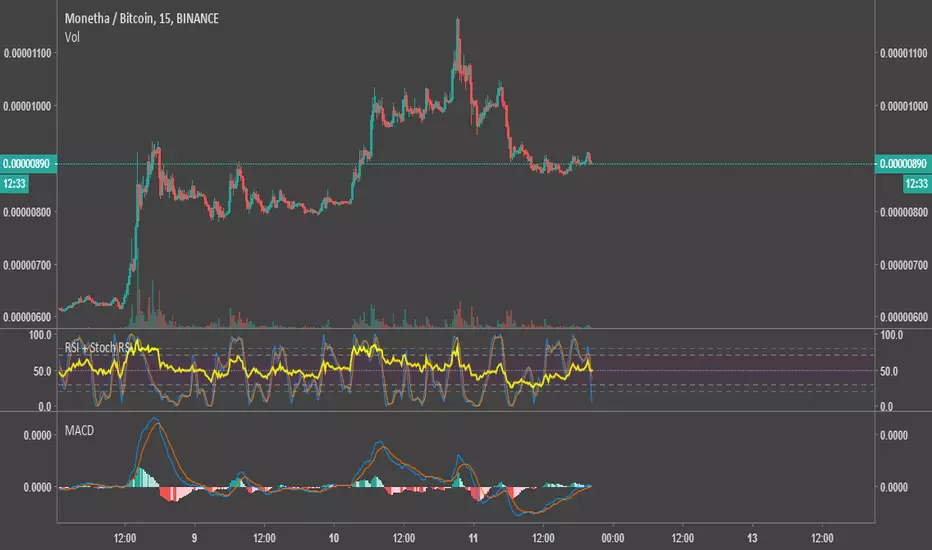
Relative Strength Index & Stochastic RSIThis script calculates both RSI (Relative Strength Index) and Stock (Stochastic) RSI Indicators, and plots them with a distinctive background on the same graph. The colors were chosen to be very easy on the eyes.
I published it as a way to give back to this community. Use your own judgement when trading, I am not responsible for any losses resulting from the use of my script.
Feel free to modify the script with no attribution.

AJCrows RSIRelative Strength Index with indicator lines at 20, 30, 50, 70 and 80 marks. Use settings to show/hide these lines, and to choose appropriate colors.


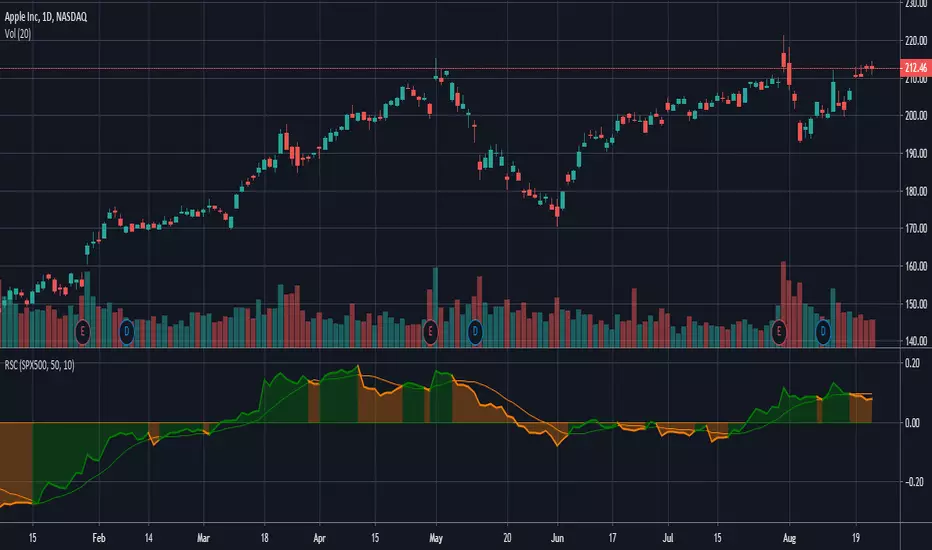
relative strength to SPX500This is the indicators showing the stock relative strength comparing with SPX500.
positive means the stock is strong than spx500
negative means weak than spx500

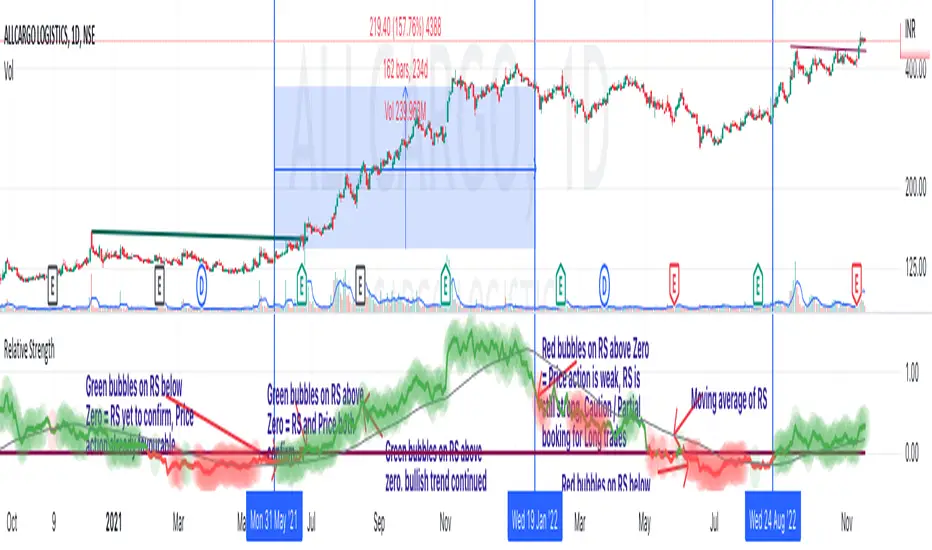
Multi Period Relative StrengthMulti Period Relative Strength Indicator
This indicator is meticulously designed around the fundamental concept of relative strength, providing a powerful tool to assess an instrument's performance against peers or a benchmark index within the same asset class. Tailored for short-term swing trend analysis, it equips traders with the insights needed to make informed decisions based on prevailing relative strength dynamics.
More about Relative Strength: www.investopedia.com
Key Features:
Dual Period Analysis:
The indicator conducts a dual-period analysis, scrutinizing relative strength across two distinct period—a fast period and a slow period. This approach allows for a comprehensive evaluation of relative strength dynamics.
Visualization:
Slow RS is visually depicted as a green cloud above the zero line showing relative strength or a red cloud below it showing relative weakness. This visual representation aids in assessing the underlying instrument's performance against its peer over the past 3 months (slow period).
Fast RS is visually presented as green bars above the zero line showing relative strength or red bars below it showing weakness. This visual cue helps evaluate the performance of the underlying instrument against its peer over the last week (fast period).
Positive Relative Strength:
When both the fast and slow periods exhibit positive values, it signifies sustained strength in the current instrument over both the past 3 months and the last week.
Divergence Evaluation:
A positive fast period coupled with a negative slow period signals a robust relative strength trend over the past 3 months, but with a recent decline in the last week. Traders may consider adjusting positions, such as reducing or exiting, in response to this divergence.
Strength Building Scenario:
Conversely, a negative fast period paired with a positive slow period indicates relative weakness over the past 3 months, coupled with an increasing trend in the last week. This scenario may present an opportunity to gradually build positions, particularly if the 3-month relative strength turns positive.
Strategic Decision Points:
Traders can leverage these signals strategically to manage portfolios, adjusting positions based on the nuanced interplay between short-term and longer-term relative strength trends.
Risk Mitigation Strategies:
By interpreting the indicator signals, traders can implement effective risk mitigation strategies, including position downsizing, exits, gradual position building, or short covering. These actions align with the prevailing relative strength dynamics.
In summary, the Multi Period Relative Strength Indicator offers a nuanced and actionable perspective on an instrument's relative strength. By examining both short-term and 3-month trends, traders can make well-informed decisions to optimize their trading strategies and portfolio management.
