Sw1tchFX - Average Daily RangeDESCRIPTION AND OVERVIEW
The Average Daily Range is a measure of volatility (typically across 5 days for the FX markets). I originally saw this being used in a trading system called ANTSSYS by Daryll Guppy and some other developers. I couldn't find it anywhere so I decided to build it from scratch.
What this does is allow you to measure volatility across various FX assets (I will apply other asset classes in the future that this is applicable to i.e. Crypto, Commodities, Blue Chip Stocks), and set realistic targets based off that volatility. Overall, this makes much more sense to me in the FX markets rather than support and resistance lines because it's based off the actual movement of the asset class. Market research shows that an asset class has a 80-85% chance to reach 75% of it's Average Daily Range (ADR).
Let's take a look at the daily ADR on the GBPNZD 15m chart. Notice how the values of the ADR act as real support and resistance based off the volatility of the asset. In this case, price did not quite reach the 75% ADR target.
Let's take a look at another example on EURNZD 15m chart. In this case, price hit the 75% target.
It's important to note that these levels do not bound the price. The probability that price exceeds it's 75% ADR is fairly low, but not impossible. Especially during important news events. Let's look at the recent USDCHF 15m chart for example.
Additionally, you can use these values to measure longer term movements (Weekly, and Monthly)
Here is a weekly view:
And a monthly view:
HOW I USE THIS
I use this in conjunction with some other indicators I've developed. Typically, I use range bars since I only care about price, not time. Additionally, averages are smoother when time is not taken into account and only price.
HOW THE CANDLE OPEN AND CLOSE IS CALCULATED
This is done based off of your own specific time zone and from the daily candle. So for me on PST, the daily candle will close at 1400. Once closed, a new ADR value is automatically calculated and added to the chart. There is an option to show past ADR values if you would like to see them or conduct additional research.
"range" için komut dosyalarını ara

Relative Bi-Directional Volatility RangeThe basic math behind this Indicator is very similar to the math behind the Relative Strength Index without using a standard deviation as used for the Relative Volatility Index. The Volatility Range is calculated by utilizing the highs and lows. However not in the same way as in the Relative Volatility Index. This approach leads to different values, but the overall result clearly reveals the intrinsic Volatility of the chart, so the user can be aware, when something fundamentally is going on behind the scenes. If the Volatility rises on positive and negative range (-100 to 100) it implies that something fundamental is changing.
An advantage of using this kind of calculation is the possibility of separating the data into positive (buy pressure) and negative (sell pressure) components. The bi-directional character shows a slightly overhang in one of the directions, which can be used to detect a trend. A Moving Average of the users choice shell smoothen the overhang of the Relative Bi-Directional Volatility and show a trend direction. Similar to the math of the Relative Strength Index as standard a Relative Moving Average is preferred. If the Moving Average is in the positive range (0 to 100) it indicates a bullish trend, else if the Moving Average is in the negative range (0 to -100) it indicates a bearish trend. External Indicators can use a provided Trend Shift Signal which switches from 0 to 1, if the trend becomes bullish or from 0 to -1, if the trend becomes bearish.
The user should know, that in this Indicator the starting point of the Moving Averages always begins at the first bar, because the starting progress is approximated appropriately. Most Moving Averages require a minimum number of bars to be calculated, which is chosen with the Moving Average Length. In this cases the length used will be automatically reduced in the background until the number of bars is sufficient to match the chosen length. So if data history is very short, the Indicator can be used never the less as good as possible.
It is feasible to switch the Indicator on a higher timeframe, while staying in a lower timeframe on the chart. This can be useful for making the indication cleaner, if the Moving Average is to choppy and shows too many false signals. On the other hand the benefit of a higher timeframe (or a higher Moving Average Length) is paid with higher latency of the signaling. So the user has to decide what the best setting in his case is.
This Indicator can be used with all kinds of charts. Even charts with percentage or negative values should work fine.

Percentage Range IndicatorThe Percentage Range Indicator is useful for assessing the volatility of pairs for percentage-based grid bots. The higher the percentage range for a given time period, the more trades a grid bot is likely to generate in that period. Conversely, a grid bot can be optimised by using grids that are less than the Percentage Range Indicator value.
I have been using the Percentage Range Indicator based on the one hour time period and 168 periods of smoothing (seven days based on one-hour periods).
Enjoy.

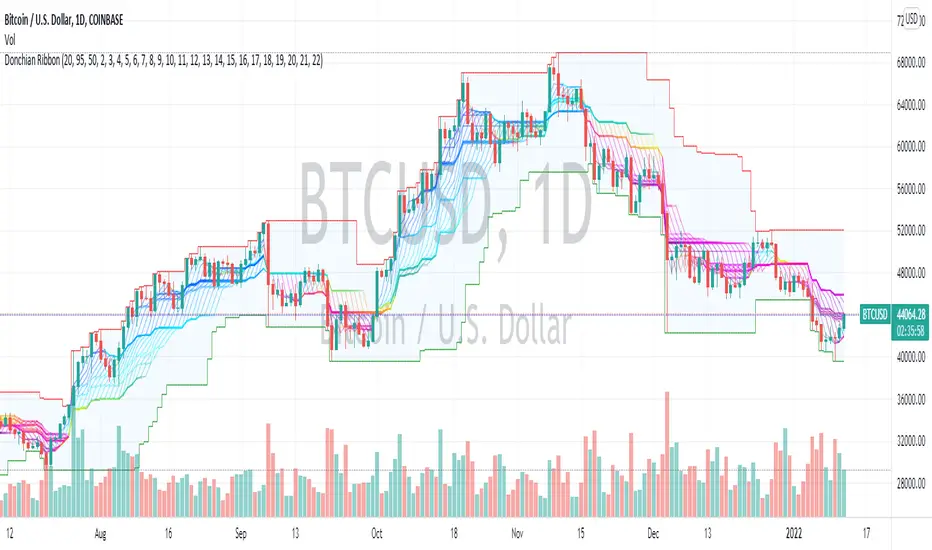
Donchian Range, RSI, and Levels SystemThe Donchian average is defined as average(highest, lowest) for a given period length. By plotting many different lengths, clustering of the lines seems to form natural support/resistance levels. A Donchian Channel and RSI rainbow colors are also provided to define the range and trend.
No Duplicates Interval Range & EQGenerates Range & EQ levels and removes duplicates. Prioritizes by higher timeframe for duplicates. For example, on Monday's open, weekly open is displayed while daily open is hidden automatically.

Fibonaci Opening Range Candle
Fibonacci Opening Range it is 50% and 0.61% of 5 min or 30min or 1 hour opening candle
search buying opportunities below 0.61
and selling opportunities above 0.50
Also acts as good support and resistance in intraday
BEST RESULTS IN INDEXES
Thanks & Best Regards
Marella Ganesh

Flow of RangeThe Flow of Range is calculated by averaging the range for the given bars for the short term oscillations, then averaging the average to determine long term runs.
Above 0 indicates bullish momentum, below 0 indicates bearish momentum.
Notice the behavior of the market when the range is increasing and decreasing - both on the long and short term oscillations.
The indicator should be used in a discretionary manner along with your usual preferred tools.

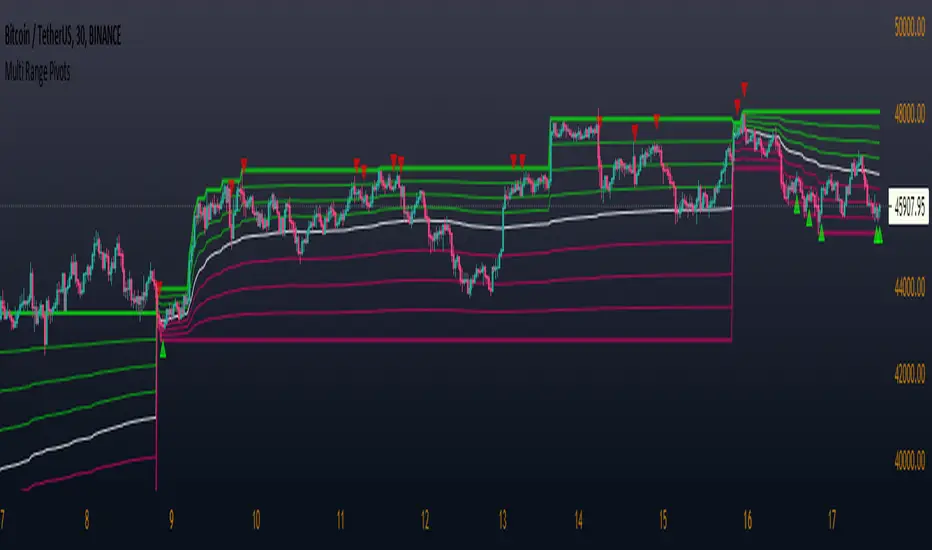
Multi Range Pivots
Multi Range Pivots works by recognizing the high and low of the timeframe selected and plotting range high to MEAN averages and range low to MEAN averages.
This is essentially the VWAP pivots updated to include not only VWAP as a MEAN, but also SMA, EMA, VWMA, DEMA, TEMA, TRIMA, KAMA, MAMA, T3, H/L basis and Donchian basis.
Also, with high and low no longer repainting, I was able to add true reliable signals.
Enjoy
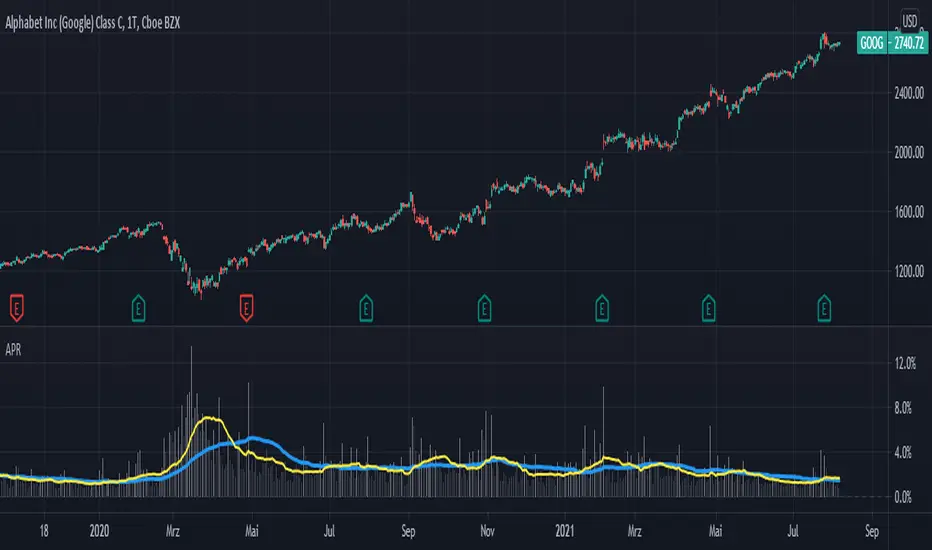
Averange Percentage RangeThis Indicator displays the two different Averange Percentage Range (APR) and the Percentage Range of the current bar.
If the long term APR is over the short term it indicates a lower volatility otherwise a higher.
You can set the calculation method, rising for (highest/lowest-1)*-100 or falling for (lowest/highest-1)*-100.
Flexible timezone-aware session rangeAllows you to define session range with local time and its timezone, also can toggle session visibility any day of week.

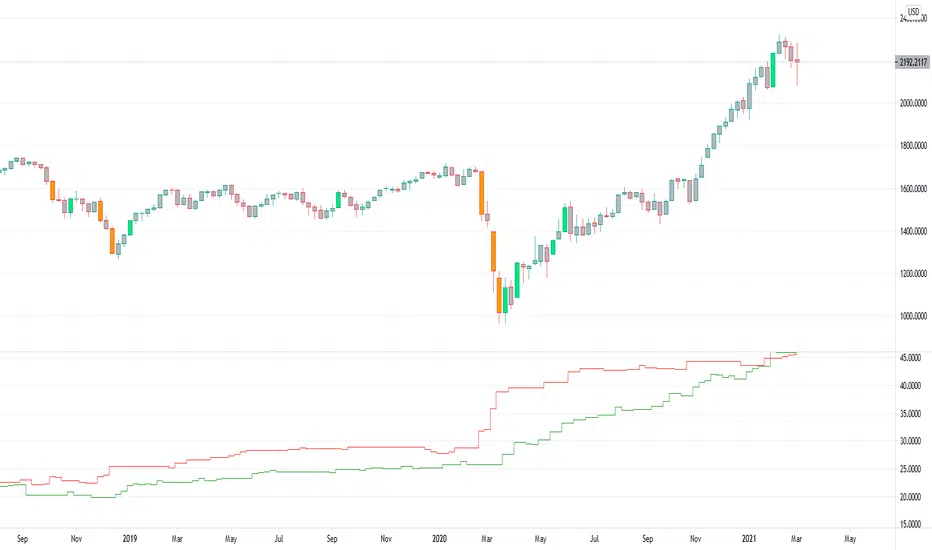
Price Cross Range StrengthPurpose:
This script shows when price is in a range or trending. When the green line rises above the threshold the price is trending. When the green line falls below the threshold it's ranging. You may try adjusting the lookback way far back to find more areas of resistance.
Logic:
It shows how many instances the current price has been crossed in the past measured bars. The logic is that any price area that has been crossed many times is a strong area where ranging occurs.
Ideas:
1. Can be used as a dynamic length to other moving averages.

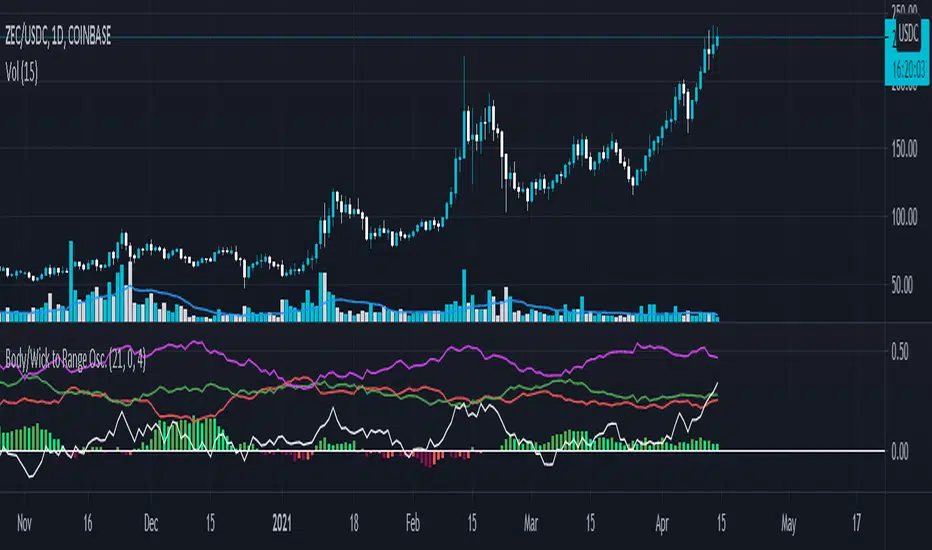
Body/Wick to Range Osc.This script is meant to be a form of pure candlestick analysis.
Terminology in the description used below is as follows:
- numcands = Number of candles specified by the user to be used for sampling in each moving average.
This script plots moving average (SMA/EMA specified by the user ) of the percentage of the high-low range that the previous {numcands} candles the upper wicks, lower wicks, and the body take up.
The user may specify if the absolute value of the body percentage is to be used (true by default). To account for this, a horizontal line is also plotted at 0 to show when the body percentage moves above or below 0.
The values that all of these moving averages plotted will oscillate between 0 and 1 (-1 and 1 for the body percentage if the absolute value of candles is not used).
Other notes: The user may select the colors used (colorblind support, as the defaults are red and green). Cross overs and cross unders are accounted for in alertconditions (as is if the body % moves above and below 0% if absolute values are not used).
An interpretation of the use of this script may be: If the upper wicks begin to take up a larger portion of the high-low range, it may signal downward selling pressure (and vise-versa for lower wicks). However, this may be open to interpretation based upon the specified {numcands} used.
Up-Down RangeHere is an attempt to segregate ATR into ATR of up days and down days.
While setting trailing stops based on ATR, you probably need to consider more on how an instrument can drop during red days. Hence, ATR of only red days makes more compelling case than overall ATR. Another use case for this kind of indicator may be in options if you are selling puts and calls with the intent of pocketing premiums on expiry.
Parameters are as explained below:
Range Type : Different range types are tr (True Range) , close (difference between close prices), highlow (difference between high and low of candle)
Period : ATR Period
Moving Average Type : Moving Average Type for calculating ATR. Two additional types - min and max are added which calculates lowest and highest range in last n bars
HideFullAtr : Hides combined ATR if checked.
Vortex Range Breakout SystemThis is a Vortex Based Visual System,
Which can help you identify the Vortex Crosses based Range Breakouts/ Breakdown, over the price Scale,
How its made ?
The vortex Crosses are projected over the Price
on Same Time frame {Green and Red Filled area}
-> green Area means : Vortex Crossover Range
-> red Area means : Vortex Crossunder Range
and on Higher Timeframe
Vortex Cross Levels are Plotted, which you see as :
Blue and Orange Lines
Default Configs
Vortex Period is 14
Higher Timeframe Option is set to 60 mins
You can change the Higher timeframe to any minutes which suits your need
Also If you want to change the Higher Timeframe in Days
just know
1D = 24*60 min, = 1140mins
Enjoy!

Test: range mappingEXPERIMENTAL:
just a wild experiment..
mapping the average range break points to find natural hubs of support and resistance?!

Silen's Pseudo VPVR / Pseudo Volume Profile Custom RangeDisclamer: This indicator does not use actual Volume data and doesn't display any Volume data. It creates a pseudo Volume Profile by counting the high-low-2 values of candles and simulates something that is similar to a Volume Profile without using any Volume data.
Core facts:
Creates a pseudo Volume Profile by counting values of candles and sorting them into a Profile.
Works for charts that don't provide any Volume Information.
Can display up to 5 different Value Levels.
Value level colors are (from largest to smallest level): Red, Orange, Yellow, Green, Blue.
The Value levels can be used as Support and Resistance indicators.
The Custom Range of the Volume Profile can be adjusted from 10 to 1500 bars.
Much faster than the other custom pseudo VPVRs out there.
Shortcomings:
As the chart progresses with bars the line positions will distort to the left side. Refreshing the tradingview page or switching to another time interval fixes this. I might fix this issue in the future.
Does not use actual Volume nor display actual Volume.
Note: For those who wondered what happened to my first version of this indicator: It got taken down by Tradingview because it was misleading as to using the words "Volume Profile" and "Visible Range". I fully support their decision and I hope I could clear any misunderstandings! Give their team a heads up for the hard work they're doing in keeping this place clean and well organized!
Enjoy! :)

London Open Range Breakout by KviateqThis script is what I currently use to day trade forex on a 5-minute timeframe.
The script features Multi-timeframe EMA20 that uses timeframe multipliers and is smoother by the factor by which you're multiplying your current timeframe.
Default settings are set to display EMA20 on the current (M5) timeframe, as well as M15, H1, H4 and D1 timeframes.
The background color changes intensity based on how many conditions are met - are all EMAs in the right order, is the current close above/below all the EMAs.
Featured is also a range set to 1 hour since the London breakout (can be changed to M15, or however long you'd like - my current setting is 30 minute).
Also featured are levels that I find to be of most importance - such as Daily and Weekly Open, Previous Day's and Week's Highs.
The idea is to only take trades when all stars align - EMAs, break above/below the Opening Range and not to long/short into an important level.

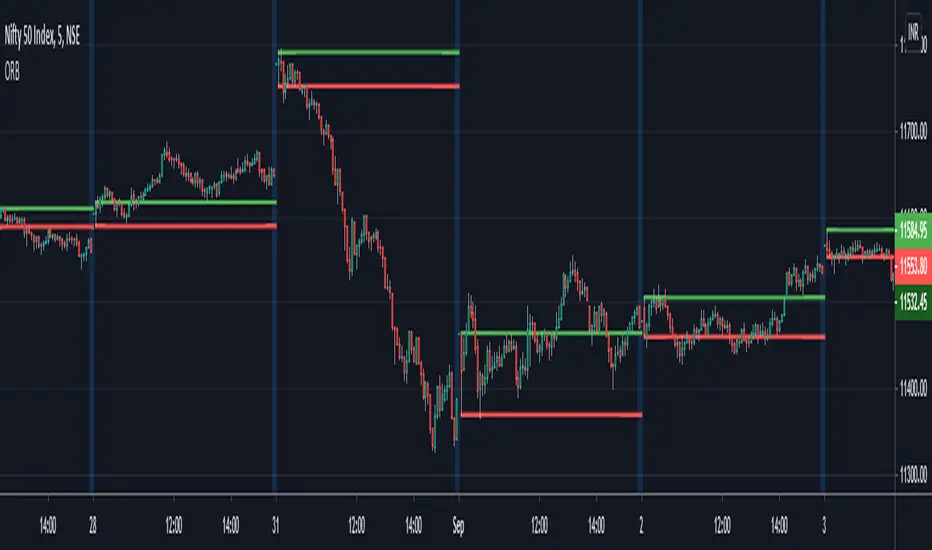
ORB - Opening Range BreakoutThis script plots the high/low of any custom session and extends it until the daily close. It does not show on the timeframe higher than the length of custom opening session by default.
The time period of opening range & the max timeframe to display it on can be adjusted from the settings.
So for eg. if want to use 5m ORB to trade, then set "ORB total time" as 5min & "Session Time" as whatever is the opening 5mins time period of ticker that are trading.
GMS: % True RangeThis just give the range based in % so it can be easily compared to the past. The default setting gives the % range high to low for the current session.
This is what I originally wanted as a 1 period ATR gives it in price points and ROC only does current close to previous close. With this you can select OHLC for the two prices you want to use as well as length.
I hope it helps!
Andre

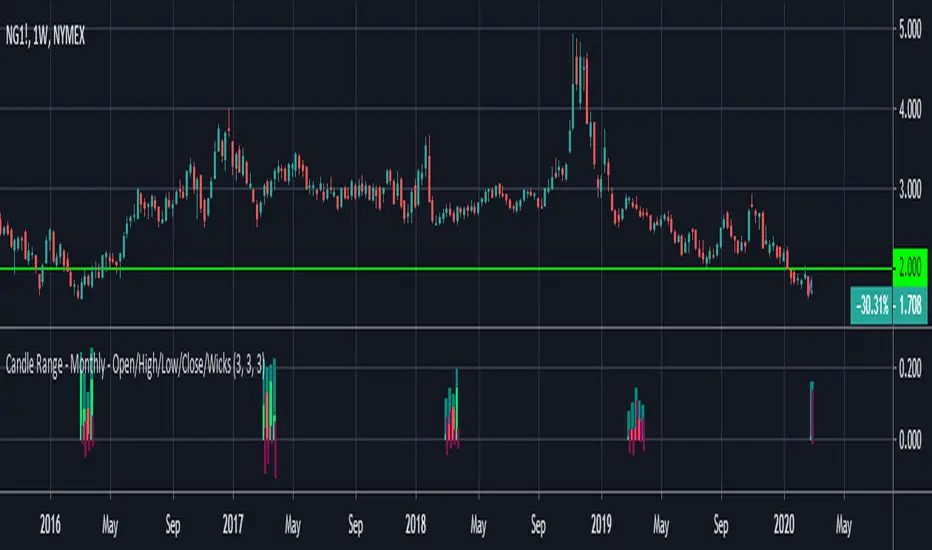
Candle Range - Monthly - Open/High/Low/Close/Wicks (Oldinvestor)This candle range comparison is similar to my original script Candle Range Compare .
This script is to compares the size of open/close high/low and wick size side by side. This version of the script allows you to only show a chosen month of each year to compare. I hadn't even thought to try and vanish the part of the chart I'm not looking at. I'll consider that later (may never happen, I am limited on time).
I have also included check boxes to turn on/off certain candles. This part is pretty self explanatory. For example: if you wish to not see wicks in front of the open/close, go to the settings for the study and uncheck the box for "Show Wicks".
Warning: The script does not work so well on monthly candles? Some of the candles are missing...
Good luck
Oldinvestor
Simple BTC trading strategy based on yesterday's trading rangeOnce market opens, the strategy calculates the price to send a stop buy order
The order is calculated as the sum of yesterday's range multiplied by a special number and today's open price
System has no stops yet
System closes the position on session close
The performance is quite good
Feel free to use it and trade it
Good luck and good trading


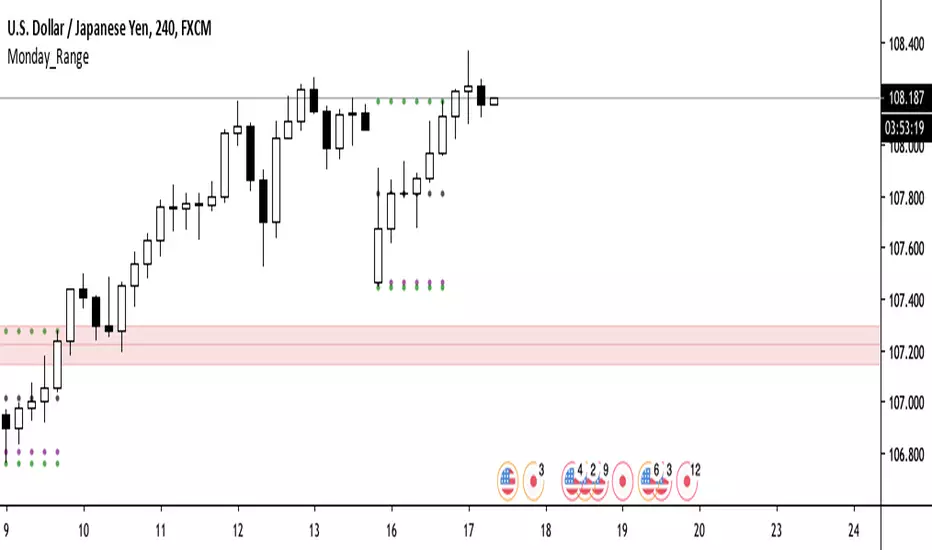
Monday Range - JasonT revisedA revision on the famous Monday Range Script, with the first day of the week goes to Monday for FX trading.