TradeEasy - KintroThe TradingView script provided is a custom indicator named "TradeEasy - Kintro". It is created by the author Kintro and is designed to help traders identify potential buy and sell signals in the market. The indicator is based on the Exponential Moving Average (EMA) and uses two different EMAs, one with a period of 20 and the other with a period of 50.
The indicator is meant to be used on the 5-minute timeframe and it is recommended to use TradingView in Dark Mode for better appearance. The author also reminds users that no strategy works 100% accurately and backtesting should be done before trading with a real account. The author is not responsible for any losses incurred by traders.
The indicator uses a simple set of rules to generate trading signals. The thick line on the chart represents the 50 EMA while the thin line represents the 20 EMA. When the thin line crosses upwards over the thick line, it indicates a bullish signal. After the crossover, traders are advised to wait for the price to pullback between the two lines. A range should then be created while the price moves through the thin line.
On the break of the range, an entry signal is generated, and the stop loss should be set below the range. The author advises traders to exit their profits according to their own analysis or price action and not to re-enter on the next pullback of the same trend. The same rules apply when the thin line crosses downwards over the thick line.
The author emphasizes that range creation is mandatory on crossing and that traders should not try to go against the trend. If the price is above both lines, traders should only go for buy orders, and vice versa.
If there is no range created while crossing, traders are advised not to enter the market. Traders should wait for the opportunity and not force a trade.
The indicator also includes a plot of the 34 EMA, and a range is created above and below the price action using the "up" and "down" variables. The author uses the "fill" function to color the background of the chart to highlight the range. The "dummy" variable is used to plot circles above or below the price action, depending on the trend.
In summary, the "TradeEasy - Kintro" indicator is a custom indicator designed to help traders identify potential buy and sell signals based on the crossing of two EMAs. The author provides a set of rules to generate trading signals and advises traders to wait for the opportunity and not force a trade. The indicator also includes a visual representation of the range created on the chart. As always, traders are advised to conduct their own research and analysis before entering any trades.
"range" için komut dosyalarını ara

Average Range @coldbrewroshTaking the average daily range from low to high or high to low isn't the "best" way to get an idea of how much to set targets. So, I made this indicator to make the system better.
This indicator calculates the daily range from Open to High on Bullish Days & Open to Low on Bearish Days .
Nobody can catch the absolute low of the day on bullish days and get out at the high but one can enter at a reasonable price around the open ( 17:00 EST ) .
To complement the Average Range, another table shows the movement in the opposite direction.
For Instance: On Bullish Days how much it moved from Open to Low so that we have an idea of where to put the stop loss and vice versa. The time ranges calculated are the last 5 days, last 1 month, last 3 months & last 1 year.
Note #1: Even though the date range is predefined, it has a different meaning. For Instance: date range of last 5 days means "calculation of the range of last 5 bullish daily candles & not last 5 days" .
Note #2: Exclusive to Forex at the time of posting this.

True Average Period Traded RangeTrue Average Period Trading Range (TAPTR)
The J. Welles Wilder Average True Range calculation includes the ability to calculate in gaps into the equation.
It is in my opinion that gaps are untraded range values until the prices on their own come back and close the gaps.
The TAPTR calculation is simple, it is the average for a set period of time of the HIGH - LOW.
The ATR average calculation is automatically set based on the timeframe period you are looking at.
12 Months (1 year) = 10 (1 decade)
Months = 12 (1 year)
Weeks = 12 (1 business quarter)
Days = 21 (1 trading month)
4 Hour = 9 (5 trading days)
1 Hour = 33 (5 trading days)
45 minutes = 9 (1 trading day)
30 minutes = 14 (1 trading day)
15 minutes = 28 (1 trading day)
10 minutes = 42 (1 trading day)
5 minutes = 85 (1 trading day)
1 minute = 420 (1 trading day)
default value = 21 (if using a timeframe not described above)
The "master trend" as being a 21 SMA.
The colored columns represent the actual range value for that time period.
Description of values from left to right.
1) Actual Trade Range Value for the time period you are viewing
2) % of price (in decimal, you need multiply by 100 to get the true percent)
3) Average Traded Range
4) % of price
5) .618 of Average Traded Range
6) % of price
7) Mean of #3 and #5
8) % of price
The % of price is displayed in its calculated form. You need to multiple the value by 100 if you want the actual percent.
Example: Displayed Value: 0.0246 = 2.46%
Why calculated form only? If the ranges are .72 and the % of price is 2.32 the indicator looks all jacked up like a redneck's pick-up.
However, if it is .0232, everything is to scale.
Why is % of price helpful?
If you are trading and are aware that average period traded range is 5%, you now have an idea of an average return if you could catch from low to high (or short high to low).
Bar Colors
RED is greater than 4.2x TAPTR
ORANGE is greater than 2.618x TAPTR but less than RED
YELLOW is greater than 1.618x TAPTR but less than ORANGE
GREEN is greater than .618x TAPTR but less than YELLOW
BLUE is less than GREEN
The colors of the bars represent how far from the Master Trend (21 SMA) the close is.
This is determined by taking the difference between the close and the 21 SMA and dividing by the current TAPTR.
EXAMPLE:
IF you have a RED bar, the close is greater than 4.2 TAPTRs away from the 21 SMA. This means that either prices will stall and remain flat until
the SMA comes to the prices or turn and return to the SMA.
If prices are greater than 4.2 TAPTR, that also represents that it is greater than 4 or more time periods from the mean if the return traded within the averages.

Impatient TS VWAP BandsImpatient VWAP bands are based of Traderskew's VWAP bands but are for more impatient traders.
Wicking or crossing down through the upper band indicates a good short trade entry for range-bound trading periods while wicking or crossing up through the lower band indicates a good long entry in range-bound conditions.
By default, impatience is disabled. If it is turned on, adjusting impatience determines how quickly the bands approach price: higher impatience approaches price faster. Rebound indicates how far from price the bands bounce after hitting price.

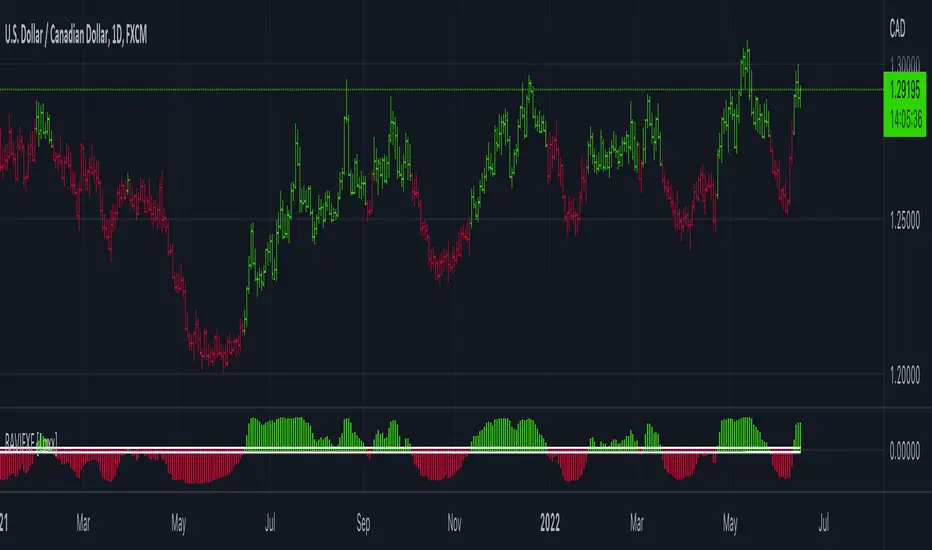
RAVI FX Fisher [Loxx]RAVI FX Fisher is a special implementation of RAVI using WMA moving averages and ATR and then normalized like Fisher Transform. If the histogram falls between the white lines, the market is too choppy to trade. This indicator is tuned for Forex.
What is RAVI?
The Range Action Verification Index (RAVI) indicator shows the percentage difference between current prices and past prices to identify market trends. It is calculated based on moving averages of different lengths.
Included:
-Change bar colors
Stop Loss With Average True Range (ATR)Stop Loss With Average True Range (ATR)
It simplifies the calculation of stop loss price for stop loss method using the average true range (ATR).
For example;
You want to stop loss below 3 ATR. Let's assume the price is 100, the average true range is 5. You will multiply the average true range by 3 and subtract from the price and enter a stop loss order at the 85 price you have reached. Instead of doing this calculation every time, you just need to use this script and set the multiplier to 3. A stop loss line will be drawn below the price candles.
You can set the method to be used when averaging the true range. Methods you can use to average: EMA (exponentially moving average), HMA (hull moving average), RMA (moving average used in RSI), SMA (simple moving average), SWMA (symmetrically weighted moving average), VWMA (volume-weighted moving average), WMA (weighted moving average).
You can set the length to be used when averaging the true range.
You can set the multiplier to be used when determining the stop loss price.
Turkish
Ortalama Gerçek Aralıkla (ATR) Zarar Durdurma
Gerçek aralığın ortalamasını kullanarak zarar durdurma yöntemi için zarar durdurma fiyatının hesaplanmasını kolaylaştırır.
Örneğin;
3 ATR kadar aşağıda zarar durdurmak istiyorsunuz. Fiyatın 100, ortalama gerçek aralığın 5 olduğunu varsayalım. Ortalama gerçek aralığı 3 ile çarparak fiyattan çıkaracaksınız ve ulaştığınız 85 fiyatına zarar durdurma emri gireceksiniz. Bu hesabı her seferinde yapmak yerine bu betiği kullanmanız ve çarpanı 3 olarak ayarlamanız yeterli. Bu sayede fiyat mumlarının altına zarar durdurma çizgisi çizilecektir.
Gerçek aralığın ortalaması alınırken kullanılacak yöntemi ayarlayabilirsiniz. Ortalama almak için seçebileceğiniz yöntemler: EMA (üstel hareketli ortalama), HMA (gövde hareketli ortalama), RMA (göreceli hareketli ortalama), SMA (basit hareketli ortalama), SWMA (simetrik ağırlıklı hareketli ortalama), VWMA (hacim ağırıklı hareketli ortalama), WMA (ağırlıklı hareketli ortalama).
Gerçek aralığın ortalaması alınırken kullanılacak periyot uzunluğunu ayarlayabilirsiniz.
Zarar durdurma fiyatını belirlerken kullanılacak çarpanı ayarlayabilirsiniz.

Bogdan Ciocoiu - Sniper EntryWhat is Sniper Entry
Sniper Entry is a set indicator that encapsulates a collection of pre-configured scripts using specific variables that enable users to extract signals by interpreting market behaviour quickly, suitable for 1-3min scalping. This instrument is a tool that acts as a confluence for traders to make decisions concerning current market conditions. This indicator does not apply solely to an asset.
What Sniper Entry is not
Sniper Entry is not interpreting fundamental analysis and will also not be providing out of box market signals. Instead, it will provide a collection of integrated and significantly improved open-source subscripts designed to help traders speculate on market trends. Traders must apply their strategies and configure Sniper Entry accordingly to maximise the script's output.
Originality and usefulness
The collection of subscripts encapsulated in this tool makes it unique in the Trading View ecosystem. This indicator enables traders to consider entry positions or exit positions by comparing similar algorithms at once.
Its usefulness also emerges from the unique configurations embedded in the indicator's settings, which are different from those of the original scripts.
This indicator's originality is also reflected in how its modules are integrated, including the integration of the settings.
Open-source reuse
I used the following open-source resources, which I simplified significantly and pre-configured for short term scalping. The source codes for the below are already in the public domain, including the following links listed below.
www.tradingview.com (open source)
(open source and generic algorithm)
www.tradingview.com (open source)
(open source)
(open source)
www.tradingview.com (generic MA algorithm and open source)
(generic VWAP algorithm and open source)

Multi-Timeframe ATR Levels█ OVERVIEW
This indicator plots the upside and downside ATR levels popularized by Trader Dante.
█ CONCEPTS
Beyond a level's boundary, a market is trading over its average volatility. The indicator adds confirmation to "reversal" setups located at likely mean reversion. Oppositely, it highlights trades with an increased risk where the price is over-extended and when the market is possibly exhausted.
Inside the levels’ boundaries, a market is trading within its average range. The indicator adds confluence to your target selection. Indeed, a target set at or nearby a level is at reasonable reach for the selected period. In addition, it can improve your stop placement. Tucking your stop-loss outside the boundary of a level adds an extra assurance that your stop is beyond reach.
█ FEATURES
Multi-Timeframe
By default, the indicator sets the timeframe to the daily for tracking how much price moves compared to its average volatility during a day. To the same extent, you can set it to any other timeframe. For example, you can use the weekly or the monthly timeframe for adjusting your trading during the week or when approaching the end of the month.
Configurable ATR
• Pick your preferred smoothing between the Simple Moving Average (SMA) or the Relative Moving Average (RMA). The SMA is used in the original MT4 indicator, and the RMA is the default in TradingView.
• Set the length for getting the average price movement. For example, you can set it to 20 for the daily ATR (20 trading days in a month), 12 for the weekly ATR (3 months), or 6 for the monthly ATR. Also, you may set a shorter length when you want to emphasize the recent price volatility.
• Apply a custom multiplier on the ATR when you want to focus on a particular price movement.
• Select the reference between “previous” or “current” ATR value (default set on previous).
Customizable Labels
• Personalize what info to show in the labels located on the right side of the levels. You can compose the data for showing the price, the ATR, both the price and the ATR or none.
• On hovering a label, a smart tooltip displays the complementary data. The less info a label displays, the more its tooltip shows.
• Choose how to display the values. In addition to the labels, the indicator can display the last values on the price scale, the status line, and the data window.
Enhanced Coloring
At a glance, see which level the price is approaching with the "Cold & Warm" coloring or quickly glimpse when the price has reached or exceeded the ATR with the "Overflow" coloring.
Others
• Automatically hides levels when the chart’s timeframe is higher than the indicator’s one.
• Alerts setting.
█ NOTES
Calculation
Upper band = low* + ATR
Lower band = high* - ATR
*The previous close is used when a gap up/down occurs.
This is a PREMIUM indicator. I also have a free version of the Daily ATR Levels .

SD - Average True Range v5 - DoubleSD - Average True Range - Daily Weekly Monthly Yearly v5
It gives ATR intervals as 4 hours, daily, weekly, monthly and yearly. The expectation is to fill the ATR targets within the specified ranges. It can be used to determine target points on charts with a clear direction on the train.
Unlike the previous version, it is provided to use 2 different periods in the same indicator.
Note: Developed based on the source codes of the original SD ADR indicator.

CBG Opening Range and Initial BalanceThis is a total re-write of my previous Opening Range indicator. All the same functionality with better code
Features
Opening Range and Initial Balance ranges (30 minutes and 1 hour defaults)
Overnight Range
Daily Open Price
Can select which midpoint: OR or IB
4 separate extensions (up and down) based on either OR or IB
Shaded range area
All lines and shading can be turned on and off in the Style menu
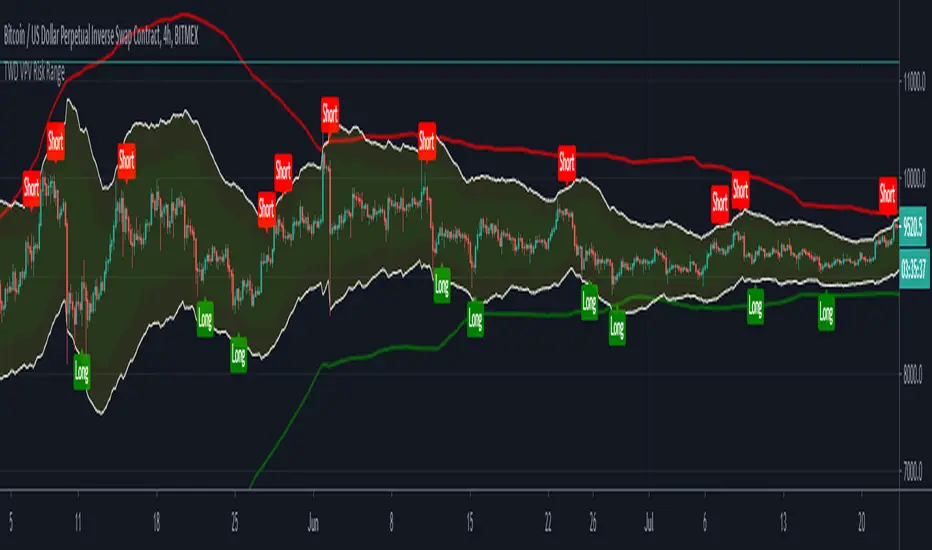
TWD VPV Risk RangeThe 'TradingWithDan Volume Price Volatility Risk Range' indicator identifies two risk ranges based on the volatility and volume of the underlying asset. It then uses those to identify when the trend towards the top or bottom of the risk range is potentially reversing and issues a 'long' or 'short' signal.
The larger risk range is identified by the red and green lines is used to visualise the larger context of the price movement so when the top of the smaller risk range approaches the larger risk range line then the upward trending movement is potentially reaching exhaustion and there is a greater risk of downside. The opposite is also true when the bottom of the smaller risk range approaches the lower larger risk range line.
This indicator is designed to be used in a trending market, either up or down and if for example you have identified an asset that is in an uptrend, or an asset you wish to accumulate, you can take partial position entries at the 'buy' signals and take partial profits at the 'sell' signals. You can use it effectively in a none trending market, taking the outright short or long potions, but you will be at risk of a trend developing.
The indicator isn't designed to identify trends, but to identify sell and buy entries that occurs due to the natural Brownian motion of the price action.
It is designed for my style of trading where I do not enter the entirety of my intended position in one go and will take partial profits when there are price movements towards the top of the risk range if I am long and then put more of the position back on towards bottom of the risk range and vice versa if I am short an asset. It is especially useful for managing my long term core positions and finally I use the alerts to trigger automated trading bots for my positions using the signals.
It can be used on a wide range of assets and on all time frames.
High & Low Of Custom Session - OpeningRange Breakout (Expo)High & Low Of Custom Session - OpeningRange Breakout (Expo) prints the high and the low of a custom session.
I use the indicator to trade the re-test of opening range (high/low) as well as breakouts from the opening range. The same logic can be applied to the session you have chosen.
HOW TO USE
1. Use the indicator to trade the re-tests of the session range.
2. Use the indicator to trade breakouts of session range.
INDICATOR IN ACTION
1-min chart
I hope you find this indicator useful , and please comment or contact me if you like the script or have any questions/suggestions for future improvements. Thanks!
I will continually work on this indicator, so please share your experience and feedback as it will enable me to make even better improvements. Thanks to everyone that has already contacted me regarding my scripts. Your feedback is valuable for future developments!
-----------------
Disclaimer
Copyright by Zeiierman.
The information contained in my scripts/indicators/ideas does not constitute financial advice or a solicitation to buy or sell any securities of any type. I will not accept liability for any loss or damage, including without limitation any loss of profit, which may arise directly or indirectly from the use of or reliance on such information.
All investments involve risk, and the past performance of a security, industry, sector, market, financial product, trading strategy, or individual’s trading does not guarantee future results or returns. Investors are fully responsible for any investment decisions they make. Such decisions should be based solely on an evaluation of their financial circumstances, investment objectives, risk tolerance, and liquidity needs.
My scripts/indicators/ideas are only for educational purposes!

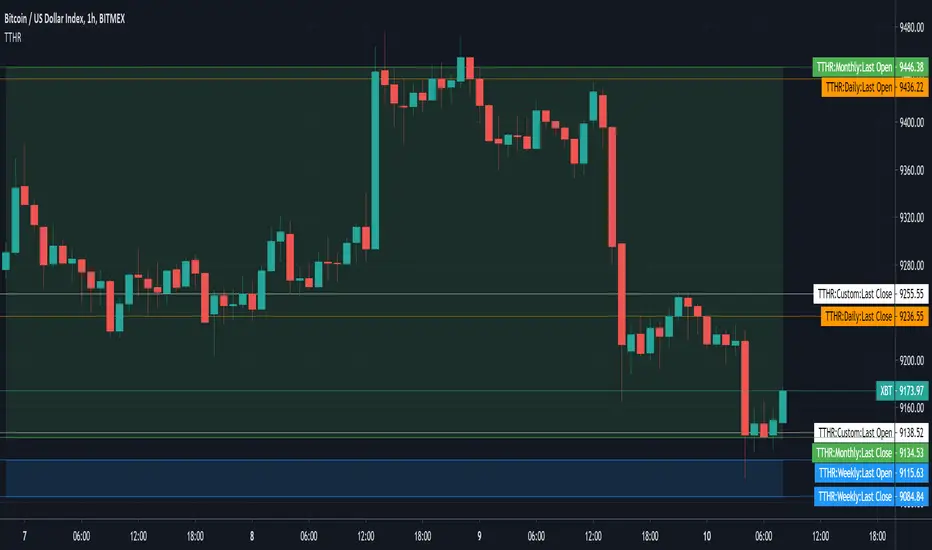
TT Historical RangesBeta - Ongoing Updates
Used to overlay the Open and Close prices and trading range for Last Daily, Weekly and Monthly Candle on your own charts and timeframes.
In the example shown
the green area is showing the last Monthly Candle open and close range
the blue area at the bottom is showing the last Weekly Candle open and close range
the remaining horizontal are for the last Daily Candle (orange lines) and the User Selected Candle of 3 Days (white lines).
NOTE: the labels next to the scale for each price line are only visible if you turn on indicator labels in the scale settings .
Indicator Settings - Daily, Weekly, Monthly and User Selected plots have their own display and style options.
enable or disable last open price line
enable or disable last close price line
enable or disable historical trading range (fill between open/close)
select and your own preferred time frame to display
NOTE: used for my own educational purposes and is not fit for trading advice or strategies.
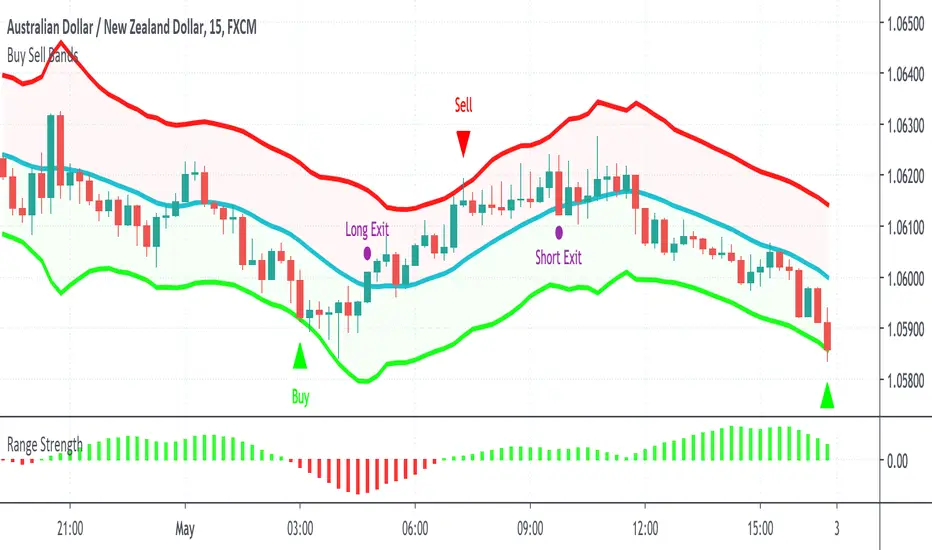
Buy Sell BandsBuy Sell Bands is a super simple indicator based on the mean reversion (range trading) strategy that shows you exactly where to buy, sell and close trades on every chart, market and timeframe.
It's best used together with our Range Strength indicator to identify when the market is in a range mode, this is the best time to take the entry signals from the Buy Sell Bands.
How Is It Different From Other Indicators?
- Designed specifically for the mean reversion (range trading) strategy
- Upper and lower bands are based on current and past volatility
- Aren't as sensitive to "squeezes" after periods of contracted volatility
- Works well in conjunction with the Range Strength Indicator to confirm entry signals
- Helps identify good "pair trading" opportunities
- Can be applied to all markets and timeframes
How To Use The Indicator?
1) Visit our website URL shown below this description and signup
2) We will then grant your TradingView username permission to use our indicators
3) Go to your Indicators window, then the Invite-Only section and add our indicators to your chart
4) Our indicators will then show on every chart you now look at
5) You can set up alerts to be notified in real time of trading signals from our indicators
6) Read our user manual for all the best tips on how to use our indicators as part of a range trading strategy
7) Feel free to reach out to us for personal one-on-one help with getting setup
What Markets and Conditions Does It Work Best On?
All markets cycle between trending and ranging modes, and the key to successfully using these indicators is identifying when the market is in or about to go into a range trading mode, and as such it can be applied to all markets and timeframes.
Some markets and timeframes trade within ranges more predictably than others, for example Forex, Cryptocurrencies, and Futures on the 15 minute timeframe during the US night session can work well due to the lack of price sensitive news creating lasting trends. With Stocks & ETFs on the 5 minute timeframe during the midday session on large cap blue chip stocks with no recent news releases can show strong range trading environments to use our indicators in.
In addition to single markets, you can also use our indicators on pair charts, for example Coca Cola(KO) versus Pepsi(PEP), you can do this by entering KO/PEP inside your TradingView chart quote box and it will bring up a pair chart. Our indicators will show buy and sell signals right on the pair chart just like any other single instrument chart. You can get very creative with what type of pairs you can come up with.
Our indicators are primarily designed for day trading and swing trading, however they can also be used for position trading and investing by identifying technically oversold and overbought range levels that are based on current and past volatility around a dynamic average price, for this we recommend using a weekly chart to identify longer trading opportunities.
As always indicators should be used as part of a trading strategy to assist in making decisions, instead of just blindly following every signal they produce you should always seek to compliment technical trading signals with additional analysis to reduce your risk and increase your odds of making a winning trade.
Examples Of Use On Various Markets and Timeframes
GBP vs CHF Forex Pair 15 Minute Chart
Tesla Stock 1 Minute Chart
Bitcoin vs USD Crypto Pair 15 Minute Chart
Micro E-Mini SP500 Futures 1 Minute Chart
Mastercard vs Visa Stock Daily Pair Chart
To gain access to the Buy Sell Bands and Range Strength Indicators visit our website shown below.
Happy Range Trading :)
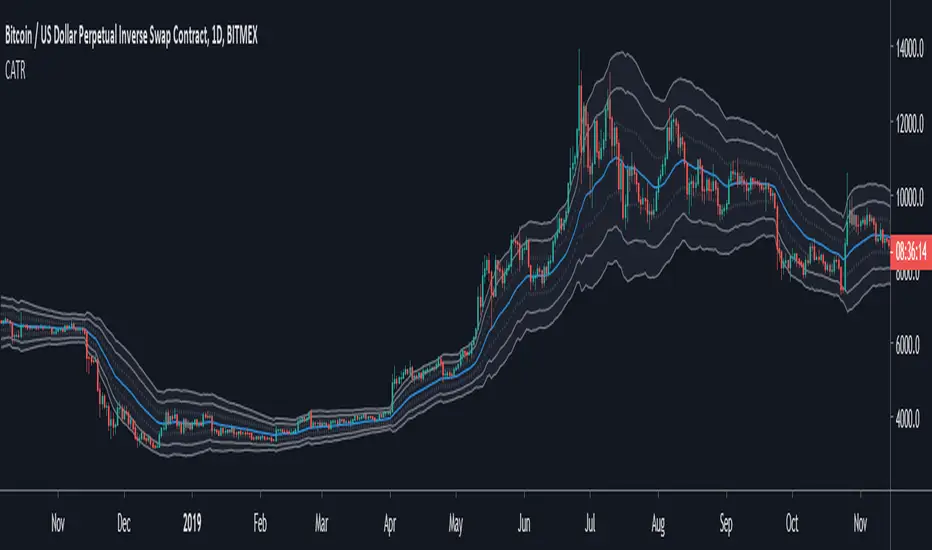
Channel ATR1 - What is the Channel ATR indicator
This is an envelope indicator (like the Bollinger bands indicator) used to evaluate how much the price diverge from it's moving average.
This indicator can be used as a system on it's own. I recommend to use it when the market goes side way, although, you can also use it when the market is trending.
What makes this indicator so relevant and reliable ? The use of the ATR to build the envelope. Read below if you wan to know more.
2 - How is the Channel ATR computed
The main component is an EMA. The envelope is made of 3 layers, each is the Average True Range, plot at a multiple distance from the EMA (1*EMA, 2*EMA, 3*EMA) . If you don't know what is the ATR, it's basically a measure of the volatility (you can read more about it here ).
Each layer of the envelope is a multiple of the measure of the volatility. Let's see how to use it.
3 - How to use the Channel ATR indicator
You can use this indicator in different strategies :
- Return to the mean: When the price goes out of the envelope, it's an excess of the market. You can take advantage of this by betting to a return to the EMA value.
- Trend following : If the market is tending, you can buy/sell when the price touch the EMA and place a target at another level in the envelope.
- Stop loss: Since each envelope layer is built from the ATR (i.e. the volatility), you can use it to place your stop at least at 1 ATR from your entry, to not be hit by the market noise.
- Find your own way : The Channel ATR is a very rich and powerful indicator, you can try to built your own trading system on the top of it.
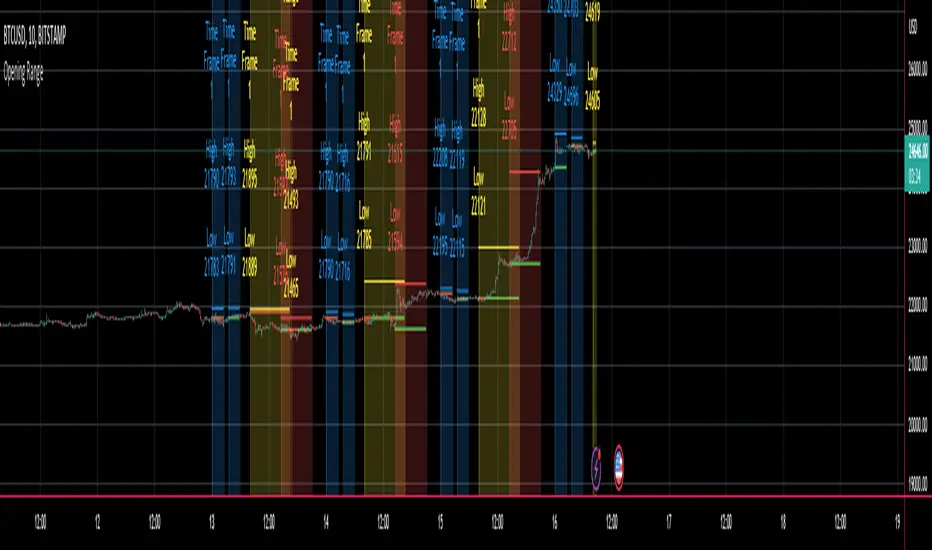
Multi Ticker Session Opening High Low RangeThe Multi Ticker Session Opening High Low Range Indicator by the Caretaker.
The original idea for this indicator came out of a request from Krown's Crypto Cave community member ZFelds.
This indicator is designed to display the High / Low Ranges of the "on chart" asset, at a chosen resolution from the opening time of, and for the duration of, the chosen Ticker Sessions (up to 3) .
Its function is to allow the user to easily keep track of the session times of the major world indices, and the reaction of the on chart assets price from the opening of the ticker sessions over the duration of the ticker sessions.
Typically used for a guide when scalp trading on low time-frames by plotting the opening 1 or 5 minute High/Low trading range of an asset during the start of a major market opening up an d making trading decisions based on the reaction of Price Action around those levels.
It does this by plotting High / Low Range bands (plus mid-lines) which displays the High and Low range of the on chart assets opening candle at the chosen time resolution for the chosen ticker (Defaults : SPX, NI225, UKX).
The Range bands fill colour changes depending on whether the chart asset closes candles within, above, or below the range (Default : Silver, Green, Red).
It plots optional Background "Session Bars" and "Session Banners" which function to clearly show the session.
The background "Session bars" can be set to plot just the first bar as a signal or on all session bars.
The "Session Banners" are horizontal lines of chosen width which "float" above the chart data.
Optional info text-boxes also "float" above the chart data and function to display the session opening range information.
(Ticker symbol, Opening range time resolution, Session open high & low).
The text-boxes can be set to full label or short label.
The text-boxes can be set to the left or center of the session.
The height offset by which the text-boxes and banners float above the highest high of the range is alterable in the settings.
The text-boxes and banners also have a "clash avoidance" function which will offset their heights to help avoid them clashing on screen (This offset is alterable in the settings).
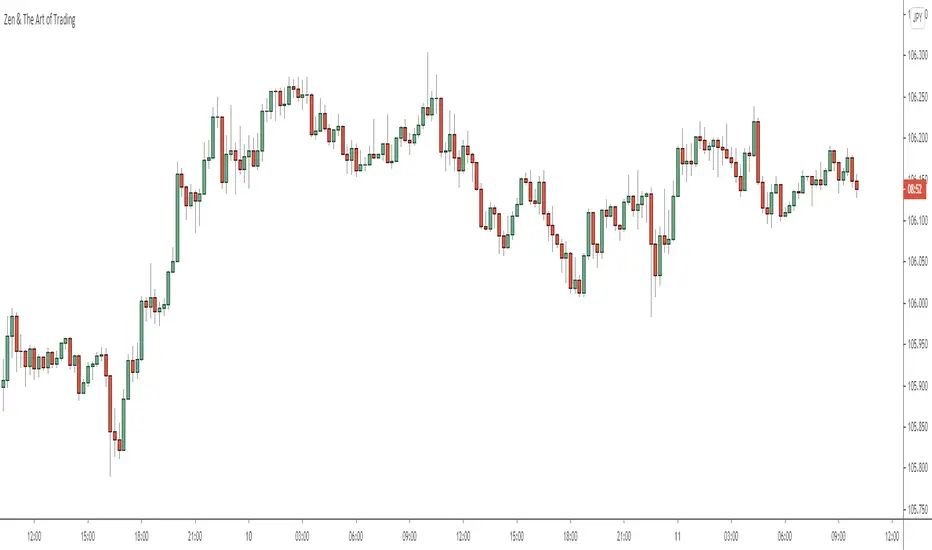
ATR (Average True Range) By TimeWhat is ATR By Time?
This premium indicator was inspired by my RVOL By Time indicator . It works on Stocks, Forex, Crypto and most Futures markets. Instead of calculating the ATR by recent price data, it calculates an ATR value for each candle based on that candle’s time of day.
For example, if you set the Lookback setting on this indicator to 14, then instead of calculating the ATR based on the past 14 candles, it will calculate an ATR value based on the past 14 trading sessions for each candle.
This is extremely useful for day traders in particular as it allows you to gauge the average range of candles during certain times of day instead of only by the most recent price action.
It also draws a regular ATR (optional) – so this is essentially an enhanced ATR script that gives you multiple readings on price volatility.
If you are interested, you can purchase access to the script or register for a free trial on my website: ATR By Time Feature Page .
Why Does It Cost Money?
The reason why this is a premium script that requires payment to access is because it took a lot of time, research and development in order to create. The other advantage of charging for it is that it retains exclusivity to only a select few dedicated traders.
By paying the yearly fee you get access to ALL of my premium indicators including lifetime updates and technical support.
If you don’t want to pay for this script then I completely understand and I have plenty of other free indicators and scripts that you might be interested in!
Free Trial
I am a trader myself and so I know how skeptical you might be that this indicator is worth your time and money. That is why I am offering a free trial of this indicator.
All you need to do to initiate your trial is Join My Mailing List/ on my website: zenandtheartoftrading.com
How It Works
This script uses a complex formula to calculate ATR values across distant historical bars.
Depending on the timeframe you select it will skip through historical bars to find previous bars from the same time of day. It collects these values then applies the traditional ATR formula to them.
The ATR value is determined by the maximum result of the following three calculations:
- Current high minus the current low
- The absolute value of the current high minus the previous close
- The absolute value of the current low minus the previous close
- Whichever of these three calculations comes out highest, that is your ATR for the given candle.
Once this value is calculated for historical bars the ATR indicator’s reading is typically determined by a 14-period moving average of these individual ATR values. So the ATR reading you see on your screen is an average of the past 14 ATR values.
This means that as markets expand and contract this volatility reading will adapt to the change in candle price ranges.
The difference with the ATR By Time indicator’s calculation formula is that rather than referencing recent bars it references bars based on their time of day.
For example, if you are on the 1-Hour chart and you check the ATR By Time value at 9:00AM with a Lookback period of 14, then the value you see will be the result of the ATR calculation of every 9:00AM 1-Hour candle over the past 14 trading sessions.
You can also choose to enable the ATR moving average in the settings menu if you wish. This will give you a smoothed ATR reading by averaging the current session’s ATR value with previous sessions.
This versatility gives you a sophisticated reading on price volatility which is particularly helpful for day trade setups based around market opens or market closes when volatility tends to spike.
The regular ATR indicator will not account for this on the lower timeframes, but this indicator will!
Examples
Stocks - Heatmap Scheme with regular ATR
Stocks - Price Scheme - No ATR
Stocks - Traffic Scheme - Session Average Line RMA
Stocks - Trigger Scheme - 10 sessions
Forex - RMA
Forex - No RMA
Forex - Normal ATR Stop
Forex - Session ATR Stop
Weekdays HeatmapA utility tool for getting interesting weekdays statistics.
Features
26 sources (standard prices, volumes, ranges)
Readable and optimized code
How to interpret
The darker the color, the stronger the weekday dominance
Supported sources/metrics
open
high
low
close
oo2 , (open + previous open) / 2
oh2 , (open + high) / 2
ol2 , (open + low) / 2
oc2 , (open + close) / 2
hh2 , (high + previous high) / 2
hl2 , median price
hc2 , (high + close) / 2
ll2 , (low + previous low) / 2
lc2 , (low + close) / 2
cc2 , (close + previous close) / 2
hlc3 , typical price
ohlc4
weighted close , (2 * close + high + low) / 4
true range
double true range , by Cynthia Kase
open/close range
high/low range
volume
tick volume
net volume
on balance volume
acc/dist , accumulation/distribution line
price volume trend
trade value , volume * close * pipvalue
How to get access
PM me for more details

ATR Entries & Stop Loss [Jigga]This is a simple script that displays multiples of ATR and shows you where the potential zones for longing and shorting are. The majority of people use ATR as a stop loss, so we can use it for our advantage and get in when they are stopped out. There is also a possibility to add a stop loss, so a trader can lose little when he is wrong and maximize profit when he is right. It works the best in ranging markets.
Do not forget to always use a proper stop loss and risk management.
Here you can see it in action:
BTC - BitMex - Range bound market

Average True Range OverlayPlots ATR calculated on a daily basis as an overlay on the current chart.
Implemented using the builtin atr function.
ATR is a volatility indicator
originally developed by J. Welles Wilder, Jr. for commodities:
New Concepts in Technical Trading Systems. Greensboro, NC: Trend Research. ISBN 978-0-89459-027-6.
The range of a day's trading is simply R = high − low.
The true range extends it to yesterday's closing price if it was outside of today's range:
TR = max
The average true range is an N-day smoothed moving average of the TR values.
A first stab at a sensible stop loss level might be 3*ATR below recent peak.
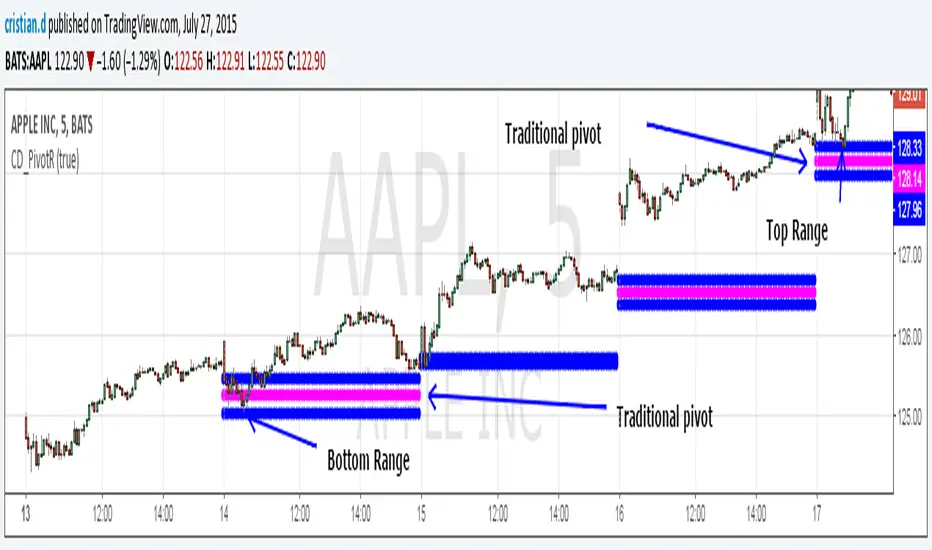
Pivot Range Pivot BossMy first attempt to code something. It's Mark Fischer concept of Pivot Range from his book Logical Trader.
The strategy for using it is actually from Frank Ochoa's book Secrets of a Pivot Boss. Pivot Range is the "meat of the matket" and "the heart beat of the market" according to him.
Besides using the actual pivots the strategy is based on the relationships between 2 day pivot ranges.
Higher Value - Bulish
Overlapping Higher - Moderate Bulish
Lower Value- Bearish
Overlapping Lower - Moderate Bearish
Unchanged - Sideways/Breakout
Outside - Sideways
Inside - Breakout
MA ATR RangeExponencial Moving average with 3 ATR ranges. It shows trend and overbought and oversold levels.

Magic Hour Range + Window Levels (0/50/75/100 + Extensions)This indicator plots one or more “Magic Hour” ranges (by ET hour) by drawing the hour’s high/low box, then extending an aligned post-hour analysis window for a set number of hours. Inside that window it overlays key reversion targets—0% (High), 50% (Mid), 100% (Low), optional 25%/75%—plus optional extension levels beyond the range (±25/50/75/100% and extras). All levels are clipped to the analysis window for a clean, session-by-session view of range, targets, and extensions.
