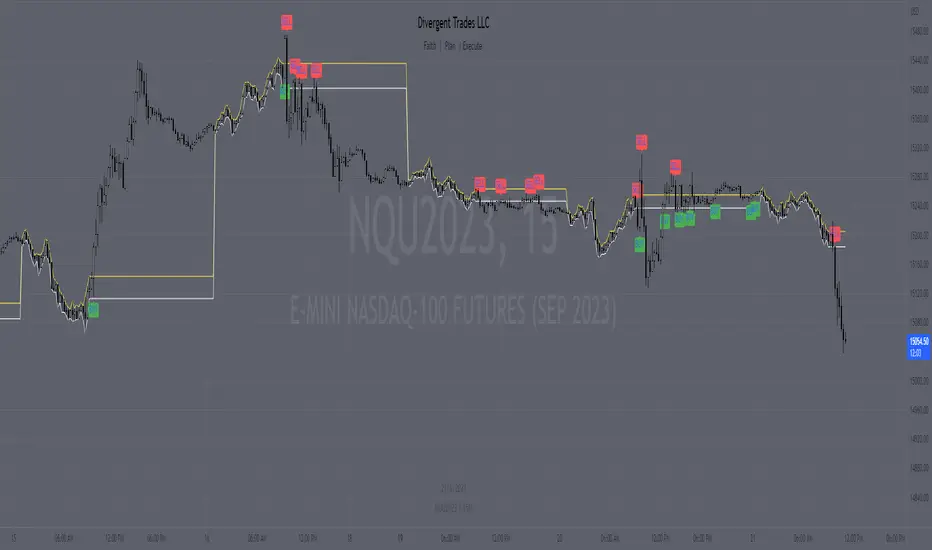
Range H/L Buy and Sell SignalThe "Range H/L Buy and Sell Signal" indicator is designed to identify potential buy and sell signals based on a specified price range and market volatility. This indicator can be used in the TradingView platform to assist traders in making informed decisions.
The indicator allows customization of several parameters to adapt to different trading strategies. These parameters include the start and end times for the price range, the volatility threshold, and the desired breakout conditions.
To begin, the indicator calculates the range start and end timestamps based on the provided hours and minutes. This defines the time period within which the indicator will analyze price movements.
Next, the indicator determines the highest high (High) and lowest low (Low) within the specified price range. These levels represent the upper and lower boundaries of the range and act as potential breakout points.
Volatility is also taken into account to filter out false signals. The indicator calculates the true range and the average true range over a period of 14 bars. The true range measures the price range from the current high to low, while the average true range provides an indication of market volatility.
Based on the breakout conditions and the volatility threshold, buy and sell signals are generated. A buy signal occurs when the closing price crosses above the High and the true range is greater than the volatility threshold multiplied by the average true range. Conversely, a sell signal is triggered when the closing price crosses below the Low and the true range exceeds the volatility threshold multiplied by the average true range.
The indicator visually displays the High and Low levels as plotted lines on the chart. Additionally, it marks the buy signals with green labels labeled "BUY" below the corresponding bars and the sell signals with red labels labeled "SELL" above the bars.
It is important to note that this indicator should be used in conjunction with other technical analysis tools and indicators for comprehensive market analysis. Trading always carries risks, and it is crucial to exercise caution and conduct thorough analysis before making any trading decisions.
Divergent Trades LLC:
Disclaimer: The information provided by the Divergent Trades LLC indicator is for educational and informational purposes only. It should not be considered financial advice or a recommendation to buy, sell, or trade any financial instrument. Divergent Trades LLC is not responsible for any losses incurred as a result of using this indicator. Trading in the financial markets carries a high level of risk and may not be suitable for all investors. Before making any investment decisions, please consult with a financial advisor and do your own due diligence. Past performance is not indicative of future results. By using the Divergent Trades LLC indicator, you acknowledge that you have read and understand this disclaimer and agree to its terms and conditions.
"range" için komut dosyalarını ara
Range DetectionThis is a simple indicator to find the sideways market or ranging market.
It is mainly focused on BTCUSD as BTCUSD doesn’t make big moves each and every candle. It makes big breakouts with one candle and then goes sideways for a longer period of time.
So, this indicator identifies those big candles and plots high and lows of those big candles using lines. New range is created only when new candles close above or below previous major candles high or low.
Range Chart Time Analyzer by Shresht
DISCLAIMER :
This indicator is provided for informational and educational purposes only. It is not intended as financial, investment, or trading advice. The calculations and data presented by this indicator are based on available historical information and predefined logic, which may not always reflect real-time market conditions accurately.
I do not guarantee the accuracy, reliability, or completeness of the values displayed by this indicator. Users should independently verify any data before making trading decisions. I am not responsible or liable for any losses, damages, or financial consequences resulting from the use of this indicator.
By using this indicator, you acknowledge and accept full responsibility for any actions taken based on its output. Always conduct your own research and consult with a qualified financial professional before making any investment or trading decisions.
Range-Chart Time Analyzer
Make your Range Chart Complete
Overview:
This indicator is specifically designed for Range Charts. Unlike traditional charts, Range Charts plot bars at varying time intervals. This indicator helps visualize these "time warps" by calculating the difference between the opening time of the current bar and the opening time of the previous bar, along with their averages. Additionally, it offers optional settings to display Green-only, Red-only, or Green vs. Red averages .
Time Unit:
This indicator uses seconds as the unit of measurement for time
Logic: At its core, it relies solely on the opening time of each candle. The averages are calculated based on the time difference between consecutive pair of bars. For example, with a length of 3, the average is computed as:
/ 2
Features :
~Three Averages
~Green Candle only Average , Red Candle only Average and Green vs Red Average ( Green only Average minus Red only Average )
Inputs/Settings :
~Reference Bar: When the indicator is first added to the chart, it will prompt you to select a Reference Bar. This selection can be changed later without reapplying the indicator by either specifying the timestamp in the settings or adjusting the slider that appears above the red "R" label when hovering over it. The Reference Bar allows you to calculate an average starting from a specific point in time, such as the beginning of a trading session or a significant event like a news release or an announcement.
~Session Breaker: This feature ensures that averages are not skewed by the large time gap between trading sessions, i.e., the last candle of the previous session and the first candle of the current session. It is measured in seconds, as mentioned earlier. Set it to a large number of seconds, but ensure that it is less than the actual time gap between sessions.
~ Length and Length 2: The default Length is set to 2, allowing you to see individual differences. It is important to understand the following: WHEN LENGTH IS 2, THE AVERAGE DISPLAYED BELOW A CANDLE REPRESENTS THE DIFFERENCE BETWEEN THE PREVIOUS CANDLE'S OPEN TIME AND THE CURRENT/LATEST CANDLE'S OPEN TIME. BECAUSE, IN RANGE CHARTS, THE CLOSE OF THE PREVIOUS CANDLE AND THE OPEN OF THE CURRENT CANDLE ARE THE SAME, THIS MAY RESULT IN A RED-COLORED COLUMN APPEARING BELOW A GREEN CANDLE IF THE PREVIOUS CANDLE WAS RED. HOWEVER, THIS DOES NOT AFFECT THE ACCURACY OF THE RED ONLY OR GREEN ONLY AVERAGES. THIS INDICATOR IS ALWAYS "ONE CANDLE AHEAD" IN ITS PLOTTING.
Length 2 is used to calculate a third, larger average with a custom length of your choice.
~ Length for Green Only Average and Length for Red Only Average: These inputs define the lookback period for calculating the average of a specific candle color. A crucial point to remember is that when displaying the Green vs Red Average, both these inputs must be set to the same value to ensure an accurate comparison .
DISCLAIMER :
This indicator is provided for informational and educational purposes only. It is not intended as financial, investment, or trading advice. The calculations and data presented by this indicator are based on available historical information and predefined logic, which may not always reflect real-time market conditions accurately.
I do not guarantee the accuracy, reliability, or completeness of the values displayed by this indicator. Users should independently verify any data before making trading decisions. I am not responsible or liable for any losses, damages, or financial consequences resulting from the use of this indicator.
By using this indicator, you acknowledge and accept full responsibility for any actions taken based on its output. Always conduct your own research and consult with a qualified financial professional before making any investment or trading decisions.

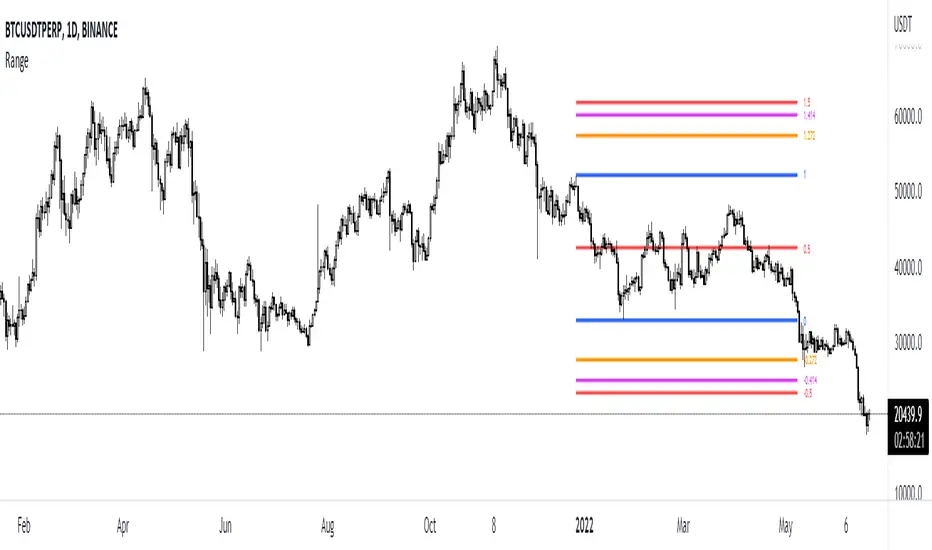
Range by EmreKbThis indicator shows the ranges and add fibonacci levels. Ranges are consolidate zones between two price. Some traders trade with ranges. This indicator for them. Also you can add alert when the range created.
Zigzag Lenght - A number for the zigzag calculation
Fib Level - Fib level for minimum second wave length
Maximum Deviation - Maximum Deviation for range breaked
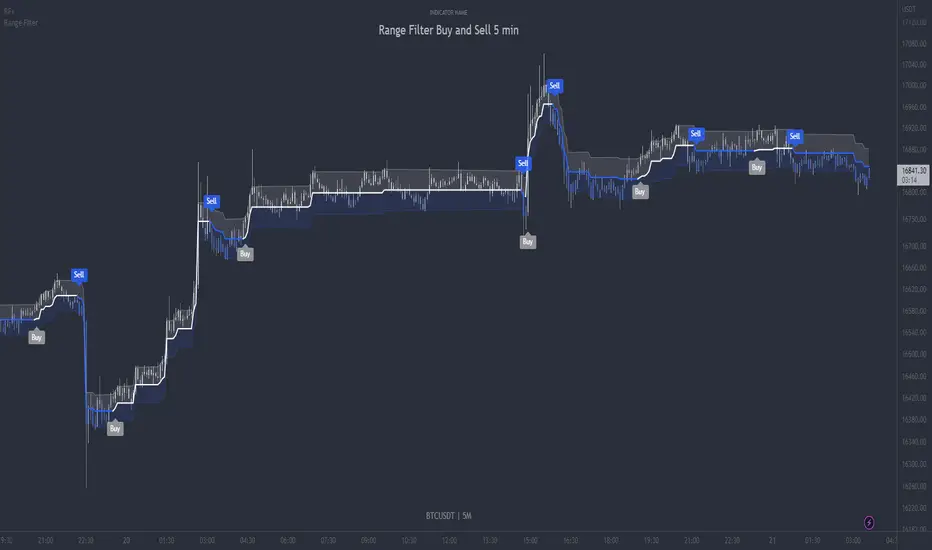
Range Filter Buy and Sell 5min - guikroth versionRange Filter Buy and Sell 5min - the @guikroth version, republished.
Since this popular version of the Range Filter is no longer available via the original author, I republish it here under the same name.
This version remains true to the guikroth version from the calculations to the default settings and comments in the code, with the exception of an update to the latest version of PineScript, minor styling adjustments and the addition of an all-in-one 'buy or sell' alert option.
The guikroth version was a simplified modification of the original Range Filter by @DonovanWall .
Including having just 3 bar colours based on the filtered price trend, different source input options to the original, and the addition of buy and sell signals and alerts based upon the Range Filter colour change. It consisted of just three inputs; source, sampling period, and range multipler. With the update to version 5, external indicators can also be used as inputs, for example using a VWAP or EMA loaded on your chart as the input on the Range Filter is now also possible.
What is the Range Filter?
As the author of the original Range Filter describes it:
"This is an experimental study designed to filter out minor price action for a clearer view of trends. Inspired by the QQE's volatility filter, this filter applies the process directly to price rather than to a smoothed RSI .
First, a smooth average price range is calculated for the basis of the filter and multiplied by a specified amount.
Next, the filter is calculated by gating price movements that do not exceed the specified range.
Lastly the target ranges are plotted to display the prices that will trigger filter movement.
Custom bar colors are included. The color scheme is based on the filtered price trend."
Popularity of the Range Filter
The Range Filter is a very popular and effective indicator in its own right, with adjustments to the few simple settings it is possible to use the Range Filter for helping filter price movement, whether helping to determine trend direction or ranges, to timing breakout or even reversal entries. Its practical versatility makes it ideal for integrating it's signals into a variety of trading strategies or even other indicators.
With many thanks to the authors of the previous and original versions; @guikroth and @DonovanWall .
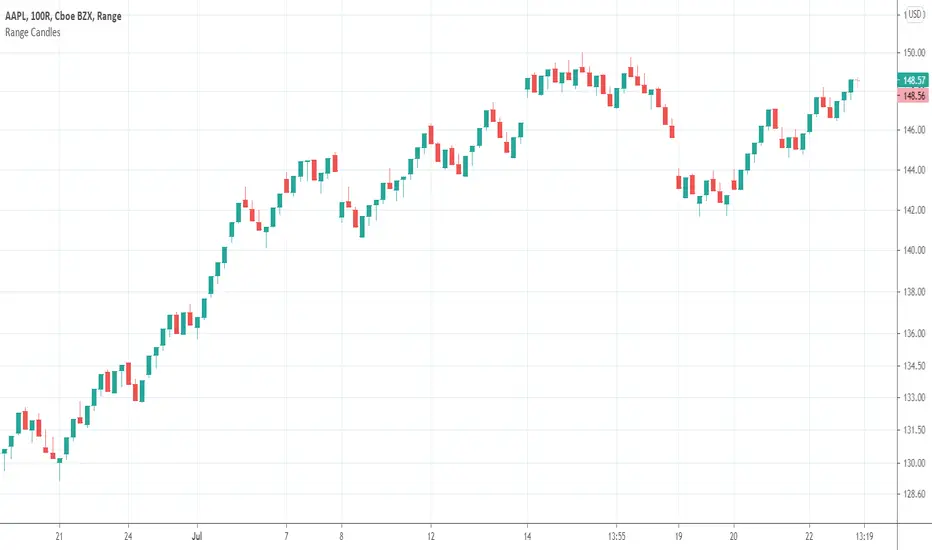
Range CandlesAn easy-peasy way to replace OHLC bars with candles on Range Bars chart. For further improvement you could also make "Up Bars" and "Down Bars" colors transparent (open Range Bars chart settings, do the change and save as default).
Compare
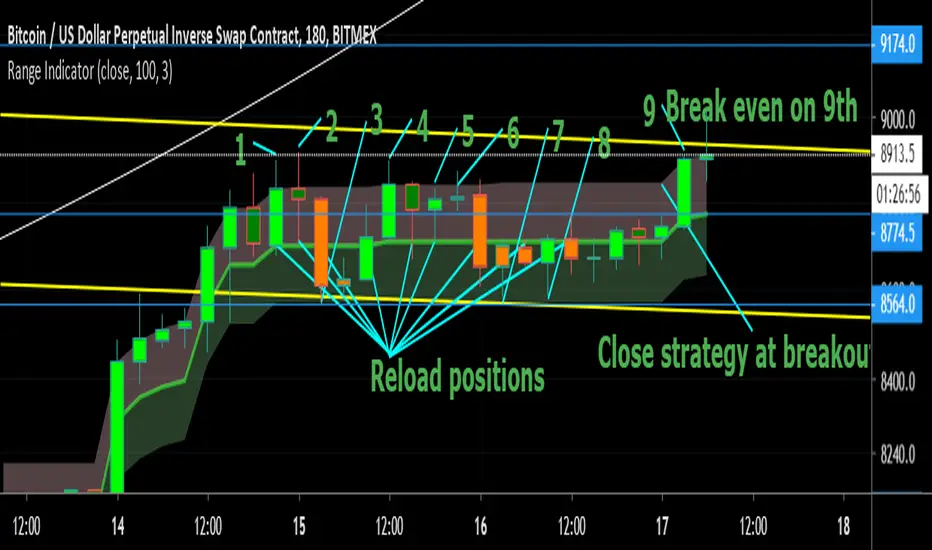
Range Indicator - Bitcoin BeatsHello, Hello, Hello,
And welcome back to Bitcoin Beats.
Today I'm going to show you my Ranges Indicator. Designed initially for breakouts but an analysts mind quickly spots the other uses for this indicator.
If we are consolidating (which is most of the time) a good strategy to trade would be to trade ranges. However, as soon as you spot the range it can feel like the range has changed so you lose out on making the monies.
This indicator plots out the average range in a consolidation allowing you to take action and make those monies.
I've highlighted a profitable strategy in the picture that means you can make money on bitcoin when it goes sideways.
Usually if it is appearing volatile, you can go to a higher time frame and find the exact range it's catering to, adjusting your strategy accordingly.
The strategy I've highlighted in accordance with this indicator is longing AND shorting from the center point of a range and cashing out either side until the range breaks.
If you'd like a trial, please leave a comment and I'll add you to the list :)
See you soon,
Goodbye, from Bitcoin Beats.
Rangebar timeThis indicator determines the time (in minutes) for which a bar of the Range Bar type was formed.
In order to avoid errors in the calculations, a weekend check is immediately carried out (one day if it is a holiday or two days if it is a weekend).
If there are more days off, then the information on the first bar after the weekend may be incorrect.
Индикатор определяет время (в минутах), за которое образовался бар типа RangeBar.
Cразу идет проверка на выходные дни (один день, если праздник или два дня, если выходные).
Если выходных больше, то информация на 1-ом баре, после выходных может быть некорректна.

Ranged Candle Length - evoSimilar to one of my previous scripts 'Ranged Volume', but instead of using volume, this script uses candle length mirrored. It creates a range using highest and lowest of a given period. When the range gets larger, it means the current candle is bigger than the largest candle of your given period (break-out).
Yellow = Bullish break out
Red = Bearish break out
A good way to use this is to follow the direction of the last break-out candle or open a position with a stop just below or above the candle (that's how I tested it real time).
Good luck!

Range Filtered Trend Signals [AlgoAlpha]Introducing the Range Filtered Trend Signals , a cutting-edge trading indicator designed to detect market trends and ranging conditions with high accuracy. This indicator leverages a combination of Kalman filtering and Supertrend analysis to smooth out price fluctuations while maintaining responsiveness to trend shifts. By incorporating volatility-based range filtering, it ensures traders can differentiate between trending and ranging conditions effectively, reducing false signals and enhancing trade decision-making.
:key: Key Features
:white_check_mark: Kalman Filter Smoothing – Minimizes market noise while preserving trend clarity.
:bar_chart: Supertrend Integration – A dynamic trend-following mechanism for spotting reversals.
:fire: Volatility-Based Range Detection – Detects trending vs. ranging conditions with precision.
:art: Color-Coded Trend Signals – Instantly recognize bullish, bearish, and ranging market states.
:gear: Customizable Inputs – Fine-tune Kalman parameters, Supertrend settings, and color themes to match your strategy.
:bell: Alerts for Trend Shifts – Get real-time notifications when market conditions change!
:tools: How to Use
Add the Indicator – Click the star icon to add it to your TradingView favorites.
Analyze Market Conditions – Observe the color-coded signals and range boundaries to identify trend strength and direction.
Use Alerts for Trade Execution – Set alerts for trend shifts and market conditions to stay ahead without constantly monitoring charts.
:mag: How It Works
The Kalman filter smooths price fluctuations by dynamically adjusting its weighting based on market volatility. It helps remove noise while keeping the signal reactive to trend changes. The Supertrend calculation is then applied to the filtered price data, providing a robust trend-following mechanism. To enhance signal accuracy, a volatility-weighted range filter is incorporated, creating upper and lower boundaries that define trend conditions. When price breaks out of these boundaries, the indicator confirms trend continuation, while signals within the range indicate market consolidation. Traders can leverage this tool to enhance trade timing, filter false breakouts, and identify optimal entry/exit zones.

Range Filter & LabelsAll credit goes to @DonovanWall for the Range Filter.
I just added Buy & Sell labels to demonstrate how the VuManChu Swing generates the same exact signals as the Range filter using the exact same settings between the two indicators.
This would only seem plausible if VuManChu Swing runs on the same code as the Range Filter.
It looks likely to be the old version of the Range Filter, where it had only two Inputs, Range Size and Range Period

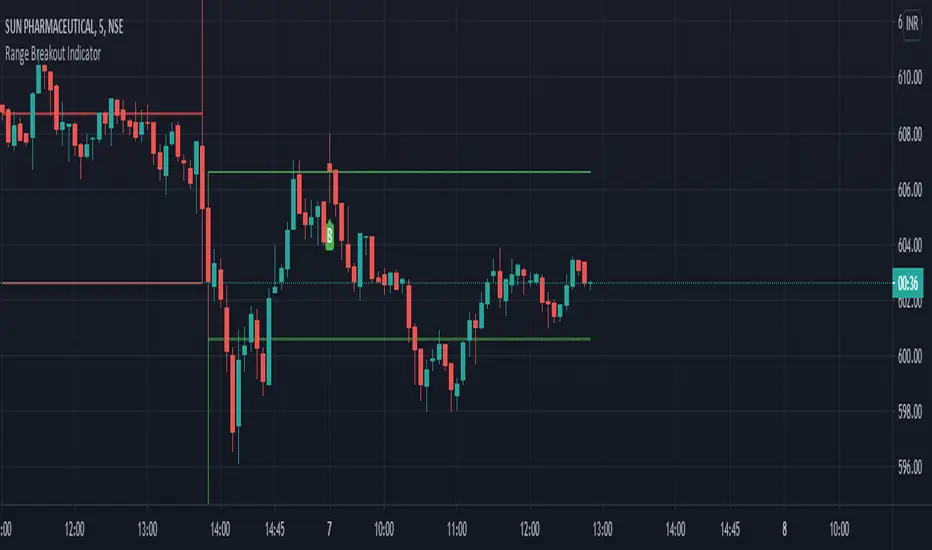
Range Breakout Indicator with trailing SLDear Traders,
This is a simple range breakout indicator where we are creating a range based on high and low of two consecutive volatile candles.
The logic is,
1) If the second candle traverse 1% up from the previous candle low (or)
2) If the second candle traverse 1% down from the previous candle high
then, the range is formed based on this high and low and
3) Buy signal will be given if the price crosses above the High
4) Sell signal will be given if the price crosses below the Low
The indication comes along with the Entry Indication, Exit Indication along with trailing SL
Option provided for changing the session time, target %, SL % and trailing SL %.
Happy Trading!
P.S: Please DM for access.
Range Average Retest Model [LuxAlgo]The Range Average Retest Model tool highlights setups from the range average retest entry model, a model using the retest of the average between two opposite swing points as an entry.
This tool uses long-term volatility coupled with user-defined multipliers to filter out swing areas and set take profit and stop loss levels for all trades.
Key features include:
Draw up to 165 swing areas and their associated trades
Filter out swing areas using Pivot Length , Selection Mode and Threshold parameters
Filter out trades with Maximum Distance and Minimum Distance parameters
Enable or disable swing areas and select default colors
Enable or disable overlapping trades and change the default colors for Take Profit and Stop Loss zones
🔶 USAGE
The "Range Average Retest Model" is an entry model that enters a position when the price retests the average made between two swing points. Users can determine the period of the detected swing points from the "Pivot Length" setting.
The conditions for long or short trades, regardless of whether the swing area is bullish or bearish, are as follows:
Long positions: the current bar close is below the swing area average and the last bar close was above it.
Short positions: the current bar close is above the swing area average price and the last bar close was below it.
Each trade is displayed on the chart with a line connecting it to its swing area highlighting the range average, a green area for the take profit, and a red area for the stop loss.
Both the Take Profit and Stop Loss levels are calculated by applying your own multiplier in the settings panel to the long-term volatility measure, in this case, the average true range over the last 200 bars.
Trades will remain open until they reach either the Stop Loss or Take Profit price levels.
🔹 Filtering Swing Areas
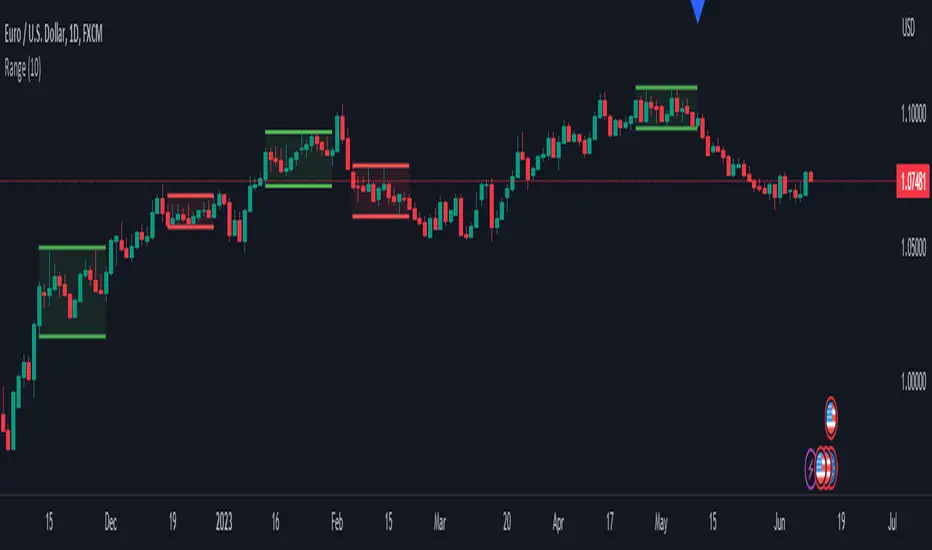
The daily chart of the Nasdaq-100 futures (NQ) with pivot length 2 and bullish selection mode: it only detects bullish swing areas, but they are smaller and more numerous.
Traders can manipulate the behavior of the swing areas from the settings panel.
The Selection mode will filter areas by bias: it will detect bullish areas, bearish areas, or both.
The Threshold parameter is applied to the long-term volatility to filter out areas where the average prices are too close together; the higher the value, the greater the difference between the average prices must be.
🔹 Trades
3-minute chart of the Nasdaq-100 futures (NQ) with pivot length 5, bearish selection mode maximum distance 4, and stop loss 2: many trades detected with very asymmetric risk/reward.
The behavior of the trades is also manipulated from the settings panel.
The maximum and minimum distance parameters specify the number of bars a trade must be away from a swing area.
The Take Profit and Stop Loss parameters are applied to the long-term volatility to obtain their respective price levels.
🔹 Overlapping Trades
Same chart as before, but with overlapping trades: messy, right?
By default the tool does not show overlapping trades, this allows for a cleaner chart.
In the settings panel traders can enable overlapping mode, in which case the tool will show all available trades.
Traders must be aware that the chart can be very crowded.
🔶 SETTINGS
🔹 Swings
Pivot Length: How many bars are used to confirm a swing point. The larger this parameter is, the larger and fewer swing areas will be detected.
Selection Mode: Swing area detection mode, detect only bullish swings, only bearish swings, or both.
Threshold: Swing area comparator. This threshold is multiplied by a measure of volatility (average true range over the last 200 bars), for a new swing area to be detected it must have an average level that is sufficiently distant from the average level of any untouched swing area, this parameter controls that distance.
🔹 Trades
Maximum distance: Maximum distance allowed between a swing area and a trade.
Minimum distance: Minimum distance allowed between a swing area and a trade.
Take profit: The size of the take profit - this threshold is multiplied by a measure of volatility (the average true range over the last 200 bars).
Stop loss: The size of the stop-loss: this threshold is multiplied by a measure of volatility (the average true range over the last 200 bars).

Range Sentiment Profile [LuxAlgo]The Range Sentiment Profile indicator is inspired from the volume profile and aims to indicate the degree of bullish/bearish variations within equidistant price areas inside the most recent price range.
The most bullish/bearish price areas are highlighted through lines extending over the entire range.
🔶 SETTINGS
Length: Most recent bars used for the calculation of the indicator.
Rows: Number of price areas the price range is divided into.
Use Intrabar: Use intrabar data to compute the range sentiment profile.
Timeframe: Intrabar data timeframe.
🔶 USAGE
This tool can be used to easily determine if a certain price area contain more significant bullish or bearish price variations. This is done by obtaining an estimate of the accumulation of all the close to open variations occurring within a specific profile area.
A blue range background indicates a majority of bullish variations within each area while an orange background indicates a majority of bearish variations within each area.
Users can easily identify the areas with the most bullish/bearish price variations by looking at the bullish/bearish maximums.
It can be of interest to see where profile bins might have no length, these can indicate price areas with price variations with alternating signs (bullish variations are followed by a bearish sign) and similar body. They can also indicate a majority of either bullish or bearish variations alongside a minority of more significant opposite variations.
These areas can also provide support/resistance, as such price entering these areas could reverse.
Users can obtain more precise results by allowing the profile to use intrabar data. This will change the calculation of the profile, see the details section for more information.
🔶 DETAILS
The Range Sentiment Profile's design is similar to the way a volume profile is constructed.
First the maximum/minimum values over the most recent Length bars are obtained, these define the calculation range of the profile.
The range is divided into Rows equidistant areas. We then see if price lied within a specific area, if it's the case we accumulate the difference between the closing and opening price for that specific area.
Let d = close - open . The length of the bin associated to a specific area is determined as follows:
length = Width / 100 * Area / Max
Where Area is the accumulated d within the area, and Max the maximum value between the absolute value of each accumulated d of all areas.
The percentage visible on each bin is determined as 100 multiplied by the accumulated d within the area divided by the total absolute value of d over the entire range.
🔹 Intrabar Calculation
When using intrabar data the range sentiment profile is calculated differently.
For a specific area and candle within the interval, the accumulated close to open difference is accumulated only if the intrabar candle of the user selected timeframe lies within the area.
This can return more precise results compared to the standard method, at the cost of a higher computation time.

Range Detector Indicator [Misu]█ This indicator shows an upper and lower band based on Highs and Lows.
Depending on this, the indicator interprets a ranging market, an uptrend or a downtrend.
█ Usages:
The purpose of this indicator is to identify when the price is ranging.
It's also used to identify changes in trends, breaking points, and trend reversals.
But it can also be used to show resistance or support levels.
█ Features:
> Price Action Change Alerts
> Price Action Change Labels
> Color Bars
> Show Bands
█ Parameters:
Deviation: A parameter used to calculate pivots.
Depth: A parameter used to calculate pivots.
Activate Range Detection: Check the box to activate range detection.
Band% Offset: A factor that is used to vary the bands offset.

Range Box + VMA cloudsHere's a mix of two indicators that I find particularly useful.
One is a Range Box showing High and Low of the day plus 50% range, as well as high and low of the previous day. The Box changes color based on whether it closed higher or lower than the previous session.
The second one plots Variable Moving Average clouds - short and long term one.
The rules are pretty simple - take long trades only if the box is green, short trades if it's red.
Candle close above both clouds - long signal. If the price is being rejected from the long term cloud - buy the dip (or rally).
Pretty straightforward.
Enjoy
Credit for VMA: LazyBear
Credit for High Low DayBox: ahoudori

Range Breakout Statistics [Honestcowboy]⯁ Overview
The Range Breakout Statistics uses a very simple system to detect ranges/consolidating markets. The principle is simple, it looks for areas where the slope of a moving average is flat compared to past values. If the moving average is flat for X amount of bars that's a range and it will draw a box.
The statistics part of the script is a bit more complicated. The aim of this script is to expand analysis of trading signals in a different way than a regular backtest. It also highlights the polyline tool, one of my favorite drawing tools on the tradingview platform.
⯁ Statistics Methods
The script has 2 different modes of analyzing a trading signals strength/robustness. It will do that for 2 signals native to the script.
Upper breakout: first price breakout at top of box, before max bars (100 bars by default)
Lower breakout: first price breakout at bottom of box, before max bars
The analysis methods themselves are straightforward and it should be possible for tradingview community to expand this type of analysis to other trading signals. This script is a demo for this analysis, yet some might still find the native signals helpful in their trading, that's why the script includes alerts for the 2 native signals. I've also added a setting to disable any data gathering, which makes script run faster if you want to automate it.
For both of the analysis methods it uses the same data, just with different calculations and drawing methods. The data set is all past price action reactions to the signals saved in a matrix. Below a chart for explaining this visually.
⯁ Method 1: Averages Projection
The idea behind this is that just showing all price action that happened after signal does not give actionable insights. It's more a spaghetti jumble mess of price action lines. So instead the script averages the data out using 3 different approaches, all selectable in the settings menu.
Geometric Average: useful as it accurately reflects compound returns over time, smoothing out the impact of large gains or losses. Accounts for volatility drift.
Arithmetic Average: a standard average calculation, can be misleading in trading due to volatility drift. It is the most basic form of averaging so I included it.
Median: useful as any big volatility huge moves after a signal does not really impact the mean as it's just the middle value of all values.
These averages are the 2 lines you will find in the middle of the projection. Having a clear difference between a lower break average and upper break average price reaction can signal significance of the trading signal instead of pure chaos.
Outside of this I also included calculations for the maximum and minimum values in the dataset. This is useful for seeing price reactions range to the signal, showing extreme losses or wins are possible. For this range I also included 2 matrices of highs and lows data. This makes it possible to draw a band between the range based on closing price and the one using high/low data.
Below is a visualisation of how the averages data is shown on chart.
⯁ Method 2: Equity Simulation
This method will feel closer to home for traders as it more closely resembles a backtest. It does not include any commissions however and also is just a visualisation of price reaction to a signal. This method will simulate what would happen if you would buy at the breakout point and hold the trade for X amount of bars. With 0 being sell at same bar close. To test robustness I've given the option to visualise Equity simulation not just for 1 simulation but a bunch of simulations.
On default settings it will draw the simulations for 0 bars holding all the way to 10 bars holding. The idea behind it is to check how stable the effect is, to have further confirmation of the significance of the signal. If price simulation line moves up on average for 0 bars all the way to 10 bars holding time that means the signal is steady.
Below is a visualisation of the Equity Simulation.
⯁ Signal filtering
For the boxes themselves where breakouts come from I've included a simple filter based on the size of the box in ATR or %. This will filter out all the boxes that are larger top to bottom than the ATR or % value you setup.
⯁ Coloring of Script
The script includes 5 color themes. There are no color settings or other visual settings in the script, the script themes are simple and always have colors that work well together. Equity simulation uses a gradient based on lightness to color the different lines so it's easier to differentiate them while still upper breaks having a different color than lower breaks.
This script is not created to be used in conjunction with other scripts, it will force you into a background color that matches the theme. It's purpose is a research tool for systematic trading, to analyse signals in more depth.
Metaverse color theme:
⯁ Conclusion
I hope this script will help traders get a deeper understanding of how different assets react to their assets. It should be possible to convert this script into other signals if you know how to code on the platform. It is my intention to make more publications that include this type of analysis. It is especially useful when dealing with signals that do not happen often enough, so a regular backtest is not enough to test their significance.

Range Deviations @joshuuuThis indicator is able to show ranges, the equlibrium (50%) and range deviations.
It has four pre-defined options and one custom version.
Asia (2000-0000) ny time
CBDR(1400-2000) ny time
Flout(1400-0000) ny time
ONS (OverNightSession)(0400-0800) chicago time
Custom (you can choose the times)
ICT (Inner Circle Traders) teaches, that those range deviations of asia,cbdr,flout can be used to find the daily high/low.
TCM (The Currency Merchant) teaches, that a move out of the range often is a false move to trap traders into the wrong direction.

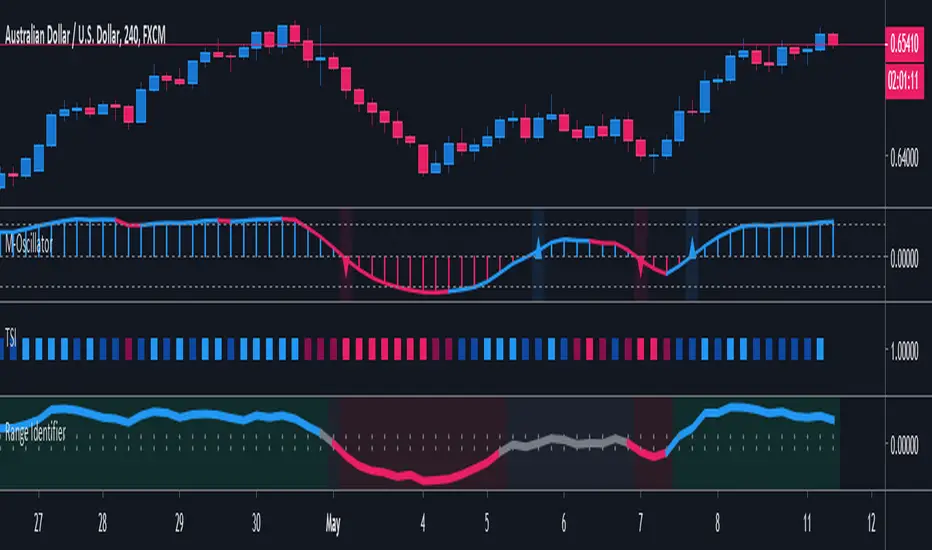
Range StrengthRange Strength is a super simple indicator designed for the mean reversion (range trading) strategy, it shows you how strong the market is ranging or trending. When the indicator is positive (green color) the market is a range mode, when the indicator is negative (red color) it is in a trending mode.
It's best used together with our Buy Sell Bands indicator to identify entry and exit signals within the range, ideally only taking trades when the Range Strength indicator is showing positive (green) readings.
How Is It Different From Other Indicators?
- Designed specifically for the mean reversion (range trading) strategy
- Shows one simple reading and graphical representation of range strength
- Identify the best times to take mean reversion trades versus trend trades
- Works well in conjunction with the Buy Sell Bands indicator to validate entry & exit signals
- Can be applied to all markets and timeframes
How To Use The Indicator?
1) Visit our website URL shown below this description and signup
2) We will then grant your TradingView username permission to use our indicators
3) Go to your Indicators window, then the Invite-Only section and add our indicators to your chart
4) Our indicators will then show on every chart you now look at
5) You can set up alerts to be notified in real time of trading signals from our indicators
6) Read our user manual for all the best tips on how to use our indicators as part of a range trading strategy
7) Feel free to reach out to us for personal one-on-one help with getting setup
What Markets and Conditions Does It Work Best On?
All markets cycle between trending and ranging modes, and the key to successfully using our indicators is identifying when the market is in or about to go into a range trading mode, and as such it can be applied to all markets and timeframes.
Some markets and timeframes trade within ranges more predictably than others, for example Forex, Cryptocurrencies, and Futures on the 15 minute timeframe during the US night session can work well due to the lack of price sensitive news creating lasting trends. With Stocks & ETFs on the 5 minute timeframe during the midday session on large cap blue chip stocks with no recent news releases can show strong range trading environments to use our indicators in.
In addition to single markets, you can also use our indicators on pair charts, for example Coca Cola(KO) versus Pepsi(PEP), you can do this by entering KO/PEP inside your TradingView chart quote box and it will bring up a pair chart. Our indicators will show buy and sell signals right on the pair chart just like any other single instrument chart. You can get very creative with what type of pairs you can come up with.
Our indicators are primarily designed for day trading and swing trading, however they can also be used for position trading and investing by identifying technically oversold and overbought range levels that are based on current and past volatility around a dynamic average price, for this we recommend using a weekly chart to identify longer trading opportunities.
As always indicators should be used as part of a trading strategy to assist in making decisions, you can't just blindly follow every signal they produce, you should always seek to compliment technical trading signals with additional analysis to reduce your risk and increase your odds of making a winning trade.
Examples Of Use On Various Markets and Timeframes
GBP vs CHF Forex Pair 15 Minute Chart
Tesla Stock 1 Minute Chart
Bitcoin vs USD Crypto Pair 15 Minute Chart
Micro E-Mini SP500 Futures 1 Minute Chart
Mastercard vs Visa Stock Daily Pair Chart
To gain access to the Range Strength and Buy Sell Bands Indicators visit our website shown below.
Happy Range Trading :)

Currency Pairs High Low RangeIndicator gives the High-Low range of 18 currency pairs. There is a High Ave which is the average of the top four (you may need to adjust which ones are in the average) as well as the bottom four Low Ave. The picture is of a weekly chart with the indicator set at 12 week average of the High-Low range with a .7 (70%) multiplier. When I am looking for week long trades with lots of movement I pick my pairs based on the most actives with a 70% capture of the range as a guide line of when to exit. Sometime when I am not in the mood for volatility I go with the ones in the Low Ave area. Further, when I day trade I set the indicator to a 1Day chart and move the percent to 20% or 30% as a guideline to tell when to get out of a trade.

Range Indicator Golden Pocket, Liquidity, FairValueGapOverview
This indicator is a comprehensive institutional market structure toolkit. It is designed to identify high-probability reversal zones by merging three powerful technical analysis concepts: Fibonacci Golden Pockets (61.8% - 65%), Liquidity Pool Analysis (Swing Failure Patterns), and Fair Value Gaps (FVG). By automating the detection of price inefficiencies and "stop runs," it helps traders navigate complex price action with objective, rule-based confirmation.
What the Script Does
The script continuously monitors a user-defined lookback period to define a trading range. Within this range, it dynamically plots:
Golden Pockets: High-confluence retracement zones (calculated as 0.35 - 0.382 internal range levels).
Liquidity Zones: Highlighted regions at the absolute high and low (Top/Bottom 5%) where institutional orders and retail stops are typically concentrated.
Swing Failure Patterns (SFP): Real-time detection of liquidity grabs where price breaches a range extreme but fails to close outside, signaling a potential trap.
Fair Value Gaps (FVG): Visualizes 3-candle price imbalances, showing areas of aggressive buying or selling that often act as future magnets or support/resistance.
2-Candle Confirmation: A momentum-based filter requiring a candle-close confirmation before a reversal signal is generated.
For Whom is it?
Smart Money Concepts (SMC) & ICT Students: Traders looking for automated liquidity sweeps and market inefficiencies.
Fibonacci & Mean Reversion Traders: Those seeking a clean, professional visualization of the Golden Pocket across multiple timeframes.
Systematic Day Traders: Who require strict price-action confirmation (SFP and 2-candle rules) to remove emotional bias from their entries.
Functions and Input Options
1. Market Structure & Visuals
Lookback Period (Default: 100): Defines the window for calculating the range extremes.
Box Offset Right (Default: 50): Extends all zones into the future for better anticipatory trading.
Show Price Lines & Labels: Displays the exact price for every zone boundary on the right axis for precise execution.
2. Fair Value Gap (FVG) Settings
Show Fair Value Gaps: A toggle to enable/disable the plotting of price imbalances.
FVG Extension (Default: 10): Determines how many bars into the future the FVG box remains visible.
Custom Colors: Separate color inputs for Bullish (Gap Up) and Bearish (Gap Down) inefficiencies.
3. Professional Alert System
The script includes five specific alert conditions:
GP Touch: Early warning when price enters a Golden Pocket.
2-Candle Pattern: Confirmed momentum shift within a Golden Pocket.
SFP Long/Short: Alerts when a Liquidity Grab (Swing Failure) is confirmed at the range high or low.
Transparency and Compliance (Moderator Info)
Non-Repainting Logic: All signals (SFP, 2-Candle, and FVG) are calculated and triggered based on confirmed candle closes. Drawings use barstate.islast purely for visual efficiency without altering historical data integrity.
Educational Context: The script visualizes well-known market principles (Fibonacci, SFPs, and FVGs) to aid traders in their analysis; it does not provide automated financial advice or "black-box" buy/sell signals.
Resource Management: Optimized for Pine Script v5, using efficient array and box handling to ensure smooth performance even on lower timeframes.

Range Percentage Analyzer This indicator is a tool for analyzing the market range and trend. It calculates the extent of price movement between a specified starting point and the current price, displaying it as a percentage.
The calculation can be based on a fixed lookback period (e.g., the last 30 candles) or from a fixed start date. It also provides a clear table that shows the general trend in "Trend" mode, and the relative strength of the base and quote currencies of forex pairs (e.g., EURUSD) in "Forex" mode.
User Guide
Calculation Method
This setting determines how the indicator defines the starting point for the calculation.
Lookback Period: In this mode, the indicator uses the last N candles (the number can be specified in the "Lookback Period (bars)" field, maximum 250).
The starting point is "floating," meaning it shifts with each new candle. For example, with a setting of 30, the 30th candle from the current one will always be the starting point.
Date Based: In this mode, the calculation starts from a fixed date and time you select.
This mode is ideal for measuring performance from a specific event (e.g., news, start of a week/month).
Note: If you select a date in "Date Based" mode for which no data is available on the current timeframe (e.g., switching to a very low timeframe), the indicator will automatically use the earliest available candle as the starting point.
Start Date & Time
This setting is only active in "Date Based" mode.
Here you can specify the fixed starting point for the calculation.
The specified time is in the Exchange timezone.
Important limitation: Due to TradingView platform limits, visual elements (box, line) are only drawn for a maximum of 250 candles back.
If the set date is older than this, the calculation still applies to the entire period (from the set date), but the drawing only covers the last 250 candles.
When switching to a higher timeframe, the range may restart from a slightly later bar due to TradingView's bar alignment. For best accuracy, set your timeframe first, then select the start date.
Table Mode
This setting controls what data the information table displays.
Trend: This is the default mode, which works on any symbol (stock, index, crypto, etc.). It displays information related to the trend.
Forex: This is a special mode used to measure the strength of currency pairs.
It only works on symbols with exactly 6 characters (e.g., "EURUSD", "BTCUSD"). It treats the first 3 characters as the base currency (e.g., EUR) and the last 3 as the quote currency (e.g., USD).
If the symbol does not have 6 characters, the table will automatically display in "Trend" mode.
Extremes Trend Row
If this is enabled, the table displays an additional row that determines the trend based on the formation order of the high and low within the analyzed range.
The logic is as follows:
Bullish: Indicated if the low was formed before the high.
(Or if they formed on the same candle, which was a bullish candle).
Bearish: Indicated if the high was formed before the low.
(Or if they formed on the same candle, which was a bearish candle).
Neutral: Indicated if the high and low formed on the same candle, and it was a "doji" candle (close = open).
Upper & Lower Threshold
These settings control the logic for the "Change Trend" and "Forex Display" rows at the top of the table.
They determine when the total percentage change for the entire period is considered "Bullish/Strong", "Bearish/Weak", or "Neutral".
Upper Threshold (%): The percentage value (default 0.1%) above which the indicator considers the change "Bullish/Strong".
Lower Threshold (%): The percentage value (default -0.1%) below which the indicator considers the change "Bearish/Weak".
If the change is between the two, the signal is Neutral.
