Trading Ranges + ZScoreOverview
The "Trading Ranges + ZScore" script is a versatile technical indicator developed for TradingView. This tool combines two powerful concepts—price ranges and Z-Score analysis—to help traders identify potential trend reversals, overbought/oversold conditions, and trend strength. The script dynamically calculates price ranges based on recent price action and utilizes Z-Score to detect deviations from a statistical norm, providing valuable insights for decision-making in both ranging and trending markets.
Features
Price Ranges: Calculates dynamic upper and lower price boundaries based on volatility and market structure.
Z-Score Oscillator: A statistical measure that highlights overbought/oversold conditions based on the deviation from a moving average.
Trend Detection: Identifies trend continuation or reversal points by comparing current price action against historical levels.
Customizable Alerts: Generates visual signals (diamonds and X crosses) for potential long/short entries and exits.
Visual Representation: Colors the bars based on Z-Score and trend direction, enhancing the chart’s readability and signal clarity.
Customizable Parameters: The script allows users to fine-tune perception length, analysis period, factor multiplier, and oscillator thresholds to fit different market conditions.
Key Input Parameters
Perception: The length used for calculating highest/lowest price points (default: 20).
Analysis: The length used for calculating the moving average and volatility (default: 100).
Factor: A multiplier to adjust the width of the price ranges (default: 2.0).
Oscillator Threshold: The overbought/oversold threshold for the Z-Score oscillator (default: 70).
Trend Filter: A boolean switch that filters signals based on trend direction.
Fill Zones: Option to color-fill between price levels when certain conditions are met.
Bullish/Bearish/Neutral Colors: Customizable colors for bullish, bearish, and neutral signals.
How It Works
Price Ranges Calculation:
The script calculates five levels: two upper boundaries, the average price level, and two lower boundaries. These levels are based on the highest/lowest prices over a user-defined period and adjusted by volatility (Average True Range).
When the price crosses either of these levels, it suggests a significant change in market direction, potentially indicating a trend reversal.
Z-Score Oscillator:
The Z-Score is a statistical measurement of a price's position relative to its moving average. The indicator calculates two variations:
Z-Score based on the absolute difference between the price and the moving average.
Z-Score based on standard deviation.
These oscillators help detect extreme conditions where the price is likely to revert (overbought/oversold zones).
Trend Detection and Signals:
The indicator generates potential buy/sell signals when the price crosses the predefined levels or based on the fast Z-Score crossing the overbought/oversold thresholds.
Weak long/short signals are shown when the faster Z-Score oscillator reaches extreme levels but trend filters are applied to avoid noise.
Bar Colors and Signal Shapes:
Bar colors change dynamically to reflect the trend direction and Z-Score conditions. Signals for potential trades are displayed using diamonds and X crosses, making it easy to spot opportunities visually.
Visuals and Plots
Bar Colors: Changes the bar color based on Z-Score and trend direction.
Z-Score Plot: Displays two Z-Score oscillators, the standard and a faster one for detecting quicker price deviations.
Overbought/Oversold Zones: Highlighted by upper and lower thresholds of the Z-Score.
Long/Short Signals: Uses diamond-shaped markers for strong long/short signals and X-shaped markers for weaker signals.
Dynamic Range Lines: Plots lines for key price levels (upper/lower boundaries, mid-range) based on the dynamic range calculations.
Usage Guide
Identify Overbought/Oversold Conditions: Look for the Z-Score reaching extreme positive or negative values. When combined with trend signals, these conditions often point to a potential reversal.
Follow the Trend: Use the trend filter option to focus only on trades in the direction of the prevailing trend, reducing false signals in ranging markets.
Watch for Range Breakouts: Pay attention to the upper and lower boundaries. Price crossing these levels often signals the start of a new trend or a major price movement.
Adjust Parameters: Tailor the perception length, analysis length, and multiplier to suit different asset classes or timeframes.
Customization
You can adjust the key parameters to adapt the indicator to different markets or personal trading preferences:
- Perception & Analysis Lengths: Control the sensitivity of the price range calculations.
- Factor Multiplier: Adjusts the width of the ranges, with higher values indicating larger zones.
- Oscillator Threshold: Modify the overbought/oversold levels to suit different market volatility.
- Trend Filter: Toggle on/off to focus on trend-following strategies or range-bound conditions.
- Visual Options: Customize colors for bullish, bearish, and neutral signals, as well as enable/disable the zone fills.
"range" için komut dosyalarını ara

DTR & ATR
Description
This ATR and DTR label is update of Existing Label provided by © ssksubam
Please See Notes on original Script Here :
Original Code is not mine but I have done few code changes which I believe will help everyone who are looking to add more labels together and save space on the chart
ATR & DTR Script is very helpful for Day Traders as I will explain in detail bellow
Following are changes I have incorporated
Previous Label took more space on the charts with Header and Footer.
I removed the Header and moved both DTR vs ATR descriptions on the same line, saving space on the chart.
I updated the code to remove => signs, which are self-explanatory as I will explain below.
I made the label in 1 single compact line for maximum space efficiency and aesthetics.
These changes improve the content's clarity and conciseness while optimizing space on the charts. If you have any further requests or need additional assistance, feel free to let me know!
What Does DTR Signify?
Stock ATR stands for Average True Range, which is a technical indicator used in trading and investment analysis. The Average True Range measures the volatility of a stock over a given period of time. It provides insights into the price movement and potential price ranges of the stock.
The ATR is calculated as the average of the true ranges over a specific number of periods. The true range is the greatest of the following three values:
The difference between the current high and the current low.
The absolute value of the difference between the current high and the previous close.
The absolute value of the difference between the current low and the previous close.
Traders and investors use ATR to assess the potential risk and reward of a stock. A higher ATR value indicates higher volatility and larger price swings, while a lower ATR value suggests lower volatility and smaller price movements. By understanding the ATR, traders can set appropriate stop-loss levels and make informed decisions about position sizing and risk management.
It's important to note that the ATR is not a directional indicator like moving averages or oscillators. Instead, it provides a measure of volatility, helping traders adapt their strategies to suit the current market conditions.
What Does ATR Signify?
The Average True Range (ATR) signifies the level of volatility or price variability in a particular financial asset, such as a stock, currency pair, or commodity, over a specific period of time. It provides valuable information to traders and investors regarding the potential risk and reward associated with the asset.
Here are the key significances of ATR:
Volatility Measurement: ATR measures the average price range between high and low prices over a specified timeframe. Higher ATR values indicate greater volatility, while lower values suggest lower volatility. Traders use this information to gauge the potential price movements and adjust their strategies accordingly.
Risk Assessment: A higher ATR value implies larger price swings, indicating increased market uncertainty and risk. Traders can use ATR to set appropriate stop-loss levels and manage risk by adjusting position sizes based on the current volatility.
Trend Strength: ATR can also be used to assess the strength of a trend. In an uptrend or downtrend, ATR tends to increase, indicating a more powerful price movement. Conversely, a declining ATR might signify a weakening trend or a consolidation period.
Range-Bound Market Identification: In a range-bound or sideways market, the ATR value tends to be relatively low, reflecting the lack of significant price movements. This information can be helpful for range-trading strategies.
Volatility Breakouts: Traders often use ATR to identify potential breakouts from consolidation patterns. When the ATR value expands significantly, it may indicate the beginning of a new trend or a breakout move.
Comparison between Assets: ATR allows traders to compare the volatility of different
How to use DTR & ATR for Trading
Using Average True Range (ATR) and Daily Trading Range (DTR) can be beneficial for day trading to assess potential price movements, manage risk, and identify trading opportunities. Here's how you can use both indicators effectively:
Calculate ATR and DTR: First, calculate the ATR and DTR values for the asset you are interested in trading. ATR is the average of true ranges over a specified period (e.g., 14 days), while DTR is the difference between the high and low prices of a single trading day.
Assess Volatility: Compare the ATR and DTR values to understand the current volatility of the asset. Higher values indicate increased volatility, while lower values suggest reduced volatility.
Setting Stop-Loss: Use ATR to set appropriate stop-loss levels. For example, you might decide to set your stop-loss a certain number of ATR points away from your entry point. This approach allows you to factor in market volatility when determining your risk tolerance.
Identify Trading Range: Analyze DTR to determine the typical daily price range of the asset. This information can help you identify potential support and resistance levels, which are essential for day trading strategies such as breakout or range trading.
Breakout Strategies: ATR can assist in identifying potential breakout opportunities. When ATR values increase significantly, it suggests an expansion in volatility, which may indicate an upcoming breakout from a trading range. Look for breakouts above resistance or below support levels with higher than usual ATR values.
Scalping Strategies: For scalping strategies, where traders aim to profit from small price movements within a single trading session, knowing the typical DTR can help set reasonable profit targets and stop-loss levels.
Confirming Trend Strength: In day trading, you may encounter short-term trends. Use ATR to assess the strength of these trends. If the ATR is rising, it suggests a strong trend, while a declining ATR may indicate a weakening trend or potential reversal.
Risk Management: Both ATR and DTR can aid in risk management. Determine your position size based on the current ATR value to align it with your risk tolerance. Additionally, understanding the DTR can help you avoid overtrading during periods of low volatility.
Combine with Other Indicators: ATR and DTR work well when used in conjunction with other technical indicators like moving averages, Bollinger Bands, or RSI. Combining multiple indicators can provide a mor

Trend Day IndentificationVolatility is cyclical, after a large move up or down the market typically "ranges" during the next session. Directional order flow that enters the market during this subsequent session tends not to persist, this non-persistency of transactions leads to a non-trend day which is when I trade intraday reversionary strategies.
This script finds trend days in BTC with the purpose of:
1) counting trend day frequency
2) predicting range contraction for the next 1-2 days so I can run intraday reversion strategies
Trend down is defined as daily bar opening within X% of high and closing within X% of low
Trend up is defined as daily bar opening within X% of low and closing within X% of high
default parameters are:
1) open range extreme = 15% (open is within 15% of high or low)
2) close range extreme = 15% (close is within 15% of high or low)
There is also an atr filter that checks that the trend day has a larger range than the previous 4 bars this is to make sure we find true range expansion vs recent ranges.
Notes:
If a trend day occurs after a prolonged sideways contraction it can signal a breakout - this is less common but is an exception to the rule. These types of occurrences can lead to the persistency of order flow and result in extended directional daily runs.
If a trend day occurs close to 20 days high or low (stopping just short OR pushing slightly through) then wait an additional day before trading intraday reversion strategies.

Lunch Range - Retracement Hunter# Lunch Range - Retracement Hunter
A statistical analysis tool that tracks price behavior during and after the 12-1pm ET lunch hour consolidation. This indicator identifies high-probability mean reversion setups based on range sweeps and midpoint targets.
## 📊 Overview
**Lunch Range - Retracement Hunter** captures the high, low, and midpoint of the 12:00-1:00pm ET consolidation period, then monitors afternoon price action (1-4pm ET) for specific patterns. The indicator provides comprehensive statistics showing historical performance across different market conditions.
## 🎯 Key Features
### Visual Analysis
- **Range boundaries**: Clear visualization of lunch hour high and low levels
- **Midpoint target**: 50% retracement level calculated from the range
- **Signal markers**: Visual labels indicating sweep detection and setup conditions
- **Historical display**: View up to 50 previous daily ranges for pattern context
- **Live range tracking**: Real-time display of current day's range size and category
### Statistical Dashboard
- Performance tracking for directional setups (high sweep vs low sweep)
- Win rate calculations based on reaching midpoint targets
- Day count metrics showing pattern frequency
- **Range size analysis**: Performance breakdown by consolidation width
- Small ranges (tight consolidations)
- Medium ranges (typical lunch hour behavior)
- Large ranges (expanded consolidations)
- Average, minimum, and maximum range statistics
### Customization
- Adjustable colors for all lines and labels
- Multiple line styles (solid, dashed, dotted)
- Configurable label sizes
- Flexible table positioning and styling
- Toggle range analysis on/off
- Customize range size thresholds
## ⚙️ Settings
### Lines
- **Historical lookback**: Display 0-50 days of past ranges
- **Colors**: Separate controls for high, low, and midpoint lines
- **Styles**: Choose solid, dashed, or dotted line styles
- **Width**: Adjustable line thickness (1-5)
### Labels
- **Colors**: Individual color selection for sweep, entry, target, and failed signals
- **Size**: Four size options (Tiny/Small/Normal/Large)
### Table
- **Background/Header colors**: Full color customization
- **Position**: Nine positioning options across the chart
- **Text size**: Adjustable for readability
### Strategy
- **Signal Mode**:
- "Both Directions" - Can take both high and low setups same day
- "First Signal Only" - Takes only the first valid setup per session
- **Sweep Detection**:
- Wick-based: Uses high/low extremes
- Close-based: Uses closing prices only
### Range Analysis
- **Toggle**: Show/hide range breakdown statistics
- **Small Range Threshold**: Define maximum size for "small" category (default: 10 pts)
- **Medium Range Threshold**: Define maximum size for "medium" category (default: 20 pts)
- Categories automatically adjust based on your thresholds
## 📈 How It Works
The indicator operates in three phases:
**Phase 1 - Range Capture (12:00-1:00pm ET)**
- Tracks the high and low during the lunch hour
- Yellow background highlights the capture period
- Calculates midpoint level when period ends
**Phase 2 - Setup Detection (1:00-4:00pm ET)**
- Monitors for sweeps above the high or below the low
- Identifies when price re-enters the range after a sweep
- Marks valid entry conditions with labels
**Phase 3 - Target Evaluation**
- Tracks whether price reaches the midpoint after setup
- Records outcome as win (reached mid) or loss (failed to reach)
- Updates statistics at end of session
## 📊 Understanding the Statistics
**Core Metrics:**
- **Days Tracked**: Total sample size in historical data
- **High→Mid**: Trades where high was swept, then retraced to midpoint
- **Low→Mid**: Trades where low was swept, then retraced to midpoint
- **Win Rate**: Percentage of setups that reached the midpoint target
- **Both Swept**: Days where both high and low were swept
- **No Sweep**: Days with no valid sweep signals
**Today's Range:**
- Shows current day's range in points
- Displays category classification (Small/Medium/Large)
- Color-coded to match historical performance data
**Range Analysis:**
- **Average Range**: Mean lunch hour consolidation size across all days
- **Min/Max**: Smallest and largest ranges observed
- **Category Breakdown**: Performance statistics segmented by range size
- Helps identify optimal trading conditions
- Shows if certain range sizes have higher success rates
## 💡 Best Practices
**Recommended Usage:**
- Apply to liquid futures contracts (ES, NQ, YM, RTY)
- Use 1-15 minute chart timeframes for signal clarity
- Monitor range development during lunch hour
- Consider range size category when evaluating setups
- Note time of sweep (earlier setups have more time to develop)
**Important Considerations:**
- This is an analytical and educational tool for studying market patterns
- Historical statistics do not guarantee future performance
- The 4:00pm ET cutoff means late-day setups have limited time
- Volume and volatility conditions affect pattern behavior
- Always use appropriate risk management
- Lower timeframes (1-3 min) may have limited historical data due to TradingView bar limits; 5-minute charts recommended for optimal data coverage
## 🔧 Technical Details
- **Version**: Pine Script v5
- **Type**: Overlay indicator
- **Max historical elements**: 500 lines/labels (supports extended lookback)
- **Timezone**: America/New_York (Eastern Time)
- **Session times**:
- Lunch range: 12:00-1:00pm ET
- Trade window: 1:00-4:00pm ET
## 📝 Notes
- All times reference Eastern Time (ET)
- Works best on regular trading days (avoid holidays and low-volume sessions)
- Range analysis thresholds can be customized for different instruments
- Protected source code ensures methodology remains proprietary
- Statistics table updates in real-time as conditions develop
## 🎓 Educational Purpose
This indicator is designed for traders studying:
- Intraday market structure and behavior patterns
- Mean reversion concepts in futures markets
- Lunch hour consolidation characteristics
- Statistical analysis of trading setups
- Range-based trading methodologies
**Disclaimer**: This tool is for analysis and educational purposes. It does not provide trading signals or recommendations. All trading decisions and risk management are the responsibility of the user.
---
*For optimal results, combine this analytical tool with broader market context, trend analysis, and sound risk management principles.*

Advanced Price Ranges ICTThis indicator automatically divides price into fixed ranges (configurable in points or pips) and plots important reference levels such as the high, low, 50% midpoint, and 25%/75% quarters. It is designed to help traders visualize structured price movement, spot confluence zones, and frame their trading bias around clean range-based levels.
🔹 Key Features
Custom Range Size: Define ranges in points (e.g., 100, 50, 25, 10) or in Forex pips.
Forex Mode: Automatically adapts pip size (0.0001 or 0.01 for JPY pairs).
Dynamic Anchoring: Price ranges automatically align to the current price, snapping into blocks.
Multiple Ranges: Option to extend visualization above and below the current active block for a complete grid.
Level Types:
High / Low of the range
50% midpoint
25% and 75% quarters
Custom Styling: Adjustable line colors and widths for each level type.
Labels: Optional right-edge labels showing level type and exact price.
Alerts: Built-in alerts for when price crosses the range high, low, or 50% midpoint.
🔹 Use Cases
Quickly map out 100/50/25/10 point structures like Zeussy’s advanced price range method.
Identify key reaction levels where liquidity is often built or swept.
Support ICT-style concepts like range-based bias, fair value gaps, and liquidity pools.
Works for indices, futures, crypto, and forex.
🔹 Customization
Range increments can be set to any size (default 100).
Toggle which levels are shown (High/Low, Midpoint, Quarters).
Adjustable line widths, colors, and label visibility.
Extend ranges above and below for broader market context.

Eze Profit Range Detection FilterThe Range Detection Filter is a technical analysis tool designed to help traders identify range-bound market conditions and focus on breakout opportunities. It combines the ATR (Average True Range) for volatility analysis and the ADX (Average Directional Index) for trend strength evaluation to highlight consolidation phases and alert traders when the market is ready to break out.
This indicator provides visual cues and customizable alerts, making it suitable for traders looking to avoid false signals during choppy markets and capitalize on trending moves following a breakout.
What Makes It Unique?
ATR for Volatility:
Measures market volatility by comparing ATR with its moving average.
Consolidation phases are flagged when ATR remains below its moving average for a sustained period.
ADX for Trend Strength:
Monitors trend strength, confirming range-bound conditions when ADX falls below a user-defined threshold (default: 20).
Combines with ATR to ensure accurate detection of trendless periods.
Breakout Alerts:
Notifies traders of breakout opportunities when the price moves outside the highest high or lowest low of the range.
How It Works:
Range Detection:
The market is considered "in range" when:
ATR is below its moving average, indicating low volatility.
ADX is below the threshold, confirming a lack of trend strength.
Visual Indication:
A yellow background highlights range-bound conditions, allowing traders to avoid low-probability trades.
Breakout Detection:
Alerts are triggered for breakouts above or below the range to help traders identify potential opportunities.
Features:
Range Highlighting:
Automatically detects and highlights range-bound markets using a yellow background.
Breakout Alerts:
Sends alerts for breakouts above or below the range once the market exits consolidation.
Customizable Inputs:
ATR length, moving average length, and ADX parameters are fully adjustable to adapt to various trading styles and asset classes.
Multi-Timeframe Compatibility:
Suitable for all markets and timeframes, including stocks, forex, and cryptocurrencies.
How to Use:
Identify Ranges:
Avoid trading when the yellow background appears, signaling a range-bound market.
Focus on Breakouts:
Look for alerts indicating breakouts above or below the range for potential trending opportunities.
Combine with Other Indicators:
Use volume analysis, momentum oscillators, or candlestick patterns to confirm breakout signals.
Credits:
This script utilizes widely accepted methodologies for ATR and ADX calculations. ADX is calculated manually using directional movement (+DI and -DI) for precise trend detection. The concept has been adapted and enhanced to create this comprehensive range-detection tool.
Notes:
This indicator is intended for educational purposes and should not be used as standalone financial advice.
Always incorporate this tool into a broader trading strategy for optimal results.

GRG/RGR Signal, MA, Ranges and PivotsThis indicator is a combination of several indicators.
It is a combination of two of my indicators which I solely use for trading
1. EMA 10-20-50-200, Pivots and Previous Day/Week/Month range
2. 3/4-Bar GRG / RGR Pattern (Conditional 4th Candle)
You can use them individually if you already have some of them or just use this one. Belive me when I say, this is all you need, along with market structure knowlege and even if you don’t have that, this indicator has been doing wonders for me. This is all I use. I do not use anything else.
**Note - Do checkout the indicators individually as I have added valuable information in the comment section.
It contains the following,
1. 10 EMA/SMA - configurable
2. 20 EMA/SMA - configurable
3. 50 EMA/SMA - configurable
4. 200 EMA/SMA - configurable
5. Previous Day's Range - configurable
6. Previous Week's Range - configurable
7. Previous Month's Range - configurable
8. Pivots - configurable
9. Buy Sell Signal - configurable
The Moving Averages
It is a very important combination and using it correctly with price action will strengthen your entries and exits.
The ema's or sma's added are the most powerful ones and they do definitely act as support and resistance.
The Daily/Weekly/Monthly Ranges
The Daily/Weekly/Monthly ranges are extremely important for any trader and should be used for targets and reversals.
Pivots
Pivots can provide support and resistance level. R5 and S5 can be used to check for over stretched conditions. You can customise them however you like. It is a full pivot indicator.
It is defaulted to show R5 and S5 only to reduce noise in the chart but it can be customised.
The 3/4 RGR or GRG Signal Generator
Combined with a 3/4 RGR or GRG setup can be all a trader needs.
You don't need complex strategies and SMC concepts to trade. Simple EMAs, ranges and RGR/GRG setup is the most winning combination.
This indicator can be used to identify the Green-Red-Green or Red-Green-Red pattern.
It is a price action indicator where a price action which identifies the defeat of buyers and sellers.
If the buyers comprehensively defeat the sellers then the price moves up and if the sellers defeat the buyers then the price moves down.
In my trading experience this is what defines the price movement.
It is a 3 or 4 candle pattern, beyond that i.e, 5 or more candles could mean a very sideways market and unnecessary signal generation.
How does it work?
Upside/Green signal
1. Say candle 1 is Green, which means buyers stepped in, then candle 2 is Red or a Doji, that means sellers brought the price down. Then if candle 3 is forming to be Green and breaks the closing of the 1st candle and opening of the 2nd candle, then a green arrow will appear and that is the place where you want to take your trade.
2. Here the buyers defeated the sellers.
3. Sometimes candle 3 falls short but candle 4 breaks candle 1's closing and candle 2's opening price. We can enter on candle 4.
4. Important - We need to enter the trade as soon as the price moves above the candle 1 and 2's body and should not wait for the 3rd or 4th candle to close. Ignore wicks.
5. But for a more optimised entry I have added an option to use candle’s highs and lows instead of open and close. This reduces lot of noise and provides us with more precise entry. This setting is turned on by default.
6. I have restricted it to 4 candles and that is all that is needed. More than that is a longer sideways market.
7. I call it the +-+ or GRG pattern or Green-Red-Green or Buyer-Seller-Buyer or Seller defeated or just Buyer pattern.
8. Stop loss can be candle 2's mid for safe traders (that includes me) or candle 2's body low for risky traders.
9. Back testing suggests that body low will be useless and result in more points in loss because for the bigger move this point will not be touched, so why not get out faster.
Downside/Red signal
1. Say candle 1 is Red, which means sellers stepped in, then candle 2 is Green or a Doji, that means buyers took the price up. Then if candle 3 is forming to be Red and breaks the closing of the 1st candle and opening of the 2nd candle then a Red arrow will appear and that is the place where you want to take your trade.
2. Sometimes candle 3 falls short but candle 4 breaks candle 1's closing and candle 2's opening price. We can enter on candle 4.
3. We need to enter the trade as soon as the price moves below the candle 1 and 2's body and should not wait for the 3rd or 4th candle to close.
4. But for a more optimised entry I have added an option to use candle’s highs and lows instead of open and close. This reduces lot of noise and provides us with more precise entry. This setting is turned on by default.
5. I have restricted it to 4 candles and that is all that is needed. More than that is a longer sideways market.
6. I call it the -+- or RGR pattern or Red-Green-Red or Seller-Buyer-Seller or Buyer defeated or just Seller pattern.
7. Stop loss can be candle 2's mid for safe traders ( that includes me) or candle 2's body high for risky traders.
8. Back testing suggests that body high will be useless and result in more points in loss because for the bigger move this point will not be touched, so why not get out faster.
Combining Indicators and Signal
Combining these indicators with GRG/RGR signal can be very powerful and can provide big moves.
1. MA crossover and Signal - This is very powerful and provides a very big move. Trades can be held for longer. If after taking the trade we notice that the MA crossover has happened then trades can be held for higher targets.
2. Pivots and Signal - Pivots and add a support or resistance point. Take profits on these points. R5/S5 are over streched conditions so we can start looking for reversal signals and ignore other signals
3. Intraday Range - first 1, 5, 15 min of the day - Sideways days is when price will stay in these ranges. You can take profits at these ranges or if the range is broken and we get a signal, then it can mean that the direction will be sustained.
4. Previous Day/Week/Month Ranges - These can be used as Take Profit points if the price is moving towards them after getting the signal. If the range is broken and we get a signal then it can be a strong signal. They can also be used as reversal points if a strong signal is generated.
Important Settings
1. Include 4th Candle Confirmation - You can enable or disable the 4th candle signal to avoid the noise, but at times I have noticed that the 4th candle gives a very strong signal or I can say that the strong signal falls on the 4th candle. This is mostly a coincidence.
2. Bars to check (default 10) - You can also configure how many previous bars should the signal be generated for. 10 to 30 is good enough. To backtest increase it to 2000 or 5000 for example.
3. Use Candle High/Low for confirmation instead of Candle Open/Close - More optimized entry and noise reduction. This option is now defaulted to false.
4. Show Green-Red-Green (bull) signals - Show only bull entries. Useful when I have a predefined view i.e, I know market is going to go up today.
5. Show Red-Green-Red (bear) signals - Show only bear entries. Useful when I have a predefined view i.e, I know market is going to go down today.
6. 3rd candle should be a Strong candle before considering 4th candle - This will enforce additional logic in 4 candle setup that the 3rd candle is the candle in our direction of breakout. This means something like GRGG is mandatory, which is still the default behaviour. If disabled, the 3rd candle can be any candle and 4th candle will act as our breakout candle. This behaviour has led to breakouts and breakdowns as times, hence I added this as a separate feature. Vice-versa for a RGGR.
For a 4 candle setup till now we were expecting GRGG or RGRR but we can let the system ignore the 3rd candle completely if needed.
This will result in additional signals.
7. Three intraday ranges added for index and stock traders - 1 min, 5 min and 15 min ranges will be displayed. These are disabled by default except 15 min. These are very important ranges and in sideways days the price will usually move within the 15 min. A breakout of this range and a positive signal can be a very powerful setup.
Safe traders can avoid taking a trade in this range as it can lead to fakeouts.
The line style, width, color and opacity are configurable.
Pointers/Golden Rules
1. If after taking the trade, the next candle moves in your direction and closes strong bullish or bearish, then move SL to break even and after that you can trail it.
2. If a upside trade hits SL and immediately a down side trade signal is generated on the next candle then take it. Vice versa is true.
3. Trades need to be taken on previous 2 candle's body high or low combined and not the wicks.
4. The most losses a trader takes is on a sideways day and because in our strategy the stop loss is so small that even on a sideways day we'll get out with a little profit or worst break even.
5. Hold trades for longer targets and don't panic.
6. If last 3-4 days have been sideways then there is a good probability that today will be trending so we can hold our trade for longer targets. Inverse is true when the market has been trending for 2-3 days then volatility followed by sideways is coming (DOW theory). Target to hold the trade for whole day and not exit till the day closes.
7. In general avoid trading in the middle of the day for index and stocks. Divide the day into 3 parts and avoid the middle.
8. Use Support/Resistance, 10, 20, 50, 200 EMA/SMA, Gaps, Whole/Round numbers(very imp) for identifying targets.
9. Trail your SL.
10. For indexes I would use 5 min and 15 min timeframe and at times 10 mins.
11. For commodities and crypto we can use higher timeframe as well. Look for signals during volatile time durations and avoid trading the whole day. Signal usually gives good targets on those times.
12. If a GRG or RGR pattern appears on a daily timeframe then this is our time to go big.
13. Minimum Risk to Reward should be 1:2 and for longer targets can be 1:4 to 1:10.
14. Trade with small lot size. Money management will happen automatically.
15. With small lot size and correct Risk-Reward we can be very profitable. Don't trade with big lot size.
16. Stay in the market for longer and collect points not money.
17. Very imp - Watch market and learn to generate a market view.
18. Very imp - Only 3 type of candles are needed in trading -
Strong Bullish (Big Green candle), Strong Bearish (Big Red candle),
Hammer (it is Strong Bullish), Inverse Hammer (it is Strong Bearish)
and Doji (indecision or confusion).
If on daily timeframe I see Strong Bullish candle previous day then I am biased to the upside the next day, if I see Strong Bearish candle the previous day then I am biased to the downside the next day, if I see Doji on the previous day then I am cautious the next day, if there are back to back Dojis forming in daily or weekly then I am preparing for big move so time to go big once I get the signal.
19. Most Important Candlestick pattern - Bullish and Bearish Engulfing
20. The only Chart patterns I need -
a) Falling Wedge/Channel Bullish Pattern Uptrend or Bull Flag - Buying - Forming over a couple days for intraday and forming over a couple of weeks for swing
b) Falling Wedge/Channel Bullish Pattern Downtrend or Falling Channel - Buying
c) Rising Wedge Bearish Pattern Uptrend or Rising Channel - Selling
d) Rising Wedge Bearish Pattern Downtrend or Bear flag - Selling
e) Head and Shoulder - Over a longer period not for intraday. In 15 min takes few days and for swing 1hr or 4h or daily can take few days
f) M and W pattern - Reversal Patterns - They form within the above 4 patterns, usually resulting in the break of trend line
21. How Gaps work -
a) Small Gap up in Uptrend - Market can fill the gap and reverse. The perception is that people are buying. If previous day candle was Strong Bullish then market view is up.
b) Big Gap up in Uptrend - Not news driven - Profit booking will come but may not fill the entire gap
c) Big Gap up in Uptrend - News driven, war related, tax, interest rate - Market can keep going up without stopping.
c) Flat opening in Uptrend - Big chance of market going up. If previous day candle was Strong Bullish then view is upwards, if it was Doji then still upwards.
d) Gap down in Uptrend - Market is surprised. After going down initially it can go up
e) Small Gap down in Downtrend - Market can fill the gap and keep moving down. If previous day candle was Strong Bearish then view is still down.
f) Flat opening in Downtrend - View is down, short today.
g) Big Gap down in Downtrend - Profit booking and foolish buying will come but market view is still down.
h) Gap down with News - Volatility, sideways then down.
i) Gap Up in Downtrend - Can move up - Price can move up during 2/3rd of the day and End of the day revert and close in red.
22. Go big on bearish days for option traders. Puts are better bought and Calls are better sold.
23. Cluster of green signals can lead to bigger move on the upside and vice versa for red signals.
24. Most of this is what I learned from successful traders (from the top 2%) only the indicator is mine.

ATR Future Movement Range Projection
The "ATR Future Movement Range Projection" is a custom TradingView Pine Script indicator designed to forecast potential price ranges for a stock (or any asset) over short-term (1-month) and medium-term (3-month) horizons. It leverages the Average True Range (ATR) as a measure of volatility to estimate how far the price might move, while incorporating recent momentum bias based on the proportion of bullish (green) vs. bearish (red) candles. This creates asymmetric projections: in bullish periods, the upside range is larger than the downside, and vice versa.
The indicator is overlaid on the chart, plotting horizontal lines for the projected high and low prices for both timeframes. Additionally, it displays a small table in the top-right corner summarizing the projected prices and the percentage change required from the current close to reach them. This makes it useful for traders assessing potential targets, risk-reward ratios, or option strategies, as it combines volatility forecasting with directional sentiment.
Key features:
- **Volatility Basis**: Uses weekly ATR to derive a stable daily volatility estimate, avoiding noise from shorter timeframes.
- **Momentum Adjustment**: Analyzes recent candle colors to tilt projections toward the prevailing trend (e.g., more upside if more green candles).
- **Time Horizons**: Fixed at 1 month (21 trading days) and 3 months (63 trading days), assuming ~21 trading days per month (excluding weekends/holidays).
- **User Adjustable**: The ATR length/lookback (default 50) can be tweaked via inputs.
- **Visuals**: Green/lime lines for highs, red/orange for lows; a semi-transparent table for quick reference.
- **Limitations**: This is a probabilistic projection based on historical volatility and momentum—it doesn't predict direction with certainty and assumes volatility persists. It ignores external factors like news, earnings, or market regimes. Best used on daily charts for stocks/ETFs.
The indicator doesn't generate buy/sell signals but helps visualize "expected" ranges, similar to how implied volatility informs option pricing.
### How It Works Step-by-Step
The script executes on each bar update (typically daily timeframe) and follows this logic:
1. **Input Configuration**:
- ATR Length (Lookback): Default 50 bars. This controls both the ATR calculation period and the candle count window. You can adjust it in the indicator settings.
2. **Calculate Weekly ATR**:
- Fetches the ATR from the weekly timeframe using `request.security` with a length of 50 weeks.
- ATR measures average price range (high-low, adjusted for gaps), representing volatility.
3. **Derive Daily ATR**:
- Divides the weekly ATR by 5 (approximating 5 trading days per week) to get an equivalent daily volatility estimate.
- Example: If weekly ATR is $5, daily ATR ≈ $1.
4. **Define Projection Periods**:
- 1 Month: 21 trading days.
- 3 Months: 63 trading days (21 × 3).
- These are hardcoded but based on standard trading calendar assumptions.
5. **Compute Base Projections**:
- Base projection = Daily ATR × Days in period.
- This gives the total expected movement (range) without direction: e.g., for 3 months, $1 daily ATR × 63 = $63 total range.
6. **Analyze Candle Momentum (Win Rate)**:
- Counts green candles (close > open) and red candles (close < open) over the last 50 bars (ignores dojis where close == open).
- Total colored candles = green + red.
- Win rate = green / total colored (as a fraction, e.g., 0.7 for 70%). Defaults to 0.5 if no colored candles.
- This acts as a simple momentum proxy: higher win rate implies bullish bias.
7. **Adjust Projections Asymmetrically**:
- Upside projection = Base projection × Win rate.
- Downside projection = Base projection × (1 - Win rate).
- This skews the range: e.g., 70% win rate means 70% of the total range allocated to upside, 30% to downside.
8. **Calculate Projected Prices**:
- High = Current close + Upside projection.
- Low = Current close - Downside projection.
- Done separately for 1M and 3M.
9. **Plot Lines**:
- 3M High: Solid green line.
- 3M Low: Solid red line.
- 1M High: Dashed lime line.
- 1M Low: Dashed orange line.
- Lines extend horizontally from the current bar onward.
10. **Display Table**:
- A 3-column table (Projection, Price, % Change) in the top-right.
- Rows for 1M High/Low and 3M High/Low, color-coded.
- % Change = ((Projected price - Close) / Close) × 100.
- Updates dynamically with new data.
The entire process repeats on each new bar, so projections evolve as volatility and momentum change.
### Examples
Here are two hypothetical examples using the indicator on a daily chart. Assume it's applied to a stock like AAPL, but with made-up data for illustration. (In TradingView, you'd add the script to see real outputs.)
#### Example 1: Bullish Scenario (High Win Rate)
- Current Close: $150.
- Weekly ATR (50 periods): $10 → Daily ATR: $10 / 5 = $2.
- Last 50 Candles: 35 green, 15 red → Total colored: 50 → Win Rate: 35/50 = 0.7 (70%).
- Base Projections:
- 1M: $2 × 21 = $42.
- 3M: $2 × 63 = $126.
- Adjusted Projections:
- 1M Upside: $42 × 0.7 = $29.4 → High: $150 + $29.4 = $179.4 (+19.6%).
- 1M Downside: $42 × 0.3 = $12.6 → Low: $150 - $12.6 = $137.4 (-8.4%).
- 3M Upside: $126 × 0.7 = $88.2 → High: $150 + $88.2 = $238.2 (+58.8%).
- 3M Downside: $126 × 0.3 = $37.8 → Low: $150 - $37.8 = $112.2 (-25.2%).
- On the Chart: Green/lime lines skewed higher; table shows bullish % changes (e.g., +58.8% for 3M high).
- Interpretation: Suggests stronger potential upside due to recent bullish momentum; useful for call options or long positions.
#### Example 2: Bearish Scenario (Low Win Rate)
- Current Close: $50.
- Weekly ATR (50 periods): $3 → Daily ATR: $3 / 5 = $0.6.
- Last 50 Candles: 20 green, 30 red → Total colored: 50 → Win Rate: 20/50 = 0.4 (40%).
- Base Projections:
- 1M: $0.6 × 21 = $12.6.
- 3M: $0.6 × 63 = $37.8.
- Adjusted Projections:
- 1M Upside: $12.6 × 0.4 = $5.04 → High: $50 + $5.04 = $55.04 (+10.1%).
- 1M Downside: $12.6 × 0.6 = $7.56 → Low: $50 - $7.56 = $42.44 (-15.1%).
- 3M Upside: $37.8 × 0.4 = $15.12 → High: $50 + $15.12 = $65.12 (+30.2%).
- 3M Downside: $37.8 × 0.6 = $22.68 → Low: $50 - $22.68 = $27.32 (-45.4%).
- On the Chart: Red/orange lines skewed lower; table highlights larger downside % (e.g., -45.4% for 3M low).
- Interpretation: Indicates bearish risk; might prompt protective puts or short strategies.
#### Example 3: Neutral Scenario (Balanced Win Rate)
- Current Close: $100.
- Weekly ATR: $5 → Daily ATR: $1.
- Last 50 Candles: 25 green, 25 red → Win Rate: 0.5 (50%).
- Projections become symmetric:
- 1M: Base $21 → Upside/Downside $10.5 each → High $110.5 (+10.5%), Low $89.5 (-10.5%).
- 3M: Base $63 → Upside/Downside $31.5 each → High $131.5 (+31.5%), Low $68.5 (-31.5%).
- Interpretation: Pure volatility-based range, no directional bias—ideal for straddle options or range trading.
In real use, test on historical data: e.g., if past projections captured actual moves ~68% of the time (1 standard deviation for ATR), it validates the volatility assumption. Adjust the lookback for different assets (shorter for volatile cryptos, longer for stable blue-chips).

Opening Range BreakoutOPENING RANGE BREAKOUT (ORB) INDICATOR
DESCRIPTION
The Opening Range Breakout indicator is a powerful technical analysis tool designed specifically for US equity markets. It identifies and visualizes the opening range established during the first configurable minutes of each trading day (starting at 9:30 AM EST), then provides clear signals when price breaks out of or rejects from these key levels.
This indicator combines multiple timeframe analysis capabilities with precise breakout detection to help traders identify high-probability trading opportunities based on opening range dynamics.
KEY FEATURES
Configurable Opening Range:
• Set opening range duration from 5 minutes to 4 hours
• Automatically adjusts calculations based on your chart timeframe
• Works on any timeframe (1m, 5m, 15m, 1h, etc.)
Multi-Day Range Display:
• Shows up to 50 days of historical opening ranges
• Each day's range properly contained within its trading session
• Range lines extend from market open (9:30 AM) to market close (4:00 PM EST)
Clear Signal System:
• Green arrows (⬆): Bullish breakouts and rejections
• Red arrows (⬇): Bearish breakouts and rejections
• Two signal types: Close breakouts (normal size) and wick rejections (small size)
Visual Range Highlighting:
• Opening range period highlighted with colored box
• Customizable colors for range fill, borders, and midline
• Clean, professional appearance with configurable line styles
SIGNAL TYPES
Bullish Signals (Green ⬆):
1. Close Breakout Above Range (Normal Size): 5-minute candle closes above the opening range high
2. Wick Rejection from Below (Small Size): Price wicks below the opening range low but closes back inside the range
Bearish Signals (Red ⬇):
1. Close Breakout Below Range (Normal Size): 5-minute candle closes below the opening range low
2. Wick Rejection from Above (Small Size): Price wicks above the opening range high but closes back inside the range
CONFIGURATION OPTIONS
Range Settings:
• Opening Range Minutes: Duration of opening range (default: 30 minutes)
• Lookback Days: Number of historical days to display (default: 20 days)
Visual Customization:
• Range Color: Fill color for the opening range area
• Border Color: Color for range high/low lines
• Midline Color: Color for the range midpoint line
• Opening Range Highlight Color: Color for the opening period box
• Line Style: Solid, Dashed, or Dotted lines
• Line Width: 1-4 pixel width options
Display Options:
• Show Midline: Toggle midpoint line display
• Show Range Labels: Toggle price level labels
• Arrow Distance: Adjust arrow positioning (0.1-2.0%)
USAGE GUIDE
Basic Setup:
1. Add the indicator to your chart (works best on 5-minute timeframe)
2. Configure your preferred opening range duration (15m, 30m, or 60m are popular choices)
3. Adjust lookback days based on your analysis needs
4. Customize colors and line styles to match your chart theme
Trading Applications:
Breakout Trading:
• Long Entry: Green arrow (close breakout above range) + confirmation
• Short Entry: Red arrow (close breakout below range) + confirmation
• Stop Loss: Opposite side of the opening range
• Target: 1-2x the range size or key support/resistance levels
Range Rejection Trading:
• Reversal Setups: Small arrows indicate failed breakouts
• Mean Reversion: Trade back toward range midline
• Support/Resistance: Use range levels as key price zones
Multi-Day Analysis:
• Identify recurring support/resistance levels
• Analyze range expansion/contraction patterns
• Compare current day's activity to recent history
BEST PRACTICES
1. Timeframe Selection: 5-minute charts provide optimal signal clarity
2. Range Duration: 30-minute opening range is most commonly used, but adjust based on:
- Market volatility
- Stock characteristics
- Trading style preference
3. Confirmation: Use additional indicators or price action for trade confirmation
4. Risk Management: Always use appropriate position sizing and stop losses
MARKET SESSIONS
The indicator is specifically designed for US equity markets:
• Market Open: 9:30 AM EST
• Market Close: 4:00 PM EST
• Opening Range: Calculated from market open
• Range Lines: Extend throughout the trading day only
PERFORMANCE NOTES
• Optimized for real-time trading with minimal lag
• Automatically manages memory by cleaning old ranges
• Efficiently handles multiple timeframes and range calculations
KNOWN ISSUES & WORKAROUNDS
Historical Buffer Error:
Issue: Occasionally, you may encounter an error: "The requested historical offset (XXX) is beyond the historical buffer's limit (770)"
Workaround:
1. Switch to a different timeframe temporarily
2. Switch back to your original timeframe
3. The indicator will reload and function normally
This is a Pine Script limitation related to historical data access and doesn't affect the indicator's core functionality.
COMPATIBILITY
• Pine Script Version: v6
• Chart Types: All chart types supported
• Timeframes: All timeframes (optimized for 1m-1h)
• Markets: Designed for US equity markets during regular trading hours
TIPS FOR MAXIMUM EFFECTIVENESS
1. Combine with Volume: High volume on breakouts increases reliability
2. Market Context: Consider overall market direction and volatility
3. News Awareness: Be cautious around earnings and major announcements
4. Range Quality: Wider ranges often provide better breakout opportunities
5. Time of Day: Early breakouts (first 1-2 hours) often have higher follow-through
This indicator is provided for educational and informational purposes. Always conduct your own analysis and manage risk appropriately.

Opening/Closing Range [Pro] (jdam18)Indicator Summary
The Opening/Closing Range indicator systematically captures and displays the Opening Range (OR) (9:30am ET) and Closing Range (CR) (3:50pm ET) for each trading session with flexible historical tracking and visual customization options.
Key functionalities include:
Opening and Closing Ranges: Dynamically plots the OR and CR session boxes with options for high/low lines, midline (equilibrium) plotting, and customizable extension to the current bar.
Extensions: Automatically generates extension levels above and below the range based on user-defined multipliers, facilitating clearer identification of price expansion levels.
Merging Logic: Optionally merges overlapping OR and CR ranges into unified boxes, enhancing clarity when sessions overlap significantly. Merged boxes may display a consolidated central line (CE) and visual extensions.
Event Horizons: Detects and highlights meaningful price gaps ("Event Horizons") between non-overlapping ranges, with optional subdivision into quarters and eighths for detailed gap structure analysis.
Weekly Extensions: Independently tracks Monday and Wednesday Opening and Closing Ranges, projecting expansion levels for the week.
Weekly Extension Table: Provides an optional summary table displaying the status of Monday and Wednesday extensions, range size, and the current location of price relative to key extension thresholds. Table positioning is customizable.
The script is designed to be performance-conscious, modular, and highly configurable, supporting intraday timeframes up to 15 minutes, and providing comprehensive visualizations to aid in market structure analysis and trading decisions.

Daily Volatility Range (DVR) [GIF]VIX as a Volatility Indicator:
The VIX is a measure of the market's expectation of volatility in the S&P 500 over the next 30 days, based on the prices of S&P 500 options.
The Rule of 16:
A VIX of 16 implies that the market expects the SPX to move up or down by roughly 1% on any given day.
If the VIX is 24, the expected daily move is around 1.5%, and with a VIX of 32, the expected move is around 2%.
The rationale for the rule is that the square root of the number of trading days in a year (approximately 252) is roughly 16.
Example:
If the VIX is at 20, the rule suggests that the SPX might see daily moves of around 1.25%.
Practical Application:
The rule of 16 can be used as a quick and easy way to estimate the potential daily volatility of the S&P 500 based on the VIX.
The Daily Volatility Range:
This indicator cross references the ticker on the chart with it's own volatility index (assuming it has one). Below are the indexes and stocks that have their own volatility index:
S&P 500
Nasdaq 100
Russell 2000
Dow Jones
TLT
Bitcoin
Gold
Crude Oil
Apple
Amazon
Google
IBM
Goldman Sachs
How I use the DVR:
Historic probabilities show that you will close the day within the DVR. However, there are times when those probabilities diminish greatly. One of those times is when you open in the RTH session outside of the DVR. If you open outside the DVR, you can look for the DVR to becomes support/resistance and stay extended outside the DVR. These days can often become muted as most of the most has happened before the market open. However, if we open outside the DVR and break back into range, it is highly probable that we will not break back into those extended ranges.
Indicator Options:
There are 2x and 3x DVR levels that can be plotted. During times of extreme volatility, it will become important to have these plotted.
There is the option to plot calculated pivot points. These are fib ranges that have historically been areas of consolidation or trend reversal. These are projections based on my own research and are not as important as the DVR levels themselves.
There is also an option to color the candles a specific color if the candle closes outside the DVR. This is to highlight the fact that price action has exceeded the range and caution should be taken.
If you have suggestions how to make this indicator better, please let me know in the comments and I will look into it. Thank you!

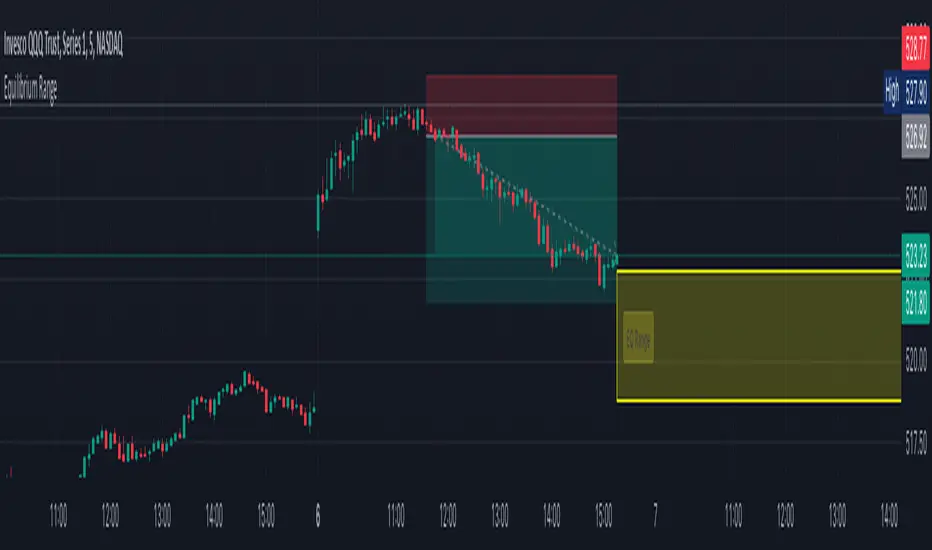
Equilibrium Range
Equilibrium Range Indicator
The Equilibrium Range Indicator is a powerful tool designed to assist traders in identifying key market equilibrium zones. By dynamically plotting ranges derived from critical market levels, this indicator provides actionable insights for trade entries, exits, and position management. It is particularly suited for traders who focus on intraday price action and rely on understanding market structure for decision-making.
How the Indicator Works
High-Timeframe Structural Equilibrium (Structural EQ)
This level is calculated by identifying the largest visible swing high and swing low on the 5-minute chart.
It represents the structural price equilibrium, where market sentiment is balanced between buyers and sellers.
Previous Day's Equilibrium (Historical EQ)
Derived from the midpoint of the previous day's high and low prices.
Acts as a historical reference point for potential support or resistance zones.
Dynamic Range Construction
The indicator combines the Structural EQ and the Historical EQ to create an Equilibrium Range.
This range is visually displayed on the chart as a transparent yellow rectangle, ensuring clear and immediate recognition.
Extension and Labeling
The equilibrium range extends infinitely to the right, keeping it relevant for ongoing price action.
A labeled "EQ Range" inside the rectangle ensures traders can quickly identify its purpose.
How to Use the Indicator
Consolidation Zones
The Equilibrium Range helps identify areas where price is likely to consolidate, aiding in avoiding trades during periods of low volatility.
Trade Entries and Exits
Use the upper and lower bounds of the range as guides for setting take-profit and stop-loss levels.
Ideal for scaling in and out of trades based on how price interacts with the range.
Market Sentiment and Breakouts
Observe how price behaves relative to the range:
Breakouts above the range may signal bullish momentum.
Breakouts below the range may indicate bearish trends.
Why It's Original
This indicator stands out by combining multiple concepts of equilibrium into a single, coherent visualization. Unlike traditional support/resistance indicators, the Equilibrium Range Indicator dynamically adapts to market structure while integrating historical context, providing traders with a unique perspective for analyzing price action.
ICT Asian Range and KillzonesThis TradingView indicator highlights key trading sessions and their price ranges on a chart. It identifies the Asian Range and the Killzones for both the London Open and New York Open sessions. Here’s a brief breakdown:
Asian Range:
Defines the high and low price levels during the Asian trading session (between the specified start and end hours, default 00:00 to 04:00 UTC).
Plots horizontal lines to mark the highest and lowest prices reached during the Asian session.
Adds labels showing the values of these high and low points after the session ends.
London and New York Killzones:
Identifies the “Killzones” or key trading windows for the London Open (default 06:00 to 09:00 UTC) and the New York Open (default 11:00 to 14:00 UTC).
Tracks the high and low price levels within these windows and plots rectangles ("boxes") on the chart to visualize these ranges.
The boxes are color-coded and customizable, indicating potential areas of high market activity or volatility.
Customizable Visuals:
Users can adjust the colors, border widths, and other visual properties for better clarity and chart integration.

[DarkTrader] Classic Swipe (DW)Classic Swipe (DW) indicator is a highly customizable tool designed to visualize key price zones and liquidity sweeps on a daily and weekly basis. This script uses advanced plotting features like boxes, labels, and color-coded zones to help traders identify critical market structures such as daily/weekly high-low ranges and bullish or bearish swipes (previous daily high/low levels).
Key Features :
Daily Zone Box: Marks and tracks the high-low range for each trading day. Provides clear visual representation of price action within the daily range.
Weekly Zone Box: Highlights weekly high-low ranges, giving insight into longer-term support and resistance areas.
Bullish and Bearish Daily Swipes: Detects and marks sweeps of previous daily highs (bullish) or lows (bearish) with custom colors and transparency settings.
Customization: Toggle between displaying weekly and daily zones, adjust box colors and transparency, and fine-tune the appearance to match your preferences.
How to Use :
Daily Zone Box: Use this feature to identify key areas of daily price consolidation or breakout, providing intraday support/resistance zones.
Weekly Zone Box: Longer-term traders can leverage the weekly zone box to track broader market trends and prepare for potential swing trade setups.
Daily Swipes: The bullish and bearish swipe detection helps in spotting liquidity grabs or stop hunts, aiding in precise entry/exit decisions based on liquidity pools.
Indicator In Use :
Whether you're a day trader looking for intraday levels or a swing trader focusing on broader trends, this tool can help enhance your analysis by providing clear visual aids for market structure and liquidity events.

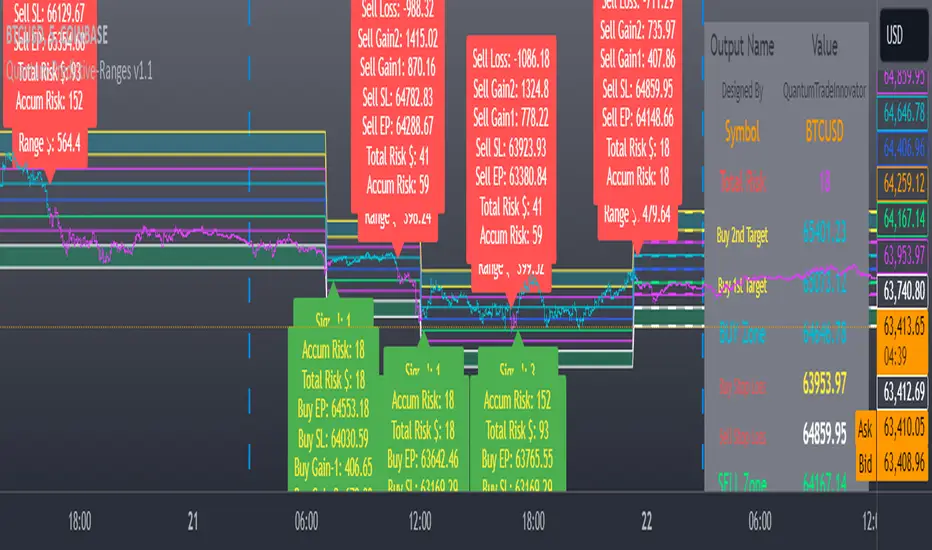
Quantum Duality Predictive Ranges### Quantum Duality Predictive Ranges v1.0
This Pine Script is designed to help traders predict price ranges and manage risk dynamically using ATR (Average True Range) calculations. It offers customizable settings, visual indicators, and alerts to assist in identifying trading opportunities and managing risk.
#### Key Features
- **Dynamic Risk Management**: Adjusts risk based on signals and cumulative risk.
- **Predictive Ranges**: Calculates predictive ranges based on ATR and user-defined multipliers.
- **Visual Indicators**: Plots lines and labels for easy visualization of trading signals and risk levels.
- **Alerts and Table**: Provides alerts for trading signals and displays a table with relevant trading data.
#### User Inputs
**EA Account Settings**
- **Initial Risk fixed in USD $**: Sets the initial risk amount in USD (default: 18).
- **Signal Multiply Factor for Risk**: Multiplier for signal risk (default: 1.257).
- **Pair Decimals**: Decimal places for pair pricing (default: 2).
**Trade Settings**
- **ATR Length**: Length for ATR calculation (default: 198).
- **ATR Factor**: Multiplier for ATR (default: 6.0).
- **ATR Source**: Source for ATR calculation (default: close).
- **ATR Multiplier**: Multiplier for defining RANGE Top/Bottom Levels (default: 0.45).
- **Inner Range Multiplier**: Multiplier for defining TP1 (default: 2.01).
- **Outer Range Multiplier**: Multiplier for defining TP2 (default: 3.0).
- **Spans Multiplier**: Multiplier for defining SL (default: 0.36).
**Display Options**
- **Display Table**: Option to display a table (default: true).
- **Display Labels for potential Gain and Loss**: Option to display gain/loss labels (default: true).
- **Display Labels for Bar counts since current Range**: Option to display bar counts (default: true).
- **Display Labels for Signals**: Option to display signal labels (default: true).
- **Line Width**: Width of the lines plotted (default: 1).
- **Line Transparency**: Transparency of the lines (default: 10).
- **Fill Transparency**: Transparency of the fill between lines (default: 75).
#### How It Works
1. **Predictive Ranges Calculation**:
- Calculates predictive ranges based on ATR, holds ATR values, and updates average values when price crosses defined levels.
2. **Risk Management and Signal Logic**:
- Counts the number of signals.
- Calculates cumulative and total risk based on signals.
- Resets signals and risk when price crosses predictive ranges.
3. **Entry Points and Potential Gains/Losses**:
- Determines buy and sell entry points.
- Calculates potential gains and losses for both buy and sell signals.
- Resets values when a new average range is established.
4. **Plotting and Alerts**:
- Plots lines for predictive ranges, spans, and stop loss levels.
- Displays labels for signals and potential gains/losses.
- Provides alerts for buy and sell signals with defined take profit and stop loss levels.
5. **Custom Ticker**:
- Renames tickers based on predefined rules (e.g., SPX500USD to SPX500).
#### Usage
1. **Set Up**:
- Adjust the input parameters in the settings menu to match your trading preferences and risk management strategy.
2. **Visualize**:
- View the plotted lines and labels on the chart to identify potential trading signals and manage risk.
3. **Alerts**:
- Enable alerts to receive notifications for buy and sell signals.
4. **Table**:
- Use the table to see a summary of important trading data, such as total risk and target levels.
This script provides a robust framework for managing risk and identifying trading opportunities using predictive ranges based on ATR. Happy trading!
[F][IND] - Candle Range SizeDescription:
Understanding market volatility is paramount for making informed trading decisions, and the Candle Range Histogram Indicator is designed to provide traders with a visual representation of price volatility over time.
Key Features:
1. Histogram Display:
The indicator presents a histogram on your TradingView chart, offering a clear visualization of the range of each candle, calculated as the difference between the high and low prices.
2. Volatility Insight:
Easily identify periods of heightened or subdued volatility. Larger histograms indicate greater price ranges, suggesting increased volatility, while smaller histograms signify lower volatility.
3. Intraday Analysis:
Intraday traders can benefit from monitoring the Candle Range Histogram to gauge volatility patterns throughout the trading day. This information is valuable for setting realistic profit targets and adjusting risk management strategies.
4. Breakout Opportunities:
Recognize potential breakout opportunities by observing significant increases in candle range. Traders often associate expanded ranges with potential strong price movements.
5. Trend Confirmation:
Confirm the strength of trends by assessing consecutive candles with expanding or contracting ranges. This can aid trend-following traders in making more informed decisions.
It's important to note that while the histogram provides valuable information, it's usually more effective when used in conjunction with other technical indicators and analysis methods. Traders often combine multiple tools to gain a comprehensive understanding of the market and make well-informed trading decisions.
Alerts:
You can enable alerts on this indicator to receive timely notifications.
Disclaimer:
This indicator is provided for educational purposes only. Trading involves risk, and users should consult with a financial professional before making any trading decisions.
Your Feedback Matters!
Please feel free to comment or reach out if you have any improvement suggestions or if you would like to request the development of a specific indicator. Your feedback is invaluable!

Rolling ATR Channel (Expo)Rolling ATR Channel (Expo) is a sophisticated indicator that identifies the underlying trend as well as identifies ATR based trading ranges. In a trending market, the price will be within the Upper or Lower band. If the market is in a trading range , the price will bounce between the upper and lower ATR zones, until the price breaks through and creates a new trend. The user will no longer have to guess in which state the market is in, the indicator displays it clearly.
So, the indicator displays real-time Range (ATR based) support and resistance zones as well as if the market is in a trend.
If you know the current market state, you have the ability to choose the most applicable market strategy.
Real-time
No repainting
Works on any market and in any timeframe
HOW TO USE
- Use the indicator to identify trading range support and resistance zones.
- Use the indicator to identify when the price breaks through the trading range.
- Use the indicator to identify if the market is in a trend.
INDICATOR IN ACTION
4 Hour chart
I hope you find this indicator useful , and please comment or contact me if you like the script or have any questions/suggestions for future improvements. Thanks!
I will continually work on this indicator, so please share your experience and feedback as it will enable me to make even better improvements. Thanks to everyone that has already contacted me regarding my scripts. Your feedback is valuable for future developments!
-----------------
Disclaimer
Copyright by Zeiierman.
The information contained in my scripts/indicators/ideas does not constitute financial advice or a solicitation to buy or sell any securities of any type. I will not accept liability for any loss or damage, including without limitation any loss of profit, which may arise directly or indirectly from the use of or reliance on such information.
All investments involve risk, and the past performance of a security, industry, sector, market, financial product, trading strategy, or individual’s trading does not guarantee future results or returns. Investors are fully responsible for any investment decisions they make. Such decisions should be based solely on an evaluation of their financial circumstances, investment objectives, risk tolerance, and liquidity needs.
My scripts/indicators/ideas are only for educational purposes!
-----------------
ACCESS THE INDICATOR
• Contact me on TradingView or use the links below

888 BOT #alerts█ 888 BOT #alerts
This is an Expert Advisor 'EA' or Automated trading script for ‘longs’ and ‘shorts’, which uses only a Take Profit or, in the worst case, a Stop Loss to close the trade.
It's a much improved version of the previous ‘Repanocha’. It doesn`t use 'Trailing Stop' or 'security ()' functions (although using a security function doesn`t mean that the script repaints) and all signals are confirmed, therefore the script doesn`t repaint in alert mode and is accurate in backtest mode.
Apart from the previous indicators, some more and other functions have been added for Stop-Loss, re-entry and leverage.
It uses 8 indicators, (many of you already know what they are, but in case there is someone new), these are the following:
1. Jurik Moving Average
It's a moving average created by Mark Jurik for professionals which eliminates the 'lag' or delay of the signal. It's better than other moving averages like EMA, DEMA, AMA or T3.
There are two ways to decrease noise using JMA. Increasing the 'LENGTH' parameter will cause JMA to move more slowly and therefore reduce noise at the expense of adding 'lag'
The 'JMA LENGTH', 'PHASE' and 'POWER' parameters offer a way to select the optimal balance between 'lag' and over boost.
Green: Bullish, Red: Bearish.
2. Range filter
Created by Donovan Wall, its function is to filter or eliminate noise and to better determine the price trend in the short term.
First, a uniform average price range 'SAMPLING PERIOD' is calculated for the filter base and multiplied by a specific quantity 'RANGE MULTIPLIER'.
The filter is then calculated by adjusting price movements that do not exceed the specified range.
Finally, the target ranges are plotted to show the prices that will trigger the filter movement.
Green: Bullish, Red: Bearish.
3. Average Directional Index (ADX Classic) and (ADX Masanakamura)
It's an indicator designed by Welles Wilder to measure the strength and direction of the market trend. The price movement is strong when the ADX has a positive slope and is above a certain minimum level 'ADX THRESHOLD' and for a given period 'ADX LENGTH'.
The green color of the bars indicates that the trend is bullish and that the ADX is above the level established by the threshold.
The red color of the bars indicates that the trend is down and that the ADX is above the threshold level.
The orange color of the bars indicates that the price is not strong and will surely lateralize.
You can choose between the classic option and the one created by a certain 'Masanakamura'. The main difference between the two is that in the first it uses RMA () and in the second SMA () in its calculation.
4. Parabolic SAR
This indicator, also created by Welles Wilder, places points that help define a trend. The Parabolic SAR can follow the price above or below, the peculiarity that it offers is that when the price touches the indicator, it jumps to the other side of the price (if the Parabolic SAR was below the price it jumps up and vice versa) to a distance predetermined by the indicator. At this time the indicator continues to follow the price, reducing the distance with each candle until it is finally touched again by the price and the process starts again. This procedure explains the name of the indicator: the Parabolic SAR follows the price generating a characteristic parabolic shape, when the price touches it, stops and turns (SAR is the acronym for 'stop and reverse'), giving rise to a new cycle. When the points are below the price, the trend is up, while the points above the price indicate a downward trend.
5. RSI with Volume
This indicator was created by LazyBear from the popular RSI.
The RSI is an oscillator-type indicator used in technical analysis and also created by Welles Wilder that shows the strength of the price by comparing individual movements up or down in successive closing prices.
LazyBear added a volume parameter that makes it more accurate to the market movement.
A good way to use RSI is by considering the 50 'RSI CENTER LINE' centerline. When the oscillator is above, the trend is bullish and when it is below, the trend is bearish.
6. Moving Average Convergence Divergence (MACD) and (MAC-Z)
It was created by Gerald Appel. Subsequently, the histogram was added to anticipate the crossing of MA. Broadly speaking, we can say that the MACD is an oscillator consisting of two moving averages that rotate around the zero line. The MACD line is the difference between a short moving average 'MACD FAST MA LENGTH' and a long moving average 'MACD SLOW MA LENGTH'. It's an indicator that allows us to have a reference on the trend of the asset on which it is operating, thus generating market entry and exit signals.
We can talk about a bull market when the MACD histogram is above the zero line, along with the signal line, while we are talking about a bear market when the MACD histogram is below the zero line.
There is the option of using the MAC-Z indicator created by LazyBear, which according to its author is more effective, by using the parameter VWAP (volume weighted average price) 'Z-VWAP LENGTH' together with a standard deviation 'STDEV LENGTH' in its calculation.
7. Volume Condition
Volume indicates the number of participants in this war between bulls and bears, the more volume the more likely the price will move in favor of the trend. A low trading volume indicates a lower number of participants and interest in the instrument in question. Low volumes may reveal weakness behind a price movement.
With this condition, those signals whose volume is less than the volume SMA for a period 'SMA VOLUME LENGTH' multiplied by a factor 'VOLUME FACTOR' are filtered. In addition, it determines the leverage used, the more volume, the more participants, the more probability that the price will move in our favor, that is, we can use more leverage. The leverage in this script is determined by how many times the volume is above the SMA line.
The maximum leverage is 8.
8. Bollinger Bands
This indicator was created by John Bollinger and consists of three bands that are drawn superimposed on the price evolution graph.
The central band is a moving average, normally a simple moving average calculated with 20 periods is used. ('BB LENGTH' Number of periods of the moving average)
The upper band is calculated by adding the value of the simple moving average X times the standard deviation of the moving average. ('BB MULTIPLIER' Number of times the standard deviation of the moving average)
The lower band is calculated by subtracting the simple moving average X times the standard deviation of the moving average.
the band between the upper and lower bands contains, statistically, almost 90% of the possible price variations, which means that any movement of the price outside the bands has special relevance.
In practical terms, Bollinger bands behave as if they were an elastic band so that, if the price touches them, it has a high probability of bouncing.
Sometimes, after the entry order is filled, the price is returned to the opposite side. If price touch the Bollinger band in the same previous conditions, another order is filled in the same direction of the position to improve the average entry price, (% MINIMUM BETTER PRICE ': Minimum price for the re-entry to be executed and that is better than the price of the previous position in a given %) in this way we give the trade a chance that the Take Profit is executed before. The downside is that the position is doubled in size. 'ACTIVATE DIVIDE TP': Divide the size of the TP in half. More probability of the trade closing but less profit.
█ STOP LOSS and RISK MANAGEMENT.
A good risk management is what can make your equity go up or be liquidated.
The % risk is the percentage of our capital that we are willing to lose by operation. This is recommended to be between 1-5%.
% Risk: (% Stop Loss x % Equity per trade x Leverage) / 100
First the strategy is calculated with Stop Loss, then the risk per operation is determined and from there, the amount per operation is calculated and not vice versa.
In this script you can use a normal Stop Loss or one according to the ATR. Also activate the option to trigger it earlier if the risk percentage is reached. '% RISK ALLOWED' wich is calculated according with: '%EQUITY ON EACH ENTRY'. Only works with Stop Loss on 'NORMAL' or 'BOTH' mode.
'STOP LOSS CONFIRMED': The Stop Loss is only activated if the closing of the previous bar is in the loss limit condition. It's useful to prevent the SL from triggering when they do a ‘pump’ to sweep Stops and then return the price to the previous state.
█ ALERTS
There is an alert for each leverage, therefore a maximum of 8 alerts can be set for 'long' and 8 for 'short', plus an alert to close the trade with Take Profit or Stop Loss in market mode. You can also place Take Profit limit and Stop Loss limit orders a few seconds after filling the position entry order.
- 'MAXIMUM LEVERAGE': It is the maximum allowed multiplier of the % quantity entered on each entry for 1X according to the volume condition.
- 'ADVANCE ALERTS': There is always a time delay from when the alert is triggered until it reaches the exchange and can be between 1-15 seconds. With this parameter, you can advance the alert by the necessary seconds to activate it earlier. In this way it can be synchronized with the exchange so that the execution time of the entry order to the position coincides with the opening of the bar.
The settings are for Bitcoin at Binance Futures (BTC: USDTPERP) in 30 minutes.
For other pairs and other timeframes, the settings have to be adjusted again. And within a month, the settings will be different because we all know the market and the trend are changing.
█ 888 BOT (SPANISH)
Este es un Expert Advisor 'EA' o script de trading automatizado para ‘longs’ y ‘shorts’, el cual, utiliza solo un Take Profit o, en el peor de los casos, un Stop Loss para cerrar el trade.
Es una versión muy mejorada del anterior ‘Repanocha’. No utiliza ‘Trailing Stop’, ni funciones ‘security()’ (aunque usar una función security no significa que el script repinte) y todas las señales son confirmadas, por consiguiente, el script no repinta en modo alertas y es preciso en en el modo backtest.
Aparte de los anteriores indicadores se han añadido algunos más y otras funciones para Stop-Loss, de re-entrada y apalancamiento.
Utiliza 8 indicadores, (muchos ya sabéis sobradamente lo que son, pero por si hay alguien nuevo), son los siguientes:
1. Jurik Moving Average
Es una media móvil creada por Mark Jurik para profesionales la cual elimina el ‘lag’ o retardo de la señal. Es mejor que otras medias móviles como la EMA, DEMA, AMA o T3.
Hay dos formas de disminuir el ruido utilizando JMA. El aumento del parámetro 'LENGTH' hará que JMA se mueva más lentamente y, por lo tanto, reducirá el ruido a expensas de añadir ‘lag’
Los parámetros 'JMA LENGTH', 'PHASE' y 'POWER' ofrecen una forma de seleccionar el equilibrio óptimo entre ‘lag’ y sobre impulso.
Verde : Alcista, Rojo: Bajista.
2. Range filter
Creado por Donovan Wall, su función es la de filtrar o eliminar el ruido y poder determinar mejor la tendencia del precio a corto plazo.
Primero, se calcula un rango de precio promedio uniforme 'SAMPLING PERIOD' para la base del filtro y se multiplica por una cantidad específica 'RANGE MULTIPLIER'.
A continuación, el filtro se calcula ajustando los movimientos de precios que no exceden el rango especificado.
Por último, los rangos objetivo se trazan para mostrar los precios que activarán el movimiento del filtro.
Verde : Alcista, Rojo: Bajista.
3. Average Directional Index (ADX Classic) y (ADX Masanakamura)
Es un indicador diseñado por Welles Wilder para medir la fuerza y dirección de la tendencia del mercado. El movimiento del precio tiene fuerza cuando el ADX tiene pendiente positiva y está por encima de cierto nivel mínimo 'ADX THRESHOLD' y para un periodo dado 'ADX LENGTH'.
El color verde de las barras indica que la tendencia es alcista y que el ADX está por encima del nivel establecido por el threshold.
El color Rojo de las barras indica que la tendencia es bajista y que el ADX está por encima del nivel de threshold.
El color naranja de las barras indica que el precio no tiene fuerza y seguramente lateralizará.
Se puede elegir entre la opción clásica y la creada por un tal 'Masanakamura'. La diferencia principal entre los dos es que en el primero utiliza RMA() y en el segundo SMA() en su cálculo.
4. Parabolic SAR
Este indicador, creado también por Welles Wilder, coloca puntos que ayudan a definir una tendencia. El Parabolic SAR puede seguir al precio por encima o por debajo, la particularidad que ofrece es que cuando el precio toca al indicador, este salta al otro lado del precio (si el Parabolic SAR estaba por debajo del precio salta arriba y viceversa) a una distancia predeterminada por el indicador. En este momento el indicador vuelve a seguir al precio, reduciendo la distancia con cada vela hasta que finalmente es tocado otra vez por el precio y se vuelve a iniciar el proceso. Este procedimiento explica el nombre del indicador: el Parabolic SAR va siguiendo al precio generando una característica forma parabólica, cuando el precio lo toca, se para y da la vuelta (SAR son las siglas en inglés de ‘stop and reverse’), dando lugar a un nuevo ciclo. Cuando los puntos están por debajo del precio, la tendencia es alcista, mientras que los puntos por encima del precio indica una tendencia bajista.
5. RSI with Volume
Este indicador lo creo un tal LazyBear de TV a partir del popular RSI.
El RSI es un indicador tipo oscilador utilizado en análisis técnico y creado también por Welles Wilder que muestra la fuerza del precio mediante la comparación de los movimientos individuales al alza o a la baja de los sucesivos precios de cierre.
LazyBear le añadió un parámetro de volumen que lo hace más preciso al movimiento del mercado.
Una buena forma de usar el RSI es teniendo en cuenta la línea central de 50 'RSI CENTER LINE'. Cuando el oscilador está por encima, la tendencia es alcista y cuando está por debajo la tendencia es bajista.
6. Moving Average Convergence Divergence (MACD) y (MAC-Z)
Fue creado por Gerald Appel. Posteriormente se añadió el histograma para anticipar el cruce de medias. A grandes rasgos podemos decir que el MACD es un oscilador consistente en dos medias móviles que van girando en torno a la línea de cero. La línea del MACD no es más que la diferencia entre una media móvil corta 'MACD FAST MA LENGTH' y una media móvil larga 'MACD SLOW MA LENGTH'. Es un indicador que nos permite tener una referencia sobre la tendencia del activo sobre el cual se está operando, generando de este modo señales de entrada y salida del mercado.
Podemos hablar de mercado alcista cuando el histograma del MACD se sitúe por encima de la línea cero, junto con la línea de señal, mientras que hablaremos de mercado bajista cuando el histograma MACD se situará por debajo de la línea cero.
Está la opción de utilizar el indicador MAC-Z creado por LazyBear que según su autor es más eficaz, por utilizar el parámetro VWAP (precio medio ponderado por volumen) 'Z-VWAP LENGTH' junto con una desviación standard 'STDEV LENGTH' en su cálculo.
7. Volume Condition
El volumen indica el número de participantes en esta guerra entre toros y osos, cuanto más volumen más probabilidad de que se mueva el precio a favor de la tendencia. Un volumen bajo de negociación indica un menor número de participantes e interés por el instrumento en cuestión. Los bajos volúmenes pueden revelar debilidad detrás de un movimiento de precios.
Con esta condición se filtran aquellas señales cuyo volumen es inferior a la SMA de volumen para un periodo 'SMA VOLUME LENGTH' multiplicado por un factor 'VOLUME FACTOR'. Además, determina el apalancamiento utilizado, a más volumen, más participantes, más probabilidad de que se mueva el precio a nuestro favor, es decir, podemos utilizar más apalancamiento. El apalancamiento en este script lo determina las veces que está el volumen por encima de la línea de la SMA.
El apalancamiento máximo es de 8.
8. Bollinger Bands
Este indicador fue creado por John Bollinger y consiste en tres bandas que se dibujan superpuestas al gráfico de evolución del precio.
La banda central es una media móvil, normalmente se emplea una media móvil simple calculada con 20 períodos. ('BB LENGTH' Número de periodos de la media móvil)
La banda superior se calcula sumando al valor de la media móvil simple X veces la desviación típica de la media móvil. ('BB MULTIPLIER' Número de veces la desviación típica de la media móvil)
La banda inferior de calcula restando a la media móvil simple X veces la desviación típica de la media móvil.
la franja comprendida entre las bandas superior e inferior contiene, estadísticamente, casi un 90% de las posibles variaciones del precio, lo que significa que cualquier movimiento del precio fuera de las bandas tiene especial relevancia.
En términos prácticos, las bandas de Bollinguer se comporta como si de una banda elástica se tratara de manera que, si el precio las toca, éste tiene mucha probabilidad de rebotar.
En ocasiones, después de rellenarse la orden de entrada, el precio se devuelve hacia el lado contrario. Si toca la banda de Bollinger se rellena otra orden en la misma dirección de la posición para mejorar el precio medio de entrada, (% MINIMUM BETTER PRICE': Precio mínimo para que se ejecute la re-entrada y que sea mejor que el precio de la posición anterior en un % dado) de esta manera damos una oportunidad al trade de que el Take Profit se ejecute antes. La desventaja es que se dobla el tamaño de la posición. 'ACTIVATE DIVIDE TP': Divide el tamaño del TP a la mitad. Más probabilidad de que se cierre el trade pero menos ganancias.
█ STOP LOSS y RISK MANAGEMENT.
Una buena gestión de las pérdidas o gestión del riesgo es lo que puede hacer que tu cuenta suba o se liquide en poco tiempo.
El % de riesgo es el porcentaje de nuestro capital que estamos dispuestos a perder por operación. Este se aconseja que debe estar comprendido entre un 1-5%.
% Risk = (% Stop Loss x % Equity per trade x Leverage) / 100
Primero se calcula la estrategia con Stop Loss, después se determina el riesgo por operación y a partir de ahí se calcula el monto por operación y no al revés.
En este script puedes usar un Stop Loss normal o uno según el ATR. También activar la opción de que salte antes si se alcanza el porcentaje de riesgo. '% RISK ALLOWED' que se calcula según el porcentaje de tu capital para 1X '% EQUITY ON EACH ENTRY'.
'STOP LOSS CONFIRMED': Solamente se activa el Stop Loss si el cierre de la barra anterior se encuentra en la condición de límite de pérdidas. Es útil para evitar que se dispare el SL cuando hacen un ‘pump’ para barrer Stops y luego se devuelve el precio a la normalidad.
█ ALERTAS
Hay una alerta por cada apalancamiento por consiguiente como máximo se pueden poner 8 alertas para 'long' y 8 para 'short', más una alerta para cerrar el trade con Take Profit o Stop Loss en modo market. Tambien puedes colocar las ordenes Take Profit limit y Stop Loss limit unos segundos despues de rellenar la orden de entrada de la posición.
- 'MAXIMUM LEVERAGE': Es el máximo multiplicador permitido de la cantidad introducida para 1X según la condición de volumen.
- 'ADVANCE ALERTS': Siempre existe un retardo de tiempo desde que se activa la alerta hasta que llega al exchange y que puede ser de entre 1-15 segundos. Con este párametro se puede adelantar la alerta los segundos necesarios para que se active antes. De este modo se puede sincronizar con el exchange para que el tiempo de ejecución de la orden de entrada a la posición coincida con la de apertura de la barra.
Los settings son para Bitcoin en Binance Futures (BTC:USDTPERP) en 30 minutos.
Para otro pares y otras temporalidades se tienen que ajustar las opciones de nuevo. Además para dentro de un mes, los ajustes serán otros distintos ya que el mercado y la tendencia es cambiante.

First presented FVG (w/stats) w/statistical hourly ranges & biasOverview
This indicator identifies the first Fair Value Gap (FVG) that forms during each hourly session and provides comprehensive statistical analysis based on 12 years of historical NASDAQ (NQ) data. It combines price action analysis with probability-based statistics to help traders make informed decisions.
⚠️ IMPORTANT - Compatibility
Market: This indicator is designed exclusively for NASDAQ futures (NQ/MNQ)
Timeframe: Statistical data is based on FVGs formed on the 5-minute timeframe
FVG Detection: Works on any timeframe, but use 5-minute for accuracy matching the statistical analysis
All hardcoded statistics are derived from 12 years of NQ historical data
What It Does
1. FVG Detection & Visualization
Automatically detects the first FVG (bullish or bearish) that forms each hour
Draws colored boxes around FVGs:
Blue boxes = Bullish FVG (gap up)
Red boxes = Bearish FVG (gap down)
FVG boxes extend to the end of the hour
Optional midpoint lines show the center of each FVG
Uses volume imbalance logic (outside prints) to refine FVG boundaries
2. Hourly Reference Lines
Vertical Delimiter: Marks the start of each hour
Hourly Open Line: Shows where the current hour opened
Expected Range Lines: Projects the anticipated high/low based on historical data
Choose between Mean (average) or Median (middle value) statistics
Upper range line (teal/green)
Lower range line (red)
All lines span exactly one hour from the moment it opens
Optional labels show price values at line ends
3. Real-Time Statistics Table
The table displays live data for the current hour only:
Hour: Current hour in 12-hour format (AM/PM)
FVG Status: Shows if a Bull FVG, Bear FVG, or no FVG has formed yet
Green background = Bullish FVG detected
Red background = Bearish FVG detected
1st 15min: Direction of the first 15 minutes (Bullish/Bearish/Neutral/Pending)
Continuation %: Historical probability that the hour continues in the first 15-minute direction
Color-coded: Green for bullish, red for bearish
Avg Range %: Expected percentage range for the current hour (based on 12-year mean)
FVG Effect %: Historical probability that FVG direction predicts hourly close direction
Shows BISI→Bull % for bullish FVGs
Shows SIBI→Bear % for bearish FVGs
Blank if no FVG has formed yet
Time Left: Countdown timer showing MM:SS remaining in the hour (updates in real-time)
Hourly Bias: Historical directional tendency (bullish % or bearish %)
H Open: Current hour's opening price
Exp Range: Projected price range (Low - High) based on historical average
Customization Options
Detection Settings:
Lower Timeframe Selection (15S, 1min, 5min) - controls FVG detection granularity
Display Settings:
FVG box colors (bullish/bearish)
Midpoint lines (show/hide, color, style)
Table Settings:
Position (9 locations: corners, edges, center)
Text size (Tiny, Small, Normal, Large)
Hourly Lines:
Toggle each line type on/off
Hour delimiter (color, width)
Open line (color, width, style)
Range lines (color, width, style)
Choose Mean or Median statistics for range calculation
Show/hide labels with customizable text size
How to Use
Apply to NQ futures chart (NQ1! or MNQ1!)
Set chart to 5-minute timeframe for optimal FVG detection matching the statistical data
Watch for the first FVG to form each hour
Reference the table for probability-based decision support:
High continuation % = strong directional bias
FVG Effect % shows reliability of the FVG signal
Time Left helps manage entries/exits within the hour
Use range lines as potential targets or reversal zones
Statistical Foundation
All statistics are derived from:
12 years of NASDAQ (NQ) historical data
Hourly analysis of FVG formation patterns
First 15-minute directional analysis
Mean and Median calculations for range expectations
Data encompasses 2,400+ samples per hour
Best Practices
✅ Use on NQ/MNQ futures only
✅ Best on 5-minute charts (matches statistical data)
✅ Combine FVG signals with continuation probabilities
✅ Use range lines as potential profit targets
✅ Watch the countdown timer for hour-end setups
❌ Do not use on other markets (statistics won't apply)
❌ Avoid using during low-liquidity hours (5PM ET has minimal data)
Technical Notes
Timezone: America/New_York (EST/EDT)
Weekend filtering: Automatically hides data during market closure
Updates in real-time on live bars
Maximum 500 boxes/lines for performance
FVG detection includes volume imbalance (body gap) refinement
Credits
Statistical analysis based on 12 years of NASDAQ historical data. FVG detection methodology follows ICT concepts with volume imbalance refinement.
Disclaimer: This indicator provides statistical analysis based on historical data. Past performance does not guarantee future results. Always use proper risk management.
Would you like me to adjust any section or add/remove anything?6-9 Session & Levels - Customizable Range Analysis Indicator
Description:
This indicator provides comprehensive session-based range analysis designed for intraday traders. It calculates and displays key levels based on a customizable session period (default 6:00-9:00 AM ET).
Core Features:
Sespastedthis is a summary for another indicator- i was hoping for something more like this in terms of content etc22:23Architected comprehensive indicator summary matching professional documentation style.The user wants me to rewrite the summary for their FVG indicator in a similar style to the example provided. The example is more structured, detailed, and professional. Let me create a comprehensive summary that follows that format:
Clear title
Description/Overview
Core Features (broken down into sections)
Input Settings Explained (detailed breakdown of all customization options)
How It Works section
Use Case
Note/Disclaimer
Let me make it thorough and match the style while being accurate to their indicator's functionality.Here's a detailed summary in that format:
Every Hour 1st FVG with Statistical Analysis - NASDAQ Hourly Trading Intelligence
Description:
This indicator identifies the first Fair Value Gap (FVG) that forms during each hourly session and provides comprehensive probability-based statistical analysis derived from 12 years of NASDAQ (NQ) historical data. It combines real-time FVG detection with hardcoded statistical probabilities to help intraday traders make informed decisions based on historical patterns and hourly price action dynamics.
IMPORTANT: This indicator is specifically calibrated for NASDAQ futures (NQ/MNQ) only. All statistical data is derived from 12 years of NQ historical analysis with FVGs detected on the 5-minute timeframe. Using this indicator on other markets will produce invalid statistical results.
Core Features:
FVG Detection & Visualization
Automatically detects and displays the first Fair Value Gap (bullish or bearish) that forms within each hourly session
Color-coded boxes mark FVG zones: Blue for bullish FVGs (gap up), Red for bearish FVGs (gap down)
FVG boxes extend precisely to the end of the hour boundary
Optional midpoint lines show the center point of each FVG
Uses volume imbalance logic (outside prints) to refine FVG boundaries beyond simple wick-to-wick gaps
Supports both chart timeframe detection and lower timeframe detection via request.security_lower_tf
Hourly Reference Lines
Vertical Hour Delimiter: Marks the exact start of each new hour with an extendable vertical line
Hourly Open Line: Displays the opening price of the current hour
Expected Range Lines: Projects anticipated high and low levels based on 12 years of statistical data
Choose between Mean (average) or Median (middle value) calculations
Upper range line shows expected high
Lower range line shows expected low
All lines span exactly one hour from open to close
Optional labels display exact price values at the end of each line
Real-Time Statistics Table
Displays comprehensive live data for the current hour only:
Hour: Current hour in 12-hour format (e.g., "9AM", "2PM")
FVG Status: Shows detection state with color coding
"None Yet" (white background) - No FVG detected
"Bull FVG" (green background) - Bullish FVG identified
"Bear FVG" (red background) - Bearish FVG identified
1st 15min: Direction of first 15 minutes (Bullish/Bearish/Neutral/Pending)
Continuation %: Historical probability that the hour closes in the direction of the first 15 minutes
Green background with up arrow (↑) for bullish continuation probability
Red background with down arrow (↓) for bearish continuation probability
Avg Range %: Expected percentage range for the current hour based on 12-year mean
FVG Effect %: Historical effectiveness of FVG directional prediction
Shows "BISI→Bull %" for bullish FVGs (gap up predicting bullish hourly close)
Shows "SIBI→Bear %" for bearish FVGs (gap down predicting bearish hourly close)
Displays blank if no FVG has formed yet
Time Left: Real-time countdown timer showing minutes and seconds remaining in the hour (MM:SS format)
Hourly Bias: Historical directional tendency showing bullish or bearish percentage bias
H Open: Current hour's opening price
Exp Range: Projected price range showing "Low - High" based on selected statistic (mean or median)
Input Settings Explained:
Detection Settings
Lower Timeframe: Select the base timeframe for FVG detection
Options: 15S (15 seconds), 1 (1 minute), 5 (5 minutes)
Recommendation: Use 5-minute to match the statistical data sample
The indicator uses this timeframe to scan for FVG patterns even when viewing higher timeframes
Display Settings
Bullish FVG Color: Set the color and transparency for bullish (upward) FVG boxes
Bearish FVG Color: Set the color and transparency for bearish (downward) FVG boxes
Show Midpoint Lines: Toggle horizontal lines at the center of each FVG box
Midpoint Line Color: Customize the midpoint line color
Midpoint Line Style: Choose between Solid, Dotted, or Dashed line styles
Table Settings
Table Position: Choose from 9 locations:
Top: Left, Center, Right
Middle: Left, Center, Right
Bottom: Left, Center, Right
Table Text Size: Select from Tiny, Small, Normal, or Large for readability on different screen sizes
Hourly Lines Settings
Show Hourly Lines: Master toggle for all hourly reference lines
Show Hour Delimiter: Toggle the vertical line marking each hour's start
Delimiter Color: Customize color and transparency
Delimiter Width: Set line thickness (1-5)
Show Hourly Open: Toggle the horizontal line at the hour's opening price
Open Line Color: Customize color
Open Line Width: Set thickness (1-5)
Open Line Style: Choose Solid, Dashed, or Dotted
Show Range Lines: Toggle the expected high/low projection lines
Range Statistic: Choose "Mean" (12-year average) or "Median" (12-year middle value)
Range High Color: Customize upper range line color and transparency
Range Low Color: Customize lower range line color and transparency
Range Line Width: Set thickness (1-5)
Range Line Style: Choose Solid, Dashed, or Dotted
Show Line Labels: Toggle price labels at the end of all horizontal lines
Label Text Size: Choose Tiny, Small, or Normal
How It Works:
FVG Detection Logic:
The indicator scans price action on the selected lower timeframe (default: 1-minute) looking for Fair Value Gaps using a 3-candle pattern:
Bullish FVG: Formed when candle 's high is below candle 's low, creating an upward gap
Bearish FVG: Formed when candle 's low is above candle 's high, creating a downward gap
The detection is refined using volume imbalance logic by checking for body gaps (outside prints) on both sides of the middle candle. This narrows the FVG zone to areas where bodies don't touch, indicating stronger imbalances.
Only the first FVG that forms during each hour is displayed. If a bullish FVG forms first, it takes priority. The FVG box is drawn from the formation time through to the end of the hour.
Statistical Analysis:
All probability statistics are hardcoded from 12 years (2,400+ samples per hour) of NASDAQ futures analysis:
First 15-Minute Direction: At 15 minutes into each hour, the indicator determines if price closed above, below, or equal to the hour's opening price
Continuation Probability: Historical analysis shows the likelihood that the hour closes in the same direction as the first 15 minutes
Example: If 9AM's first 15 minutes are bullish, there's a 60.1% chance the entire 9AM hour closes bullish (lowest continuation hour)
4PM shows the highest continuation at 86.1% for bullish first 15 minutes
FVG Effectiveness: Tracks how often the first FVG's direction correctly predicts the hourly close direction
BISI (Bullish Imbalance/Sell-side Inefficiency) → Bullish close probability
SIBI (Bearish Imbalance/Buy-side Inefficiency) → Bearish close probability
Range Expectations: Mean and median values represent typical price movement percentage for each hour
9AM and 10AM show the largest ranges (~0.6%)
5PM shows minimal range (~0.06%) due to low liquidity
Hourly Reference Lines:
When each new hour begins:
Vertical delimiter marks the hour's start
Hourly open line plots at the first bar's opening price
Range projection lines calculate expected high/low:
Upper Range = Hourly Open + (Range% / 100 × Hourly Open)
Lower Range = Hourly Open - (Range% / 100 × Hourly Open)
Lines extend exactly to the hour's end time
Labels appear at line endpoints showing exact prices
Real-Time Updates:
FVG Status: Updates immediately when the first FVG forms
First 15min Direction: Locked in at the 15-minute mark
Countdown Timer: Uses timenow to update every second
Table Statistics: Refresh on every bar close
Timezone Handling:
All times are in America/New_York (Eastern Time)
Automatically filters weekend periods (Saturday and Sunday before 6PM)
Hour detection accounts for daylight saving time changes
Use Cases:
Intraday Trading Strategy Development:
FVG Entry Signals: Use the first hourly FVG as a directional bias
Bullish FVG + High continuation % = Strong long setup
Bearish FVG + High continuation % = Strong short setup
First 15-Minute Breakout: Combine first 15-min direction with continuation probabilities
Wait for first 15 minutes to complete
If continuation % is above 70%, trade in that direction
Example: 4PM bullish first 15 min = 86.1% chance hour closes bullish
Range Targeting: Use expected high/low lines as profit targets or reversal zones
Price approaching mean high = potential resistance
Price approaching mean low = potential support
Compare mean vs median for different risk tolerance (median is more conservative)
Hour Selection: Focus trading on hours with:
High FVG effectiveness (11AM: 81.5% BISI→Bull)
High continuation rates (4PM: 86.1% bull continuation)
Avoid low-continuation hours like 9AM (60.1%)
Time Management: Use the countdown timer to:
Enter early in the hour when FVG forms
Exit before hour-end if no follow-through
Avoid late-hour entries with <15 minutes remaining
Statistical Edge Identification:
Compare current hour's FVG against historical effectiveness
Identify when first 15-min direction contradicts FVG direction (conflict = caution)
Use hourly bias to confirm or contradict FVG signals
Monitor if price stays within expected range or breaks out (outlier moves)
Risk Management:
Expected range lines provide logical stop-loss placement
FVG Effect % helps size positions (higher % = larger position)
Time Left countdown aids in time-based stop management
Avoid trading hours with neutral bias or low continuation rates
Statistical Foundation:
All embedded statistics are derived from:
12 years of NASDAQ futures (NQ) continuous contract data
5-minute timeframe FVG detection methodology
24 hours per day analysis (excluding weekends)
2,400+ samples per hour for robust statistical validity
America/New_York timezone for session alignment
Data includes:
Hourly range analysis (mean, median, standard deviation)
First 15-minute directional analysis
FVG formation frequency and effectiveness
Continuation probability matrices
Bullish/bearish bias percentages
Best Practices:
✅ Do:
Use exclusively on NASDAQ futures (NQ1! or MNQ1!)
Apply on 5-minute charts for optimal FVG detection matching statistical samples
Wait for first 15 minutes to complete before acting on continuation probabilities
Combine FVG signals with continuation % and FVG Effect % for confluence
Use expected range lines as initial profit targets
Monitor the countdown timer for time-based trade management
Focus on hours with high statistical edges (4PM, 11AM, 10AM)
❌ Don't:
Use on other markets (ES, RTY, YM, stocks, forex, crypto) - statistics will be invalid
Rely solely on FVG without confirming with continuation probabilities
Trade during low-liquidity hours (5PM shows only 0.06% average range)
Ignore the first 15-minute direction when it conflicts with FVG direction
Apply to timeframes significantly different from 5-minute for FVG detection
Use median range expectations aggressively (they're conservative)
Technical Implementation Notes:
Timezone: Fixed to America/New_York with automatic DST adjustment
Weekend Filtering: Automatically hides data Saturday and Sunday before 6PM ET
Performance: Maximum 500 boxes and 500 lines for optimal chart rendering
Update Frequency: Table updates on every bar close; timer updates every second using timenow
FVG Priority: Bullish FVGs take precedence when both form simultaneously
Lower Timeframe Detection: Uses request.security_lower_tf for accurate sub-chart-timeframe FVG detection
Precision: All price labels use format.mintick for appropriate decimal precision
Big thanks to @Trades-Dont-Lie for the FPFVG code in his excellent indicator that I've used here

ICMR — Chrono Maker Range (v12.7.1)✅ ICMR — Chrono Maker Range (v12.7) — Description (Balanced Technical + Friendly)
ICMR — Chrono Maker Range is a hybrid market-structure tool designed to help traders clearly identify directional bias and high-quality breakouts using either Higher-Timeframe (HTF) ranges or Initial Balance (IB) ranges. The indicator automatically builds the range, colors candles by market state, and highlights breakout signals using smart filters to reduce noise.
The concept is simple:
Price is either above the range (Bullish), inside the range (Neutral), or below the range (Bearish)—and ICMR keeps this state stable and easy to follow.
🔷 How It Works
ICMR constructs a tradable range using one of two modes:
1) HTF Range Mode
Pulls the High / Low from a higher timeframe (e.g., Daily, 4H).
You can choose:
Previous HTF candle → stable, non-moving range
Current HTF candle → dynamic, expands until HTF close
Perfect for tracking market bias across smaller timeframes.
2) Initial Balance (IB) Mode
Builds the range from the first N minutes of the session (e.g., first 60 minutes).
After the IB period ends, the range locks and becomes the day’s framework.
🔷 Market State Logic
The indicator evaluates where price is relative to the range and classifies the market into:
✅ Bullish → price breaks above the range
⚪ Neutral → price stays inside
❌ Bearish → price breaks below
You can optionally enable an EMA Trend Filter (fast vs slow EMA) to ensure breakouts align with trend direction.
🔷 Smart Signal System
ICMR includes compact signal shapes (triangles/circles), but only when conditions are strong:
✔️ Minimum breakout distance beyond the range
✔️ Candle body must exceed a % of ATR
✔️ Optional volume expansion filter
✔️ Cooldown between signals to avoid over-trading
✔️ Option to trigger signals only on state flips
These filters help keep signals actionable and reduce noise.
🔷 Visual Tools
HTF/IB Range High, Range Low, Midline
Optional shaded box
Segmented extend-right lines that reset when HTF/IB changes
Bar coloring (Bull/Neutral/Bear)
Soft background tint (optional)
Built-in info panel with range & filter stats
Alerts on state flips
Everything is designed to keep the chart clean and readable.
🔷 Presets
The indicator includes two ready-to-use profiles:
Conservative
Stable HTF ranges, confirmed breaks, trend-filtered signals, and fewer alerts.
Aggressive
Dynamic HTF ranges, more flexible break rules, and more frequent signals.
Each preset can be fully customized.
🔷 How Traders Use It
Intraday traders use HTF ranges (D, 4H) for bias on 1m–15m charts.
Day traders use IB to track the opening range and breakout opportunities.
Swing traders use conservative settings to filter false moves.
Scalpers enable aggressive mode with ATR/volume filters.

Opening Range Breakout with Multi-Timeframe Liquidity]═══════════════════════════════════════
OPENING RANGE BREAKOUT WITH MULTI-TIMEFRAME LIQUIDITY
═══════════════════════════════════════
A professional Opening Range Breakout (ORB) indicator enhanced with multi-timeframe liquidity detection, trading session visualization, volume analysis, and trend confirmation tools. Designed for intraday trading with comprehensive alert system.
───────────────────────────────────────
WHAT THIS INDICATOR DOES
───────────────────────────────────────
This indicator combines multiple trading concepts:
- Opening Range Breakout (ORB) - Customizable time period detection with automatic high/low identification
- Multi-Timeframe Liquidity - HTF (Higher Timeframe) and LTF (Lower Timeframe) key level detection
- Trading Sessions - Tokyo, London, New York, and Sydney session visualization
- Volume Analysis - Volume spike detection and strength measurement
- Multi-Timeframe Confirmation - Trend bias from higher timeframes
- EMA Integration - Trend filter and dynamic support/resistance
- Smart Alerts - Quality-filtered breakout notifications
───────────────────────────────────────
HOW IT WORKS
───────────────────────────────────────
OPENING RANGE BREAKOUT (ORB):
Concept:
The Opening Range is a period at the start of a trading session where price establishes an initial high and low. Breakouts beyond this range often indicate the direction of the day's trend.
Detection Method:
- Default: 15-minute opening range (configurable)
- Custom Range: Set specific session times with timezone support
- Automatically identifies ORH (Opening Range High) and ORL (Opening Range Low)
- Tracks ORB mid-point for reference
Range Establishment:
1. Session starts (or custom time begins)
2. Tracks highest high and lowest low during the period
3. Range confirmed at end of opening period
4. Levels extend throughout the session
Breakout Detection:
- Bullish Breakout: Close above ORH
- Bearish Breakout: Close below ORL
- Mid-point acts as bias indicator
Visual Display:
- Shaded box during range formation
- Horizontal lines for ORH, ORL, and mid-point
- Labels showing level values
- Color-coded fills based on selected method
Fill Color Methods:
1. Session Comparison:
- Green: Current OR mid > Previous OR mid
- Red: Current OR mid < Previous OR mid
- Gray: Equal or first session
- Shows day-over-day momentum
2. Breakout Direction (Recommended):
- Green: Price currently above ORH (bullish breakout)
- Red: Price currently below ORL (bearish breakout)
- Gray: Price inside range (no breakout)
- Real-time breakout status
MULTI-TIMEFRAME LIQUIDITY:
Two-Tier System for comprehensive level identification:
HTF (Higher Timeframe) Key Liquidity:
- Default: 4H timeframe (configurable to Daily, Weekly)
- Identifies major institutional levels
- Uses pivot detection with adjustable parameters
- Suitable for swing highs/lows where large orders rest
LTF (Lower Timeframe) Key Liquidity:
- Default: 1H timeframe (configurable)
- Provides precision entry/exit levels
- Finer granularity for intraday trading
- Captures minor swing points
Calculation Method:
- Pivot high/low detection algorithm
- Configurable left bars (lookback) and right bars (confirmation)
- Timeframe multiplier for accurate multi-timeframe detection
- Automatic level extension
Mitigation System:
- Tracks when levels are swept (broken)
- Configurable mitigation type: Wick or Close-based
- Option to remove or show mitigated levels
- Display limit prevents chart clutter
Asset-Specific Optimization:
The indicator includes quick reference settings for different assets:
- Major Forex (EUR/USD, GBP/USD): Default settings optimal
- Crypto (BTC/ETH): Left=12, Right=4, Display=7
- Gold: HTF=1D, Left=20
TRADING SESSIONS:
Four Major Sessions with Full Customization:
Tokyo Session:
- Default: 04:00-13:00 UTC+4
- Asian trading hours
- Often sets daily range
London Session:
- Default: 11:00-20:00 UTC+4
- Highest liquidity period
- Major institutional activity
New York Session:
- Default: 16:00-01:00 UTC+4
- US market hours
- High-impact news events
Sydney Session:
- Default: 01:00-10:00 UTC+4
- Earliest Asian activity
- Lower volatility
Session Features:
- Shaded background boxes
- Session name labels
- Optional open/close lines
- Session high/low tracking with colored lines
- Each session has independent color settings
- Fully customizable times and timezones
VOLUME ANALYSIS:
Volume-Based Trade Confirmation:
Volume MA:
- Configurable period (default: 20)
- Establishes average volume baseline
- Used for spike detection
Volume Spike Detection:
- Identifies when volume exceeds MA * multiplier
- Default: 1.5x average volume
- Confirms breakout strength
Volume Strength Measurement:
- Calculates current volume as percentage of average
- Shows relative volume intensity
- Used in alert quality filtering
High Volume Bars:
- Identifies bars above 50th percentile
- Additional confirmation layer
- Indicates institutional participation
MULTI-TIMEFRAME CONFIRMATION:
Trend Bias from Higher Timeframes:
HTF 1 (Trend):
- Default: 1H timeframe
- Uses EMA to determine intermediate trend
- Compares current timeframe EMA to HTF EMA
HTF 2 (Bias):
- Default: 4H timeframe
- Uses 50 EMA for longer-term bias
- Confirms overall market direction
Bias Classifications:
- Bullish Bias: HTF close > HTF 50 EMA AND Current EMA > HTF1 EMA
- Bearish Bias: HTF close < HTF 50 EMA AND Current EMA < HTF1 EMA
- Neutral Bias: Mixed signals between timeframes
EMA Stack Analysis:
- Compares EMA alignment across timeframes
- +1: Bullish stack (lower TF EMA > higher TF EMA)
- -1: Bearish stack (lower TF EMA < higher TF EMA)
- 0: Neutral/crossed
Usage:
- Filters false breakouts
- Confirms trend direction
- Improves trade quality
EMA INTEGRATION:
Dynamic EMA for Trend Reference:
Features:
- Configurable period (default: 20)
- Customizable color and width
- Acts as dynamic support/resistance
- Trend filter for ORB trades
Application:
- Above EMA: Favor long breakouts
- Below EMA: Favor short breakouts
- EMA cross: Potential trend change
- Distance from EMA: Momentum gauge
SMART ALERT SYSTEM:
Quality-Filtered Breakout Notifications:
Alert Types:
1. Standard ORB Breakout
2. High Quality ORB Breakout
Quality Criteria:
- Volume Confirmation: Volume > 1.2x average
- MTF Confirmation: Bias aligned with breakout direction
Standard Alert:
- Basic breakout detection
- Price crosses ORH or ORL
- Icon: 🚀 (bullish) or 🔻 (bearish)
High Quality Alert:
- Both volume AND MTF confirmed
- Stronger probability setup
- Icon: 🚀⭐ (bullish) or 🔻⭐ (bearish)
Alert Information Includes:
- Alert quality rating
- Breakout level and current price
- Volume strength percentage (if enabled)
- MTF bias status (if enabled)
- Recommended action
One Alert Per Bar:
- Prevents alert spam
- Uses flag system to track sent alerts
- Resets on new ORB session
───────────────────────────────────────
HOW TO USE
───────────────────────────────────────
OPENING RANGE SETUP:
Basic Configuration:
1. Select time period for opening range (default: 15 minutes)
2. Choose fill color method (Breakout Direction recommended)
3. Enable historical data display if needed
Custom Range (Advanced):
1. Enable Custom Range toggle
2. Set specific session time (e.g., 0930-0945)
3. Select appropriate timezone
4. Useful for specific market opens (NYSE, LSE, etc.)
LIQUIDITY LEVELS SETUP:
Quick Configuration by Asset:
- Forex: Use default settings (Left=15, Right=5)
- Crypto: Set Left=12, Right=4, Display=7
- Gold: Set HTF=1D, Left=20
HTF Liquidity:
- Purpose: Major support/resistance levels
- Recommended: 4H for day trading, 1D for swing trading
- Use as profit targets or reversal zones
LTF Liquidity:
- Purpose: Entry/exit refinement
- Recommended: 1H for day trading, 4H for swing trading
- Use for position management
Mitigation Settings:
- Wick-based: More sensitive (default)
- Close-based: More conservative
- Remove or Show mitigated levels based on preference
TRADING SESSIONS SETUP:
Enable/Disable Sessions:
- Master toggle for all sessions
- Individual session controls
- Show/hide session names
Session High/Low Lines:
- Enable to see session extremes
- Each session has custom colors
- Useful for range trading
Customization:
- Adjust session times for your broker
- Set timezone to match your location
- Customize colors for visibility
VOLUME ANALYSIS SETUP:
Enable Volume Analysis:
1. Toggle on Volume Analysis
2. Set MA length (20 recommended)
3. Adjust spike multiplier (1.5 typical)
Usage:
- Confirm breakouts with volume
- Identify climactic moves
- Filter false signals
MULTI-TIMEFRAME SETUP:
HTF Selection:
- HTF 1 (Trend): 1H for day trading, 4H for swing
- HTF 2 (Bias): 4H for day trading, 1D for swing
Interpretation:
- Trade only with bias alignment
- Neutral bias: Be cautious
- Bias changes: Potential reversals
EMA SETUP:
Configuration:
- Period: 20 for responsive, 50 for smoother
- Color: Choose contrasting color
- Width: 1-2 for visibility
Usage:
- Filter trades: Long above, Short below
- Dynamic support/resistance reference
- Trend confirmation
ALERT SETUP:
TradingView Alert Creation:
1. Enable alerts in indicator settings
2. Enable ORB Breakout Alerts
3. Right-click chart → Add Alert
4. Select this indicator
5. Choose "Any alert() function call"
6. Configure delivery method (mobile, email, webhook)
Alert Filtering:
- All alerts include quality rating
- High Quality alerts = Volume + MTF confirmed
- Standard alerts = Basic breakout only
───────────────────────────────────────
TRADING STRATEGIES
───────────────────────────────────────
CLASSIC ORB STRATEGY:
Setup:
1. Wait for opening range to complete
2. Price breaks and closes above ORH or below ORL
3. Volume > average (if enabled)
4. MTF bias aligned (if enabled)
Entry:
- Bullish: Buy on break above ORH
- Bearish: Sell on break below ORL
- Consider retest entries for better risk/reward
Stop Loss:
- Bullish: Below ORL or range mid-point
- Bearish: Above ORH or range mid-point
- Adjust based on volatility
Targets:
- Initial: Range width extension (ORH + range width)
- Secondary: HTF liquidity levels
- Final: Session high/low or major support/resistance
ORB + LIQUIDITY CONFLUENCE:
Enhanced Setup:
1. Opening range established
2. HTF liquidity level near or beyond ORH/ORL
3. Breakout occurs with volume
4. Price targets the liquidity level
Entry:
- Enter on ORB breakout
- Target the HTF liquidity level
- Use LTF liquidity for position management
Management:
- Partial profits at ORB + range width
- Move stop to breakeven at LTF liquidity
- Final exit at HTF liquidity sweep
ORB REJECTION STRATEGY (Counter-Trend):
Setup:
1. Price breaks above ORH or below ORL
2. Weak volume (below average)
3. MTF bias opposite to breakout
4. Price closes back inside range
Entry:
- Failed bullish break: Short below ORH
- Failed bearish break: Long above ORL
Stop Loss:
- Beyond the failed breakout level
- Or beyond session extreme
Target:
- Opposite end of opening range
- Range mid-point for partial profit
SESSION-BASED ORB TRADING:
Tokyo Session:
- Typically narrower ranges
- Good for range trading
- Wait for London open breakout
London Session:
- Highest volume and volatility
- Strong ORB setups
- Major liquidity sweeps common
New York Session:
- Strong trending moves
- News-driven volatility
- Good for momentum trades
Sydney Session:
- Quieter conditions
- Suitable for range strategies
- Sets up Tokyo session
EMA-FILTERED ORB:
Rules:
- Only take bullish breaks if price > EMA
- Only take bearish breaks if price < EMA
- Ignore counter-trend breaks
Benefits:
- Reduces false signals
- Aligns with larger trend
- Improves win rate
───────────────────────────────────────
CONFIGURATION GUIDE
───────────────────────────────────────
OPENING RANGE SETTINGS:
Time Period:
- 15 min: Standard for most markets
- 30 min: Wider range, fewer breakouts
- 60 min: For slower markets or swing trades
Custom Range:
- Use for specific market opens
- NYSE: 0930-1000 EST
- LSE: 0800-0830 GMT
- Set timezone to match exchange
Historical Display:
- Enable: See all previous session data
- Disable: Cleaner chart, current session only
LIQUIDITY SETTINGS:
Left Bars (5-30):
- Lower: More frequent, sensitive levels
- Higher: Fewer, more significant levels
- Recommended: 15 for most markets
Right Bars (1-25):
- Confirmation period
- Higher: More reliable, less frequent
- Recommended: 5 for balance
Display Limit (1-20):
- Number of active levels shown
- Higher: More context, busier chart
- Recommended: 7 for clarity
Extension Options:
- Short: Levels visible near formation
- Current: Extended to current bar (recommended)
- Max: Extended indefinitely
VOLUME SETTINGS:
MA Length (5-50):
- Shorter: More responsive to spikes
- Longer: Smoother baseline
- Recommended: 20 for balance
Spike Multiplier (1.0-3.0):
- Lower: More sensitive spike detection
- Higher: Only extreme spikes
- Recommended: 1.5 for day trading
MULTI-TIMEFRAME SETTINGS:
HTF 1 (Trend):
- 5m chart: Use 15m or 1H
- 15m chart: Use 1H or 4H
- 1H chart: Use 4H or 1D
HTF 2 (Bias):
- One level higher than HTF 1
- Provides longer-term context
- Don't use same as HTF 1
EMA SETTINGS:
Length:
- 20: Responsive, more signals
- 50: Smoother, stronger filter
- 200: Long-term trend only
Style:
- Choose contrasting color
- Width 1-2 for visibility
- Match your trading style
───────────────────────────────────────
BEST PRACTICES
───────────────────────────────────────
Chart Timeframe Selection:
- ORB Trading: Use 5m or 15m charts
- Session Review: Use 1H or 4H charts
- Swing Trading: Use 1H or 4H charts
Quality Over Quantity:
- Wait for high-quality alerts (volume + MTF)
- Avoid trading every breakout
- Focus on confluence setups
Risk Management:
- Position size based on range width
- Wider ranges = smaller positions
- Use stop losses always
- Take partial profits at targets
Market Conditions:
- Best results in trending markets
- Reduce position size in choppy conditions
- Consider session overlaps for volatility
- Avoid trading near major news if inexperienced
Continuous Improvement:
- Track win rate by session
- Note which confluence factors work best
- Adjust settings based on market volatility
- Review performance weekly
───────────────────────────────────────
PERFORMANCE OPTIMIZATION
───────────────────────────────────────
This indicator is optimized with:
- max_bars_back declarations for efficient processing
- Conditional calculations based on enabled features
- Proper memory management for drawing objects
- Minimal recalculation on each bar
Best Practices:
- Disable unused features (sessions, MTF, volume)
- Limit historical display to reduce rendering
- Use appropriate timeframe for your strategy
- Clear old drawing objects periodically
───────────────────────────────────────
EDUCATIONAL DISCLAIMER
───────────────────────────────────────
This indicator combines established trading concepts:
- Opening Range Breakout theory (price action)
- Liquidity level detection (pivot analysis)
- Session-based trading (time-of-day patterns)
- Volume analysis (confirmation technique)
- Multi-timeframe analysis (trend alignment)
All calculations use standard technical analysis methods:
- Pivot high/low detection algorithms
- Moving averages for trend and volume
- Session time filtering
- Timeframe security functions
The indicator identifies potential trading setups but does not predict future price movements. Success requires proper application within a complete trading strategy including risk management, position sizing, and market context.
───────────────────────────────────────
USAGE DISCLAIMER
───────────────────────────────────────
This tool is for educational and analytical purposes. Opening Range Breakout trading involves substantial risk. The alert system and quality filters are designed to identify potential setups but do not guarantee profitability. Always conduct independent analysis, use proper risk management, and never risk capital you cannot afford to lose. Past performance does not indicate future results. Trading intraday breakouts requires experience and discipline.
───────────────────────────────────────
CREDITS & ATTRIBUTION
───────────────────────────────────────
ORIGINAL SOURCE:
This indicator builds upon concepts from LuxAlgo's-ORB

Smart Money Price Action ProSmart Money Price Action Pro - Smart Money and Price Action Dynamic Toolkit
The Smart Money Price Action Pro is designed to bring together multiple layers of market analysis into a single, cohesive framework, combining trend identification and consolidation detection in an actionable format. While individual indicators can provide useful insights, they often work in isolation. This toolkit integrates market flow detection, range analytics, and adaptive visualization into one system, allowing traders to see the bigger picture without piecing together multiple disconnected tools.
Building on principles from institutional trading behaviors, the toolkit gives traders a clearer picture of where “smart money” may be entering or exiting the market. Its design emphasizes confluence: signals from multiple independent modules overlap to create higher conviction setups, offering a structured edge when planning entries, exits, and risk levels.
At its core, the toolkit addresses the duality of market conditions: trending versus ranging. By offering a combination of trend-following signals and contrarian insights, it helps traders operate with a deeper understanding of market structure. While it provides actionable signals and visual guidance, it is intended as an assistive system, helping traders make more informed decisions rather than serving as a single source of truth.
Key Modules
1. Smart Money Signal Module
The Smart Money Signal Module identifies potential institutional activity by analyzing price swings and momentum shifts. Using configurable swing detection, it highlights potential reversal or continuation zones, expressed as adaptive zones around key market levels.
Signals are augmented with trend-colored candle overlays, offering immediate guidance on market bias. Bullish and bearish zones are clearly marked, while continuation and reversal markers help distinguish between trend shifts and market noise.
At its core, the engine applies swing detection combined with a sensitivity filter to track directional momentum across recent bars. This allows it to pinpoint bullish pivots (where downside momentum fades and strength returns) and bearish pivots (where upside momentum collapses). Once a pivot is confirmed, the system draws flow lines that map the breakout and classify it as either continuation or reversal, depending on broader market bias.
Momentum zones are then plotted to show areas where buyers stepped in with strength or sellers forced price lower. These levels extend forward dynamically, shifting in real time as new data forms. Zones change color the moment they break, visually confirming whether market structure has held or failed. Gradient shading highlights periods of extreme pressure, giving traders a clear visual of when momentum surges into overbought or oversold territory.
Instead of simply showing trend direction, this module also maps accumulation and distribution zones tied to institutional flows. When combined with the Range Module, these zones become more meaningful — for example, when institutional accumulation aligns with a breakout from consolidation.
Practical Use: Traders can use these signals to align trades with institutional flows. For example, entering a long position near a bullish accumulation zone or managing risk when bearish distribution areas form. By combining these insights with higher timeframe analysis, traders can filter out false signals and improve decision-making.
2. Range Detection Module
The Range Detection engine continuously monitors price action to flag when markets transition into consolidation phases. Ranges are defined not just by flat price action, but by a measurable contraction in volatility, repeated touches of boundary levels, and the clustering of traded volume around a central equilibrium point.
Once a valid range is identified, the system assigns a compression strength score (0–100). This score reflects how cleanly defined and structurally sound the consolidation is—higher scores indicate tighter boundaries and stronger evidence of accumulation or distribution.
Breakout tendencies are modeled dynamically. The system updates a forward-looking bias by incorporating:
Boundary time distribution – how often price presses against upper vs. lower edges
Historical breakout patterns – probability benchmarks derived from structurally similar ranges
Volume skew – whether traded volume leans toward buyers or sellers inside the range
Momentum alignment – auxiliary filters such as slope-based oscillators that indicate when energy is building for a directional move
The result is a live breakout forecast that evolves bar by bar as the range matures. Each active range carries a visual strength meter plotted above the consolidation zone, quantifying both compression and breakout potential in real time.
The module also supports range memory, preserving completed consolidations even after a breakout. This allows traders to review the prior structure for post-analysis or to track whether price respects the boundaries of the old range as support or resistance going forward.
Practical Use : Traders can use these ranges to anticipate breakout direction or step aside when conditions are unclear. A tight consolidation near a bullish zone, for instance, often signals a potential long opportunity, while overlapping bearish flows warn of false breakouts.
Integrated Workflow
The strength of the toolkit lies in its synergy. Each module is effective on its own, but the real advantage comes when their signals align.
A typical workflow may include:
Assessing the market trend using the Smart Money Signal Module and its trend-colored overlays
Identifying consolidation and breakout zones with the Range Detection Module
Watching for confluences: institutional accumulation aligning with range compression, or dashboard bias matching local setups
Executing trades with structured confidence, using these layered confirmations rather than relying on a single trigger
This integrated workflow streamlines decision-making and avoids the conflicting signals that can occur when combining unrelated indicators.
Additional Features
Adaptive Visualization : Dynamic zones and trend overlays adjust to volatility, keeping charts clear and focused
Analytics Dashboard : A compact summary panel shows active zones, bullish vs bearish flow counts, and current bias, giving context at a glance
Instead of simply adding more signals, the dashboard provides a meta-layer of analysis — context, bias, and flow strength — helping traders manage risk and stay aligned with broader market conditions.
Use Cases
Trend Confluence : Entering trades in line with prevailing smart money flows while filtering out counter-trend setups
Breakout Trading : Using the Range Detection Module to anticipate breakout zones and confirming direction with institutional flow signals
Contrarian Reversal Trades : Targeting accumulation/distribution zones where both modules indicate potential reversals
Each use case demonstrates how layered confluence creates clarity and conviction, making the toolkit a strong complement to other forms of technical analysis.
Conclusion
The Smart Money Signals Toolkit simplifies complex market analysis into actionable, visually intuitive insights. While standalone indicators provide value, this toolkit goes further by combining smart money flows, range detection, adaptive zones, and dashboard analytics into one cohesive system.
It doesn’t just generate buy/sell markers — it shows why a setup matters, where it is occurring, and how it aligns with broader conditions. This allows traders to operate with greater clarity, structure, and discipline.
Risk Disclaimer : This toolkit and its features are for educational and informational purposes only. Past performance does not guarantee future results. All suggested use cases are theoretical and should be applied with proper risk management.

10 Monday's 1H Avg Range + 30-Day Daily RangeWhat This Script Does
This indicator is designed for traders who want to monitor volatility and range behavior at the start of the trading week . It focuses specifically on the first four 15-minute candles of each Monday and tracks their combined high-low range over time.
How It Works
Monday 1H Range Detection:
Each week, it automatically detects and highlights the first 4 candles of Monday on a 15-minute chart (1 hour total). It calculates the range between the highest high and lowest low of these candles.
10-Week Average of Monday 1H Ranges:
It stores and averages the last 10 such ranges, displaying this average in a table for weekly comparison.
30-Day Daily Range Average:
Separately, it calculates the average daily range (high – low) of the last 30 daily candles. This value helps put the Monday 1H range into broader context and can guide Stop Loss or TP planning.
Dynamic Labeling & Visual Highlights:
The script visually highlights the first 4 candles of Monday and places a label showing the pip range once the 4 candles have completed. It also updates a small table with the two averages described above.
How to Use It
Use it on the 15-minute timeframe to activate the Monday 1H logic.
Compare the current week’s Monday range to the 10-week average to see if volatility is increasing or decreasing.
Use the 30-day daily range to determine if the Monday opening movement is unusually large or small.
Consider adjusting trade entries, stops, or targets if the Monday range is disproportionately large compared to recent historical behavior.
What Makes It Original?
This is not a typical volatility indicator like ATR or standard deviation. Instead, it’s a purpose-built tool combining:
Time-specific behavior (first hour of the week),
Historical contextualization (10-week average tracking),
A dual-timeframe analysis (15-min + daily),
A user-friendly table and visual interface.
This script helps intraday or swing traders spot abnormal volatility early in the week and adjust their strategies accordingly—especially in fast-moving Forex or Index markets.
