Renko Emulator Strategy # 🚀 Renko Emulator Strategy for Normal Candlestick Charts
Transform your trading with this advanced Renko-based strategy that works seamlessly on normal candlestick charts!
## ✨ What Makes This Special?
### 🎯 Smart Signal System
- **One Signal at a Time**: No confusing duplicate signals
- **Position State Tracking**: Always know your current position
- **Automatic Target Detection**: T1, T2, T3 calculated automatically
- **10 Comprehensive Alerts**: Never miss an opportunity
### 🔧 Technical Excellence
- **Renko Logic**: Filters market noise using brick formations
- **ATR-Based Sizing**: Adapts to market volatility
- **Multi-Indicator Confirmation**: EMA, RSI, MACD, Supertrend
- **Volume Validation**: Only high-probability setups
## 📊 How It Works
### Entry Signals
🟢 **LONG (BUY)**
- Reversal: Red bricks → First green brick
- Trend: 3+ consecutive green bricks
- With full technical confirmation
🔴 **SHORT (SELL)**
- Reversal: Green bricks → First red brick
- Trend: 3+ consecutive red bricks
- With full technical confirmation
### Position Management
📍 **Stop Loss**: Last opposite brick ± buffer
🎯 **Target 1**: 2× Brick size → Book 50%
🎯 **Target 2**: 3× Brick size → Book 30%
🎯 **Target 3**: 4× Brick size → Book 20%
### Exit Rules
⚠️ Opposite brick formation
⚠️ RSI extremes (>80 or <20)
⚠️ Manual exit as needed
## 🎨 Visual Features
### On Your Chart
- 📊 Renko brick overlays
- 🟢 Green triangles = BUY signals
- 🔴 Red triangles = SELL signals
- ⚪ Target hit markers (T1, T2, T3)
- 📈 Trend indicators overlay
- 🎨 Position background color
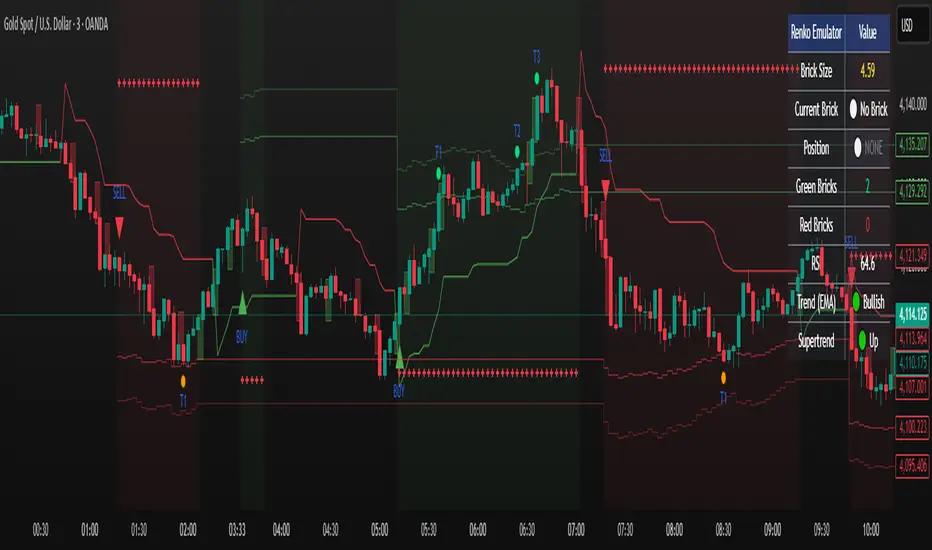
### Info Panel
Real-time dashboard showing:
- Current brick size & color
- Position status (LONG/SHORT/NONE)
- Consecutive brick count
- RSI level
- Trend direction
- Market conditions
## 🔔 Complete Alert System
**10 Alerts Available:**
✅ Long & Short Entry
✅ All 6 Target Hits (T1, T2, T3 each)
✅ Long & Short Exit
**Alert Messages Include:**
- Entry price & direction
- Profit booking instructions
- Risk management tips
- Next action guidance
## 💰 Best Instruments
### Highly Effective On:
- **Indian Markets**: Nifty 50, Bank Nifty
- **Stocks**: HDFC, Reliance, TCS, Infosys
- **Forex**: EUR/USD, GBP/USD, USD/JPY
- **Crypto**: BTC, ETH, major altcoins
- **Commodities**: Gold, Silver, Crude Oil
### Recommended Timeframes:
- **Day Trading**: 5-min, 15-min
- **Swing Trading**: 1-hour, 4-hour
- **Position Trading**: Daily
## ⚙️ Customizable Settings
### Brick Configuration
- ATR-based (automatic) or Fixed points
- Adjustable ATR period & multiplier
- Visual brick display on/off
### Indicator Parameters
- EMA length (default: 20)
- RSI period (default: 14)
- MACD settings (12, 26, 9)
- Supertrend (10, 3)
- Volume filter toggle
### Display Options
- Show/hide entry signals
- Show/hide target levels
- Show/hide info table
- Brick overlay transparency
## 📈 Usage Strategy
### For Beginners:
1. Add to chart with default settings
2. Wait for clear BUY/SELL arrows
3. Follow position management rules
4. Use recommended stop losses
5. Book profits at targets
### For Advanced Traders:
1. Optimize brick size per instrument
2. Fine-tune indicator parameters
3. Combine with your strategy
4. Backtest thoroughly
5. Scale position sizes
## ⚠️ Risk Management
### Built-in Protection:
- Maximum 2% risk per trade
- Clear stop loss levels
- Defined profit targets
- Position size calculator
- Daily loss limits
### Best Practices:
✅ Test on demo first
✅ Use proper position sizing
✅ Follow stop losses strictly
✅ Don't over-trade
✅ Maintain trading journal
## 🎓 What You Get
### Immediate Benefits:
- Clear entry/exit signals
- No analysis paralysis
- Reduced emotional trading
- Systematic approach
- Professional risk management
### Learning Opportunities:
- Understand Renko concepts
- Master position management
- Learn risk control
- Develop discipline
- Build consistent strategy
## 🐛 Troubleshooting
### No Signals?
- Check indicator settings
- Verify brick size not too large
- Ensure volume filter appropriate
- Try different timeframe
### Too Many Signals?
- Increase brick size
- Use higher timeframe
- Enable stricter filters
- Check signal filtering active
## 📊 Performance Notes
### Works Best In:
✅ Trending markets
✅ Clear directional moves
✅ Good liquidity
✅ Normal volatility
### Avoid Trading:
❌ Major news events
❌ Low volume periods
❌ Extreme volatility
❌ Choppy/sideways markets
## 🔄 Updates & Support
**Current Version**: 2.0
**Recent Updates:**
- ✅ Fixed duplicate signals
- ✅ Added position tracking
- ✅ Enhanced alert system
- ✅ Improved visual feedback
- ✅ Better target detection
**Future Plans:**
- Additional customization
- More alert options
- Advanced features
- Performance improvements
## 📜 Important Disclaimer
⚠️ **Please Read Carefully:**
This indicator is for **educational purposes only**. Trading involves substantial risk of loss. Past performance does not guarantee future results.
**You Must:**
- Use proper risk management
- Test strategies before live trading
- Never risk more than you can afford to lose
- Consult financial advisor if needed
- Understand your trading instrument
**The creator assumes no responsibility for trading losses incurred using this indicator.**
## 🙏 Credits
- Renko Concept: Traditional Japanese charting
- ATR Calculation: J. Welles Wilder
- Community Feedback: Beta testers & users
---
## 💬 Feedback Welcome!
If you find this helpful:
- ⭐ Like the indicator
- 💬 Share your feedback
- 🐛 Report bugs
- 💡 Suggest improvements
- 🔄 Share with traders
## 📞 Getting Started
1. **Add to Chart**: Click "Add to Chart"
2. **Configure Settings**: Adjust as needed
3. **Set Alerts**: Enable notifications
4. **Test First**: Use demo account
5. **Go Live**: Start small, scale up
---
**Happy Trading! 📈🚀**
**Trade Smart. Trade Safe. Trade Profitable.**
---
*Remember: Discipline + Risk Management + Good Strategy = Success*
*No indicator is perfect. Use as part of complete trading plan.*
"profitable" için komut dosyalarını ara
J.P. Morgan Efficiente 5 IndexJ.P. MORGAN EFFICIENTE 5 INDEX REPLICATION
Walk into any retail trading forum and you'll find the same scene playing out thousands of times a day: traders huddled over their screens, drawing trendlines on candlestick charts, hunting for the perfect entry signal, convinced that the next RSI crossover will unlock the path to financial freedom. Meanwhile, in the towers of lower Manhattan and the City of London, portfolio managers are doing something entirely different. They're not drawing lines. They're not hunting patterns. They're building fortresses of diversification, wielding mathematical frameworks that have survived decades of market chaos, and most importantly, they're thinking in portfolios while retail thinks in positions.
This divide is not just philosophical. It's structural, mathematical, and ultimately, profitable. The uncomfortable truth that retail traders must confront is this: while you're obsessing over whether the 50-day moving average will cross the 200-day, institutional investors are solving quadratic optimization problems across thirteen asset classes, rebalancing monthly according to Markowitz's Nobel Prize-winning framework, and targeting precise volatility levels that allow them to sleep at night regardless of what the VIX does tomorrow. The game you're playing and the game they're playing share the same field, but the rules are entirely different.
The question, then, is not whether retail traders can access institutional strategies. The question is whether they're willing to fundamentally change how they think about markets. Are you ready to stop painting lines and start building portfolios?
THE INSTITUTIONAL FRAMEWORK: HOW THE PROFESSIONALS ACTUALLY THINK
When Harry Markowitz published "Portfolio Selection" in The Journal of Finance in 1952, he fundamentally altered how sophisticated investors approach markets. His insight was deceptively simple: returns alone mean nothing. Risk-adjusted returns mean everything. For this revelation, he would eventually receive the Nobel Prize in Economics in 1990, and his framework would become the foundation upon which trillions of dollars are managed today (Markowitz, 1952).
Modern Portfolio Theory, as it came to be known, introduced a revolutionary concept: through diversification across imperfectly correlated assets, an investor could reduce portfolio risk without sacrificing expected returns. This wasn't about finding the single best asset. It was about constructing the optimal combination of assets. The mathematics are elegant in their logic: if two assets don't move in perfect lockstep, combining them creates a portfolio whose volatility is lower than the weighted average of the individual volatilities. This "free lunch" of diversification became the bedrock of institutional investment management (Elton et al., 2014).
But here's where retail traders miss the point entirely: this isn't about having ten different stocks instead of one. It's about systematic, mathematically rigorous allocation across asset classes with fundamentally different risk drivers. When equity markets crash, high-quality government bonds often rally. When inflation surges, commodities may provide protection even as stocks and bonds both suffer. When emerging markets are in vogue, developed markets may lag. The professional investor doesn't predict which scenario will unfold. Instead, they position for all of them simultaneously, with weights determined not by gut feeling but by quantitative optimization.
This is what J.P. Morgan Asset Management embedded into their Efficiente Index series. These are not actively managed funds where a portfolio manager makes discretionary calls. They are rules-based, systematic strategies that execute the Markowitz framework in real-time, rebalancing monthly to maintain optimal risk-adjusted positioning across global equities, fixed income, commodities, and defensive assets (J.P. Morgan Asset Management, 2016).
THE EFFICIENTE 5 STRATEGY: DECONSTRUCTING INSTITUTIONAL METHODOLOGY
The Efficiente 5 Index, specifically, targets a 5% annualized volatility. Let that sink in for a moment. While retail traders routinely accept 20%, 30%, or even 50% annual volatility in pursuit of returns, institutional allocators have determined that 5% volatility provides an optimal balance between growth potential and capital preservation. This isn't timidity. It's mathematics. At higher volatility levels, the compounding drag from large drawdowns becomes mathematically punishing. A 50% loss requires a 100% gain just to break even. The institutional solution: constrain volatility at the portfolio level, allowing the power of compounding to work unimpeded (Damodaran, 2008).
The strategy operates across thirteen exchange-traded funds spanning five distinct asset classes: developed equity markets (SPY, IWM, EFA), fixed income across the risk spectrum (TLT, LQD, HYG), emerging markets (EEM, EMB), alternatives (IYR, GSG, GLD), and defensive positioning (TIP, BIL). These aren't arbitrary choices. Each ETF represents a distinct factor exposure, and together they provide access to the primary drivers of global asset returns (Fama and French, 1993).
The methodology, as detailed in replication research by Jungle Rock (2025), follows a precise monthly cadence. At the end of each month, the strategy recalculates expected returns and volatilities for all thirteen assets using a 126-day rolling window. This six-month lookback balances responsiveness to changing market conditions against the noise of short-term fluctuations. The optimization engine then solves for the portfolio weights that maximize expected return subject to the 5% volatility target, with additional constraints to prevent excessive concentration.
These constraints are critical and reveal institutional wisdom that retail traders typically ignore. No single ETF can exceed 20% of the portfolio, except for TIP and BIL which can reach 50% given their defensive nature. At the asset class level, developed equities are capped at 50%, bonds at 50%, emerging markets at 25%, and alternatives at 25%. These aren't arbitrary limits. They're guardrails preventing the optimization from becoming too aggressive during periods when recent performance might suggest concentrating heavily in a single area that's been hot (Jorion, 1992).
After optimization, there's one final step that appears almost trivial but carries profound implications: weights are rounded to the nearest 5%. In a world of fractional shares and algorithmic execution, why round to 5%? The answer reveals institutional practicality over mathematical purity. A portfolio weight of 13.7% and 15.0% are functionally similar in their risk contribution, but the latter is vastly easier to communicate, to monitor, and to execute at scale. When you're managing billions, parsimony matters.
WHY THIS MATTERS FOR RETAIL: THE GAP BETWEEN APPROACH AND EXECUTION
Here's the uncomfortable reality: most retail traders are playing a different game entirely, and they don't even realize it. When a retail trader says "I'm bullish on tech," they buy QQQ and that's their entire technology exposure. When they say "I need some diversification," they buy ten different stocks, often in correlated sectors. This isn't diversification in the Markowitzian sense. It's concentration with extra steps.
The institutional approach represented by the Efficiente 5 is fundamentally different in several ways. First, it's systematic. Emotions don't drive the allocation. The mathematics do. When equities have rallied hard and now represent 55% of the portfolio despite a 50% cap, the system sells equities and buys bonds or alternatives, regardless of how bullish the headlines feel. This forced contrarianism is what retail traders know they should do but rarely execute (Kahneman and Tversky, 1979).
Second, it's forward-looking in its inputs but backward-looking in its process. The strategy doesn't try to predict the next crisis or the next boom. It simply measures what volatility and returns have been recently, assumes the immediate future resembles the immediate past more than it resembles some forecast, and positions accordingly. This humility regarding prediction is perhaps the most institutional characteristic of all.
Third, and most critically, it treats the portfolio as a single organism. Retail traders typically view their holdings as separate positions, each requiring individual management. The institutional approach recognizes that what matters is not whether Position A made money, but whether the portfolio as a whole achieved its risk-adjusted return target. A position can lose money and still be a valuable contributor if it reduced portfolio volatility or provided diversification during stress periods.
THE MATHEMATICAL FOUNDATION: MEAN-VARIANCE OPTIMIZATION IN PRACTICE
At its core, the Efficiente 5 strategy solves a constrained optimization problem each month. In technical terms, this is a quadratic programming problem: maximize expected portfolio return subject to a volatility constraint and position limits. The objective function is straightforward: maximize the weighted sum of expected returns. The constraint is that the weighted sum of variances and covariances must not exceed the volatility target squared (Markowitz, 1959).
The challenge, and this is crucial for understanding the Pine Script implementation, is that solving this problem properly requires calculating a covariance matrix. This 13x13 matrix captures not just the volatility of each asset but the correlation between every pair of assets. Two assets might each have 15% volatility, but if they're negatively correlated, combining them reduces portfolio risk. If they're positively correlated, it doesn't. The covariance matrix encodes these relationships.
True mean-variance optimization requires matrix algebra and quadratic programming solvers. Pine Script, by design, lacks these capabilities. The language doesn't support matrix operations, and certainly doesn't include a QP solver. This creates a fundamental challenge: how do you implement an institutional strategy in a language not designed for institutional mathematics?
The solution implemented here uses a pragmatic approximation. Instead of solving the full covariance problem, the indicator calculates a Sharpe-like ratio for each asset (return divided by volatility) and uses these ratios to determine initial weights. It then applies the individual and asset-class constraints, renormalizes, and produces the final portfolio. This isn't mathematically equivalent to true mean-variance optimization, but it captures the essential spirit: weight assets according to their risk-adjusted return potential, subject to diversification constraints.
For retail implementation, this approximation is likely sufficient. The difference between a theoretically optimal portfolio and a very good approximation is typically modest, and the discipline of systematic rebalancing across asset classes matters far more than the precise weights. Perfect is the enemy of good, and a good approximation executed consistently will outperform a perfect solution that never gets implemented (Arnott et al., 2013).
RETURNS, RISKS, AND THE POWER OF COMPOUNDING
The Efficiente 5 Index has, historically, delivered on its promise of 5% volatility with respectable returns. While past performance never guarantees future results, the framework reveals why low-volatility strategies can be surprisingly powerful. Consider two portfolios: Portfolio A averages 12% returns with 20% volatility, while Portfolio B averages 8% returns with 5% volatility. Which performs better over time?
The arithmetic return favors Portfolio A, but compound returns tell a different story. Portfolio A will experience occasional 20-30% drawdowns. Portfolio B rarely draws down more than 10%. Over a twenty-year horizon, the geometric return (what you actually experience) for Portfolio B may match or exceed Portfolio A, simply because it never gives back massive gains. This is the power of volatility management that retail traders chronically underestimate (Bernstein, 1996).
Moreover, low volatility enables behavioral advantages. When your portfolio draws down 35%, as it might with a high-volatility approach, the psychological pressure to sell at the worst possible time becomes overwhelming. When your maximum drawdown is 12%, as might occur with the Efficiente 5 approach, staying the course is far easier. Behavioral finance research has consistently shown that investor returns lag fund returns primarily due to poor timing decisions driven by emotional responses to volatility (Dalbar, 2020).
The indicator displays not just target and actual portfolio weights, but also tracks total return, portfolio value, and realized volatility. This isn't just data. It's feedback. Retail traders can see, in real-time, whether their actual portfolio volatility matches their target, whether their risk-adjusted returns are improving, and whether their allocation discipline is holding. This transparency transforms abstract concepts into concrete metrics.
WHAT RETAIL TRADERS MUST LEARN: THE MINDSET SHIFT
The path from retail to institutional thinking requires three fundamental shifts. First, stop thinking in positions and start thinking in portfolios. Your question should never be "Should I buy this stock?" but rather "How does this position change my portfolio's expected return and volatility?" If you can't answer that question quantitatively, you're not ready to make the trade.
Second, embrace systematic rebalancing even when it feels wrong. Perhaps especially when it feels wrong. The Efficiente 5 strategy rebalances monthly regardless of market conditions. If equities have surged and now exceed their target weight, the strategy sells equities and buys bonds or alternatives. Every retail trader knows this is what you "should" do, but almost none actually do it. The institutional edge isn't in having better information. It's in having better discipline (Swensen, 2009).
Third, accept that volatility is not your friend. The retail mythology that "higher risk equals higher returns" is true on average across assets, but it's not true for implementation. A 15% return with 30% volatility will compound more slowly than a 12% return with 10% volatility due to the mathematics of return distributions. Institutions figured this out decades ago. Retail is still learning.
The Efficiente 5 replication indicator provides a bridge. It won't solve the problem of prediction no indicator can. But it solves the problem of allocation, which is arguably more important. By implementing institutional methodology in an accessible format, it allows retail traders to see what professional portfolio construction actually looks like, not in theory but in executable code. The the colorful lines that retail traders love to draw, don't disappear. They simply become less central to the process. The portfolio becomes central instead.
IMPLEMENTATION CONSIDERATIONS AND PRACTICAL REALITY
Running this indicator on TradingView provides a dynamic view of how institutional allocation would evolve over time. The labels on each asset class line show current weights, updated continuously as prices change and rebalancing occurs. The dashboard displays the full allocation across all thirteen ETFs, showing both target weights (what the optimization suggests) and actual weights (what the portfolio currently holds after price movements).
Several key insights emerge from watching this process unfold. First, the strategy is not static. Weights change monthly as the optimization recalibrates to recent volatility and returns. What worked last month may not be optimal this month. Second, the strategy is not market-timing. It doesn't try to predict whether stocks will rise or fall. It simply measures recent behavior and positions accordingly. If volatility has risen, the strategy shifts toward defensive assets. If correlations have changed, the diversification benefits adjust.
Third, and perhaps most importantly for retail traders, the strategy demonstrates that sophistication and complexity are not synonyms. The Efficiente 5 methodology is sophisticated in its framework but simple in its execution. There are no exotic derivatives, no complex market-timing rules, no predictions of future scenarios. Just systematic optimization, monthly rebalancing, and discipline. This simplicity is a feature, not a bug.
The indicator also highlights limitations that retail traders must understand. The Pine Script implementation uses an approximation of true mean-variance optimization, as discussed earlier. Transaction costs are not modeled. Slippage is ignored. Tax implications are not considered. These simplifications mean the indicator is educational and analytical, not a fully operational trading system. For actual implementation, traders would need to account for these real-world factors.
Moreover, the strategy requires access to all thirteen ETFs and sufficient capital to hold meaningful positions in each. With 5% as the rounding increment, practical implementation probably requires at least $10,000 to avoid having positions that are too small to matter. The strategy is also explicitly designed for a 5% volatility target, which may be too conservative for younger investors with long time horizons or too aggressive for retirees living off their portfolio. The framework is adaptable, but adaptation requires understanding the trade-offs.
CAN RETAIL TRULY COMPETE WITH INSTITUTIONS?
The honest answer is nuanced. Retail traders will never have the same resources as institutions. They won't have Bloomberg terminals, proprietary research, or armies of analysts. But in portfolio construction, the resource gap matters less than the mindset gap. The mathematics of Markowitz are available to everyone. ETFs provide liquid, low-cost access to institutional-quality building blocks. Computing power is essentially free. The barriers are not technological or financial. They're conceptual.
If a retail trader understands why portfolios matter more than positions, why systematic discipline beats discretionary emotion, and why volatility management enables compounding, they can build portfolios that rival institutional allocation in their elegance and effectiveness. Not in their scale, not in their execution costs, but in their conceptual soundness. The Efficiente 5 framework proves this is possible.
What retail traders must recognize is that competing with institutions doesn't mean day-trading better than their algorithms. It means portfolio-building better than their average client. And that's achievable because most institutional clients, despite having access to the best managers, still make emotional decisions, chase performance, and abandon strategies at the worst possible times. The retail edge isn't in outsmarting professionals. It's in out-disciplining amateurs who happen to have more money.
The J.P. Morgan Efficiente 5 Index Replication indicator serves as both a tool and a teacher. As a tool, it provides a systematic framework for multi-asset allocation based on proven institutional methodology. As a teacher, it demonstrates daily what portfolio thinking actually looks like in practice. The colorful lines remain on the chart, but they're no longer the focus. The portfolio is the focus. The risk-adjusted return is the focus. The systematic discipline is the focus.
Stop painting lines. Start building portfolios. The institutions have been doing it for seventy years. It's time retail caught up.
REFERENCES
Arnott, R. D., Hsu, J., & Moore, P. (2013). Fundamental Indexation. Financial Analysts Journal, 61(2), 83-99.
Bernstein, W. J. (1996). The Intelligent Asset Allocator. New York: McGraw-Hill.
Dalbar, Inc. (2020). Quantitative Analysis of Investor Behavior. Boston: Dalbar.
Damodaran, A. (2008). Strategic Risk Taking: A Framework for Risk Management. Upper Saddle River: Pearson Education.
Elton, E. J., Gruber, M. J., Brown, S. J., & Goetzmann, W. N. (2014). Modern Portfolio Theory and Investment Analysis (9th ed.). Hoboken: John Wiley & Sons.
Fama, E. F., & French, K. R. (1993). Common risk factors in the returns on stocks and bonds. Journal of Financial Economics, 33(1), 3-56.
Jorion, P. (1992). Portfolio optimization in practice. Financial Analysts Journal, 48(1), 68-74.
J.P. Morgan Asset Management. (2016). Guide to the Markets. New York: J.P. Morgan.
Jungle Rock. (2025). Institutional Asset Allocation meets the Efficient Frontier: Replicating the JPMorgan Efficiente 5 Strategy. Working Paper.
Kahneman, D., & Tversky, A. (1979). Prospect Theory: An Analysis of Decision under Risk. Econometrica, 47(2), 263-291.
Markowitz, H. (1952). Portfolio Selection. The Journal of Finance, 7(1), 77-91.
Markowitz, H. (1959). Portfolio Selection: Efficient Diversification of Investments. New York: John Wiley & Sons.
Swensen, D. F. (2009). Pioneering Portfolio Management: An Unconventional Approach to Institutional Investment. New York: Free Press.

Intrinsic Value AnalyzerThe Intrinsic Value Analyzer is an all-in-one valuation tool that automatically calculates the fair value of a stock using industry-standard valuation techniques. It estimates intrinsic value through Discounted Cash Flow (DCF), Enterprise Value to Revenue (EV/REV), Enterprise Value to EBITDA (EV/EBITDA), and Price to Earnings (P/EPS). The model features adjustable parameters and a built-in alert system that notifies investors in real time when valuation multiples reach predefined thresholds. It also includes a comprehensive, color-coded table that compares the company’s historical average growth rates, valuation multiples, and financial ratios with the most recent values, helping investors quickly assess how current values align with historical averages.
The model calculates the historical Compounded Annual Growth Rates (CAGR) and average valuation multiples over the selected Lookback Period. It then projects Revenue, Earnings Before Interest, Taxes, Depreciation, and Amortization (EBITDA), Earnings per Share (EPS), and Free Cash Flow (FCF) for the selected Forecast Period and discounts their future values back to the present using the Weighted Average Cost of Capital (WACC) or the Cost of Equity. By default, the model automatically applies the historical averages displayed in the table as the growth forecasts and target multiples. These assumptions can be modified in the menu by entering custom REV-G, EBITDA-G, EPS-G, and FCF-G growth forecasts, as well as EV/REV, EV/EBITDA, and P/EPS target multiples. When new input values are entered, the model recalculates the fair value in real time, allowing users to see how changes in these assumptions affect the company’s fair value.
DCF = (Sum of (FCF × (1 + FCF-G) ^ t ÷ (1 + WACC) ^ t) for each year t until Forecast Period + ((FCF × (1 + FCF-G) ^ Forecast Period × (1 + LT Growth)) ÷ ((WACC - LT Growth) × (1 + WACC) ^ Forecast Period)) + Cash - Debt - Preferred Equity - Minority Interest) ÷ Shares Outstanding
EV/REV = ((Revenue × (1 + REV-G) ^ Forecast Period × EV/REV Target) ÷ (1 + WACC) ^ Forecast Period + Cash - Debt - Preferred Equity - Minority Interest) ÷ Shares Outstanding
EV/EBITDA = ((EBITDA × (1 + EBITDA-G) ^ Forecast Period × EV/EBITDA Target) ÷ (1 + WACC) ^ Forecast Period + Cash - Debt - Preferred Equity - Minority Interest) ÷ Shares Outstanding
P/EPS = (EPS × (1 + EPS-G) ^ Forecast Period × P/EPS Target) ÷ (1 + Cost of Equity) ^ Forecast Period
The discounted one-year average analyst price target (1Y PT) is also displayed alongside the valuation labels to provide an overview of consensus estimates. For the DCF model, the terminal long-term FCF growth rate (LT Growth) is based on the selected country to reflect expected long-term nominal GDP growth and can be modified in the menu. For metrics involving FCF, users can choose between reported FCF, calculated as Cash From Operations (CFO) - Capital Expenditures (CAPEX), or standardized FCF, calculated as Earnings Before Interest and Taxes (EBIT) × (1 - Average Tax Rate) + Depreciation and Amortization - Change in Net Working Capital - CAPEX. Historical average values displayed in the left column of the table are based on Fiscal Year (FY) data, while the latest values in the right column use the most recent Trailing Twelve Month (TTM) or Fiscal Quarter (FQ) data. The indicator displays color-coded price labels for each fair value estimate, showing the percentage upside or downside from the current price. Green indicates undervaluation, while red indicates overvaluation. The table follows a separate color logic:
REV-G, EBITDA-G, EPS-G, FCF-G = Green indicates positive annual growth when the CAGR is positive. Red indicates negative annual growth when the CAGR is negative.
EV/REV = Green indicates undervaluation when EV/REV ÷ REV-G is below 1. Red indicates overvaluation when EV/REV ÷ REV-G is above 2. Gray indicates fair value.
EV/EBITDA = Green indicates undervaluation when EV/EBITDA ÷ EBITDA-G is below 1. Red indicates overvaluation when EV/EBITDA ÷ EBITDA-G is above 2. Gray indicates fair value.
P/EPS = Green indicates undervaluation when P/EPS ÷ EPS-G is below 1. Red indicates overvaluation when P/EPS ÷ EPS-G is above 2. Gray indicates fair value.
EBITDA% = Green indicates profitable operations when the EBITDA margin is positive. Red indicates unprofitable operations when the EBITDA margin is negative.
FCF% = Green indicates strong cash conversion when FCF/EBITDA > 50%. Red indicates unsustainable FCF when FCF/EBITDA is negative. Gray indicates normal cash conversion.
ROIC = Green indicates value creation when ROIC > WACC. Red indicates value destruction when ROIC is negative. Gray indicates positive but insufficient returns.
ND/EBITDA = Green indicates low leverage when ND/EBITDA is below 1. Red indicates high leverage when ND/EBITDA is above 3. Gray indicates moderate leverage.
YIELD = Green indicates positive shareholder return when Shareholder Yield > 1%. Red indicates negative shareholder return when Shareholder Yield < -1%.
The Return on Invested Capital (ROIC) is calculated as EBIT × (1 - Average Tax Rate) ÷ (Average Debt + Average Equity - Average Cash). Shareholder Yield (YIELD) is calculated as the CAGR of Dividend Yield - Change in Shares Outstanding. The Weighted Average Cost of Capital (WACC) is displayed at the top left of the table and is derived from the current Market Cap (MC), Debt, Cost of Equity, and Cost of Debt. The Cost of Equity is calculated using the Equity Beta, Index Return, and Risk-Free Rate, which are based on the selected country. The Equity Beta (β) is calculated as the 5-year Blume-adjusted beta between the weekly logarithmic returns of the underlying stock and the selected country’s stock market index. For accurate calculations, it is recommended to use the stock ticker listed on the primary exchange corresponding to the company’s main index.
Cost of Debt = (Interest Expense on Debt ÷ Average Debt) × (1 - Average Tax Rate)
Cost of Equity = Risk-Free Rate + Equity Beta (β) × (Index Return - Risk-Free Rate)
WACC = (MC ÷ (MC + Debt)) × Cost of Equity + (Debt ÷ (MC + Debt)) × Cost of Debt
This indicator works best for operationally stable and profitable companies that are primarily valued based on fundamentals rather than speculative growth, such as those in the industrial, consumer, technology, and healthcare sectors. It is less suitable for early-stage, unprofitable, or highly cyclical companies, including energy, real estate, and financial institutions, as these often have irregular cash flows or distorted balance sheets. It is also worth noting that TradingView’s financial data provider, FactSet, standardizes financial data from official company filings to align with a consistent accounting framework. While this improves comparability across companies, industries, and countries, it may also result in differences from officially reported figures.
In summary, the Intrinsic Value Analyzer is a comprehensive valuation tool designed to help long-term investors estimate a company’s fair value while comparing historical averages with the latest values. Fair value estimates are driven by growth forecasts, target multiples, and discount rates, and should always be interpreted within the context of the underlying assumptions. By default, the model applies historical averages and current discount rates, which may not accurately reflect future conditions. Investors are therefore encouraged to adjust inputs in the menu to better understand how changes in these key assumptions influence the company’s fair value.

Livermore's Pyramiding Trading - 3Commas [SwissAlgo]
📊 J. LIVERMORE'S PYRAMIDING TRADING - 3Commas Integrated
A Trading Approach Inspired by Jesse Livermore's Position Building Principles
━━━━━━━━━━━━━━━━━━━━━━━━━━━━━━━━━━━━━━━━━━━
DISCLAIMER
This indicator is an educational tool based on historical trading principles. Past performance is not indicative of future results. Trading involves substantial risk of loss. Only trade with capital you can afford to lose. You are responsible for all trading decisions.
━━━━━━━━━━━━━━━━━━━━━━━━━━━━━━━━━━━━━━━━━━━
📚 WHO WAS JESSE LIVERMORE?
Jesse Livermore (1877-1940) was one of the greatest traders in history.
His core insight: "Most traders do everything backward."
♦ "They deploy all capital at once" → Livermore entered with a small fraction of his capital (he started with a 'test position' to validate his trade idea and waited for market confirmation to deploy more, building positions in steps = "pyramiding")
♦ "They average down" (DCA) → Livermore added to trades showing good results only, and never to losing trades, as the trend kept aligning with his trade idea
♦ "They use arbitrary % stops" → Livermore exited when structure appeared broken (he trailed his stop loss to try to protect unrealized profit - if any)
♦ "They take profits too early or set arbitrary TP%" → Livermore let trades showing positive results run until proven wrong (trial take profit)
💬 "I always made money when I was sure I was right before I began. What beat me was not having enough brains to stick to my own game."
— Jesse Livermore
This indicator tries to translate his principles into a SYSTEMATIC FRAMEWORK :
BO = Base Order (first order, base of the pyramid)
PO = Pyramid Orders (additional layers of capital deployed as long as the 'tape' does not invalidate the trade idea)
♦ Test First (BO - 20%) - Small entry to test your idea. If wrong, lose small. If right, can consider pyramiding into strength.
♦ Build Position Size (PO1-3 - 80%) - Add only as trend unfolds favorably (the indicator uses specific Fibonacci levels to track milestones - 0.618, 1.0, 1.272 - and looks for strong confluence among price, volume, trend, momentum, break of resistance/support levels to suggest and trigger actions: entries, exit)
♦ Attempt to Protect Capital - Dynamic stops: the indicator trails the stop loss, to try to protect potential gains from previous steps (if any)
♦ Discipline - Trades fire only when ALL conditions align
━━━━━━━━━━━━━━━━━━━━━━━━━━━━━━━━━━━━━━━━━━━
🎯 INDICATOR FEATURES
You map 3 points on the chart → The indicator generates a systematic trading plan structure based on your wave analysis.
✓ Auto-detects trade direction: Uptrend wave (A➚B➘C) = Long signals | Downtrend wave (A➘B➚C) = Short signals
✓ Entry/exit prices: BO, PO1, PO2, PO3, and dynamic EXIT (trailing stop)
✓ Real-time condition monitoring: Live ✓/✗ checks for each order (price closes + volume + trend + pivot breaks + candle quality + sequence)
✓ Visual trade execution: Green labels mark entries (BO/PO1/PO2/PO3), red labels mark EXIT
✓ Optional 3Commas automation: JSON webhooks for hands-free execution via Signal Bots
⏰ Recommended Timeframes: 1H, 4H, Daily
(Lower timeframes like 15m/5m produce excessive noise and false signals)
💬 "Watch the market leaders, the stocks that have led the charge. That is where the action is and where the money is made."
— Jesse Livermore
━━━━━━━━━━━━━━━━━━━━━━━━━━━━━━━━━━━━━━━━━━━
⚙️ SETUP IN 3 STEPS
🟡 STEP 1: Map Your Wave (Points A → B → C)
Identify a completed wave pattern:
For LONGS:
♦ Point A = Swing low (wave start)
♦ Point B = Swing high (impulse end)
♦ Point C = Pullback low (retrace end - where next wave may begin)
For SHORTS:
♦ Point A = Swing high (wave start)
♦ Point B = Swing low (impulse end)
♦ Point C = Pullback high (retrace end - where next wave may begin)
How to set points:
Settings → Enter dates manually OR drag the vertical lines directly on the chart (easier - just click and drag the pre-mapped A/B/C lines)
Requirements (auto-validated by code):
✓ All dates must be in the past (Point C = completed retrace, not forming)
✓ Clear impulse A→B (minimum 5% move)
✓ Clear retrace B→C (minimum 3% pullback)
───────────────────────────────────────────
🟡 STEP 2: Set Budget & Allocation
Settings → "TRADE PARAMETERS"
♦ Total Budget: $10,000 (example - capital for THIS trade only, not your entire account)
♦ Allocation (must total 100%):
BO = 20% ($2,000) - test position
PO1 = 25% ($2,500) @ Fib 0.618
PO2 = 30% ($3,000) @ Fib 1.0
PO3 = 25% ($2,500) @ Fib 1.272
💬 "It was never my thinking that made big money for me. It was always my sitting. Men who can both be right and sit tight are uncommon."
— Jesse Livermore
───────────────────────────────────────────
🟡 STEP 3: Monitor Your Trade Plan Table
The table (top-right corner) has 4 sections that guide your execution:
BUDGET DEPLOYMENT
♦ Trigger prices for each order (BO auto-calculated at 0.5 Fib between B-C)
♦ Dollar amount per entry
♦ Fibonacci level assigned to each PO
ENTRY/EXIT CONDITIONS
Each column (BO, PO1, PO2, PO3) shows live status (✓ or ✗) for:
♦ Price: 2 consecutive closes (BO) | 3 consecutive closes (POs)
♦ Volume: OBV directional alignment OR volume spike above average
♦ Trend: Normal or Strong Bull/Bear (no entries in Uncertain trend)
♦ Pivot: Nearest resistance (longs) or support (shorts) broken
♦ Clean Candle: Momentum without reversal wicks <30% (POs only)
♦ Sequence: Prior order must have fired first (POs only - no skipping levels)
TRIGGERED?
Shows execution status for each order (✓ = fired, ✗ = waiting)
If using 3Commas: ✓ confirms JSON alert was sent to your bot for real execution
VALIDATIONS
✓ Green = All checks passed, setup is valid
⚠️ Yellow = Warning (e.g., budget doesn't equal 100%, deep retrace)
✗ Red = Error (e.g., dates in wrong order, invalid wave structure)
⚠️ Wait for ALL ✓✓✓✓✓ (or ✓✓✓✓✓✓) to align in a column before that order fires at bar close
💬 "The game of speculation is the most uniformly fascinating game in the world. But it is not a game for the stupid, the mentally lazy, the person of inferior emotional balance, or the get-rich-quick adventurer."
— Jesse Livermore
━━━━━━━━━━━━━━━━━━━━━━━━━━━━━━━━━━━━━━━━━━━
📊 CHART VISUALS - READING THE INDICATOR
Fibonacci Extension Lines
After mapping A-B-C, horizontal lines extend to the right:
♦ Solid green/red lines = Active PO entry levels (0.618, 1.0, 1.272)
♦ Dotted gray lines = Reference Fib levels used for exit tracking (2.0, 2.618, 3.0, etc.)
♦ Labels on right = Show level and price: "Fib 0.618 / $67,324 "
Entry/Exit Price Lines
♦ Thick green line (longs) / red line (shorts) = BO entry price with direction label
♦ Dashed red line = Current EXIT price (your trailing stop loss - appears after BO fires and moves as price extends)
Trade Execution Labels
Visual confirmation when orders fire on the chart:
♦ Green labels (below/above candles) = BO, PO1, PO2, PO3 entries executed
♦ Red label = EXIT triggered (position closed)
Trend Strength Indicator (EMA Line)
The thick colored line shows real-time trend status:
♦ Bright lime = Strong bullish trend
♦ Light green = Normal bullish trend
♦ Bright red = Strong bearish trend
♦ Light red = Normal bearish trend
♦ Gray = Uncertain/weak trend (no entries fire in this state)
Entries require at least Normal trend strength aligned with your trade direction.
💬 "I never argue with the tape. Getting sore at the market doesn't get you anywhere."
— Jesse Livermore
━━━━━━━━━━━━━━━━━━━━━━━━━━━━━━━━━━━━━━━━━━━
🔧 ENTRY LOGIC - TECHNICAL DETAILS
💬 "The big money was never made in the buying or the selling. The big money was made in the waiting."
— Jesse Livermore
───────────────────────────────────────────
🟢 BASE ORDER (BO) - TEST POSITION
BO Price Calculation
Auto-calculated at the 0.5 Fibonacci retracement between Point B and Point C
Formula: (Price B + Price C) / 2
Why this level?
♦ Midpoint between impulse end (B) and retrace end (C)
♦ Breakout above/below suggests retrace may be complete
♦ Designed to help position BO below all Fib extensions (to control sequence issues)
───────────────────────────────────────────
BO Entry Conditions - ALL 5 Must Align:
1️⃣ PRICE: 2 Consecutive Closes Beyond BO
♦ Longs: close > BO AND close > BO
♦ Shorts: close < BO AND close < BO
♦ Why: Designed to confirm breakout commitment and filter fakeouts
2️⃣ TREND: Normal OR Strong Trend Aligned
♦ Detection: 18-period EMA + ADX/DMI + higher timeframe slope
♦ States: Strong Bull/Bear (ADX>30), Normal Bull/Bear (price vs EMA), Uncertain
♦ Confirmation: Requires 3 consecutive bars in the same state (to reduce flip-flop)
♦ BO accepts: Normal OR Strong (you're testing early, basic alignment sufficient)
3️⃣ PIVOT: Nearest Resistance/Support Broken
♦ Storage: 60 most recent pivot highs/lows (dynamic lookback per timeframe)
♦ Longs: Nearest pivot HIGH above BO → must break with 2 closes
♦ Shorts: Nearest pivot LOW below BO → must break with 2 closes
♦ Price Discovery: If no pivot exists beyond BO = auto-pass
♦ Why: Aims to confirm momentum has overcome previous rejection zones
4️⃣ VOLUME: OBV Aligned OR Spike
♦ Directional OBV: OBV > 20-EMA (longs) OR OBV < 20-EMA (shorts)
♦ OR Volume Spike: Current volume > 20-period SMA
♦ Why: Checks for institutional participation signals
5️⃣ VALIDATIONS: Setup Valid (✅)
♦ Dates valid (A < B < C, all in past)
♦ Wave structure valid (min 5% impulse, min 3% retrace)
♦ Budget allocation = 100%
♦ Prices detected at all points
⚠️ BO fires once per bar close. Flag set permanently until trade resets.
───────────────────────────────────────────
🔺 PYRAMID ORDERS (PO1-3) - PYRAMIDING INTO STRENGTH
💬 "Never buy a stock because it has had a big decline from its previous high. The big money was never made in the stock market by buying on declines."
— Jesse Livermore
PO Price Calculation
Fixed Fibonacci extensions from Point C:
Formula: Price C ± (Impulse Range × Fib Level)
Where: Impulse Range = |Price B - Price A|
Default Levels:
♦ PO1 @ Fib 0.618 (Golden Ratio)
♦ PO2 @ Fib 1.000 (Full impulse repeat)
♦ PO3 @ Fib 1.272 (Fibonacci sequence extension)
───────────────────────────────────────────
PO Entry Conditions - ALL 6 Must Align (STRICTER):
1️⃣ PRICE: 3 Consecutive Closes Beyond PO
♦ Longs: close > PO AND close > PO AND close > PO
♦ Shorts: close < PO AND close < PO AND close < PO
♦ Why: Higher conviction needed when adding capital (3 vs 2 closes for BO)
2️⃣ TREND: Same as BO
Normal OR Strong trend must remain aligned with trade direction
3️⃣ PIVOT: Per-Level Pivot Break
♦ Each PO checks its OWN nearest pivot (not shared with BO)
♦ Same 2-close break requirement
♦ PO3 Exception: Price discovery allowed (no pivot required if already profitable)
4️⃣ VOLUME: Same as BO
Sustained confirmation required (not weakening)
5️⃣ CLEAN CANDLE: <30% Reversal Wick (NEW)
♦ Filter: Uses ATR(14) - candles < ATR auto-pass (consolidation noise)
♦ Longs: Upper wick < 30% of candle range (no rejection at top)
♦ Shorts: Lower wick < 30% of candle range (no rejection at bottom)
♦ Why: Don't pyramid into weakness/rejection - only add on clean momentum
♦ Not checked for BO: Test position tolerates some wick risk
6️⃣ SEQUENCE: Prior Order Fired
♦ PO1 requires: BO fired
♦ PO2 requires: PO1 fired
♦ PO3 requires: PO2 fired
♦ Why: No skipping levels - disciplined building only
───────────────────────────────────────────
⚙️ KEY DIFFERENCE:
BO (20% capital) = Lighter requirements, testing your idea early
POs (80% capital) = Stricter requirements, adding only to confirmed winners
♦ BO: 2 closes | POs: 3 closes
♦ BO: No candle check | POs: Clean candle required
♦ BO: Independent | POs: Sequential (must follow order)
♦ BO: No price discovery | PO3: Allows price discovery when profitable
💬 "Profits always take care of themselves, but losses never do. The speculator has to ensure himself against considerable losses by taking the first small loss."
— Jesse Livermore
━━━━━━━━━━━━━━━━━━━━━━━━━━━━━━━━━━━━━━━━━━━
🚪 EXIT LOGIC - TECHNICAL DETAILS
🔴 EXIT PHILOSOPHY
The indicator uses TWO INDEPENDENT EXIT TRIGGERS (whichever fires first):
1) Structural Breakdown
Price breaks through the EXIT level with confirmation
2) Trend Reversal
Trend flips against your position AND price breaks EXIT level
Why two methods?
♦ Structure = price-based protection (hard stop)
♦ Trend = momentum-based exit (early warning when market character changes)
♦ Combined: Exit either when proven wrong (structure) or when conditions no longer favor your direction (trend)
───────────────────────────────────────────
🔴 EXIT PRICE CALCULATION
The EXIT price (your stop loss) adjusts dynamically based on position size:
BEFORE PO3 Fires (Fixed Stops):
♦ BO only = Stop at Point C (small position, tight stop near entry)
♦ PO1 fired = Stop at Fib 0.5 (moved to breakeven zone)
♦ PO2 fired = Stop at Fib 0.786 (protecting partial profits)
AFTER PO3 Fires (Trailing Stops):
♦ Tracking: Monitors the highest Fib reached (longs) or the lowest Fib reached (shorts)
♦ Placement: EXIT moves 1-2 Fib levels below the highest (longs) or above the lowest (shorts)
♦ Example: Price reaches Fib 2.618 → EXIT trails up to Fib 2.0
♦ Purpose: Designed to protect accumulated profits while allowing room for normal pullbacks
💬 "It never was my thinking that made the big money for me. It was always my sitting. Men who can both be right and sit tight are uncommon."
— Jesse Livermore
───────────────────────────────────────────
🔴 EXIT CONDITIONS
Exit Speed (Based on Risk Exposure):
♦ Full position (PO3 fired) = 1 close required (fast exit - more capital at risk)
♦ Partial position (BO/PO1/PO2 only) = 2 closes required (confirmation - less urgency)
METHOD 1: Structural Breakdown
Price violates the EXIT level with clean momentum:
For Longs:
♦ Price closes BELOW EXIT level (1 or 2 closes depending on position size)
♦ Clean candle required (lower wick < 50% of range - no false breakdown)
For Shorts:
♦ Price closes ABOVE EXIT level (1 or 2 closes depending on position size)
♦ Clean candle required (upper wick < 50% of range - no false breakout)
Why clean candle check?
Designed to reduce exits on wicks/fakeouts. If there's a large reversal wick (>50%), it suggests buyers/sellers are defending the level - not a true breakdown.
METHOD 2: Trend Reversal
Market character shifts against your position:
For Longs:
♦ Trend shifts from Bull → Normal Bear OR Strong Bear
♦ AND price breaks below EXIT level (same close requirements)
For Shorts:
♦ Trend shifts from Bear → Normal Bull OR Strong Bull
♦ AND price breaks above EXIT level (same close requirements)
Why this matters?
♦ Proactive exit before structural stop is hit
♦ If the trend that confirmed your entries reverses, the setup is invalidated
♦ Livermore principle: Exit when market proves you wrong, don't wait for max pain
───────────────────────────────────────────
⚠️ EXIT BEHAVIOR
♦ Fires once per bar close (same as entries)
♦ Resets all tracking after exit (ready for fresh trade setup)
♦ Clears flags: boSignalFired, po1/po2/po3SignalFired, highestFib/lowestFib tracking
♦ If using 3Commas: Sends exit_long or exit_short JSON (market order closes 100% position)
💬 "I never argue with the tape. Getting sore at the market doesn't get you anywhere."
— Jesse Livermore
━━━━━━━━━━━━━━━━━━━━━━━━━━━━━━━━━━━━━━━━━━━
🤖 3COMMAS AUTOMATION (OPTIONAL)
💬 "There is the plain fool, who does the wrong thing at all times everywhere, but there is also the Wall Street fool, who thinks he must trade all the time."
— Jesse Livermore
Automation designed to help remove emotion and support disciplined execution.
───────────────────────────────────────────
⚡ QUICK SETUP IN 5 STEPS
STEP 1: Create Your Signal Bots
You need 2 SEPARATE BOTS (one for Longs, one for Shorts):
Go to 3Commas → Bots → Create Bot → Select "Signal Bot"
Basic Settings:
♦ Bot Name: "Livermore Long - " (example: "Livermore Long - BTCUSDT")
♦ Exchange: Your connected exchange
♦ Trading Pair: Must match TradingView chart exactly
♦ Strategy: Custom Signal
♦ Direction: LONG (for first bot) or SHORT (for second bot)
♦ Max Active Deals: 1
⚠️ CRITICAL SETTINGS:
Entry Orders:
♦ Toggle ON: "Entry Orders"
♦ Volume per Order: "Send in webhook, quote"
♦ Why: This lets the indicator control exact $ amounts per order (BO=$2K, PO1=$2.5K, etc.)
♦ If you skip this: Orders will use wrong sizes and break your allocation plan
Exit Orders:
♦ Toggle ON: "Exit Orders"
♦ Volume per Order: "100 Position %"
♦ Why: Closes your entire position when EXIT signal fires
♦ Toggle OFF: "Take Profit" (managed by indicator)
♦ Toggle OFF: "Stop Loss" (managed by indicator)
Click "Start Bot" for both Long and Short bots.
───────────────────────────────────────────
STEP 2: Get Your Bot Credentials
For EACH BOT (Long and Short):
♦ Open the bot → Click "Orders" tab
♦ Scroll down to "Webhook Messages" section
♦ Copy these 3 values:
bot_uuid (long string like: a362cbcf-7e68-4379-a83d-ae6e47dba656)
secret (very long token starting with: eyJhbGciOiJ...)
webhook URL (refer to 3commas to get exact webhook - signal bots)
Note: The secret is usually the same for both bots, but the bot_uuid is different.
───────────────────────────────────────────
STEP 3: Enter Credentials in Indicator
Back in TradingView:
♦ Open indicator Settings
♦ Find section: "1️⃣ INTEGRATE 3COMMAS"
♦ Paste:
Long = Your Long bot UUID
Short = Your Short bot UUID
Secret = Your secret token (same for both)
♦ Click "OK"
The indicator now has everything needed to build JSON payloads.
───────────────────────────────────────────
STEP 4: Create TradingView Alert
This alert bridges TradingView → 3Commas. ONE ALERT HANDLES ALL SIGNALS (BO, PO1, PO2, PO3, EXIT).
How to create:
♦ Right-click chart → "Add Alert" (or click clock icon)
♦ Condition: Select this indicator from dropdown
♦ Trigger: "Any alert() function call"
♦ Alert Name: "Livermore Pyramiding - "
♦ Message: Leave default (indicator sends its own JSON)
♦ Webhook URL: Paste your 3Commas webhook URL from Step 2
♦ ⚠️ Alert Frequency: "Once Per Bar Close" (CRITICAL - controls duplicate orders)
♦ Expiration: Open-ended (or set specific date)
♦ Click "Create"
───────────────────────────────────────────
STEP 5: Test Before Going Live
🧪 NEVER TEST WITH REAL CAPITAL FIRST. Use one of these methods:
Test 1: Check Bot Status
♦ 3Commas → Bots → Both bots show "Active" (green)
♦ Click into each bot → Orders tab → Should say "Waiting for signal"
Test 2: Verify Alert Active
♦ TradingView → Alerts panel (bell icon)
♦ Your alert should show "Active" status
Test 3: Paper Trade / Tiny Position
♦ Use 3Commas paper mode if available, OR
♦ Set Total Budget to $10-50 for first real test
♦ Map a wave that's about to trigger
♦ Watch if orders actually appear on 3Commas
Test 4: Check JSON Format
♦ When alert fires → TradingView Alerts → Click your alert
♦ Look at "History" or "Log"
♦ Verify JSON has: bot_uuid, secret, action, price, amount
───────────────────────────────────────────
🛠️ COMMON ISSUES & SOLUTIONS
✗ Problem: Orders not appearing on 3Commas
Possible causes:
♦ Wrong webhook URL → Must be exact 3Commas URL (check for typos)
♦ Bot paused → Check bot status must be "Active" (green)
♦ Wrong bot UUID → Verify you copied Long UUID for longs, Short UUID for shorts
♦ Secret mismatch → Double-check secret is correct
♦ Exchange API issues → Verify exchange connection in 3Commas settings
How to debug:
♦ 3Commas → Your Signal Bot → Orders tab
♦ Look for "Rejected Signals" section
♦ Should show error messages if webhook failed
───────────────────────────────────────────
✗ Problem: Orders executing at wrong prices
Possible causes:
♦ Limit order not filled → Price gapped through your level before order filled
♦ Slippage on exits → Exits use market orders (intentional - speed over exact price)
♦ Exchange minimums → Some exchanges have minimum order sizes
Solution:
♦ Entries use limit orders (wait for exact price - may not fill if price gaps)
♦ Exits use market orders (prioritize fast execution when structure breaks)
♦ This is INTENTIONAL DESIGN following Livermore's principle: exit when proven wrong
───────────────────────────────────────────
✗ Problem: PO orders firing out of sequence or skipping
Possible causes:
♦ Alert not set to "Once Per Bar Close" → Change alert frequency setting
♦ Multiple alerts running → Delete old/duplicate alerts for this indicator
♦ Conditions changed mid-bar → Indicator only fires at bar close (protective feature)
Solution:
♦ Keep only 1 active alert per indicator instance
♦ Always use "Once Per Bar Close" frequency
♦ Wait for full bar to close before signals can fire
───────────────────────────────────────────
✗ Problem: Bot not closing position on EXIT
Possible causes:
♦ Exit order setting wrong → Check bot settings
♦ Wrong JSON action → Should be "exit_long" or "exit_short"
♦ No position open → Can't close what doesn't exist
Solution:
♦ Verify: Bot Settings → Exit Orders → Volume per Order = "100 Position %"
♦ Check alert history for correct JSON payload
♦ If stuck: Manually close position in 3Commas, then fix settings
♦ Delete and recreate alert if JSON format is wrong
───────────────────────────────────────────
🔒 SECURITY BEST PRACTICES
♦ Never share bot UUID or Secret - Treat them like passwords
♦ Use restricted API keys - Limit to specific pairs, disable withdrawals
♦ Start small - Test with $10-50 first, scale up only after success
♦ Monitor first trades - Don't set-and-forget immediately
♦ Delete old alerts - If you change A/B/C points, delete old alert and create new one
───────────────────────────────────────────
📊 PREFER MANUAL TRADING?
Skip 3Commas entirely and use the indicator for planning only:
♦ Watch Trade Plan table for ✓✓✓✓✓ alignment
♦ Manually place limit orders at displayed prices
♦ Manually move stop loss as EXIT price updates
♦ Manually close when EXIT signal fires
Benefits: Full control, no API concerns, can override based on context
Drawbacks: Must watch chart constantly, emotions can interfere, may miss signals
───────────────────────────────────────────
✅ FINAL CHECKLIST BEFORE LIVE TRADING
✓ Both Signal Bots created (Long + Short)
✓ Entry Orders: Volume = "Send in webhook, quote"
✓ Exit Orders: Volume = "100 Position %"
✓ Take Profit and Stop Loss disabled in bots
✓ Bot UUIDs and Secret entered in indicator
✓ TradingView alert created with correct webhook
✓ Alert frequency = "Once Per Bar Close"
✓ Alert status shows "Active"
✓ Tested with small amounts successfully
✓ Trade Plan table shows ✅ (no validation errors)
✓ Understand your risk per trade
Once all checked: You're ready for automated pyramiding execution.
━━━━━━━━━━━━━━━━━━━━━━━━━━━━━━━━━━━━━━━━━━━
💡 KEY REMINDERS - BEFORE YOU TRADE
💬 "The speculator's chief enemies are always boring from within. It is inseparable from human nature to hope and to fear."
— Jesse Livermore
───────────────────────────────────────────
⚠️ COMMON MISTAKES (AVOID THESE)
Mapping Incomplete Waves
♦ Point C must be in the PAST (completed retrace, not currently forming)
♦ Don't map a wave that's still developing - wait for confirmation
♦ Minimum requirements: 5% impulse (A→B), 3% retrace (B→C)
Ignoring Validation Warnings
♦ Never create alerts when status shows ✗ (red) or ⚠️ (yellow)
♦ Fix all errors first: dates in order, budget = 100%, valid wave structure
♦ Common issues: dates in future, Point C above B (longs) or below B (shorts)
Premature Manual Entries
♦ Don't enter just because price touched the level
♦ Wait for ALL ✓✓✓✓✓ (or ✓✓✓✓✓✓) to align in Trade Plan table
♦ Patience pays - partial confluence = partial edge = higher risk of losing trades
Wrong Timeframe Selection
♦ Avoid: 15m, 5m, 1m (too much noise, false signals)
♦ Use: 1H, 4H, Daily (cleaner structure, better confluence)
♦ Lower timeframes require faster decisions and produce more whipsaws
Over-Risking Capital
♦ Trade budget ≠ Account size
♦ Never risk capital you can't afford to lose
♦ One bad trade should NOT destroy your account
───────────────────────────────────────────
✅ LIVERMORE PRINCIPLES IN ACTION
Confirmation > Prediction
♦ Don't predict where price will go
♦ Wait for price to INDICATE direction via pivots + volume + trend
♦ Test first (BO 20%), build only when confirmed (POs 80%)
💬 "A man must believe in himself and his judgment if he expects to make a living at this game."
Pyramid on Strength, Never Weakness
♦ Add only when: 3 closes + clean candles + volume + pivot breaks
♦ Never average down (DCA into losers)
♦ If BO wrong, take small loss fast - don't hope and add more
💬 "Never buy a stock because it has had a big decline from its previous high."
Respect Market Structure
♦ Pivots = where smart money previously acted (support/resistance)
♦ Breaking them = momentum overcoming barriers
♦ Entering before pivot break = entering into known rejection zones
Trend is Your Friend
♦ Never pyramid against the trend
♦ If trend shifts to Uncertain or reverses → no new entries
♦ Exit when trend proves you wrong (don't fight it)
💬 "I never argue with the tape. Getting sore at the market doesn't get you anywhere."
Discipline > Emotion
♦ Can't "almost" have all conditions met
♦ Either 100% aligned (all ✓) or you wait
♦ No exceptions, no "this time is different"
♦ Automation designed to help remove emotion - consider using 3Commas
💬 "It never was my thinking that made the big money for me. It always was my sitting."
───────────────────────────────────────────
🎯 FINAL THOUGHT
This indicator is a SYSTEMATIC FRAMEWORK, not a magic solution. It translates Livermore's century-old principles into actionable rules:
♦ Test small, build big
♦ Add to winners, cut losers fast
♦ Let structure guide exits
♦ Stay disciplined when emotions scream
The market will test your patience, discipline, and conviction. The indicator aims to reduce guesswork - but YOU still need to:
♦ Find valid wave structures
♦ Choose appropriate market conditions
♦ Size positions properly
♦ Accept losses as part of the game
💬 "The game of speculation is the most uniformly fascinating game in the world. But it is not a game for the stupid, the mentally lazy, the person of inferior emotional balance, or the get-rich-quick adventurer."
— Jesse Livermore

Luxy Momentum, Trend, Bias and Breakout Indicators V7
TABLE OF CONTENTS
This is Version 7 (V7) - the latest and most optimized release. If you are using any older versions (V6, V5, V4, V3, etc.), it is highly recommended to replace them with V7.
Why This Indicator is Different
Who Should Use This
Core Components Overview
The UT Bot Trading System
Understanding the Market Bias Table
Candlestick Pattern Recognition
Visual Tools and Features
How to Use the Indicator
Performance and Optimization
FAQ
---
### CREDITS & ATTRIBUTION
This indicator implements proven trading concepts using entirely original code developed specifically for this project.
### CONCEPTUAL FOUNDATIONS
• UT Bot ATR Trailing System
- Original concept by @QuantNomad: (search "UT-Bot-Strategy"
- Our version is a complete reimplementation with significant enhancements:
- Volume-weighted momentum adjustment
- Composite stop loss from multiple S/R layers
- Multi-filter confirmation system (swing, %, 2-bar, ZLSMA)
- Full integration with multi-timeframe bias table
- Visual audit trail with freeze-on-touch
- NOTE: No code was copied - this is a complete reimplementation with enhancements.
• Standard Technical Indicators (Public Domain Formulas):
- Supertrend: ATR-based trend calculation with custom gradient fills
- MACD: Gerald Appel's formula with separation filters
- RSI: J. Welles Wilder's formula with pullback zone logic
- ADX/DMI: Custom trend strength formula inspired by Wilder's directional movement concept, reimplemented with volume weighting and efficiency metrics
- ZLSMA: Zero-lag formula enhanced with Hull MA and momentum prediction
### Custom Implementations
- Trend Strength: Inspired by Wilder's ADX concept but using volume-weighted pressure calculation and efficiency metrics (not traditional +DI/-DI smoothing)
- All code implementations are original
### ORIGINAL FEATURES (70%+ of codebase)
- Multi-Timeframe Bias Table with live updates
- Risk Management System (R-multiple TPs, freeze-on-touch)
- Opening Range Breakout tracker with session management
- Composite Stop Loss calculator using 6+ S/R layers
- Performance optimization system (caching, conditional calcs)
- VIX Fear Index integration
- Previous Day High/Low auto-detection
- Candlestick pattern recognition with interactive tooltips
- Smart label and visual management
- All UI/UX design and table architecture
### DEVELOPMENT PROCESS
**AI Assistance:** This indicator was developed over 2+ months with AI assistance (ChatGPT/Claude) used for:
- Writing Pine Script code based on design specifications
- Optimizing performance and fixing bugs
- Ensuring Pine Script v6 compliance
- Generating documentation
**Author's Role:** All trading concepts, system design, feature selection, integration logic, and strategic decisions are original work by the author. The AI was a coding tool, not the system designer.
**Transparency:** We believe in full disclosure - this project demonstrates how AI can be used as a powerful development tool while maintaining creative and strategic ownership.
---
1. WHY THIS INDICATOR IS DIFFERENT
Most traders use multiple separate indicators on their charts, leading to cluttered screens, conflicting signals, and analysis paralysis. The Suite solves this by integrating proven technical tools into a single, cohesive system.
Key Advantages:
All-in-One Design: Instead of loading 5-10 separate indicators, you get everything in one optimized script. This reduces chart clutter and improves TradingView performance.
Multi-Timeframe Bias Table: Unlike standard indicators that only show the current timeframe, the Bias Table aggregates trend signals across multiple timeframes simultaneously. See at a glance whether 1m, 5m, 15m, 1h are aligned bullish or bearish - no more switching between charts.
Smart Confirmations: The indicator doesn't just give signals - it shows you WHY. Every entry has multiple layers of confirmation (MA cross, MACD momentum, ADX strength, RSI pullback, volume, etc.) that you can toggle on/off.
Dynamic Stop Loss System: Instead of static ATR stops, the SL is calculated from multiple support/resistance layers: UT trailing line, Supertrend, VWAP, swing structure, and MA levels. This creates more intelligent, price-action-aware stops.
R-Multiple Take Profits: Built-in TP system calculates targets based on your initial risk (1R, 1.5R, 2R, 3R). Lines freeze when touched with visual checkmarks, giving you a clean audit trail of partial exits.
Educational Tooltips Everywhere: Every single input has detailed tooltips explaining what it does, typical values, and how it impacts trading. You're not guessing - you're learning as you configure.
Performance Optimized: Smart caching, conditional calculations, and modular design mean the indicator runs fast despite having 15+ features. Turn off what you don't use for even better performance.
No Repainting: All signals respect bar close. Alerts fire correctly. What you see in history is what you would have gotten in real-time.
What Makes It Unique:
Integrated UT Bot + Bias Table: No other indicator combines UT Bot's ATR trailing system with a live multi-timeframe dashboard. You get precision entries with macro trend context.
Candlestick Pattern Recognition with Interactive Tooltips: Patterns aren't just marked - hover over any emoji for a full explanation of what the pattern means and how to trade it.
Opening Range Breakout Tracker: Built-in ORB system for intraday traders with customizable session times and real-time status updates in the Bias Table.
Previous Day High/Low Auto-Detection: Automatically plots PDH/PDL on intraday charts with theme-aware colors. Updates daily without manual input.
Dynamic Row Labels in Bias Table: The table shows your actual settings (e.g., "EMA 10 > SMA 20") not generic labels. You know exactly what's being evaluated.
Modular Filter System: Instead of forcing a fixed methodology, the indicator lets you build your own strategy. Start with just UT Bot, add filters one at a time, test what works for your style.
---
2. WHO WHOULD USE THIS
Designed For:
Intermediate to Advanced Traders: You understand basic technical analysis (MAs, RSI, MACD) and want to combine multiple confirmations efficiently. This isn't a "one-click profit" system - it's a professional toolkit.
Multi-Timeframe Traders: If you trade one asset but check multiple timeframes for confirmation (e.g., enter on 5m after checking 15m and 1h alignment), the Bias Table will save you hours every week.
Trend Followers: The indicator excels at identifying and following trends using UT Bot, Supertrend, and MA systems. If you trade breakouts and pullbacks in trending markets, this is built for you.
Intraday and Swing Traders: Works equally well on 5m-1h charts (day trading) and 4h-D charts (swing trading). Scalpers can use it too with appropriate settings adjustments.
Discretionary Traders: This isn't a black-box system. You see all the components, understand the logic, and make final decisions. Perfect for traders who want tools, not automation.
Works Across All Markets:
Stocks (US, international)
Cryptocurrency (24/7 markets supported)
Forex pairs
Indices (SPY, QQQ, etc.)
Commodities
NOT Ideal For :
Complete Beginners: If you don't know what a moving average or RSI is, start with basics first. This indicator assumes foundational knowledge.
Algo Traders Seeking Black Box: This is discretionary. Signals require context and confirmation. Not suitable for blind automated execution.
Mean-Reversion Only Traders: The indicator is trend-following at its core. While VWAP bands support mean-reversion, the primary methodology is trend continuation.
---
3. CORE COMPONENTS OVERVIEW
The indicator combines these proven systems:
Trend Analysis:
Moving Averages: Four customizable MAs (Fast, Medium, Medium-Long, Long) with six types to choose from (EMA, SMA, WMA, VWMA, RMA, HMA). Mix and match for your style.
Supertrend: ATR-based trend indicator with unique gradient fill showing trend strength. One-sided ribbon visualization makes it easier to see momentum building or fading.
ZLSMA : Zero-lag linear-regression smoothed moving average. Reduces lag compared to traditional MAs while maintaining smooth curves.
Momentum & Filters:
MACD: Standard MACD with separation filter to avoid weak crossovers.
RSI: Pullback zone detection - only enter longs when RSI is in your defined "buy zone" and shorts in "sell zone".
ADX/DMI: Trend strength measurement with directional filter. Ensures you only trade when there's actual momentum.
Volume Filter: Relative volume confirmation - require above-average volume for entries.
Donchian Breakout: Optional channel breakout requirement.
Signal Systems:
UT Bot: The primary signal generator. ATR trailing stop that adapts to volatility and gives clear entry/exit points.
Base Signals: MA cross system with all the above filters applied. More conservative than UT Bot alone.
Market Bias Table: Multi-timeframe dashboard showing trend alignment across 7 timeframes plus macro bias (3-day, weekly, monthly, quarterly, VIX).
Candlestick Patterns: Six major reversal patterns auto-detected with interactive tooltips.
ORB Tracker: Opening range high/low with breakout status (intraday only).
PDH/PDL: Previous day levels plotted automatically on intraday charts.
VWAP + Bands : Session-anchored VWAP with up to three standard deviation band pairs.
---
4. THE UT BOT TRADING SYSTEM
The UT Bot is the heart of the indicator's signal generation. It's an advanced ATR trailing stop that adapts to market volatility.
Why UT Bot is Superior to Fixed Stops:
Traditional ATR stops use a fixed multiplier (e.g., "stop = entry - 2×ATR"). UT Bot is smarter:
It TRAILS the stop as price moves in your favor
It WIDENS during high volatility to avoid premature stops
It TIGHTENS during consolidation to lock in profits
It FLIPS when price breaks the trailing line, signaling reversals
Visual Elements You'll See:
Orange Trailing Line: The actual UT stop level that adapts bar-by-bar
Buy/Sell Labels: Aqua triangle (long) or orange triangle (short) when the line flips
ENTRY Line: Horizontal line at your entry price (optional, can be turned off)
Suggested Stop Loss: A composite SL calculated from multiple support/resistance layers:
- UT trailing line
- Supertrend level
- VWAP
- Swing structure (recent lows/highs)
- Long-term MA (200)
- ATR-based floor
Take Profit Lines: TP1, TP1.5, TP2, TP3 based on R-multiples. When price touches a TP, it's marked with a checkmark and the line freezes for audit trail purposes.
Status Messages: "SL Touched ❌" or "SL Frozen" when the trade leg completes.
How UT Bot Differs from Other ATR Systems:
Multiple Filters Available: You can require 2-bar confirmation, minimum % price change, swing structure alignment, or ZLSMA directional filter. Most UT implementations have none of these.
Smart SL Calculation: Instead of just using the UT line as your stop, the indicator suggests a better SL based on actual support/resistance. This prevents getting stopped out by wicks while keeping risk controlled.
Visual Audit Trail: All SL/TP lines freeze when touched with clear markers. You can review your trades weeks later and see exactly where entries, stops, and targets were.
Performance Options: "Draw UT visuals only on bar close" lets you reduce rendering load without affecting logic or alerts - critical for slower machines or 1m charts.
Trading Logic:
UT Bot flips direction (Buy or Sell signal appears)
Check Bias Table for multi-timeframe confirmation
Optional: Wait for Base signal or candlestick pattern
Enter at signal bar close or next bar open
Place stop at "Suggested Stop Loss" line
Scale out at TP levels (TP1, TP2, TP3)
Exit remaining position on opposite UT signal or stop hit
---
5. UNDERSTANDING THE MARKET BIAS TABLE
This is the indicator's unique multi-timeframe intelligence layer. Instead of looking at one chart at a time, the table aggregates signals across seven timeframes plus macro trend bias.
Why Multi-Timeframe Analysis Matters:
Professional traders check higher and lower timeframes for context:
Is the 1h uptrend aligning with my 5m entry?
Are all short-term timeframes bullish or just one?
Is the daily trend supportive or fighting me?
Doing this manually means opening multiple charts, checking each indicator, and making mental notes. The Bias Table does it automatically in one glance.
Table Structure:
Header Row:
On intraday charts: 1m, 5m, 15m, 30m, 1h, 2h, 4h (toggle which ones you want)
On daily+ charts: D, W, M (automatic)
Green dot next to title = live updating
Headline Rows - Macro Bias:
These show broad market direction over longer periods:
3 Day Bias: Trend over last 3 trading sessions (uses 1h data)
Weekly Bias: Trend over last 5 trading sessions (uses 4h data)
Monthly Bias: Trend over last 30 daily bars
Quarterly Bias: Trend over last 13 weekly bars
VIX Fear Index: Market regime based on VIX level - bullish when low, bearish when high
Opening Range Breakout: Status of price vs. session open range (intraday only)
These rows show text: "BULLISH", "BEARISH", or "NEUTRAL"
Indicator Rows - Technical Signals:
These evaluate your configured indicators across all active timeframes:
Fast MA > Medium MA (shows your actual MA settings, e.g., "EMA 10 > SMA 20")
Price > Long MA (e.g., "Price > SMA 200")
Price > VWAP
MACD > Signal
Supertrend (up/down/neutral)
ZLSMA Rising
RSI In Zone
ADX ≥ Minimum
These rows show emojis: GREEB (bullish), RED (bearish), GRAY/YELLOW (neutral/NA)
AVG Column:
Shows percentage of active timeframes that are bullish for that row. This is the KEY metric:
AVG > 70% = strong multi-timeframe bullish alignment
AVG 40-60% = mixed/choppy, no clear trend
AVG < 30% = strong multi-timeframe bearish alignment
How to Use the Table:
For a long trade:
Check AVG column - want to see > 60% ideally
Check headline bias rows - want to see BULLISH, not BEARISH
Check VIX row - bullish market regime preferred
Check ORB row (intraday) - want ABOVE for longs
Scan indicator rows - more green = better confirmation
For a short trade:
Check AVG column - want to see < 40% ideally
Check headline bias rows - want to see BEARISH, not BULLISH
Check VIX row - bearish market regime preferred
Check ORB row (intraday) - want BELOW for shorts
Scan indicator rows - more red = better confirmation
When AVG is 40-60%:
Market is choppy, mixed signals. Either stay out or reduce position size significantly. These are low-probability environments.
Unique Features:
Dynamic Labels: Row names show your actual settings (e.g., "EMA 10 > SMA 20" not generic "Fast > Slow"). You know exactly what's being evaluated.
Customizable Rows: Turn off rows you don't care about. Only show what matters to your strategy.
Customizable Timeframes: On intraday charts, disable 1m or 4h if you don't trade them. Reduces calculation load by 20-40%.
Automatic HTF Handling: On Daily/Weekly/Monthly charts, the table automatically switches to D/W/M columns. No configuration needed.
Performance Smart: "Hide BIAS table on 1D or above" option completely skips all table calculations on higher timeframes if you only trade intraday.
---
6. CANDLESTICK PATTERN RECOGNITION
The indicator automatically detects six major reversal patterns and marks them with emojis at the relevant bars.
Why These Six Patterns:
These are the most statistically significant reversal patterns according to trading literature:
High win rate when appearing at support/resistance
Clear visual structure (not subjective)
Work across all timeframes and assets
Studied extensively by institutions
The Patterns:
Bullish Patterns (appear at bottoms):
Bullish Engulfing: Green candle completely engulfs prior red candle's body. Strong reversal signal.
Hammer: Small body with long lower wick (at least 2× body size). Shows rejection of lower prices by buyers.
Morning Star: Three-candle pattern (large red → small indecision → large green). Very strong bottom reversal.
Bearish Patterns (appear at tops):
Bearish Engulfing: Red candle completely engulfs prior green candle's body. Strong reversal signal.
Shooting Star: Small body with long upper wick (at least 2× body size). Shows rejection of higher prices by sellers.
Evening Star: Three-candle pattern (large green → small indecision → large red). Very strong top reversal.
Interactive Tooltips:
Unlike most pattern indicators that just draw shapes, this one is educational:
Hover your mouse over any pattern emoji
A tooltip appears explaining: what the pattern is, what it means, when it's most reliable, and how to trade it
No need to memorize - learn as you trade
Noise Filter:
"Min candle body % to filter noise" setting prevents false signals:
Patterns require minimum body size relative to price
Filters out tiny candles that don't represent real buying/selling pressure
Adjust based on asset volatility (higher % for crypto, lower for low-volatility stocks)
How to Trade Patterns:
Patterns are NOT standalone entry signals. Use them as:
Confirmation: UT Bot gives signal + pattern appears = stronger entry
Reversal Warning: In a trade, opposite pattern appears = consider tightening stop or taking profit
Support/Resistance Validation: Pattern at key level (PDH, VWAP, MA 200) = level is being respected
Best combined with:
UT Bot or Base signal in same direction
Bias Table alignment (AVG > 60% or < 40%)
Appearance at obvious support/resistance
---
7. VISUAL TOOLS AND FEATURES
VWAP (Volume Weighted Average Price):
Session-anchored VWAP with standard deviation bands. Shows institutional "fair value" for the trading session.
Anchor Options: Session, Day, Week, Month, Quarter, Year. Choose based on your trading timeframe.
Bands: Up to three pairs (X1, X2, X3) showing statistical deviation. Price at outer bands often reverses.
Auto-Hide on HTF: VWAP hides on Daily/Weekly/Monthly charts automatically unless you enable anchored mode.
Use VWAP as:
Directional bias (above = bullish, below = bearish)
Mean reversion levels (outer bands)
Support/resistance (the VWAP line itself)
Previous Day High/Low:
Automatically plots yesterday's high and low on intraday charts:
Updates at start of each new trading day
Theme-aware colors (dark text for light charts, light text for dark charts)
Hidden automatically on Daily/Weekly/Monthly charts
These levels are critical for intraday traders - institutions watch them closely as support/resistance.
Opening Range Breakout (ORB):
Tracks the high/low of the first 5, 15, 30, or 60 minutes of the trading session:
Customizable session times (preset for NYSE, LSE, TSE, or custom)
Shows current breakout status in Bias Table row (ABOVE, BELOW, INSIDE, BUILDING)
Intraday only - auto-disabled on Daily+ charts
ORB is a classic day trading strategy - breakout above opening range often leads to continuation.
Extra Labels:
Change from Open %: Shows how far price has moved from session open (intraday) or daily open (HTF). Green if positive, red if negative.
ADX Badge: Small label at bottom of last bar showing current ADX value. Green when above your minimum threshold, red when below.
RSI Badge: Small label at top of last bar showing current RSI value with zone status (buy zone, sell zone, or neutral).
These labels provide quick at-a-glance confirmation without needing separate indicator windows.
---
8. HOW TO USE THE INDICATOR
Step 1: Add to Chart
Load the indicator on your chosen asset and timeframe
First time: Everything is enabled by default - the chart will look busy
Don't panic - you'll turn off what you don't need
Step 2: Start Simple
Turn OFF everything except:
UT Bot labels (keep these ON)
Bias Table (keep this ON)
Moving Averages (Fast and Medium only)
Suggested Stop Loss and Take Profits
Hide everything else initially. Get comfortable with the basic UT Bot + Bias Table workflow first.
Step 3: Learn the Core Workflow
UT Bot gives a Buy or Sell signal
Check Bias Table AVG column - do you have multi-timeframe alignment?
If yes, enter the trade
Place stop at Suggested Stop Loss line
Scale out at TP levels
Exit on opposite UT signal
Trade this simple system for a week. Get a feel for signal frequency and win rate with your settings.
Step 4: Add Filters Gradually
If you're getting too many losing signals (whipsaws in choppy markets), add filters one at a time:
Try: "Require 2-Bar Trend Confirmation" - wait for 2 bars to confirm direction
Try: ADX filter with minimum threshold - only trade when trend strength is sufficient
Try: RSI pullback filter - only enter on pullbacks, not chasing
Try: Volume filter - require above-average volume
Add one filter, test for a week, evaluate. Repeat.
Step 5: Enable Advanced Features (Optional)
Once you're profitable with the core system, add:
Supertrend for additional trend confirmation
Candlestick patterns for reversal warnings
VWAP for institutional anchor reference
ORB for intraday breakout context
ZLSMA for low-lag trend following
Step 6: Optimize Settings
Every setting has a detailed tooltip explaining what it does and typical values. Hover over any input to read:
What the parameter controls
How it impacts trading
Suggested ranges for scalping, day trading, and swing trading
Start with defaults, then adjust based on your results and style.
Step 7: Set Up Alerts
Right-click chart → Add Alert → Condition: "Luxy Momentum v6" → Choose:
"UT Bot — Buy" for long entries
"UT Bot — Sell" for short entries
"Base Long/Short" for filtered MA cross signals
Optionally enable "Send real-time alert() on UT flip" in settings for immediate notifications.
Common Workflow Variations:
Conservative Trader:
UT signal + Base signal + Candlestick pattern + Bias AVG > 70%
Enter only at major support/resistance
Wider UT sensitivity, multiple filters
Aggressive Trader:
UT signal + Bias AVG > 60%
Enter immediately, no waiting
Tighter UT sensitivity, minimal filters
Swing Trader:
Focus on Daily/Weekly Bias alignment
Ignore intraday noise
Use ORB and PDH/PDL less (or not at all)
Wider stops, patient approach
---
9. PERFORMANCE AND OPTIMIZATION
The indicator is optimized for speed, but with 15+ features running simultaneously, chart load time can add up. Here's how to keep it fast:
Biggest Performance Gains:
Disable Unused Timeframes: In "Time Frames" settings, turn OFF any timeframe you don't actively trade. Each disabled TF saves 10-15% calculation time. If you only day trade 5m, 15m, 1h, disable 1m, 2h, 4h.
Hide Bias Table on Daily+: If you only trade intraday, enable "Hide BIAS table on 1D or above". This skips ALL table calculations on higher timeframes.
Draw UT Visuals Only on Bar Close: Reduces intrabar rendering of SL/TP/Entry lines. Has ZERO impact on logic or alerts - purely visual optimization.
Additional Optimizations:
Turn off VWAP bands if you don't use them
Disable candlestick patterns if you don't trade them
Turn off Supertrend fill if you find it distracting (keep the line)
Reduce "Limit to 10 bars" for SL/TP lines to minimize line objects
Performance Features Built-In:
Smart Caching: Higher timeframe data (3-day bias, weekly bias, etc.) updates once per day, not every bar
Conditional Calculations: Volume filter only calculates when enabled. Swing filter only runs when enabled. Nothing computes if turned off.
Modular Design: Every component is independent. Turn off what you don't need without breaking other features.
Typical Load Times:
5m chart, all features ON, 7 timeframes: ~2-3 seconds
5m chart, core features only, 3 timeframes: ~1 second
1m chart, all features: ~4-5 seconds (many bars to calculate)
If loading takes longer, you likely have too many indicators on the chart total (not just this one).
---
10. FAQ
Q: How is this different from standard UT Bot indicators?
A: Standard UT Bot (originally by @QuantNomad) is just the ATR trailing line and flip signals. This implementation adds:
- Volume weighting and momentum adjustment to the trailing calculation
- Multiple confirmation filters (swing, %, 2-bar, ZLSMA)
- Smart composite stop loss system from multiple S/R layers
- R-multiple take profit system with freeze-on-touch
- Integration with multi-timeframe Bias Table
- Visual audit trail with checkmarks
Q: Can I use this for automated trading?
A: The indicator is designed for discretionary trading. While it has clear signals and alerts, it's not a mechanical system. Context and judgment are required.
Q: Does it repaint?
A: No. All signals respect bar close. UT Bot logic runs intrabar but signals only trigger on confirmed bars. Alerts fire correctly with no lookahead.
Q: Do I need to use all the features?
A: Absolutely not. The indicator is modular. Many profitable traders use just UT Bot + Bias Table + Moving Averages. Start simple, add complexity only if needed.
Q: How do I know which settings to use?
A: Every single input has a detailed tooltip. Hover over any setting to see:
What it does
How it affects trading
Typical values for scalping, day trading, swing trading
Start with defaults, adjust gradually based on results.
Q: Can I use this on crypto 24/7 markets?
A: Yes. ORB will not work (no defined session), but everything else functions normally. Use "Day" anchor for VWAP instead of "Session".
Q: The Bias Table is blank or not showing.
A: Check:
"Show Table" is ON
Table position isn't overlapping another indicator's table (change position)
At least one row is enabled
"Hide BIAS table on 1D or above" is OFF (if on Daily+ chart)
Q: Why are candlestick patterns not appearing?
A: Patterns are relatively rare by design - they only appear at genuine reversal points. Check:
Pattern toggles are ON
"Min candle body %" isn't too high (try 0.05-0.10)
You're looking at a chart with actual reversals (not strong trending market)
Q: UT Bot is too sensitive/not sensitive enough.
A: Adjust "Sensitivity (Key×ATR)". Lower number = tighter stop, more signals. Higher number = wider stop, fewer signals. Read the tooltip for guidance.
Q: Can I get alerts for the Bias Table?
A: The Bias Table is a dashboard for visual analysis, not a signal generator. Set alerts on UT Bot or Base signals, then manually check Bias Table for confirmation.
Q: Does this work on stocks with low volume?
A: Yes, but turn OFF the volume filter. Low volume stocks will never meet relative volume requirements.
Q: How often should I check the Bias Table?
A: Before every entry. It takes 2 seconds to glance at the AVG column and headline rows. This one check can save you from fighting the trend.
Q: What if UT signal and Base signal disagree?
A: UT Bot is more aggressive (ATR trailing). Base signals are more conservative (MA cross + filters). If they disagree, either:
Wait for both to align (safest)
Take the UT signal but with smaller size (aggressive)
Skip the trade (conservative)
There's no "right" answer - depends on your risk tolerance.
---
FINAL NOTES
The indicator gives you an edge. How you use that edge determines results.
For questions, feedback, or support, comment on the indicator page or message the author.
Happy Trading!

cd_VWAP_mtg_CxCd_VWAP_mtg_Cx
Overview
The most important condition for being successful and profitable in the market is to consistently follow the same rules without compromise, while the price constantly moves in countless different ways.
Regardless of the concept or trading school, those who have rules win.
In this indicator, we will define and use three main sections to set and apply our rules.
The indicator uses the VWAP (Volume Weighted Average Price) — price weighted by volume.
Two VWAPs can be displayed either by manually entering date and time, or by selecting from the menu.
From the menu, you can select the following reference levels:
• HTF Open: Opening candle of the higher timeframe
• ATH / ATL: All-Time High / All-Time Low candles
• PMH / PML, PWH / PWL, PDH / PDL, PH4H / PH4L: Previous Month, Week, Day, or H4 Highs/Lows
• MH / ML, WH / WL, DH / DL, H4H / H4L: Current Month, Week, Day, or H4 Highs/Lows
Additionally, it includes:
• Mitigation / Order Block zones (local buyer-seller balance) across two timeframes.
• Buy/Sell Side Liquidity levels (BSL / SSL) from the aligned higher timeframe (target levels).
________________________________________
Components and Usage
1 – VWAP
Calculated using the classical method:
• High + Volume for the upper value
• Close + Volume for the middle value
• Low + Volume for the lower value
The VWAP is displayed as a colored band, where the coloring represents the bias.
Let’s call this band FVB (Fair Value Band) for ease of explanation.
The FVB represents the final line of defense, the buyer/seller boundary, and in technical terms, it can be viewed as premium/discount zones or support/resistance levels.
Within this critical area, the strong side continues its move, while the weaker side is forced to retreat.
But does the side that breaks beyond the band always keep going?
We all know that’s not always the case — in different pairs and timeframes, price often violates both the upper and lower edges multiple times.
To achieve more consistent analysis, we’ll define a new set of rules.
________________________________________
2 – Mitigation / Order Blocks
In trading literature, there are dozens of different definitions and uses of mitigation or order blocks.
Here, we will interpret the candlesticks to create our own definition, and we’ll use the zones defined by candles that fit this pattern.
For simplicity, let’s abbreviate mitigation as “mtg.”
For a candle to be selected as an mtg, it must clearly show strength from one side (buyers or sellers) — which can also be observed visually on the chart.
________________________________________
Bullish mtg criteria:
1. The first candle must be bullish (close > open) → buyers are strong.
2. The next candle makes a new high (buyers push higher) but fails to close above and pulls back to close inside the previous range → sellers react.
It also must not break the previous low → buyers defend.
3. In the following candle(s), as long as the first candle’s low is protected and the second candle’s high is broken, it indicates buyer strength → a bullish mtg is confirmed.
When price returns to this zone later (gets mitigated), the expectation is that the zone holds and price pushes upward again.
If the low is violated, the mtg becomes invalid.
In technical terms:
If the previous candle’s high is broken but no close occurs above it, the expectation is a reversal move that will retest its low.
Question:
What if the low is protected and in the next candle(s) a new high forms?
Answer: → Bullish mtg.
Bearish mtg (opposite)
3 – Buy/Sell Side Liquidity Levels
With the help of the aligned higher timeframe (swing points), we will define our market structure framework and set our liquidity targets accordingly.
Let’s put the pieces together.
If we continue explaining from a trade-focused perspective, our first priority should be our bias — our projection or expectation of the market’s potential movement.
We will determine this bias using the FVB.
Since we know the band often gets violated on both sides, we want the price action to convince us of its strength.
To do that, we’ll use the first candle that closes beyond the band.
The distance from that candle’s high to low will be our threshold range
Bullish level = high + (candle length × coefficient)
Bearish level = low - (candle length × coefficient)
When the price closes beyond this threshold, it demonstrates strength, and our bias will now align in that direction.
How long will this bias remain valid?
→ Until a closing candle appears on the opposite side of the band.
If a close occurs on the opposite side, then a new bias will only be confirmed once the new threshold level is broken.
During the period in between, we have no bias.
Let’s continue on the chart:
Now that our bias has been established, where and how do we look for trade opportunities?
There are two possible entry approaches:
• Aggressive entry: Enter immediately with the breakout.
• Conservative entry: Wait for a pullback and enter once a suitable structure forms.
(The choice depends on the user’s preference.)
At this stage, the user can apply their own entry model. Let’s give an example:
Let’s assume we’re looking for setups using HTF sweep + LTF CISD confirmation.
Once our bias turns bearish, we look for an HTF sweep forming on or near an FVB or mtg block, and then confirm the entry with a CISD signal.
In summary:
• FVB defines the bias, the entry zone, and the target zone.
• Mtg blocks represent entry zones.
• BSL / SSL levels suggest target zones.
Overlapping FVB and mtg blocks are expected to be more effective.
The indicator also provides an option for a second FVB.
A band attached to a lower timeframe can be used as confirmation.
• Main band: Bias + FVB
• Extra band: Entry trigger confirmed by a close beyond it.
Mtg blocks can provide trade entry opportunities, especially when the price is moving strongly in one direction (flow).
Consecutive or complementary mtg blocks indicate that the price is decisive in one direction, while sometimes also showing areas where we should wait before entering.
Mtg blocks that contain an FVG (Fair Value Gap) within their body are expected to be more effective.
Settings:
The default values are set to 1-3-5m, optimized for scalping trades.
VWAP settings:
Main VWAP (FVB):
• Can be set by selecting a start time, manually entering date and time, or choosing a predefined level.
Extra VWAP (FVB):
• Set from the menu. If not needed, select “none.”
• Visibility, color, and fill settings for VWAP are located here.
• Threshold levels visibility and color options are also in this section.
• The multiplier is used for calculating the threshold level.
Important:
• If the Extra VWAP is selected but not displayed, you need to increase the chart timeframe.
o Example: If the chart is on 3m and you select WH from the extra options, it will not display correctly.
• Upper limits for VWAP:
o 1m and 3m charts: daily High/Low
o 5m chart: weekly High/Low
________________________________________
Mtg Settings:
• Visibility and color settings for blocks are configured here.
• To display on a second timeframe, the box must be checked and the timeframe specified.
• Optional display modes: “only active blocks,” “only last violated mtg,” or “all.”
• For confirmation and removal criteria, choosing high/low or close determines the source used for mtg block formation and deletion conditions.
BSL/SSL Settings:
• Visibility, color, font size, and line style can be configured in this section.
When “Auto” is selected, the aligned timeframe is determined automatically by the indicator, while in manual mode, the user defines the timeframe.
Final Words:
Simply opening trades every time the price touches the VWAP or mtg blocks will not make you a profitable trader. Searching for setups with similar structures while maintaining proper risk management will yield better results in the long run.
I would be happy to hear your feedback and suggestions.
Happy trading!

GRG/RGR Signal, MA, Ranges and PivotsThis indicator is a combination of several indicators.
It is a combination of two of my indicators which I solely use for trading
1. EMA 10-20-50-200, Pivots and Previous Day/Week/Month range
2. 3/4-Bar GRG / RGR Pattern (Conditional 4th Candle)
You can use them individually if you already have some of them or just use this one. Belive me when I say, this is all you need, along with market structure knowlege and even if you don’t have that, this indicator has been doing wonders for me. This is all I use. I do not use anything else.
**Note - Do checkout the indicators individually as I have added valuable information in the comment section.
It contains the following,
1. 10 EMA/SMA - configurable
2. 20 EMA/SMA - configurable
3. 50 EMA/SMA - configurable
4. 200 EMA/SMA - configurable
5. Previous Day's Range - configurable
6. Previous Week's Range - configurable
7. Previous Month's Range - configurable
8. Pivots - configurable
9. Buy Sell Signal - configurable
The Moving Averages
It is a very important combination and using it correctly with price action will strengthen your entries and exits.
The ema's or sma's added are the most powerful ones and they do definitely act as support and resistance.
The Daily/Weekly/Monthly Ranges
The Daily/Weekly/Monthly ranges are extremely important for any trader and should be used for targets and reversals.
Pivots
Pivots can provide support and resistance level. R5 and S5 can be used to check for over stretched conditions. You can customise them however you like. It is a full pivot indicator.
It is defaulted to show R5 and S5 only to reduce noise in the chart but it can be customised.
The 3/4 RGR or GRG Signal Generator
Combined with a 3/4 RGR or GRG setup can be all a trader needs.
You don't need complex strategies and SMC concepts to trade. Simple EMAs, ranges and RGR/GRG setup is the most winning combination.
This indicator can be used to identify the Green-Red-Green or Red-Green-Red pattern.
It is a price action indicator where a price action which identifies the defeat of buyers and sellers.
If the buyers comprehensively defeat the sellers then the price moves up and if the sellers defeat the buyers then the price moves down.
In my trading experience this is what defines the price movement.
It is a 3 or 4 candle pattern, beyond that i.e, 5 or more candles could mean a very sideways market and unnecessary signal generation.
How does it work?
Upside/Green signal
1. Say candle 1 is Green, which means buyers stepped in, then candle 2 is Red or a Doji, that means sellers brought the price down. Then if candle 3 is forming to be Green and breaks the closing of the 1st candle and opening of the 2nd candle, then a green arrow will appear and that is the place where you want to take your trade.
2. Here the buyers defeated the sellers.
3. Sometimes candle 3 falls short but candle 4 breaks candle 1's closing and candle 2's opening price. We can enter on candle 4.
4. Important - We need to enter the trade as soon as the price moves above the candle 1 and 2's body and should not wait for the 3rd or 4th candle to close. Ignore wicks.
5. But for a more optimised entry I have added an option to use candle’s highs and lows instead of open and close. This reduces lot of noise and provides us with more precise entry. This setting is turned on by default.
6. I have restricted it to 4 candles and that is all that is needed. More than that is a longer sideways market.
7. I call it the +-+ or GRG pattern or Green-Red-Green or Buyer-Seller-Buyer or Seller defeated or just Buyer pattern.
8. Stop loss can be candle 2's mid for safe traders (that includes me) or candle 2's body low for risky traders.
9. Back testing suggests that body low will be useless and result in more points in loss because for the bigger move this point will not be touched, so why not get out faster.
Downside/Red signal
1. Say candle 1 is Red, which means sellers stepped in, then candle 2 is Green or a Doji, that means buyers took the price up. Then if candle 3 is forming to be Red and breaks the closing of the 1st candle and opening of the 2nd candle then a Red arrow will appear and that is the place where you want to take your trade.
2. Sometimes candle 3 falls short but candle 4 breaks candle 1's closing and candle 2's opening price. We can enter on candle 4.
3. We need to enter the trade as soon as the price moves below the candle 1 and 2's body and should not wait for the 3rd or 4th candle to close.
4. But for a more optimised entry I have added an option to use candle’s highs and lows instead of open and close. This reduces lot of noise and provides us with more precise entry. This setting is turned on by default.
5. I have restricted it to 4 candles and that is all that is needed. More than that is a longer sideways market.
6. I call it the -+- or RGR pattern or Red-Green-Red or Seller-Buyer-Seller or Buyer defeated or just Seller pattern.
7. Stop loss can be candle 2's mid for safe traders ( that includes me) or candle 2's body high for risky traders.
8. Back testing suggests that body high will be useless and result in more points in loss because for the bigger move this point will not be touched, so why not get out faster.
Combining Indicators and Signal
Combining these indicators with GRG/RGR signal can be very powerful and can provide big moves.
1. MA crossover and Signal - This is very powerful and provides a very big move. Trades can be held for longer. If after taking the trade we notice that the MA crossover has happened then trades can be held for higher targets.
2. Pivots and Signal - Pivots and add a support or resistance point. Take profits on these points. R5/S5 are over streched conditions so we can start looking for reversal signals and ignore other signals
3. Intraday Range - first 1, 5, 15 min of the day - Sideways days is when price will stay in these ranges. You can take profits at these ranges or if the range is broken and we get a signal, then it can mean that the direction will be sustained.
4. Previous Day/Week/Month Ranges - These can be used as Take Profit points if the price is moving towards them after getting the signal. If the range is broken and we get a signal then it can be a strong signal. They can also be used as reversal points if a strong signal is generated.
Important Settings
1. Include 4th Candle Confirmation - You can enable or disable the 4th candle signal to avoid the noise, but at times I have noticed that the 4th candle gives a very strong signal or I can say that the strong signal falls on the 4th candle. This is mostly a coincidence.
2. Bars to check (default 10) - You can also configure how many previous bars should the signal be generated for. 10 to 30 is good enough. To backtest increase it to 2000 or 5000 for example.
3. Use Candle High/Low for confirmation instead of Candle Open/Close - More optimized entry and noise reduction. This option is now defaulted to false.
4. Show Green-Red-Green (bull) signals - Show only bull entries. Useful when I have a predefined view i.e, I know market is going to go up today.
5. Show Red-Green-Red (bear) signals - Show only bear entries. Useful when I have a predefined view i.e, I know market is going to go down today.
6. 3rd candle should be a Strong candle before considering 4th candle - This will enforce additional logic in 4 candle setup that the 3rd candle is the candle in our direction of breakout. This means something like GRGG is mandatory, which is still the default behaviour. If disabled, the 3rd candle can be any candle and 4th candle will act as our breakout candle. This behaviour has led to breakouts and breakdowns as times, hence I added this as a separate feature. Vice-versa for a RGGR.
For a 4 candle setup till now we were expecting GRGG or RGRR but we can let the system ignore the 3rd candle completely if needed.
This will result in additional signals.
7. Three intraday ranges added for index and stock traders - 1 min, 5 min and 15 min ranges will be displayed. These are disabled by default except 15 min. These are very important ranges and in sideways days the price will usually move within the 15 min. A breakout of this range and a positive signal can be a very powerful setup.
Safe traders can avoid taking a trade in this range as it can lead to fakeouts.
The line style, width, color and opacity are configurable.
Pointers/Golden Rules
1. If after taking the trade, the next candle moves in your direction and closes strong bullish or bearish, then move SL to break even and after that you can trail it.
2. If a upside trade hits SL and immediately a down side trade signal is generated on the next candle then take it. Vice versa is true.
3. Trades need to be taken on previous 2 candle's body high or low combined and not the wicks.
4. The most losses a trader takes is on a sideways day and because in our strategy the stop loss is so small that even on a sideways day we'll get out with a little profit or worst break even.
5. Hold trades for longer targets and don't panic.
6. If last 3-4 days have been sideways then there is a good probability that today will be trending so we can hold our trade for longer targets. Inverse is true when the market has been trending for 2-3 days then volatility followed by sideways is coming (DOW theory). Target to hold the trade for whole day and not exit till the day closes.
7. In general avoid trading in the middle of the day for index and stocks. Divide the day into 3 parts and avoid the middle.
8. Use Support/Resistance, 10, 20, 50, 200 EMA/SMA, Gaps, Whole/Round numbers(very imp) for identifying targets.
9. Trail your SL.
10. For indexes I would use 5 min and 15 min timeframe and at times 10 mins.
11. For commodities and crypto we can use higher timeframe as well. Look for signals during volatile time durations and avoid trading the whole day. Signal usually gives good targets on those times.
12. If a GRG or RGR pattern appears on a daily timeframe then this is our time to go big.
13. Minimum Risk to Reward should be 1:2 and for longer targets can be 1:4 to 1:10.
14. Trade with small lot size. Money management will happen automatically.
15. With small lot size and correct Risk-Reward we can be very profitable. Don't trade with big lot size.
16. Stay in the market for longer and collect points not money.
17. Very imp - Watch market and learn to generate a market view.
18. Very imp - Only 3 type of candles are needed in trading -
Strong Bullish (Big Green candle), Strong Bearish (Big Red candle),
Hammer (it is Strong Bullish), Inverse Hammer (it is Strong Bearish)
and Doji (indecision or confusion).
If on daily timeframe I see Strong Bullish candle previous day then I am biased to the upside the next day, if I see Strong Bearish candle the previous day then I am biased to the downside the next day, if I see Doji on the previous day then I am cautious the next day, if there are back to back Dojis forming in daily or weekly then I am preparing for big move so time to go big once I get the signal.
19. Most Important Candlestick pattern - Bullish and Bearish Engulfing
20. The only Chart patterns I need -
a) Falling Wedge/Channel Bullish Pattern Uptrend or Bull Flag - Buying - Forming over a couple days for intraday and forming over a couple of weeks for swing
b) Falling Wedge/Channel Bullish Pattern Downtrend or Falling Channel - Buying
c) Rising Wedge Bearish Pattern Uptrend or Rising Channel - Selling
d) Rising Wedge Bearish Pattern Downtrend or Bear flag - Selling
e) Head and Shoulder - Over a longer period not for intraday. In 15 min takes few days and for swing 1hr or 4h or daily can take few days
f) M and W pattern - Reversal Patterns - They form within the above 4 patterns, usually resulting in the break of trend line
21. How Gaps work -
a) Small Gap up in Uptrend - Market can fill the gap and reverse. The perception is that people are buying. If previous day candle was Strong Bullish then market view is up.
b) Big Gap up in Uptrend - Not news driven - Profit booking will come but may not fill the entire gap
c) Big Gap up in Uptrend - News driven, war related, tax, interest rate - Market can keep going up without stopping.
c) Flat opening in Uptrend - Big chance of market going up. If previous day candle was Strong Bullish then view is upwards, if it was Doji then still upwards.
d) Gap down in Uptrend - Market is surprised. After going down initially it can go up
e) Small Gap down in Downtrend - Market can fill the gap and keep moving down. If previous day candle was Strong Bearish then view is still down.
f) Flat opening in Downtrend - View is down, short today.
g) Big Gap down in Downtrend - Profit booking and foolish buying will come but market view is still down.
h) Gap down with News - Volatility, sideways then down.
i) Gap Up in Downtrend - Can move up - Price can move up during 2/3rd of the day and End of the day revert and close in red.
22. Go big on bearish days for option traders. Puts are better bought and Calls are better sold.
23. Cluster of green signals can lead to bigger move on the upside and vice versa for red signals.
24. Most of this is what I learned from successful traders (from the top 2%) only the indicator is mine.

Proxit Gold Strike V.1Unlock the Power of Smart Trading with Our Exclusive TradingView Template
This template is designed for traders who want a clear, structured, and effective approach to the markets. It combines the most reliable strategies into one easy-to-use system, giving you confidence in every trade you take.
✨ What’s Inside the Template:
Price Action Entry Conditions – Spot precise signals directly from market structure without relying on lagging indicators.
Reversal Points Detection – Identify potential turning points where smart money often takes action.
New EMA Strategy – A refined moving average setup that adapts to changing market conditions.
Support & Resistance Mapping – Automatic and accurate zones to guide your entries and exits.
SMC (Smart Money Concept) Integration – Gain deeper insights into liquidity zones and institutional footprints.
Pre-Defined Entry, TP & SL Levels – No guesswork, everything is laid out for you.
🔥 Why Traders Love This Template:
High Win Rate: Backtested with strong performance across different market conditions.
Easy to Use: No complicated setups – plug it in and start trading right away.
Clear & Reliable: Every signal comes with structured risk management for consistent results.
Whether you’re a beginner looking for guidance or an experienced trader wanting to refine your edge, this template helps you stay disciplined, confident, and profitable.
Take the guesswork out of trading and let this template guide you toward smarter decisions and better results.
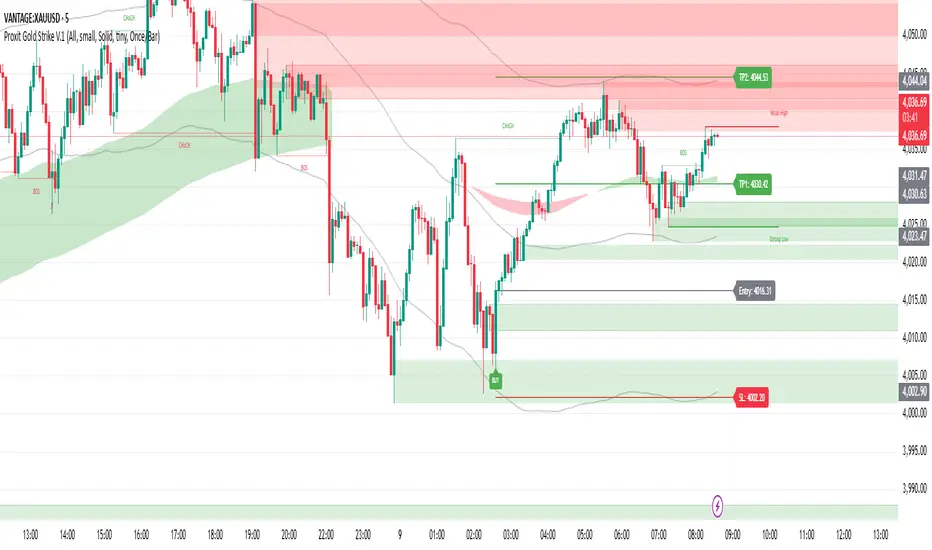
Force of Strategy (FoS, Multi TF/TA, Backtest, Alerts)Introducing the FoS Trading System
A comprehensive and innovative solution designed for both novice and experienced traders to enhance their intraday trading.
The basic idea of creating this script is to stay profitable in any market
Key Features:
There are over 25 no-repaint strategies for generating buy and sell signals to choose from
10 symbols for simultaneous trading
Webhook alerts in TTA format (tradingview to anywhere) pre-configured to send messages for trading cross-margin futures on major Crypto Exchanges: Binance, Bitget, BingX, Bybit, GateIO and OKX
A unique automated "Strategy switcher" feature for backtesting and live trading—not just a specific strategy, but the logic behind choosing a trading one or another strategy based on backtesting data obtained in real time
Advanced risk management options and backtest result metrics
Higher Timeframe filters (Technical Rating, ADX, Volatility) and ability for check backtest results with 9 main higher timeframes
Buy and sell signals are generated using TradingView Technical Ratings, indicators with adaptive length algorithms and various classic indicators with standard settings to avoid overfitting
Next, I will describe in detail what this script does and what settings it operates with:
"All Strategies" off
- In the global settings block, as shown in the main chart screenshot, you select how long the script will perform backtests in days, with a limitation on the number of bars for calculations. This limitation is necessary to maintain an acceptable calculation speed. You also choose which two higher timeframes we will use for signal and filters when confirming the opening of trades
- With "All Strategies" off - as in the example on the main chart screenshot, trading is carried out by strategy #1 on 10 selected tickers simultaneously. By default, I selected the 9 top-capitalized cryptocurrencies on the Bitget exchange and the chart symbol. You can change that choice of 9 non chart opened instruments and # strategy for each them
- The first row in the table 1 shows some of the main choosen script settings, in attached example: initial capital 20$, leverage 50L, 20 backtest days, 3$ is invest in one deal, 60m - is chart timeframe, next 60m is higher timeframe 1 and last 90m is higher timeframe 2. In first column you see shortened to 5 characters ticker names
- The exchange name in the second row determines the alert messages format
I've attached another example of trading with setting "All strategies" off in the image below. In this example, trading 10 standard symbols on an hourly timeframe, 2 coins from 10: 1000SATS and DOGE have generated a profit of over $65 over the past 20 days using strategy #4
Can you browse a wide range of trading instruments and select the 10 best strategies and settings for future trading? Of course, trading is what this script is do!
The parameters in the table 1 mean the following:
TR - count of closed trading deals
WR - Winning Rate, PF - Profit Factor
MDD - Max Draw Down for all calculated time from initial capital
R$ - trading profit result in usd
The parameters in the table 2 is just more metrics for chart symbol:
PT - result in usd Per one Trade
PW - result Per Win, PL - result Per Lose
ROI - Rate of Investments
SR - Sharpe Ratio, MR - CalMAR ration
Tx - Commision Fee in Usd
R$ - trading profit result in usd again
Table 2 separate trade results of backtesting for longs and shorts. In first column you see how many USD were invested in one trade, taking into account possible position splitting (will be discussed in more detail in the risk management section)
Settings:
"All Strategies" on, "Check Last" off
When "All Strategies" is active, trading changed from 10 symbols and one strategy to all strategies and one chart symbol. If option "Check Last" is inactive you will see backtest results for each of strategy in backtest setting days. This is useful, for example, if you want to see backtest results under different settings over a long period of time for calibrating risk management or entry rules
"All Strategies" on, "Check Last" on
- If "All Strategies" and "Check Last" is active trading will occur on the chart symbol only for those strategies that meet the criteria of the settings block for the enabled "All Strategies" option. For example your criteria is: for last 5 trades for all strategies, open next trade only on strategy which reached ROI 25% and WinRate 50%. When strategy with this setting criteria receive Buy or Sell Signal this trade will be opened, and when trade will be close "check last" will repeat. This feature i called "Strategy switcher"
-In Table 1 if strategy meet criteria you will see "Ok" label, if strategy meet criteria and have maximum from other reached ROI they labeled "Best". Chart strategy labeled "Chart", Chart and Ok labels in one time is "Chart+", "Chart" and "Best" is labeled "Best+"
- The color in the first column of table 1 indicates that the strategy is currently in an open position: green means an open long position, red means an open short position.
In picture bellow you will see good example for trading with check results for last 10 trades, and make desicion for trading when criteries 0.25 ROI and WinRate 50% reached for Top 2 by ROI strategies from all list of them. This example of trading logic in last 20 days (include periods when strategy don't arise 10 trades) give a profit $30+. At the bottom of the screen, you can see Labels with the numbers of the strategies that opened the trades. In this example, trades were primarily opened using strategy number 2, and the second most effective strategy after the 20-day backtest was strategy number 9
Who can promise you'll make a profit of $30 in the next 20 days with a drawdown of no more than $8 from the initial $20 with invest in one trade just 2.7$? No one. But this script guarantees that in the future it will repeat the same logic of switching trading strategies that brought profit over the last 20 days
Risk management options
- When a buy or sell trade is opened, you'll see three lines on the chart: a red stop-loss line (SL), a green take-profit line (TP), and a blue line representing the entry price. The trade will be closed if the high price or low price reaches the line TP or SL (no wait for bar close) and alert will be triggered once per bar when script recalculates
- Several options are available to control the behavior of SL/TP lines, such as stop-loss by percentage, ATR, or Highest High (HH) and Lowest Low (LL). Take Profit can be in percent, ATR or in Risk Reward ratio. There some Trailing Stop with start trail trigger options, like ATR, percent or HH / LL
- Additionally, in risk managment settings a function has been implemented for adding a position when the breakeven level expressed in the current ROI is reached for opened trade (splitting position). The position is added within the bar.
- Webhook alerts in TTA format with message contained next info : Buy / Sell or adding Quantity, Leverage, SL price, TP price and close trade
Keep in mind if the stop-loss changed when adding a position, the stop-loss will not be able to be higher than the current bar's low price, regardless of your settings, as backtest trades do not use intra-bar data, in this situation SL will be correct at next bar (but alert message don't be sended twice). And please note that this script does not have an option to simultaneously open trades in different directions. Only 1 trade can be opened for 1 trading instrument at a time
Backtest Engine
Backtest is a very important part of this script. Here describe how its calculate:
- Profit or Loss is USD: close trade price * open trade quantity - open trade price * open trade quantity - open trade quantity * (open trade price + close trade price)/2 * commision fee
Possible slippage or alert sending delay needed to be include in commission % which you will set in risk managment settings block, default settings is 0.15% (0,06% for open, 0,06% for close and 0,03% for possible slippage or additional fees)
- Maximum Draw Down: Drawdown = (peak - current equity) / peak * 100 ;
Drawdown > maxDrawdown ? maxDrawdown = Drawdown
- ROI: profit result in USD / sum of all positions margin
- CalMAR Ratio: ROI / (-MaxDrawDown)
- Sharpe Ratio: ROI / standard deviation for (Sum of all Profits and Loses) / (Sum of all Position Margins)
This description was added because in metrics i don't use parameters like "The risk-free rate of return". Keep in mind how exactly this script calculate profit and perfomance when adjusting key criteria in the strategy switching parameters block of script settings
Strategies itself
For trading, you can enable or disable various Higher Timeframes Filters (ADX, volatility, technical rating).
With filters enabled, trades will only open when the setting parameters are reached
- Strategy number 1, 2 and 3: is Higher Timeframe TradingView Technical Ratings itself, 1 is summary total rating, 2 is oscillators and 3 is moving averages. When TR filter cross filter levels trade will be open at chart bar close. By Default on chart you see Summary Technical Rating oscillator, but here the options for change it to Oscillator TR or Moving Average TR
- Strategy number 4, 5 and 6: is Chart TimeFrame TR. Trades will open when its values (Summary, Oscillators and Moving Averages) reached setting buy sell level
- Strategy number 7, 8 and 9: is Alternative buy sell logic for Chart TimeFrame TR, trades will open when counting rising or falling values will be reached
- Strategies with number from 10 to 18: is chosen by user adaptive moving averages and oscillators indicators. There in settings you will see many different adaptive length algorithms for trading and different types of moving averages and oscillators. In tooltips in settings you will find very more information, and in settings you will see list of all indicators and algorithms (more than 30 variations). All adaptive strategies have their options in settings for calibrating and plotting
- Strategies with number from 19: its can't be chosen or calibarted, this is needed for avoid overfitting, i try to found mostly time worked strategies and use its with standard settings. In future it's possible to changing current or adding additional strategies. At the time of publication this script uses: Dynamic Swing HH LL (19), Composite indicator (20), %R Exhausting with different signals (21,22,23), Pivot Point SuperTrend (24), Ichimoku Cloud (25), TSI (26), Fib Level RSI (27). I don't plot classic strategies in this script
Let me explain, the value of this script is not in the strategies it includes, but in how exactly it collects the results of their work, how it filters the opening of trades, what risk management it applies and what strategy switching logic it performs. The system itself that you are now reading about represents the main value of this script
Finally if you get access for this script
- You will see many other not described options and possibilities like Kelly position or list of settings for adaptive strategies, also i added many usefull tooltips in script settings
Happy trading, and stay tuned for updates!
DISCLAIMER: No sharing, copying, reselling, modifying, or any other forms of use are authorized for this script, and the information published with them. This script is strictly for individual use. No one know future and Investments are always made at your own risk. I am not responsible for any losses you may incur. Please before investment make sure that chosen logic is enaugh profitable on virtual demo account.
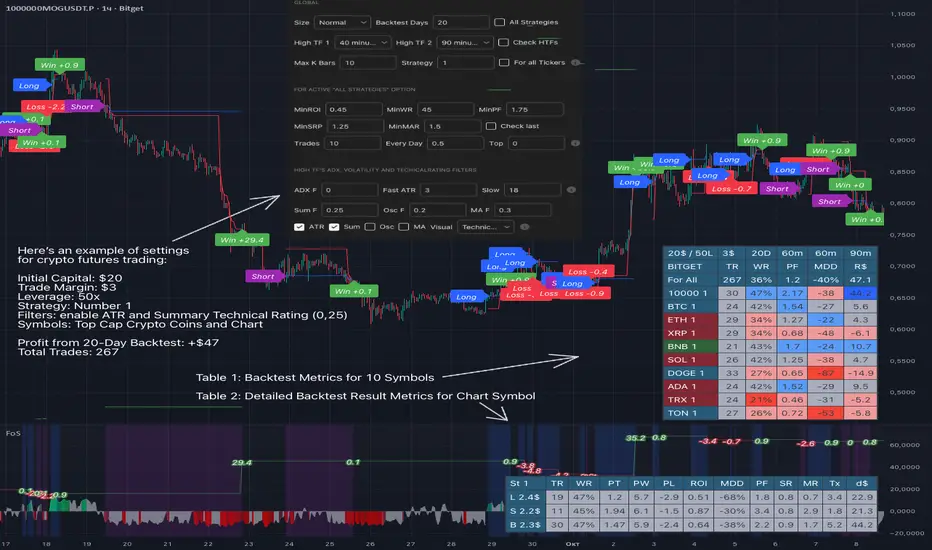
3/4-Bar GRG / RGR Pattern (Conditional 4th Candle)This indicator can be used to identify the Green-Red-Green or Red-Green-Red pattern.
It is a price action indicator where a price action which identifies the defeat of buyers and sellers.
If the buyers comprehensively defeat the sellers then the price moves up and if the sellers defeat the buyers then the price moves down.
In my trading experience this is what defines the price movement.
It is a 3 or 4 candle pattern, beyond that i.e, 5 or more candles could mean a very sideways market and unnecessary signal generation.
How does it work?
Upside/Green signal
Say candle 1 is Green, which means buyers stepped in, then candle 2 is Red or a Doji, that means sellers brought the price down. Then if candle 3 is forming to be Green and breaks the closing of the 1st candle and opening of the 2nd candle, then a green arrow will appear and that is the place where you want to take your trade.
Here the buyers defeated the sellers.
Sometimes candle 3 falls short but candle 4 breaks candle 1's closing and candle 2's opening price. We can enter on candle 4.
Important - We need to enter the trade as soon as the price moves above the candle 1 and 2's body and should not wait for the 3rd or 4th candle to close. Ignore wicks.
I have restricted it to 4 candles and that is all that is needed. More than that is a longer sideways market.
I call it the +-+ or GRG pattern.
Stop loss can be candle 2's mid for safe traders (that includes me) or candle 2's body low for risky traders.
Back testing suggests that body low will be useless and result in more points in loss because for the bigger move this point will not be touched, so why not get out faster.
Downside/Red signal
Say candle 1 is Red, which means sellers stepped in, then candle 2 is Green or a Doji, that means buyers took the price up. Then if candle 3 is forming to be Red and breaks the closing of the 1st candle and opening of the 2nd candle then a Red arrow will appear and that is the place where you want to take your trade.
Sometimes candle 3 falls short but candle 4 breaks candle 1's closing and candle 2's opening price. We can enter on candle 4.
We need to enter the trade as soon as the price moves below the candle 1 and 2's body and should not wait for the 3rd or 4th candle to close.
I have restricted it to 4 candles and that is all that is needed. More than that is a longer sideways market.
I call it the -+- or RGR pattern.
Stop loss can be candle 2's mid for safe traders ( that includes me) or candle 2's body high for risky traders.
Back testing suggests that body high will be useless and result in more points in loss because for the bigger move this point will not be touched, so why not get out faster.
Important Settings
You can enable or disable the 4th candle signal to avoid the noise, but at times I have noticed that the 4th candle gives a very strong signal or I can say that the strong signal falls on the 4th candle. This is mostly a coincidence.
You can also configure how many previous bars should the signal be generated for. 10 to 30 is good enough. To backtest increase it to 2000 or 5000 for example.
Rest are self explanatory.
Pointers
If after taking the trade, the next candle moves in your direction and closes strong bullish or bearish, then move SL to break even and after that you can trail it.
If a upside trade hits SL and immediately a down side trade signal is generated on the next candle then take it. Vice versa is true.
Trades need to be taken on previous 2 candle's body high or low combined and not the wicks.
The most losses a trader takes is on a sideways day and because in our strategy the stop loss is so small that even on a sideways day we'll get out with a little profit or worst break even.
Hold targets for longer targets and don't panic.
If last 3-4 days have been sideways then there is a good probability that day will be trending so we can hold our trade for longer targets. Target to hold the trade for whole day and not exit till the day closes.
In general avoid trading in the middle of the day for index and stocks. Divide the day into 3 parts and avoid the middle.
Use Support/Resistance, 10, 20, 50, 200 EMA/SMA, Gaps, Whole/Round numbers(very imp) for identifying targets.
Trail your SL.
For indexes I would use 5 min and 15 min timeframe.
For commodities and crypto we can use higher timeframe as well. Look for signals during volatile time durations and avoid trading the whole day. Signal usually gives good targets on those times.
If a GRG or RGR pattern appears on a daily timeframe then this is our time to go big.
Minimum Risk to Reward should be 1:2 and for longer targets can be 1:4 to 1:10.
Trade with small lot size. Money management will happen automatically.
With small lot size and correct Risk-Re ward we can be very profitable. Don't trade with big lot size.
Stay in the market for longer and collect points not money.
Very imp - Watch market and learn to generate a market view.
Very imp - Only 4 candles are needed in trading - strong bullish, strong bearish, hammer, inverse hammer and doji.
Go big on bearish days for option traders. Puts are better bought and Calls are better sold.
Cluster of green signals can lead to bigger move on the upside and vice versa for red signals.
Most of this is what I learned from successful traders (from the top 2%) only the indicator is mine.

Lakshmi - Vajra Energy Signal (VES)Vajra Energy Signal (VES) is an advanced volume analysis indicator that detects energy accumulated inside the market.
When assessing the strength of trading activity, conventional practice looks at the magnitude of volume; VES is designed with the understanding that the same volume can have different meanings depending on the price range.
VES analyzes the complex relationship between price movement and volume with a proprietary algorithm and can detect internal market activities that are invisible from surface‑level price action, visualizing the characteristic whereby the value rises before a breakout.
In other words, VES views the market as an “energy system.” In the energy accumulation phase, relatively high volume occurs relative to the price range, and in the energy release phase, the stored energy is emitted as high volatility in price, that is, a breakout—this is the core concept on which VES is established.
⚡️ Basic Demonstration
i.imgur.com
As you can see in the image above, VES simply displays the highs and lows of energy stored in the market as a thin line in a separate panel.
It is easy for traders to understand its intuitive patterns: it rises when hidden buying accumulation or selling activity continue and sink when a price breakout occurs. It can be applied across symbols and markets (stocks, commodities, cryptocurrencies, spot, and futures). While reducing clutter in price scale labels, it also supports dynamic autoscaling.
⚡️ Practical Usage
VES is expected to be used for the following purposes.
- Entry signal
When the VES value continues to rise—i.e., during energy accumulation—it can be considered on standby for a breakout. After a breakout, a trader can confirm the trend direction and enter.
- Exit signal
If the VES value rises during a trend, consider the possibility of a reversal and consider taking profits.
- Risk management
If the VES value remains elevated for a long period, regard it as increased market uncertainty and an approaching breakout; adopt a cautious trading strategy to prepare for higher volatility and adjust position size.
For example, in the BINANCE:SOLUSDT daily chart below, VES clearly shows how it functions in short‑term trading.
i.imgur.com
In September 2023, when the price was moving around 20 USDT, VES formed frequent small spikes. These early spikes suggest that market participants were still in a wait‑and‑see mode and that small‑scale accumulation was being conducted intermittently.
A decisive change came in early October 2023. While the price still stagnated in the 20–25 USDT range, VES suddenly formed a huge spike. The scale of this spike was far larger than those in September 2023, clearly suggesting that hidden substantial trading activities by large investors had begun.
In mid‑October 2023, the price began to rise. It climbed stepwise from 25 USDT to 40 USDT, then to 60 USDT and 75 USDT, and then surged to above 120 USDT within just a few weeks. This suggests that the energy built in the buy accumulation phase in early October 2023 was converted into price appreciation.
Therefore, after such a large VES signal is observed and the price breaks upward, entering a long position could have been profitable.
A large VES reaction is not only a quiet “buy signal” as in the example above; it can also be a “sell signal.” Such a case is explained below using an example on the BTC chart.
i.imgur.com
This BITSTAMP:BTCUSD 4‑hour chart is a valuable example showing how VES detects top formation on a short timeframe. In the first half of February 2024, the price moved in a relatively narrow 96,000–99,000 USD range. During this period, VES remained stable at low levels, and the market continued a calm uptrend.
The first sign appeared on February 16, 2024. While the price still held around 97,000 USD, VES formed a clearly identifiable small spike. This implied that some large investors had begun to take profits, or that new sellers had started to build short positions. However, at that point, the impact on price was limited, and many traders may have overlooked the signal.
The decisive turning point came on February 23, 2024. With the price moving around 98,000 USD, VES suddenly formed a huge spike. The scale of this spike was far larger than previous moves, clearly indicating that significant energy was accumulating.
Importantly, even at this moment the price still remained at the highs. On the surface, price barely moved and the bull trend appeared intact, but VES detected a major internal change underway.
On February 24, 2024, the price collapsed and began to fall. It dropped about 15% from 97,000 USD to 82,000 USD in a few days. The speed and magnitude of this decline corroborated the quiet “sell signal” indicated by the VES spikes.
The key lesson from this chart is that a VES spike does not necessarily mean buy accumulation. A large VES spike formed at high prices may instead indicate a distribution phase—that is, large investors exiting or building short positions. When the price is at elevated levels, a VES spike should be considered not only as a precursor to further upside but also as a warning of potential downside.
From a trading‑strategy perspective, the huge VES spike on February 23, 2024 was a clear signal to exit or to consider entering short positions. At that point, traders should have either closed long positions or to consider building a short position. The moment when price started to decline from its peak was exactly the entry timing for a short.
On the 4‑hour timeframe, changes in VES appear faster and more dramatically. While this allows more agile responses, the risk of false signals is also higher; therefore, confirmation on other timeframes and comprehensive judgment with price action are essential.
VES is a powerful tool for reading internal market activities, and this chart clearly shows that its interpretation requires flexibility that takes into account market conditions and price location.
⚡️ Parameter Settings
Strength 1: The lower the number, the more it emphasizes responses closer to the present timeframe; the higher the number, the more it emphasizes responses farther from the present timeframe. 5 is recommended.
Strength 2: The lower the number, the greater the volatility of the value; the higher the number, the smaller the volatility. 5 is recommended.
Scale: Adjusts the display scale. −30 is recommended.
⚡️ Conclusion
Vajra Energy Signal (VES) visualizes the cycle of energy accumulation in the market from the relative relationship between price range and volume, detecting hidden activities by market participants that conventional volume analysis cannot capture. VES serves as a powerful auxiliary tool for early detection of turning points, enabling deeper market understanding and more accurate timing decisions. As the examples show, there is a possibility of sensing major price movements in advance. When using VES, flexible interpretation according to market environment and price location is required, and it demonstrates its true value when combined with price action and other analysis methods such as support/resistance.
⚡️ Important Notes
- VES is a tool that infers internal market energy; it does not guarantee trades or suggest future results.
- We strongly recommend using it together with price action analysis and support/resistance.
- Confirmation across different timeframes improves reliability.
- Effectiveness may vary depending on market conditions and liquidity.
- Very illiquid instruments or newly listed assets may produce more noise.
⚡️ How to Get Access
This indicator is Public Invite‑Only. If you would like access, please apply by following the Author’s Instructions.

Multi-Symbol Volatility Tracker with Range DetectionMulti-Symbol Volatility Tracker with Range Detection
🎯 Main Purpose:
This indicator is specifically designed for scalpers to quickly identify symbols with high volatility that are currently in ranging conditions . It helps you spot the perfect opportunities for buying at lows and selling at highs repeatedly within the same trading session.
📊 Table Data Explanation:
The indicator displays a comprehensive table with 5 columns for 4 major symbols (GOLD, SILVER, NASDAQ, SP500):
SYMBOL: The trading instrument being analyzed
VOLATILITY: Color-coded volatility levels (NORMAL/HIGH/EXTREME) based on ATR values
Last Candle %: The percentage range of the most recent 5-minute candle
Last 5 Candle Avg %: Average percentage range over the last 5 candles
RANGE: Shows "YES" (blue) or "NO" (gray) indicating if the symbol is currently ranging
🔍 How to Identify Trading Opportunities:
Look for symbols that combine these characteristics:
RANGE column shows "YES" (highlighted in blue) - This means the symbol is moving sideways, perfect for range trading
VOLATILITY shows "HIGH" or "EXTREME" - Ensures there's enough movement for profitable scalping
Higher candlestick percentages - Indicates larger candle ranges, meaning more profit potential per trade
⚡ Optimal Usage:
Best Timeframe: Works optimally on 5-minute charts where the ranging patterns are most reliable for scalping
Trading Strategy: When you find a symbol with "YES" in the RANGE column, switch to that symbol and look for opportunities to buy near the lows and sell near the highs of the ranging pattern
Risk Management: Higher volatility symbols offer more profit potential but require tighter risk management
⚙️ Settings:
ATR Length: Adjusts the Average True Range calculation period (default: 14)
Range Sensitivity: Fine-tune range detection sensitivity (0.1-2.0, lower = more sensitive)
💡 Pro Tips:
The indicator updates in real-time, so monitor for symbols switching from "NO" to "YES" in the RANGE column
Combine HIGH/EXTREME volatility with RANGE: YES for the most profitable scalping setups
Use the candlestick percentages to gauge potential profit per trade - higher percentages mean more movement
The algorithm uses advanced statistical analysis including standard deviation, linear regression slopes, and range efficiency to accurately detect ranging conditions
Perfect for day traders and scalpers who want to quickly identify which symbols offer the best ranging opportunities for consistent buy-low, sell-high strategies.

Copeland Dynamic Dominance Matrix System | GForgeCopeland Dynamic Dominance Matrix System | GForge - v1
---
📊 COMPREHENSIVE SYSTEM OVERVIEW
The GForge Dynamic BB% TrendSync System represents a revolutionary approach to algorithmic portfolio management, combining cutting-edge statistical analysis, momentum detection, and regime identification into a unified framework. This system processes up to 39 different cryptocurrency assets simultaneously, using advanced mathematical models to determine optimal capital allocation across dynamic market conditions.
Core Innovation: Multi-Dimensional Analysis
Unlike traditional single-asset indicators, this system operates on multiple analytical dimensions:
Momentum Analysis: Dual Bollinger Band Modified Deviation (DBBMD) calculations
Relative Strength: Comprehensive dominance matrix with head-to-head comparisons
Fundamental Screening: Alpha and Beta statistical filtering
Market Regime Detection: Five-component statistical testing framework
Portfolio Optimization: Dynamic weighting and allocation algorithms
Risk Management: Multi-layered protection and regime-based positioning
---
🔧 DETAILED COMPONENT BREAKDOWN
1. Dynamic Bollinger Band % Modified Deviation Engine (DBBMD)
The foundation of this system is an advanced oscillator that combines two independent Bollinger Band systems with asymmetric parameters to create unique momentum readings.
Technical Implementation:
[
// BB System 1: Fast-reacting with extended standard deviation
primary_bb1_ma_len = 40 // Shorter MA for responsiveness
primary_bb1_sd_len = 65 // Longer SD for stability
primary_bb1_mult = 1.0 // Standard deviation multiplier
// BB System 2: Complementary asymmetric design
primary_bb2_ma_len = 8 // Longer MA for trend following
primary_bb2_sd_len = 66 // Shorter SD for volatility sensitivity
primary_bb2_mult = 1.7 // Wider bands for reduced noise
Key Features:
Asymmetric Design: The intentional mismatch between MA and Standard Deviation periods creates unique oscillation characteristics that traditional Bollinger Bands cannot achieve
Percentage Scale: All readings are normalized to 0-100% scale for consistent interpretation across assets
Multiple Combination Modes:
BB1 Only: Fast/reactive system
BB2 Only: Smooth/stable system
Average: Balanced blend (recommended)
Both Required: Conservative (both must agree)
Either One: Aggressive (either can trigger)
Mean Deviation Filter: Additional volatility-based layer that measures the standard deviation of the DBBMD% itself, creating dynamic trigger bands
Signal Generation Logic:
// Primary thresholds
primary_long_threshold = 71 // DBBMD% level for bullish signals
primary_short_threshold = 33 // DBBMD% level for bearish signals
// Mean Deviation creates dynamic bands around these thresholds
upper_md_band = combined_bb + (md_mult * bb_std)
lower_md_band = combined_bb - (md_mult * bb_std)
// Signal triggers when DBBMD crosses these dynamic bands
long_signal = lower_md_band > long_threshold
short_signal = upper_md_band < short_threshold
For more information on this BB% indicator, find it here:
2. Revolutionary Dominance Matrix System
This is the system's most sophisticated innovation - a comprehensive framework that compares every asset against every other asset to determine relative strength hierarchies.
Mathematical Foundation:
The system constructs a mathematical matrix where each cell represents whether asset i dominates asset j:
// Core dominance matrix (39x39 for maximum assets)
var matrix dominance_matrix = matrix.new(39, 39, 0)
// For each qualifying asset pair (i,j):
for i = 0 to active_count - 1
for j = 0 to active_count - 1
if i != j
// Calculate price ratio BB% TrendSync for asset_i/asset_j
ratio_array = calculate_price_ratios(asset_i, asset_j)
ratio_dbbmd = calculate_dbbmd(ratio_array)
// Asset i dominates j if ratio is in uptrend
if ratio_dbbmd_state == 1
matrix.set(dominance_matrix, i, j, 1)
Copeland Scoring Algorithm:
Each asset receives a dominance score calculated as:
Dominance Score = Total Wins - Total Losses
// Calculate net dominance for each asset
for i = 0 to active_count - 1
wins = 0
losses = 0
for j = 0 to active_count - 1
if i != j
if matrix.get(dominance_matrix, i, j) == 1
wins += 1
else
losses += 1
copeland_score = wins - losses
array.set(dominance_scores, i, copeland_score)
Head-to-Head Analysis Process:
Ratio Construction: For each asset pair, calculate price_asset_A / price_asset_B
DBBMD Application: Apply the same DBBMD analysis to these ratios
Trend Determination: If ratio DBBMD shows uptrend, Asset A dominates Asset B
Matrix Population: Store dominance relationships in mathematical matrix
Score Calculation: Sum wins minus losses for final ranking
This creates a tournament-style ranking where each asset's strength is measured against all others, not just against a benchmark.
3. Advanced Alpha & Beta Filtering System
The system incorporates fundamental analysis through Capital Asset Pricing Model (CAPM) calculations to filter assets based on risk-adjusted performance.
Alpha Calculation (Excess Return Analysis):
// CAPM Alpha calculation
f_calc_alpha(asset_prices, benchmark_prices, alpha_length, beta_length, risk_free_rate) =>
// Calculate asset and benchmark returns
asset_returns = calculate_returns(asset_prices, alpha_length)
benchmark_returns = calculate_returns(benchmark_prices, alpha_length)
// Get beta for expected return calculation
beta = f_calc_beta(asset_prices, benchmark_prices, beta_length)
// Average returns over period
avg_asset_return = array_average(asset_returns) * 100
avg_benchmark_return = array_average(benchmark_returns) * 100
// Expected return using CAPM: E(R) = Beta * Market_Return + Risk_Free_Rate
expected_return = beta * avg_benchmark_return + risk_free_rate
// Alpha = Actual Return - Expected Return
alpha = avg_asset_return - expected_return
Beta Calculation (Volatility Relationship):
// Beta measures how much an asset moves relative to benchmark
f_calc_beta(asset_prices, benchmark_prices, length) =>
// Calculate return series for both assets
asset_returns =
benchmark_returns =
// Populate return arrays
for i = 0 to length - 1
asset_return = (current_price - previous_price) / previous_price
benchmark_return = (current_bench - previous_bench) / previous_bench
// Calculate covariance and variance
covariance = calculate_covariance(asset_returns, benchmark_returns)
benchmark_variance = calculate_variance(benchmark_returns)
// Beta = Covariance(Asset, Market) / Variance(Market)
beta = covariance / benchmark_variance
Filtering Applications:
Alpha Filter: Only includes assets with alpha above specified threshold (e.g., >0.5% monthly excess return)
Beta Filter: Screens for desired volatility characteristics (e.g., beta >1.0 for aggressive assets)
Combined Screening: Both filters must pass for asset qualification
Dynamic Thresholds: User-configurable parameters for different market conditions
4. Intelligent Tie-Breaking Resolution System
When multiple assets have identical dominance scores, the system employs sophisticated methods to determine final rankings.
Standard Tie-Breaking Hierarchy:
// Primary tie-breaking logic
if score_i == score_j // Tied dominance scores
// Level 1: Compare Beta values (higher beta wins)
beta_i = array.get(beta_values, i)
beta_j = array.get(beta_values, j)
if beta_j > beta_i
swap_positions(i, j)
else if beta_j == beta_i
// Level 2: Compare Alpha values (higher alpha wins)
alpha_i = array.get(alpha_values, i)
alpha_j = array.get(alpha_values, j)
if alpha_j > alpha_i
swap_positions(i, j)
Advanced Tie-Breaking (Head-to-Head Analysis):
For the top 3 performers, an enhanced tie-breaking mechanism analyzes direct head-to-head price ratio performance:
// Advanced tie-breaker for top performers
f_advanced_tiebreaker(asset1_idx, asset2_idx, lookback_period) =>
// Calculate price ratio over lookback period
ratio_history =
for k = 0 to lookback_period - 1
price_ratio = price_asset1 / price_asset2
array.push(ratio_history, price_ratio)
// Apply simplified trend analysis to ratio
current_ratio = array.get(ratio_history, 0)
average_ratio = calculate_average(ratio_history)
// Asset 1 wins if current ratio > average (trending up)
if current_ratio > average_ratio
return 1 // Asset 1 dominates
else
return -1 // Asset 2 dominates
5. Five-Component Aggregate Market Regime Filter
This sophisticated framework combines multiple statistical tests to determine whether market conditions favor trending strategies or require defensive positioning.
Component 1: Augmented Dickey-Fuller (ADF) Test
Tests for unit root presence to distinguish between trending and mean-reverting price series.
// Simplified ADF implementation
calculate_adf_statistic(price_series, lookback) =>
// Calculate first differences
differences =
for i = 0 to lookback - 2
diff = price_series - price_series
array.push(differences, diff)
// Statistical analysis of differences
mean_diff = calculate_mean(differences)
std_diff = calculate_standard_deviation(differences)
// ADF statistic approximation
adf_stat = mean_diff / std_diff
// Compare against threshold for trend determination
is_trending = adf_stat <= adf_threshold
Component 2: Directional Movement Index (DMI)
Classic Wilder indicator measuring trend strength through directional movement analysis.
// DMI calculation for trend strength
calculate_dmi_signal(high_data, low_data, close_data, period) =>
// Calculate directional movements
plus_dm_sum = 0.0
minus_dm_sum = 0.0
true_range_sum = 0.0
for i = 1 to period
// Directional movements
up_move = high_data - high_data
down_move = low_data - low_data
// Accumulate positive/negative movements
if up_move > down_move and up_move > 0
plus_dm_sum += up_move
if down_move > up_move and down_move > 0
minus_dm_sum += down_move
// True range calculation
true_range_sum += calculate_true_range(i)
// Calculate directional indicators
di_plus = 100 * plus_dm_sum / true_range_sum
di_minus = 100 * minus_dm_sum / true_range_sum
// ADX calculation
dx = 100 * math.abs(di_plus - di_minus) / (di_plus + di_minus)
adx = dx // Simplified for demonstration
// Trending if ADX above threshold
is_trending = adx > dmi_threshold
Component 3: KPSS Stationarity Test
Complementary test to ADF that examines stationarity around trend components.
// KPSS test implementation
calculate_kpss_statistic(price_series, lookback, significance_level) =>
// Calculate mean and variance
series_mean = calculate_mean(price_series, lookback)
series_variance = calculate_variance(price_series, lookback)
// Cumulative sum of deviations
cumulative_sum = 0.0
cumsum_squared_sum = 0.0
for i = 0 to lookback - 1
deviation = price_series - series_mean
cumulative_sum += deviation
cumsum_squared_sum += math.pow(cumulative_sum, 2)
// KPSS statistic
kpss_stat = cumsum_squared_sum / (lookback * lookback * series_variance)
// Compare against critical values
critical_value = significance_level == 0.01 ? 0.739 :
significance_level == 0.05 ? 0.463 : 0.347
is_trending = kpss_stat >= critical_value
Component 4: Choppiness Index
Measures market directionality using fractal dimension analysis of price movement.
// Choppiness Index calculation
calculate_choppiness(price_data, period) =>
// Find highest and lowest over period
highest = price_data
lowest = price_data
true_range_sum = 0.0
for i = 0 to period - 1
if price_data > highest
highest := price_data
if price_data < lowest
lowest := price_data
// Accumulate true range
if i > 0
true_range = calculate_true_range(price_data, i)
true_range_sum += true_range
// Choppiness calculation
range_high_low = highest - lowest
choppiness = 100 * math.log10(true_range_sum / range_high_low) / math.log10(period)
// Trending if choppiness below threshold (typically 61.8)
is_trending = choppiness < 61.8
Component 5: Hilbert Transform Analysis
Phase-based cycle detection and trend identification using mathematical signal processing.
// Hilbert Transform trend detection
calculate_hilbert_signal(price_data, smoothing_period, filter_period) =>
// Smooth the price data
smoothed_price = calculate_moving_average(price_data, smoothing_period)
// Calculate instantaneous phase components
// Simplified implementation for demonstration
instant_phase = smoothed_price
delayed_phase = calculate_moving_average(price_data, filter_period)
// Compare instantaneous vs delayed signals
phase_difference = instant_phase - delayed_phase
// Trending if instantaneous leads delayed
is_trending = phase_difference > 0
Aggregate Regime Determination:
// Combine all five components
regime_calculation() =>
trending_count = 0
total_components = 0
// Test each enabled component
if enable_adf and adf_signal == 1
trending_count += 1
if enable_adf
total_components += 1
// Repeat for all five components...
// Calculate trending proportion
trending_proportion = trending_count / total_components
// Market is trending if proportion above threshold
regime_allows_trading = trending_proportion >= regime_threshold
The system only allows asset positions when the specified percentage of components indicate trending conditions. During choppy or mean-reverting periods, the system automatically positions in USD to preserve capital.
6. Dynamic Portfolio Weighting Framework
Six sophisticated allocation methodologies provide flexibility for different market conditions and risk preferences.
Weighting Method Implementations:
1. Equal Weight Distribution:
// Simple equal allocation
if weighting_mode == "Equal Weight"
weight_per_asset = 1.0 / selection_count
for i = 0 to selection_count - 1
array.push(weights, weight_per_asset)
2. Linear Dominance Scaling:
// Linear scaling based on dominance scores
if weighting_mode == "Linear Dominance"
// Normalize scores to 0-1 range
min_score = array.min(dominance_scores)
max_score = array.max(dominance_scores)
score_range = max_score - min_score
total_weight = 0.0
for i = 0 to selection_count - 1
score = array.get(dominance_scores, i)
normalized = (score - min_score) / score_range
weight = 1.0 + normalized * concentration_factor
array.push(weights, weight)
total_weight += weight
// Normalize to sum to 1.0
for i = 0 to selection_count - 1
current_weight = array.get(weights, i)
array.set(weights, i, current_weight / total_weight)
3. Conviction Score (Exponential):
// Exponential scaling for high conviction
if weighting_mode == "Conviction Score"
// Combine dominance score with DBBMD strength
conviction_scores =
for i = 0 to selection_count - 1
dominance = array.get(dominance_scores, i)
dbbmd_strength = array.get(dbbmd_values, i)
conviction = dominance + (dbbmd_strength - 50) / 25
array.push(conviction_scores, conviction)
// Exponential weighting
total_weight = 0.0
for i = 0 to selection_count - 1
conviction = array.get(conviction_scores, i)
normalized = normalize_score(conviction)
weight = math.pow(1 + normalized, concentration_factor)
array.push(weights, weight)
total_weight += weight
// Final normalization
normalize_weights(weights, total_weight)
Advanced Features:
Minimum Position Constraint: Prevents dust allocations below specified threshold
Concentration Factor: Adjustable parameter controlling weight distribution aggressiveness
Dominance Boost: Extra weight for assets exceeding specified dominance thresholds
Dynamic Rebalancing: Automatic weight recalculation on portfolio changes
7. Intelligent USD Management System
The system treats USD as a competing asset with its own dominance score, enabling sophisticated cash management.
USD Scoring Methodologies:
Smart Competition Mode (Recommended):
f_calculate_smart_usd_dominance() =>
usd_wins = 0
// USD beats assets in downtrends or weak uptrends
for i = 0 to active_count - 1
asset_state = get_asset_state(i)
asset_dbbmd = get_asset_dbbmd(i)
// USD dominates shorts and weak longs
if asset_state == -1 or (asset_state == 1 and asset_dbbmd < long_threshold)
usd_wins += 1
// Calculate Copeland-style score
base_score = usd_wins - (active_count - usd_wins)
// Boost during weak market conditions
qualified_assets = count_qualified_long_assets()
if qualified_assets <= active_count * 0.2
base_score := math.round(base_score * usd_boost_factor)
base_score
Auto Short Count Mode:
// USD dominance based on number of bearish assets
usd_dominance = count_assets_in_short_state()
// Apply boost during low activity
if qualified_long_count <= active_count * 0.2
usd_dominance := usd_dominance * usd_boost_factor
Regime-Based USD Positioning:
When the five-component regime filter indicates unfavorable conditions, the system automatically overrides all asset signals and positions 100% in USD, protecting capital during choppy markets.
8. Multi-Asset Infrastructure & Data Management
The system maintains comprehensive data structures for up to 39 assets simultaneously.
Data Collection Framework:
// Full OHLC data matrices (200 bars depth for performance)
var matrix open_data = matrix.new(39, 200, na)
var matrix high_data = matrix.new(39, 200, na)
var matrix low_data = matrix.new(39, 200, na)
var matrix close_data = matrix.new(39, 200, na)
// Real-time data collection
if barstate.isconfirmed
for i = 0 to active_count - 1
ticker = array.get(assets, i)
= request.security(ticker, timeframe.period,
[open , high , low , close ],
lookahead=barmerge.lookahead_off)
// Store in matrices with proper shifting
matrix.set(open_data, i, 0, nz(o, 0))
matrix.set(high_data, i, 0, nz(h, 0))
matrix.set(low_data, i, 0, nz(l, 0))
matrix.set(close_data, i, 0, nz(c, 0))
Asset Configuration:
The system comes pre-configured with 39 major cryptocurrency pairs across multiple exchanges:
Major Pairs: BTC, ETH, XRP, SOL, DOGE, ADA, etc.
Exchange Coverage: Binance, KuCoin, MEXC for optimal liquidity
Configurable Count: Users can activate 2-39 assets based on preferences
Custom Tickers: All asset selections are user-modifiable
---
⚙️ COMPREHENSIVE CONFIGURATION GUIDE
Portfolio Management Settings
Maximum Portfolio Size (1-10):
Conservative (1-2): High concentration, captures strong trends
Balanced (3-5): Moderate diversification with trend focus
Diversified (6-10): Lower concentration, broader market exposure
Dominance Clarity Threshold (0.1-1.0):
Low (0.1-0.4): Prefers diversification, holds multiple assets frequently
Medium (0.5-0.7): Balanced approach, context-dependent allocation
High (0.8-1.0): Concentration-focused, single asset preference
Signal Generation Parameters
DBBMD Thresholds:
// Standard configuration
primary_long_threshold = 71 // Conservative: 75+, Aggressive: 65-70
primary_short_threshold = 33 // Conservative: 25-30, Aggressive: 35-40
// BB System parameters
bb1_ma_len = 40 // Fast system: 20-50
bb1_sd_len = 65 // Stability: 50-80
bb2_ma_len = 8 // Trend: 60-100
bb2_sd_len = 66 // Sensitivity: 10-20
Risk Management Configuration
Alpha/Beta Filters:
Alpha Threshold: 0.0-2.0% (higher = more selective)
Beta Threshold: 0.5-2.0 (1.0+ for aggressive assets)
Calculation Periods: 20-50 bars (longer = more stable)
Regime Filter Settings:
Trending Threshold: 0.3-0.8 (higher = stricter trend requirements)
Component Lookbacks: 30-100 bars (balance responsiveness vs stability)
Enable/Disable: Individual component control for customization
---
📊 PERFORMANCE TRACKING & VISUALIZATION
Real-Time Dashboard Features
The compact dashboard provides essential information:
Current Holdings: Asset names and allocation percentages
Dominance Score: Current position's relative strength ranking
Active Assets: Qualified long signals vs total asset count
Returns: Total portfolio performance percentage
Maximum Drawdown: Peak-to-trough decline measurement
Trade Count: Total portfolio transitions executed
Regime Status: Current market condition assessment
Comprehensive Ranking Table
The left-side table displays detailed asset analysis:
Ranking Position: Numerical order by dominance score
Asset Symbol: Clean ticker identification with color coding
Dominance Score: Net wins minus losses in head-to-head comparisons
Win-Loss Record: Detailed breakdown of dominance relationships
DBBMD Reading: Current momentum percentage with threshold highlighting
Alpha/Beta Values: Fundamental analysis metrics when filters enabled
Portfolio Weight: Current allocation percentage in signal portfolio
Execution Status: Visual indicator of actual holdings vs signals
Visual Enhancement Features
Color-Coded Assets: 39 distinct colors for easy identification
Regime Background: Red tinting during unfavorable market conditions
Dynamic Equity Curve: Portfolio value plotted with position-based coloring
Status Indicators: Symbols showing execution vs signal states
---
🔍 ADVANCED TECHNICAL FEATURES
State Persistence System
The system maintains asset states across bars to prevent excessive switching:
// State tracking for each asset and ratio combination
var array asset_states = array.new(1560, 0) // 39 * 40 ratios
// State changes only occur on confirmed threshold breaks
if long_crossover and current_state != 1
current_state := 1
array.set(asset_states, asset_index, 1)
else if short_crossover and current_state != -1
current_state := -1
array.set(asset_states, asset_index, -1)
Transaction Cost Integration
Realistic modeling of trading expenses:
// Transaction cost calculation
transaction_fee = 0.4 // Default 0.4% (fees + slippage)
// Applied on portfolio transitions
if should_execute_transition
was_holding_assets = check_current_holdings()
will_hold_assets = check_new_signals()
// Charge fees for meaningful transitions
if transaction_fee > 0 and (was_holding_assets or will_hold_assets)
fee_amount = equity * (transaction_fee / 100)
equity -= fee_amount
total_fees += fee_amount
Dynamic Memory Management
Optimized data structures for performance:
200-Bar History: Sufficient for calculations while maintaining speed
Matrix Operations: Efficient storage and retrieval of multi-asset data
Array Recycling: Memory-conscious data handling for long-running backtests
Conditional Calculations: Skip unnecessary computations during initialization
12H 30 assets portfolio
---
🚨 SYSTEM LIMITATIONS & TESTING STATUS
CURRENT DEVELOPMENT PHASE: ACTIVE TESTING & OPTIMIZATION
This system represents cutting-edge algorithmic trading technology but remains in continuous development. Key considerations:
Known Limitations:
Requires significant computational resources for 39-asset analysis
Performance varies significantly across different market conditions
Complex parameter interactions may require extensive optimization
Slippage and liquidity constraints not fully modeled for all assets
No consideration for market impact in large position sizes
Areas Under Active Development:
Enhanced regime detection algorithms
Improved transaction cost modeling
Additional portfolio weighting methodologies
Machine learning integration for parameter optimization
Cross-timeframe analysis capabilities
---
🔒 ANTI-REPAINTING ARCHITECTURE & LIVE TRADING READINESS
One of the most critical aspects of any trading system is ensuring that signals and calculations are based on confirmed, historical data rather than current bar information that can change throughout the trading session. This system implements comprehensive anti-repainting measures to ensure 100% reliability for live trading .
The Repainting Problem in Trading Systems
Repainting occurs when an indicator uses current, unconfirmed bar data in its calculations, causing:
False Historical Signals: Backtests appear better than reality because calculations change as bars develop
Live Trading Failures: Signals that looked profitable in testing fail when deployed in real markets
Inconsistent Results: Different results when running the same indicator at different times during a trading session
Misleading Performance: Inflated win rates and returns that cannot be replicated in practice
GForge Anti-Repainting Implementation
This system eliminates repainting through multiple technical safeguards:
1. Historical Data Usage for All Calculations
// CRITICAL: All calculations use PREVIOUS bar data (note the offset)
= request.security(ticker, timeframe.period,
[open , high , low , close , close],
lookahead=barmerge.lookahead_off)
// Store confirmed previous bar OHLC for calculations
matrix.set(open_data, i, 0, nz(o1, 0)) // Previous bar open
matrix.set(high_data, i, 0, nz(h1, 0)) // Previous bar high
matrix.set(low_data, i, 0, nz(l1, 0)) // Previous bar low
matrix.set(close_data, i, 0, nz(c1, 0)) // Previous bar close
// Current bar close only for visualization
matrix.set(current_prices, i, 0, nz(c0, 0)) // Live price display
2. Confirmed Bar State Processing
// Only process data when bars are confirmed and closed
if barstate.isconfirmed
// All signal generation and portfolio decisions occur here
// using only historical, unchanging data
// Shift historical data arrays
for i = 0 to active_count - 1
for bar = math.min(data_bars, 199) to 1
// Move confirmed data through historical matrices
old_data = matrix.get(close_data, i, bar - 1)
matrix.set(close_data, i, bar, old_data)
// Process new confirmed bar data
calculate_all_signals_and_dominance()
3. Lookahead Prevention
// Explicit lookahead prevention in all security calls
request.security(ticker, timeframe.period, expression,
lookahead=barmerge.lookahead_off)
// This ensures no future data can influence current calculations
// Essential for maintaining signal integrity across all timeframes
4. State Persistence with Historical Validation
// Asset states only change based on confirmed threshold breaks
// using historical data that cannot change
var array asset_states = array.new(1560, 0)
// State changes use only confirmed, previous bar calculations
if barstate.isconfirmed
=
f_calculate_enhanced_dbbmd(confirmed_price_array, ...)
// Only update states after bar confirmation
if long_crossover_confirmed and current_state != 1
current_state := 1
array.set(asset_states, asset_index, 1)
Live Trading vs. Backtesting Consistency
The system's architecture ensures identical behavior in both environments:
Backtesting Mode:
Uses historical offset data for all calculations
Processes confirmed bars with `barstate.isconfirmed`
Maintains identical signal generation logic
No access to future information
Live Trading Mode:
Uses same historical offset data structure
Waits for bar confirmation before signal updates
Identical mathematical calculations and thresholds
Real-time price display without affecting signals
Technical Implementation Details
Data Collection Timing
// Example of proper data collection timing
if barstate.isconfirmed // Wait for bar to close
// Collect PREVIOUS bar's confirmed OHLC data
for i = 0 to active_count - 1
ticker = array.get(assets, i)
// Get confirmed previous bar data (note offset)
=
request.security(ticker, timeframe.period,
[open , high , low , close , close],
lookahead=barmerge.lookahead_off)
// ALL calculations use prev_* values
// current_close only for real-time display
portfolio_calculations_use_previous_bar_data()
Signal Generation Process
// Signal generation workflow (simplified)
if barstate.isconfirmed and data_bars >= minimum_required_bars
// Step 1: Calculate DBBMD using historical price arrays
for i = 0 to active_count - 1
historical_prices = get_confirmed_price_history(i) // Uses offset data
= calculate_dbbmd(historical_prices)
update_asset_state(i, state)
// Step 2: Build dominance matrix using confirmed data
calculate_dominance_relationships() // All historical data
// Step 3: Generate portfolio signals
new_portfolio = generate_target_portfolio() // Based on confirmed calculations
// Step 4: Compare with previous signals for changes
if portfolio_signals_changed()
execute_portfolio_transition()
Verification Methods for Users
Users can verify the anti-repainting behavior through several methods:
1. Historical Replay Test
Run the indicator on historical data
Note signal timing and portfolio changes
Replay the same period - signals should be identical
No retroactive changes in historical signals
2. Intraday Consistency Check
Load indicator during active trading session
Observe that previous day's signals remain unchanged
Only current day's final bar should show potential signal changes
Refresh indicator - historical signals should be identical
Live Trading Deployment Considerations
Data Quality Assurance
Exchange Connectivity: Ensure reliable data feeds for all 39 assets
Missing Data Handling: System includes safeguards for data gaps
Price Validation: Automatic filtering of obvious price errors
Timeframe Synchronization: All assets synchronized to same bar timing
Performance Impact of Anti-Repainting Measures
The robust anti-repainting implementation requires additional computational resources:
Memory Usage: 200-bar historical data storage for 39 assets
Processing Delay: Signals update only after bar confirmation
Calculation Overhead: Multiple historical data validations
Alert Timing: Slight delay compared to current-bar indicators
However, these trade-offs are essential for reliable live trading performance and accurate backtesting results.
Critical: Equity Curve Anti-Repainting Architecture
The most sophisticated aspect of this system's anti-repainting design is the temporal separation between signal generation and performance calculation . This creates a realistic trading simulation that perfectly matches live trading execution.
The Timing Sequence
// STEP 1: Store what we HELD during the current bar (for performance calc)
if barstate.isconfirmed
// Record positions that were active during this bar
array.clear(held_portfolio)
array.clear(held_weights)
for i = 0 to array.size(execution_portfolio) - 1
array.push(held_portfolio, array.get(execution_portfolio, i))
array.push(held_weights, array.get(execution_weights, i))
// STEP 2: Calculate performance based on what we HELD
portfolio_return = 0.0
for i = 0 to array.size(held_portfolio) - 1
held_asset = array.get(held_portfolio, i)
held_weight = array.get(held_weights, i)
// Performance from current_price vs reference_price
// This is what we ACTUALLY earned during this bar
if held_asset != "USD"
current_price = get_current_price(held_asset) // End of bar
reference_price = get_reference_price(held_asset) // Start of bar
asset_return = (current_price - reference_price) / reference_price
portfolio_return += asset_return * held_weight
// STEP 3: Apply return to equity (realistic timing)
equity := equity * (1 + portfolio_return)
// STEP 4: Generate NEW signals for NEXT period (using confirmed data)
= f_generate_target_portfolio()
// STEP 5: Execute transitions if signals changed
if signal_changed
// Update execution_portfolio for NEXT bar
array.clear(execution_portfolio)
array.clear(execution_weights)
for i = 0 to array.size(new_signal_portfolio) - 1
array.push(execution_portfolio, array.get(new_signal_portfolio, i))
array.push(execution_weights, array.get(new_signal_weights, i))
Why This Prevents Equity Curve Repainting
Performance Attribution: Returns are calculated based on positions that were **actually held** during each bar, not future signals
Signal Timing: New signals are generated **after** performance calculation, affecting only **future** bars
Realistic Execution: Mimics real trading where you earn returns on current positions while planning future moves
No Retroactive Changes: Once a bar closes, its performance contribution to equity is permanent and unchangeable
The One-Bar Offset Mechanism
This system implements a critical one-bar timing offset:
// Bar N: Performance Calculation
// ================================
// 1. Calculate returns on positions held during Bar N
// 2. Update equity based on actual holdings during Bar N
// 3. Plot equity point for Bar N (based on what we HELD)
// Bar N: Signal Generation
// ========================
// 4. Generate signals for Bar N+1 (using confirmed Bar N data)
// 5. Send alerts for what will be held during Bar N+1
// 6. Update execution_portfolio for Bar N+1
// Bar N+1: The Cycle Continues
// =============================
// 1. Performance calculated on positions from Bar N signals
// 2. New signals generated for Bar N+2
Alert System Timing
The alert system reflects this sophisticated timing:
Transaction Cost Realism
Even transaction costs follow realistic timing:
// Fees applied when transitioning between different portfolios
if should_execute_transition
// Charge fees BEFORE taking new positions (realistic timing)
if transaction_fee > 0
fee_amount = equity * (transaction_fee / 100)
equity -= fee_amount // Immediate cost impact
total_fees += fee_amount
// THEN update to new portfolio
update_execution_portfolio(new_signals)
transitions += 1
// Fees reduce equity immediately, affecting all future calculations
// This matches real trading where fees are deducted upon execution
LIVE TRADING CERTIFICATION:
This system has been specifically designed and tested for live trading deployment. The comprehensive anti-repainting measures ensure that:
Backtesting results accurately represent real trading potential
Signals are generated using only confirmed, historical data
No retroactive changes can occur to previously generated signals
Portfolio transitions are based on reliable, unchanging calculations
Performance metrics reflect realistic trading outcomes including proper timing
Users can deploy this system with confidence that live trading results will closely match backtesting performance, subject to normal market execution factors such as slippage and liquidity.
---
⚡ ALERT SYSTEM & AUTOMATION
The system provides comprehensive alerting for automation and monitoring:
Available Alert Conditions
Portfolio Signal Change: Triggered when new portfolio composition is generated
Regime Override Active: Alerts when market regime forces USD positioning
Individual Asset Signals: Can be configured for specific asset transitions
Performance Thresholds: Drawdown or return-based notifications
---
📈 BACKTESTING & PERFORMANCE ANALYSIS
8 Comprehensive Metrics Tracking
The system maintains detailed performance statistics:
Equity Curve: Real-time portfolio value progression
Returns Calculation: Total and annualized performance metrics
Drawdown Analysis: Peak-to-trough decline measurements
Transaction Counting: Portfolio transition frequency
Fee Tracking: Cumulative transaction cost impact
Win Rate Analysis: Success rate of position changes
Backtesting Configuration
// Backtesting parameters
initial_capital = 10000.0 // Starting capital
use_custom_start = true // Enable specific start date
custom_start = timestamp("2023-09-01") // Backtest beginning
transaction_fee = 0.4 // Combined fees and slippage %
// Performance calculation
total_return = (equity - initial_capital) / initial_capital * 100
current_drawdown = (peak_equity - equity) / peak_equity * 100
---
🔧 TROUBLESHOOTING & OPTIMIZATION
Common Configuration Issues
Insufficient Data: Ensure 100+ bars available before start date
[*} Not Compiling: Go on an asset's price chart with 2 or 3 years of data to
make the system compile or just simply reapply the indicator again
Too Many Assets: Reduce active count if experiencing timeouts
Regime Filter Too Strict: Lower trending threshold if always in USD
Excessive Switching: Increase MD multiplier or adjust thresholds
---
💡 USER FEEDBACK & ENHANCEMENT REQUESTS
The continuous evolution of this system depends heavily on user experience and community feedback. Your insights will help motivate me for new improvements and new feature developments.
---
⚖️ FINAL COMPREHENSIVE RISK DISCLAIMER
TRADING INVOLVES SUBSTANTIAL RISK OF LOSS
This indicator is a sophisticated analytical tool designed for educational and research purposes. Important warnings and considerations:
System Limitations:
No algorithmic system can guarantee profitable outcomes
Complex systems may fail in unexpected ways during extreme market events
Historical backtesting does not account for all real-world trading challenges
Slippage, liquidity constraints, and market impact can significantly affect results
System parameters require careful optimization and ongoing monitoring
The creator and distributor of this indicator assume no liability for any financial losses, system failures, or adverse outcomes resulting from its use. This tool is provided "as is" without any warranties, express or implied.
By using this indicator, you acknowledge that you have read, understood, and agreed to assume all risks associated with algorithmic trading and cryptocurrency investments.
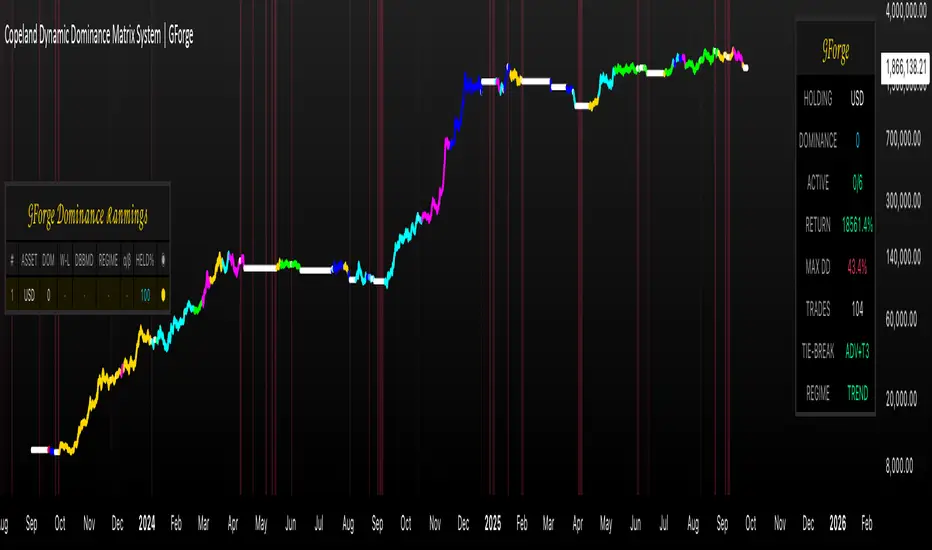
cd_RSI_Divergence_CxGeneral:
The Relative Strength Index (RSI) is a momentum oscillator widely used by traders in price analysis. In addition to showing overbought/oversold zones, divergences between RSI and price are also tracked to identify trading opportunities.
The general consensus is that oscillators alone are not sufficient for entries and should be evaluated together with multiple confirmations.
This oscillator is designed as an additional confirmation/compatible tool for strategies that already use higher time frame (HTF) sweeps and lower time frame (LTF) confirmations such as Change in State Delivery (CISD) or Change of Character (CHOCH).
Features:
While RSI oscillators are commonly displayed in line format (classic), this indicator also offers candlestick-style visualization.
Depending on the selected source, period length, and EMA length, RSI can be displayed as lines and/or candlesticks.
Divergence detection & tracking:
Price and RSI values are monitored on the chosen higher time frame (from the menu) to determine highs and lows. For divergence display, the user can choose between two modes:
1- Alignment with HTF Sweep
2- All
1 - Alignment with HTF Sweep:
First, the price must sweep the previous high/low of the candle on the HTF (i.e., break it) but fail to continue in that direction and return inside (sweep).
If this condition is met, RSI values are checked:
If price makes a high sweep but RSI fails to make a new high → divergence is confirmed.
If price makes a low sweep but RSI fails to make a new low → divergence is confirmed.
Divergence is then displayed on the chart.
2 - All:
In this mode, sweep conditions are ignored. Divergence is confirmed if:
Price makes a new high on HTF but RSI does not.
RSI makes a new high on HTF but price does not.
Price makes a new low on HTF but RSI does not.
RSI makes a new low on HTF but price does not.
Menu & Settings:
RSI visualization (source + period length + EMA period length)
Option to choose classic/candlestick style display
Color customization
Higher time frame selection
Adjustable HTF boxes and table display
Final notes:
This oscillator is designed as an additional confirmation tool for strategies based on HTF sweep + LTF CISD/CHOCH confirmation logic. The chosen HTF in the oscillator should match the time frame where sweeps are expected.
Divergence signals from this oscillator alone will not make you profitable.
For spot trades, monitoring sweeps and divergences on higher time frames is more suitable (e.g., Daily–H1 / Weekly–H4).
My personal usage preferences:
Entry TF: 3m
HTF bias: Daily + H1
Sweep + CISD: 30m / 3m
Market Structure: 3m
RSI divergence: HTF = 30m
If all of them align bullish or bearish ( timeframe alignment ), I try to take the trade.
I’d be glad to hear your feedback and suggestions for improvement.
Happy trading!

Xmoon – 3 Push Divergence – PremiumWhat the Xmoon Indicator Does and Why It’s Special
The Xmoon Indicator is an advanced and unique analytical tool, built on years of trading experience, research, and development. It is not merely a combination of a few simple indicators; it is a comprehensive, intelligent system that brings together the three main pillars of trading success—strategy, risk management, and trading psychology—into a single integrated tool.
Strategy
• Xmoon’s core algorithm is based on the 3 Push Divergence pattern in the RSI —a pattern not offered in other indicators. Most existing tools only detect divergence between two highs or two lows, whereas Xmoon can identify three consecutive highs or three consecutive lows with a momentum mismatch, which considerably increases the statistical likelihood of a trend reversal.
Risk Management
• Automatically calculates the size of each step entry based on per-step capital allocation, leverage, and entry/exit prices, using precise, weighted calculations.
• These multi-step calculations run in real time and are shown clearly in the Information Box for quick reading.
• A Liquidity Line (risk threshold) is computed for each setup and plotted on the chart so you can see at a glance where the position would be liquidated (futures) or where the analysis is invalidated (spot).
Psychology & Decision-Making
• From the moment a signal is generated, Xmoon plots all key levels— step entries, risk-free levels, targets, and the liquidity line —so the trader knows from the outset:
o where the profitable exit is if the market follows the analysis;
o where the break-even (risk-free) exit is if the market moves against the analysis.
• This approach significantly reduces stress and emotional decision-making, because both favorable and unfavorable scenarios are predefined.
Logic & Workflow of the Xmoon Indicator
1️⃣ Pivot Detection and Classification
Xmoon first detects price pivots on the chart and classifies them— based on the bar distance between consecutive pivot highs/lows—into four tiers: Super Minor, Minor, Mid-Major, and Major .
The greater the distance between pivots, the larger and more reliable the pivot becomes—though signals are generated less frequently.
2️⃣ Detecting the 3 Push Divergence Pattern
At this stage, Xmoon identifies 3 Push Divergence patterns. The pattern forms when price prints three consecutive pivots in the same direction, i.e.:
• Bullish: three successive higher highs
• Bearish: three successive lower lows
Meanwhile, at the corresponding points on the RSI , momentum moves the other way:
• Bullish case: RSI peaks step down each time — weakening buying pressure
• Bearish case: RSI troughs step up each time — weakening selling pressure
This repeated price–momentum disagreement three times in a row can significantly increase the likelihood of a trend reversal.
3️⃣ Plotting the Pattern and Key Levels
After the pattern is detected, Xmoon draws the divergence lines and plots the following levels on the chart:
• Step entry lines based on the user-defined number of steps and allocated capital.
• Risk-free (break-even) lines for exits without profit or loss.
• Target lines indicating minimum profit objectives.
• Liquidity level (risk threshold) marking where equity would be wiped out in futures.
These visuals let the trader see, at a glance, the full picture of the pattern, planned entries/exits, and the risk range.
4️⃣ Information Box
After the pattern is detected, Xmoon can display an on-chart Information Box alongside each detected pattern (when enabled in the settings). It includes:
• Pivot type: Super Minor, Minor, Mid-Major, or Major.
• Confirmation filters:
1. Higher-timeframe trend based on the 200-period moving average (MA200).
2. Higher-timeframe overbought/oversold status based on RSI.
• Suggested entry size: based on actual capital and leverage.
This box helps the trader quickly see the pattern quality, overall market context, and the suggested position size.
ℹ️ Explanation of Confirmation Filters
Using these filters can increase signal accuracy.
This information is built into the Xmoon indicator, so you don’t need to add any extra indicators or tools to the chart. Xmoon performs the comparisons in real time and displays the filter results in the Information Box .
• Higher-timeframe trend filter: If the higher-timeframe trend based on the 200-period moving average (MA200) is bullish, buy/long signals are stronger; if it’s bearish, sell/short signals are stronger.
• Higher-timeframe overbought/oversold filter: If RSI is in the overbought zone, the probability of success for sell/short signals is higher; in the oversold zone, the probability of success for buy/long signals is higher.
🧩 What are the components of the Xmoon indicator, and why are they combined?
• Core strategy: trend-reversal signals via a proprietary 3 Push Divergence algorithm.
• Multi-stage confirmation: higher-timeframe trend based on MA200 , plus higher-timeframe RSI overbought/oversold confirmation.
• Advanced position sizing: step-based sizing and weighted averaging .
• Structured exit management: risk-free levels, targets , and liquidity level.
• Supports fast decision-making: all vital information at a glance.
This combination turns Xmoon into a complete, practical system that has not been implemented in this integrated way in any similar tool on TradingView, and it is precisely the sum of these features in a single indicator that sets Xmoon apart from comparable tools.
How to Use the Xmoon Indicator
1️⃣ Add to chart: Add the indicator to the chart of your chosen symbol.
2️⃣ Configure parameters: In Settings , adjust the following to match your strategy:
• Number of Entry steps: 2 to 10 steps
• Pivot type: Super Minor / Minor / Mid-Major / Major
• Pattern direction: Bullish / Bearish
• Display options: show lines and the Information Box
• Capital per trade
• Higher-timeframe filters: timeframes for Trend and RSI
3️⃣ Enable alerts: Turn on alerts to receive immediate notifications when a 3 Push Divergence pattern is detected.
4️⃣ Review the Information Box: To assess pattern strength and alignment with the market after a signal appears, check:
• Pivot size: Super Minor / Minor / Mid-Major / Major (for gauging pattern strength)
• Confirmation filters:
1. Whether the detected pattern aligns with the higher-timeframe trend
2. Whether the detected pattern aligns with the higher-timeframe RSI overbought/oversold condition
These details help you decide whether to enter the trade.
5️⃣ Step Entries
After reviewing the conditions, open your first position at Step 1 . If price moves against you and reaches the Step 2 level, open a new position there, and continue opening additional positions at each subsequent step level.
Whenever price reverses from any of these levels and moves in the direction of your analysis, all open positions will move into profit .
In Xmoon, the number of entry steps is fully configurable ( 2 to 10 ). Set it according to your strategy—the system automatically calculates the size of each step based on the capital you allocate.
6️⃣ Exit Management
Depending on market conditions, you can choose one of the following:
• ⚖️ Exit at the risk-free level: when the market is uncertain and you prefer to close at break-even.
• 🎯 Exit at the target level: when price has followed your analysis and you want to realize profit.
⚠️ Liquidity Level
• Spot: analysis invalidation point.
• Futures: the price at which a leveraged position’s equity would be wiped out.
Why the Invite-Only Version of Xmoon Is Worth Getting
• Proprietary 3 Push Divergence detection and confirmation that isn’t available in the free version or generic indicators.
• Automatic, precise capital and step sizing, with visual plotting of key levels from the moment a signal is issued.
• Real-time market context and pattern quality shown in the Information Box—no need to switch timeframes or add extra indicators.
• Risk control and psychological support by outlining predefined scenarios from start to finish of the trade.
• Limited access to help prevent misuse and reduce users’ financial risk, with dedicated training before activation.
• Developed through extensive backtesting and live evaluation; outcomes depend on correct use and market conditions.
We sincerely hope you have successful and profitable trades.
📣 If you have any questions or need further guidance, we’ll be happy to hear from you.
It’s our pleasure to assist you anytime.
🔻🔻🔻 Persian Section – بخش فارسی 🔻🔻🔻
اندیکاتور ایکسمون چه کاری انجام میدهد و چرا خاص است
اندیکاتور ایکسمون یک ابزار تحلیلی پیشرفته و منحصربهفرد است که حاصل سالها تجربه ترید، تحقیق و توسعه است. این اندیکاتور صرفاً ترکیب چند اندیکاتور ساده نیست، بلکه یک سیستم جامع و هوشمند است که سه رکن اصلی موفقیت در معاملات یعنی استراتژی، مدیریت سرمایه و روانشناسی معاملهگری را در یک ابزار یکپارچه گردآورده است
در بخش استراتژی
* الگوریتم اصلی ایکسمون بر اساس الگوی سهپوش واگرایی (تری پوش دایورجنس) در آر-اِس-آی طراحی شده است؛ الگویی که در سایر اندیکاتور ها ارائه نشده است، بیشتر ابزارهای موجود تنها واگرایی بین دو قله یا دو کف را تشخیص میدهند، در حالی که ایکسمون توانایی شناسایی سه قله یا سه کف متوالی با تضاد مومنتوم را دارد که این موضوع از نظر آماری احتمال بازگشت روند را بهمراتب افزایش میدهد
در بخش مدیریت سرمایه
* محاسبه خودکار حجم هر پله، بر اساس سرمایه پله ای، لوریج و قیمتهای ورود/خروج بهصورت دقیق و وزنی انجام میشود
* این محاسبات پیچیده برای چندین پله به شکل لحظهای انجام شده و در باکس اطلاعات به سادهترین شکل نمایش داده میشود
* خط لیکوییدیتی (حد ریسک) برای هر الگو محاسبه و روی نمودار بصورت بصری رسم میشود تا کاربر در یک نگاه بداند سرمایهاش کجا صفر میشود (در فیوچرز) یا تحلیلش کجا باطل میشود (در اسپات)
در بخش روانشناسی و تصمیمگیری
* ایکسمون از همان لحظه صدور سیگنال، تمام خطوط کلیدی (ورودی پلهای، ریسکفری، تارگت، لیکوییدیتی) را رسم میکند تا معاملهگر از ابتدا بداند
* اگر بازار طبق تحلیل پیش برود، خروج سودآور کجاست
* اگر بازار بر خلاف تحلیل پیش برود، نقطه خروج بیضرر (ریسکفری) کجاست
* این رویکرد باعث کاهش شدید استرس و تصمیمگیری احساسی میشود، چون سناریوهای خوشبینانه و بدبینانه از پیش مشخص هستند
⚙️ منطق و روش کار اندیکاتور ایکسمون
1️⃣ شناسایی و طبقهبندی پیوتها
اندیکاتور ایکسمون ابتدا پیوتهای قیمتی را روی نمودار شناسایی کرده و بر اساس فاصلهی کندلی بین سقف یا کف ها، آنها را در چهار دسته طبقهبندی میکند : سوپر مینور، مینور، میدماژور و ماژور
هرچه فاصله بین پیوت ها بیشتر باشد، پیوت بزرگتر و معتبرتر است، اما سیگنالها کمتر تولید میشوند
2️⃣ تشخیص الگوی سهپوش واگرایی
اندیکاتور ایکسمون در این مرحله الگوهای سهپوش واگرایی را شناسایی میکند، این الگو زمانی شکل میگیرد که قیمت سه پیوت متوالی همجهت تشکیل دهد، یعنی
* حالت صعودی : سه سقف پیاپی بالاتر از قبلی
* حالت نزولی : سه کف پیاپی پایینتر از قبلی
و همزمان، در نقاط متناظر در آر-اِس-آی حرکت معکوس دیده شود، به این معنا که
* حالت صعودی، قلههای آر-اِس-آی هر بار پایینتر از قبلی قرار گیرند - کاهش قدرت خرید
* حالت نزولی، درههای آر-اِس-آی هر بار بالاتر از قبلی شکل گیرند - کاهش فشار فروش
این تضاد قیمت و مومنتوم، وقتی سه بار پیاپی رخ دهد، احتمال بازگشت روند را بهشدت افزایش میدهد
3️⃣ ترسیم الگو و نمایش سطوح کلیدی
پس از شناسایی الگو، ایکسمون خطوط واگرایی و همچنین خطوط و سطوح زیر را روی نمودار ترسیم میکند، این موارد شامل
* 📍 خطوط ورود پلهای بر اساس تعداد پله و سرمایه تنظیمشده توسط کاربر
* ⚖️ خطوط ریسکفری برای خروج بدون سود و زیان
* 🎯 خطوط تارگت به عنوان سطوح حداقل سود
* 🛡 سطح لیکوییدیتی (حد ریسک) برای مشخصکردن نقطه صفر شدن سرمایه در معاملات فیوچرز
این ترسیمات باعث میشود معاملهگر در یک نگاه تصویر کامل از الگو، سطوح ورود و خروج و محدوده ریسک داشته باشد
4️⃣ باکس اطلاعات
پس از شناسایی الگو، اندیکاتور ایکسمون یک باکس اطلاعات تکمیلی در کنار هر الگو نمایش میدهد، البته با فعالسازی گزینه مربوطه در تنظیمات، باکس اطلاعات در کنار الگو نمایش داده میشود و شامل موارد زیر میباشد
* 🏷 نوع پیوت : سوپر مینور، مینور، میدماژور یا ماژور
* 📋 فیلترهای تأییدی
یک - جهت روند در تایمفریم بالاتر بر اساس میانگین متحرک دویست
دو - وضعیت اشباع خرید/فروش در تایمفریم بالاتر بر اساس اندیکاتور آر-اِس-آی
* 📊 حجم پیشنهادی ورود : بر اساس سرمایه واقعی و لوریج
این باکس به معاملهگر کمک میکند در یک نگاه کیفیت الگو، شرایط کلی بازار و حجم پیشنهادی ورود را بداند
توضیح درباره فیلترهای تأییدی : استفاده از این فیلترها میتواند دقت سیگنالها را افزایش دهد. این اطلاعات در اندیکاتور ایکسمون موجود است و نیازی نیست اندیکاتور یا ابزار اضافه دیگری به چارت اضافه کنید. ایکسمون مقایسه ها را در لحظه انجام میدهد و نتیجه فیلترها را در باکس اطلاعات به شما نشان میدهد
* فیلتر جهت روند در تایمفریم بالاتر : اگر روند بالاتر بر اساس اِم-اِی-دویست صعودی باشد، سیگنالهای خرید/لانگ قویتر هستند و بالعکس
* فیلتر تشخیص نواحی اشباع خرید/فروش در تایمفریم بالاتر : اگر آر-اِس-آی در محدوده اُورباوت باشد، احتمال موفقیت فروش بیشتر است و در محدوده اُورسولد احتمال موفقیت خرید بالاتر میرود
🧩 اجزای اندیکاتور ایکسمون چه هستند و چرا این اجزا با هم ترکیب شدهاند
* استراتژی اصلی : سیگنال بازگشت روند با الگوریتم اختصاصی سهپوش واگرایی
* تأیید چندمرحلهای جهت روند در تایم فریم بالاتر بر اساس اِم-اِی-دویست و تایید وضعیت بیشینه خرید/فروش در تایم فریم بالاتر در اندیکاتور آر-اِس-آی
* مدیریت سرمایه پیشرفته : محاسبه حجم پلهای و میانگین وزنی
* مدیریت خروج ساختاریافته : سطوح ریسکفری، تارگت، لیکوییدیتی
* پشتیبانی از تصمیمگیری سریع : همه اطلاعات حیاتی در یک نگاه
این ترکیب، ایکسمون را به یک سیستم کامل و کاربردی تبدیل کرده که در هیچ ابزار مشابهی در تریدینگویو به این شکل یکپارچه پیادهسازی نشده است و دقیقاً مجموع این ویژگیها در یک اندیکاتور است که ایکسمون را از ابزارهای مشابه متمایز میکند
📖 نحوه استفاده از اندیکاتور ایکسمون
1️⃣ افزودن اندیکاتور به چارت : اندیکاتور را به نمودار نماد دلخواه اضافه کنید
2️⃣ تنظیم پارامترها : از بخش تنظیمات، موارد زیر را بر اساس استراتژی شخصی خودتان مشخص کنید
* تعداد پلههای ورود: از دو تا ده پله
* نوع پیوت ها: سوپر مینور/مینور/مید-ماژور/ماژور
* نوع الگوها: نزولی/صعودی
* نمایش خطوط و باکس اطلاعات
* تعیین سرمایه در هر معامله
* تایمفریمهای فیلتر اِم-اِی-دویست و آر-اِس-آی
3️⃣ فعالسازی هشدارها : برای اطلاع فوری از شناسایی الگوهای سهپوش واگرایی ، آلارمها را فعال کنید
4️⃣ بررسی باکس اطلاعات : برای سنجش قدرت الگو و همجهتی با بازار، پس از صدور سیگنال، اطلاعات زیر را در باکس مشکی اطلاعات بررسی کنید
* 🏷 نوع پیوت : بررسی میزان قدرت الگو - سوپر مینور، مینور، میدماژور یا ماژور
* 📋 فیلترهای تأییدی
یک - بررسی هم جهتی الگوی شناسایی شده با جهت روند در تایمفریم بالاتر
دو - بررسی هم جهتی الگوی شناسایی شده با وضعیت اشباع خرید یا فروش در اندیکاتور آر-اِس-آی در تایمفریم بالاتر
این اطلاعات به شما کمک میکند تصمیم بگیرید که آیا وارد معامله شوید یا خیر
5️⃣ ورود پلهای
اگر پس از بررسی شرایط تصمیم به ورود گرفتید، اولین پوزیشن را در پله اول باز کنید و در صورتی که بازار در خلاف جهت موردنظر شما حرکت کرد و به سطح پله دوم رسید، یک پوزیشن جدید در همان سطح باز کنید و با رسیدن به سطوح بعدی، پوزیشن های بعدی را باز می کنید
هر زمان که بازار از هر یک از این سطوح برگشت و در جهت تحلیل شما حرکت کرد، تمامی پوزیشنهای باز شده وارد سود میشوند
در اندیکاتور ایکسمون، تعداد پلههای ورودی کاملاً قابلتنظیم است (بین دو تا ده پله ) و شما میتوانید بر اساس استراتژی شخصی خود آن را تعیین کنید، سیستم بهطور خودکار حجم هر پله را بر اساس سرمایه واردشده محاسبه میکند
6️⃣ مدیریت خروج
بسته به شرایط بازار، میتوانید یکی از دو روش زیر را انتخاب کنید
* ⚖️ خروج در سطح ریسکفری : زمانی که بازار نامطمئن است و میخواهید بدون سود یا زیان از معامله خارج شوید
* 🎯 خروج در سطح تارگت : زمانی که قیمت طبق تحلیل شما حرکت کرده است و بدنبال کسب سود هستید
⚠️سطح لیکوییدیتی
* اسپات: نقطه ابطال تحلیل
* فیوچرز: نقطه صفر شدن سرمایه پوزیشن با لوریج
💎 چرا نسخه اینوایت اونلی ایکسمون ارزش تهیه دارد
* الگوریتم اختصاصی شناسایی و تأیید سهپوش واگرایی که در نسخه رایگان یا اندیکاتورهای عمومی وجود ندارد
* محاسبات سرمایه و حجم پلهای بهصورت خودکار و دقیق، همراه با رسم بصری سطوح کلیدی از لحظه صدور سیگنال
* نمایش آنی شرایط بازار و کیفیت الگو در باکس اطلاعات بدون نیاز به تغییر تایمفریم یا افزودن اندیکاتورهای اضافی
* کنترل ریسک و پشتیبانی روانی معاملهگر با ارائه سناریوهای مشخص از ابتدا تا انتهای معامله
* دسترسی محدود برای جلوگیری از استفاده نادرست و کاهش ریسک مالی کاربران، همراه با آموزش اختصاصی پیش از فعالسازی
* اثباتشده در تستها و معاملات واقعی با نتایج قابل اتکا، به شرط استفاده صحیح بر اساس آموزش
صمیمانه امیدواریم معاملات موفق و پرسودی داشته باشید
📣 اگر سوالی دارید یا نیاز به راهنمایی بیشتری دارید، خوشحال میشویم از ما بپرسید
با کمال میل در خدمتتان هستیم

ArpitJainForex.comThis is one of the Leading Indicator I have sold To 30+ Forex Agencies In Dubai, Azerbaijan & Cyprus.
Looking forward in making you Profitable.
If you want access to my Indicator please dm on
www.instagram.com
My profile Has Blue High Rise buildings Behind me, Yah Its in Abu Dhabi.

ML Compressor Enhanced Trading Indicator# 🤖 ML Enhanced Trading Indicator - Advanced Market Analysis
## 📊 Overview
This is a comprehensive Machine Learning Enhanced Trading Indicator that combines multiple advanced analytical techniques to provide high-probability trading signals. The indicator uses artificial intelligence, pattern recognition, anomaly detection, and traditional technical analysis to identify optimal entry and exit points in the market.
## 🚀 Key Features
### 🧠 **Machine Learning Core**
- **Advanced Pattern Recognition**: Uses cosine similarity, Pearson correlation, and Spearman rank correlation to identify historical patterns
- **AI-Powered Predictions**: Implements multiple correlation methods to forecast price movements
- **Anomaly Detection**: Z-score based detection system for unusual market activities
- **Signal Confidence Scoring**: Reliability assessment for each trading signal
### 📈 **Technical Analysis Integration**
- **Multi-Timeframe RSI Analysis**: 14 and 21-period RSI with oversold/overbought detection
- **MACD Momentum**: Enhanced MACD histogram analysis for trend confirmation
- **Bollinger Bands Position**: Dynamic position tracking within BB channels
- **Volume Analysis**: Spike and dry volume detection with ratio calculations
- **Trend Strength Measurement**: EMA-based trend power analysis
### 🎯 **Perfect Zone Detection**
- **Ideal Buy Zone**: Identifies perfect buying opportunities when 7 conditions align:
- ML Score ≥ 0.60
- Bottom proximity detection
- RSI in 20-35 range
- Volume spike confirmation
- Positive price anomaly
- Bullish pattern match
- Positive MACD momentum
### 📊 **Comprehensive Display Table**
- **Real-time ML Analysis**: Complete breakdown of all indicators
- **Perfect Buy Conditions Tracker**: Visual checklist with completion percentage
- **Performance Metrics**: Win rate tracking and P&L analysis
- **Signal Strength Indicators**: Confidence levels for each signal
## 🔧 **Customizable Parameters**
### **ML Settings**
- **ML Lookback Period**: 20-500 bars (default: 100)
- **Anomaly Threshold**: 1.0-5.0 sensitivity (default: 2.0)
- **Pattern Similarity**: 0.5-0.99 matching threshold (default: 0.80)
- **AI Lookback Period**: 20-200 bars (default: 50)
### **AI Prediction Models**
- **Correlation Methods**: Spearman, Pearson, Cosine Similarity
- **Forecast Length**: 15-250 bars (default: 50)
- **Similarity Type**: Price or %Change analysis
### **Visual Options**
- **Table Position**: Top/Bottom Left/Right positioning
- **Table Size**: Small, Normal, Large options
- **Signal Display**: Toggle buy/sell signals on/off
- **AI Visualization**: Optional prediction paths and ZigZag
## 📋 **How to Use**
### **For Beginners**
1. Add the indicator to your chart
2. Look for "PERFECT BUY" signals in the table
3. Wait for completion percentage ≥ 85% for highest probability trades
4. Use the background color changes as visual confirmation
### **For Advanced Traders**
1. Analyze individual ML components in the detailed table
2. Monitor anomaly detection for unusual market conditions
3. Use pattern confidence levels for trade timing
4. Combine with your existing strategy for confirmation
### **Signal Interpretation**
- **🟢 PERFECT BUY**: All 7 conditions met - highest probability reversal
- **🟡 NEAR BOTTOM**: Close to ideal conditions - monitor closely
- **🔴 NOT READY**: Wait for better setup
- **Strong Buy/Sell Signals**: ML score-based entries with high confidence
## ⚠️ **Important Notes**
### **Risk Management**
- This indicator provides analysis and signals, not guaranteed outcomes
- Always use proper risk management and position sizing
- Consider market conditions and fundamental factors
- Backtest the strategy on your preferred timeframes and assets
### **Best Practices**
- Use multiple timeframe analysis for confirmation
- Combine with support/resistance levels
- Monitor volume confirmation for all signals
- Set appropriate stop-losses and profit targets
### **Performance Tracking**
- The indicator tracks its own performance with win rate calculations
- Monitor the "AI Prediction" accuracy percentage
- Use the P&L tracking to assess signal quality over time
## 🔄 **Updates and Improvements**
This indicator is continuously evolving with:
- Enhanced machine learning algorithms
- Improved pattern recognition capabilities
- Additional correlation methods for better accuracy
- Performance optimization for faster calculations
- New visualization features based on user feedback
## 📚 **Technical Details**
### **Machine Learning Implementation**
- **Pattern Matching**: 20-bar normalized price patterns with historical comparison
- **Correlation Analysis**: Mathematical similarity scoring between current and historical patterns
- **Anomaly Detection**: Statistical Z-score analysis across price, volume, and RSI
- **Signal Weighting**: Multi-factor scoring system with optimized weights
### **Algorithm Components**
1. **Feature Extraction**: Price, volume, momentum, volatility, and trend features
2. **Pattern Recognition**: Historical pattern database with similarity matching
3. **Anomaly Detection**: Multi-dimensional Z-score threshold analysis
4. **Signal Generation**: Weighted scoring system with confidence intervals
5. **Performance Tracking**: Real-time win rate and accuracy monitoring
### **Calculation Methods**
- **Trend Strength**: (EMA8 - EMA21) / EMA21 * 100
- **Volume Ratio**: Current Volume / 20-period SMA Volume
- **BB Position**: (Close - BB_Lower) / (BB_Upper - BB_Lower)
- **Anomaly Score**: Average of normalized Z-scores for price, volume, and RSI
## 🎨 **Visual Elements**
### **Background Colors**
- **Light Green**: Perfect buy zone detected
- **Light Red**: Perfect sell zone detected
- **Light Blue**: Near bottom proximity
- **Green/Red Transparency**: Price anomaly detection
### **Signal Shapes**
- **Green Triangle Up**: Strong buy signal
- **Red Triangle Down**: Strong sell signal
- **Aqua Diamond**: Perfect buy zone entry
- **Purple Diamond**: Perfect sell zone entry
### **Table Information**
- **ML Complete Analysis**: 16 comprehensive metrics
- **Perfect Buy Conditions**: 7-point checklist with status indicators
- **Real-time Values**: Live updating of all calculations
- **Color-coded Status**: Green (good), Yellow (moderate), Red (caution)
## 🔍 **Troubleshooting**
### **Common Issues**
- **Table Not Showing**: Enable "Show ML Table" in settings
- **No Signals Appearing**: Check "Show Buy/Sell Signals" option
- **Performance Issues**: Reduce ML Lookback Period for faster calculation
- **Too Many/Few Signals**: Adjust Anomaly Threshold sensitivity
### **Optimization Tips**
- **For Day Trading**: Use lower timeframes (1m, 5m, 15m) with reduced lookback periods
- **For Swing Trading**: Use higher timeframes (1h, 4h, 1D) with standard settings
- **For Scalping**: Enable only strong signals and reduce pattern similarity threshold
- **For Long-term**: Increase all lookback periods and use daily/weekly timeframes
## 📖 **Disclaimer**
This indicator is for educational and informational purposes only. It should not be considered as financial advice. Trading involves substantial risk of loss and is not suitable for all investors. Past performance does not guarantee future results.
### **Risk Warning**
- All trading involves risk of substantial losses
- Never risk more than you can afford to lose
- This indicator does not guarantee profitable trades
- Always use proper risk management techniques
- Consider consulting with a financial advisor
### **Liability**
The creator of this indicator is not responsible for any losses incurred from its use. Users should thoroughly test and understand the indicator before using it with real money.
### **Feature Requests**
- Suggest improvements through TradingView comments
- Report bugs with detailed descriptions
- Share successful strategies using the indicator
- Contribute to community discussions
## 🏆 **Credits and Acknowledgments**
This indicator builds upon various open-source libraries and mathematical concepts:
- TradingView ZigZag library for visualization
- Statistical correlation methods from academic research
- Machine learning concepts adapted for financial markets
- Community feedback and testing contributions
## 📈 **Performance Metrics**
The indicator includes built-in performance tracking:
- **Win Rate Calculation**: Percentage of profitable signals
- **Signal Accuracy**: ML prediction vs actual price movement
- **Drawdown Tracking**: Current unrealized P&L from last signal
- **Completion Percentage**: How many perfect conditions are met
## 🔬 **Mathematical Foundation**
### **Correlation Calculations**
- **Pearson**: Measures linear correlation between patterns
- **Spearman**: Rank-based correlation for non-linear relationships
- **Cosine Similarity**: Vector-based similarity for pattern matching
### **Statistical Methods**
- **Z-Score**: (Value - Mean) / Standard Deviation
- **Pattern Normalization**: Price / Price
- **Volatility Percentile**: Historical ranking of current volatility
- **Momentum Calculation**: Price change over multiple periods
## 🎯 **Trading Strategies**
### **Conservative Approach**
- Wait for Perfect Buy Zone (85%+ completion)
- Use higher timeframes for confirmation
- Set stop-loss at recent swing low
- Take profits at resistance levels
### **Aggressive Approach**
- Trade on Strong Buy/Sell signals
- Use lower completion thresholds (70%+)
- Tighter stop-losses with faster exits
- Higher position sizes with confirmed trends
### **Hybrid Strategy**
- Combine with other indicators for confirmation
- Use different settings for different market conditions
- Scale in/out based on signal strength
- Adjust parameters based on market volatility

On-Chain Signals [LuxAlgo]The On-Chain Signals indicator uses fundamental blockchain metrics to provide traders with an objective technical view of their favorite cryptocurrencies.
It uses IntoTheBlock datasets integrated within TradingView to generate four key signals: Net Network Growth, In the Money, Concentration, and Large Transactions.
Together, these four signals provide traders with an overall directional bias of the market. All of the data can be visualized as a gauge, table, historical plot, or average.
🔶 USAGE
The main goal of this tool is to provide an overall directional bias based on four blockchain signals, each with three possible biases: bearish, neutral, or bullish. The thresholds for each signal bias can be adjusted on the settings panel.
These signals are based on IntoTheBlock's On-Chain Signals.
Net network growth: Change in the total number of addresses over the last seven periods; i.e., how many new addresses are being created.
In the Money: Change in the seven-period moving average of the total supply in the money. This shows how many addresses are profitable.
Concentration: Change in the aggregate addresses of whales and investors from the previous period. These are addresses holding at least 0.1% of the supply. This shows how many addresses are in the hands of a few.
Large Transactions: Changes in the number of transactions over $100,000. This metric tracks convergence or divergence from the 21- and 30-day EMAs and indicates the momentum of large transactions.
All of these signals together form the blockchain's overall directional bias.
Bearish: The number of bearish individual signals is greater than the number of bullish individual signals.
Neutral: The number of bearish individual signals is equal to the number of bullish individual signals.
Bullish: The number of bullish individual signals is greater than the number of bearish individual signals.
If the overall directional bias is bullish, we can expect the price of the observed cryptocurrency to increase. If the bias is bearish, we can expect the price to decrease. If the signal is neutral, the price may be more likely to stay the same.
Traders should be aware of two things. First, the signals provide optimal results when the chart is set to the daily timeframe. Second, the tool uses IntoTheBlock data, which is available on TradingView. Therefore, some cryptocurrencies may not be available.
🔹 Display Mode
Traders have three different display modes at their disposal. These modes can be easily selected from the settings panel. The gauge is set by default.
🔹 Gauge
The gauge will appear in the center of the visible space. Traders can adjust its size using the Scale parameter in the Settings panel. They can also give it a curved effect.
The number of bars displayed directly affects the gauge's resolution: More bars result in better resolution.
The chart above shows the effect that different scale configurations have on the gauge.
🔹 Historical Data
The chart above shows the historical data for each of the four signals.
Traders can use this mode to adjust the thresholds for each signal on the settings panel to fit the behavior of each cryptocurrency. They can also analyze how each metric impacts price behavior over time.
🔹 Average
This display mode provides an easy way to see the overall bias of past prices in order to analyze price behavior in relation to the underlying blockchain's directional bias.
The average is calculated by taking the values of the overall bias as -1 for bearish, 0 for neutral, and +1 for bullish, and then applying a triangular moving average over 20 periods by default. Simple and exponential moving averages are available, and traders can select the period length from the settings panel.
🔶 DETAILS
The four signals are based on IntoTheBlock's On-Chain Signals. We gather the data, manipulate it, and build the signals depending on each threshold.
Net network growth
float netNetworkGrowthData = customData('_TOTALADDRESSES')
float netNetworkGrowth = 100*(netNetworkGrowthData /netNetworkGrowthData - 1)
In the Money
float inTheMoneyData = customData('_INOUTMONEYIN')
float averageBalance = customData('_AVGBALANCE')
float inTheMoneyBalance = inTheMoneyData*averageBalance
float sma = ta.sma(inTheMoneyBalance,7)
float inTheMoney = ta.roc(sma,1)
Concentration
float whalesData = customData('_WHALESPERCENTAGE')
float inverstorsData = customData('_INVESTORSPERCENTAGE')
float bigHands = whalesData+inverstorsData
float concentration = ta.change(bigHands )*100
Large Transactions
float largeTransacionsData = customData('_LARGETXCOUNT')
float largeTX21 = ta.ema(largeTransacionsData,21)
float largeTX30 = ta.ema(largeTransacionsData,30)
float largeTransacions = ((largeTX21 - largeTX30)/largeTX30)*100
🔶 SETTINGS
Display mode: Select between gauge, historical data and average.
Average: Select a smoothing method and length period.
🔹 Thresholds
Net Network Growth : Bullish and bearish thresholds for this signal.
In The Money : Bullish and bearish thresholds for this signal.
Concentration : Bullish and bearish thresholds for this signal.
Transactions : Bullish and bearish thresholds for this signal.
🔹 Dashboard
Dashboard : Enable/disable dashboard display
Position : Select dashboard location
Size : Select dashboard size
🔹 Gauge
Scale : Select the size of the gauge
Curved : Enable/disable curved mode
Select Gauge colors for bearish, neutral and bullish bias
🔹 Style
Net Network Growth : Enable/disable historical plot and choose color
In The Money : Enable/disable historical plot and choose color
Concentration : Enable/disable historical plot and choose color
Large Transacions : Enable/disable historical plot and choose color

Candlestick Patterns Backtester [Optimized]Candlestick Patterns Backtester
What this is: This indicator is based on a really cool candlestick pattern backtester that I found (I'll update this later when I remember where I got it from or find the actual author). The original had this massive table showing win/loss ratios for a bunch of candlestick patterns, and according to the built-in backtester, it was actually profitable - which was pretty impressive.
The Problem: I played around with the original for a while but honestly wasn't really able to get it to work well at all for actual trading. It was still pretty cool to look at though! The main issues were:
It was just a big static table - hard to do anything useful with it
Couldn't send signals out to other strategies
The code was a monster - like 2,000+ lines of repetitive mess
What I Did: I completely refactored this thing and got it down from 2,000+ lines to just a few hundred lines. Much cleaner now! Here's what it does:
45+ Candlestick Patterns - All the classics are in there
Dynamic Filtering - Set your own requirements (minimum win rate, profit factor, total trades, etc.)
Flexible Logic - Choose AND/OR logic for your filters
Signal Generation - Creates actual buy/sell signals you can use with other strategies
Visual Badges - Shows pattern badges on chart when they meet your criteria
Active Patterns Table - Only shows patterns that are currently profitable based on your settings
Settings You Can Adjust:
Minimum win rate threshold
Minimum profit factor
Minimum number of trades required
Whether to use AND or OR logic for filtering
Colors, badge display, debug options
Reality Check: Trading these patterns really wasn't for me, but it was still a great learning experience. The backtesting results look good on paper, but as always, past performance doesn't guarantee future results. Use this as a research tool and educational resource more than anything else.
Credit: This is based on someone else's original work that I heavily modified and optimized. I'll update this description once I track down the original author to give proper credit where it's due.
This introduction captures your casual, honest tone while explaining the technical improvements you made and setting realistic expectations about the indicator's practical use.
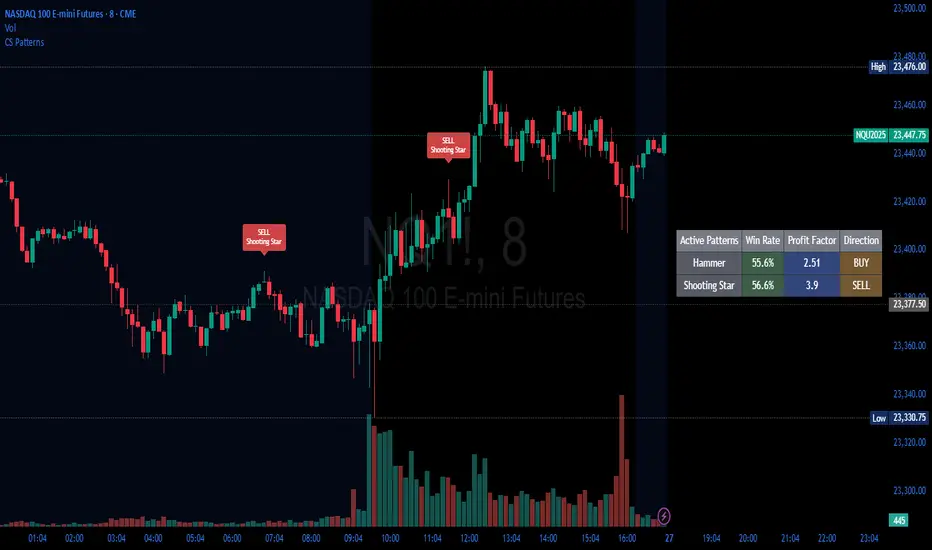
Automated Scalping Signals with TP/SL Indicator [QuantAlgo]🟢 Overview
The Automated Scalping Signals with Take Profit & Stop Loss Indicator is a multi-timeframe trading system that combines market structure analysis with directional bias filtering to identify potential scalping opportunities. It detects Points of Interest (POI) including Fair Value Gaps (FVG) and Order Blocks (OB) while cross-referencing entries with higher timeframe exponential moving average positioning to create systematic entry conditions.
The indicator features adaptive timeframe calculations that automatically scale analysis periods based on your chart timeframe, maintaining consistent analytical relationships across different trading sessions. It provides integrated trade management with stop loss calculation methods, configurable risk-reward ratios, and real-time performance tracking through dashboard displays showing trade statistics, bias direction, and active position status.
This advanced system is designed for low timeframe trading, typically performing optimally on 1 to 15-minute charts across popular instruments such as OANDA:XAUUSD , CME_MINI:MES1! , CME_MINI:ES1! , CME_MINI:MNQ1! , CBOT_MINI:YM1! , CBOT_MINI:MYM1! , BYBIT:BTCUSDT.P , BYBIT:ETHUSDT.P , or any asset and timeframe of your preference.
🟢 How It Works
The indicator operates using a dual-timeframe mathematical framework where higher timeframe exponential moving averages establish directional bias through cross-over analysis, while simultaneously scanning for specific market structure patterns on the POI timeframe. The timeframe calculation engine uses multiplication factors to determine analysis periods, ensuring the bias timeframe provides trend context while the POI timeframe captures structural formations.
The structural analysis begins with FVG detection, which systematically scans price action to identify imbalances where gaps exist between consecutive candle ranges with no overlapping wicks. When such gaps are detected, the algorithm measures their size against minimum thresholds to filter out insignificant formations. Concurrently, OB recognition analyzes three-candle sequences, examining specific open/close relationships that indicate potential institutional accumulation zones. Once these structural patterns are identified, the algorithm cross-references them against the higher timeframe bias direction, creating a validation filter that only permits entries aligned with the prevailing EMA cross-over state. When price subsequently intersects these validated POI zones, entry signals generate with the system calculating entry levels at zone midpoints, then applying the selected stop loss methodology combined with the configured risk-reward ratio to determine take profit placement.
To mirror realistic trading conditions, the indicator incorporates configurable slippage calculations that account for execution differences between intended and actual fill prices. When trades reach their take profit or stop loss levels, the algorithm applies slippage adjustments that worsen the exit prices in a conservative manner - reducing take profit fills and increasing stop loss impact. This approach ensures backtesting results reflect more realistic performance expectations by accounting for spread costs, market volatility during execution, and liquidity constraints that occur in live trading environments.
It also has a performance dashboard that continuously tracks and displays comprehensive trading metrics:
1/ Bias TF / POI TF: Displays the calculated timeframes used for bias analysis and POI detection, showing the actual periods (e.g., "15m / 5m") that result from the multiplier settings to confirm proper adaptive timeframe selection
2/ Bias Direction: Shows current market trend assessment (Bullish, Bearish, or Sideways) derived from EMA cross-over analysis to indicate which trade directions align with prevailing momentum
3/ Data Processing: Indicates how many price bars have been analyzed by the system, helping users verify if complete historical data has been processed for comprehensive strategy validation
4/ Total Trades: Displays the cumulative number of completed trades plus any active positions, providing volume assessment for statistical significance of other metrics
5/ Wins/Losses: Shows the raw count of profitable versus unprofitable trades, offering immediate insight into strategy effectiveness frequency
6/ Win Rate: Reveals the percentage of successful trades, where values above 50% generally indicate effective entry timing and values below suggest strategy refinement needs
7/ Total R-Multiple: Displays cumulative risk-reward performance across all trades, with positive values demonstrating profitable system operation and negative values indicating net losses requiring analysis
8/ Average R Win/Loss: Shows average risk-reward ratios for winning and losing trades separately, where winning averages approaching the configured take profit ratio indicate minimal slippage impact while losing averages near -1.0 suggest effective stop loss execution
9/ TP Ratio / Slippage: Displays the configured take profit ratio and slippage settings with calculated performance impact, showing how execution costs affect actual versus theoretical returns
10/ Profit Factor: Calculates the ratio of total winning amounts to total losing amounts, where values above 1.5 suggest robust profitability, values between 1.0-1.5 indicate modest success, and values below 1.0 show net losses
11/ Maximum Drawdown: Tracks the largest peak-to-trough decline in R-multiple terms, with smaller negative values indicating better capital preservation and risk control during losing streaks
🟢 How to Use
Start by applying the indicator to your chart and observe its performance across different market conditions to understand how it identifies bias direction and POI formations. Then navigate to the settings panel to configure the Bias Timeframe Multiplier for trend context sensitivity and POI Timeframe Multiplier for structural analysis frequency according to your trading preference and objectives.
Next, fine-tune the EMA periods in Bias Settings to control trend detection sensitivity and select your preferred POI types based on your analytical preference. Proceed to configure your Risk Management approach by selecting from the available stop loss calculation methods and setting the Take Profit ratio that aligns with your risk tolerance and profit objectives. Complete the setup by customizing Display Settings to control table visibility and trade visualization elements, adjusting UI positioning and colors for optimal chart readability, then activate Alert Conditions for automated notifications on trade entries, exits, and bias direction changes to support systematic trade management.
🟢 Examples
OANDA:XAUUSD
CME_MINI:MES1!
CME_MINI:ES1!
CME_MINI:MNQ1!
CBOT_MINI:YM1!
BYBIT:BTCUSDT.P
BINANCE:SOLUSD
*Disclaimer: Past performance is not indicative of future results. None of our statements, claims, or signals from our indicators are intended to be financial advice. All trading involves substantial risk of loss, not just upside potential. Users are highly recommended to carefully consider their financial situation and risk tolerance before trading.

Price Reaction Analysis by Day of WeekOverview
The "Price Reaction Analysis by Day of Week" indicator is a tool that enables traders to analyze historical price reaction patterns to technical indicator signals on a selected day of the week. It examines price behavior on a chosen candle (from 1 to 30) in the next day or subsequent days after a signal, depending on the timeframe, and provides success rate statistics to support data-driven trading decisions. The indicator is optimized for timeframes up to 1 day (e.g., 1D, 12H, 8H, 6H, 4H, 1H, 15M), as the analysis relies on day-of-week comparisons. Lower timeframes generate more signals due to the higher number of candles per day.
Key Features
1. Flexible Technical Indicator Selection
Users can choose one of four technical indicators: RSI, SMI, MA, or Bollinger Bands. Each indicator has configurable parameters, such as:
RSI length, oversold/overbought levels.
SMI length, %K and %D smoothing, signal levels.
MA length.
Bollinger Bands length and multiplier.
2. Day-of-Week Analysis
The indicator allows users to select a day of the week (Monday, Tuesday, Wednesday, Thursday, Friday) for generating signals. It analyzes price reactions on a selected candle (from 1 to 30) in the next day or subsequent days after the signal. Examples:
On a daily timeframe, a signal on Monday can be analyzed for the first, fourth, or later candle (up to 30) in subsequent days (e.g., Tuesday, Wednesday).
On timeframes lower than 1 day (e.g., 12H, 8H, 6H, 4H, 1H, 15M), the analysis targets the selected candle in the next day or subsequent days. For example, on a 4H timeframe, you can analyze the second Tuesday candle following a Monday signal. The maximum timeframe is 1 day to ensure consistent day-of-week analysis.
3. Visual Signals
Signals for the analysis period are marked with background highlights in real-time when the indicator’s conditions are met. The last highlighted candle of the selected day is always analyzed. Arrows are displayed on the chart at the candle specified by the “Candles to Compare” setting (e.g., the first candle if set to 1):
Green upward triangles (below the candle) for successful buy signals (the closing price of the selected candle is higher than the signal candle’s close).
Red downward triangles (above the candle) for successful sell signals (the closing price of the selected candle is lower than the signal candle’s close).
Gray “x” marks for unsuccessful signals (no price reversal in the expected direction). Arrow positions are intuitive: buy signals below the candle, sell signals above. Highlights and arrows do not require waiting for future signals but are essential for calculating statistics.
Note: The first candle of the next day may appear shifted on the chart due to timezone differences, which can affect the timing of signal appearance.
4. Signal Conditions (Highlights) for Each Indicator
RSI: The oscillator is in oversold (buy) or overbought (sell) zones.
SMI: SMI returns from oversold (buy) or overbought (sell) zones.
MA: Price crosses the MA (upward for buy, downward for sell).
Bollinger Bands: Price returns inside the bands (from below for buy, from above for sell).
5. Success Rate Statistics
A table in the top-right corner of the chart displays:
The number of buy and sell signals for the selected day of the week.
The percentage of cases where the price of the selected candle in the next day or subsequent days reversed as expected (e.g., rising after a buy signal). Statistics are based on comparing the closing price of the signal candle with the closing price of the selected candle (e.g., first, fourth) in the next day or subsequent days.
Important: Statistics do not account for price movements within the candle or after its close. The price on the selected candle (e.g., fourth) may be lower than earlier candles but still higher than the signal candle, counting as a positive buy signal, though it does not guarantee profit.
6. Date Range
Users can specify the analysis date range, enabling strategy testing on historical data from a chosen period. Ensure the start and end dates are set correctly.
Applications
The indicator is designed for traders who want to leverage historical patterns for position planning. Examples:
On a 4-hour timeframe: If a sell signal highlight appears on Monday and statistics show an 80% chance that the fourth Tuesday candle is bearish, traders may consider playing a correction at the open of that candle.
On a daily timeframe: If a highlight indicates market overheating, traders may consider entering a position at the open of the first candle after the signal (e.g., Tuesday), provided statistics suggest an edge. Users can analyze the signal on the first candle and check later candles to validate results, increasing confidence in consistent patterns.
Key Settings
Indicator Type: Choose between RSI, SMI, MA, or Bollinger Bands.
Selected Day: Monday, Tuesday, Wednesday, Thursday, or Friday.
Candles to Compare: The number of the candle in the next day or subsequent days (from 1 to 30).
Indicator Parameters: Lengths, levels (e.g., oversold/overbought for RSI).
Background Colors: Configurable highlights for buy and sell signals.
Notes
Timeframes: The indicator is optimized for timeframes up to 1 day (e.g., 1D, 12H, 8H, 6H, 4H, 1H, 15M), as the analysis relies on day-of-week patterns. Timeframes lower than 1 day generate more signals due to the higher number of candles per day.
Candle Shift: The first candle of the next day may appear shifted on the chart due to timezone differences, affecting the timing of signals across markets or platforms.
Statistical Limitations: Results are based on the closing prices of the selected candle, ignoring fluctuations in earlier candles, within the candle, or subsequent price movements. Traders must assess whether entering at the open or after the close of the selected candle is profitable.
Testing: Effectiveness depends on historical data and parameter settings. Testing different configurations across markets and timeframes is recommended.
Who Is It For?
Swing and position traders who base decisions on technical analysis and historical patterns.
Market analysts seeking patterns in price behavior by day of the week.
TradingView users of all experience levels, thanks to an intuitive interface and flexible settings.

Prev Week POC Buy/Sell Signals
Hi, I’m Edward. I created a straightforward strategy for swing traders (4hr or 8hr timeframe users). This strategy is for traders that are not interested to look at charts all day long, 2 times a day max, but still be profitable.
The indicator:
Print a buy signal when the price closes above the previous week's Point of Control (POC).
Stay in the trade until the price closes below the previous week's POC, then print a sell signal.
The indicator calculates the weekly POC using a basic volume profile method, then tracks the previous week's POC for signals.
Previous week POC is valid from Monday to Thursday. By close of business on Thursday, the current week trend and POC should be well established and should be used make buy or sell decisions. Enjoy!
