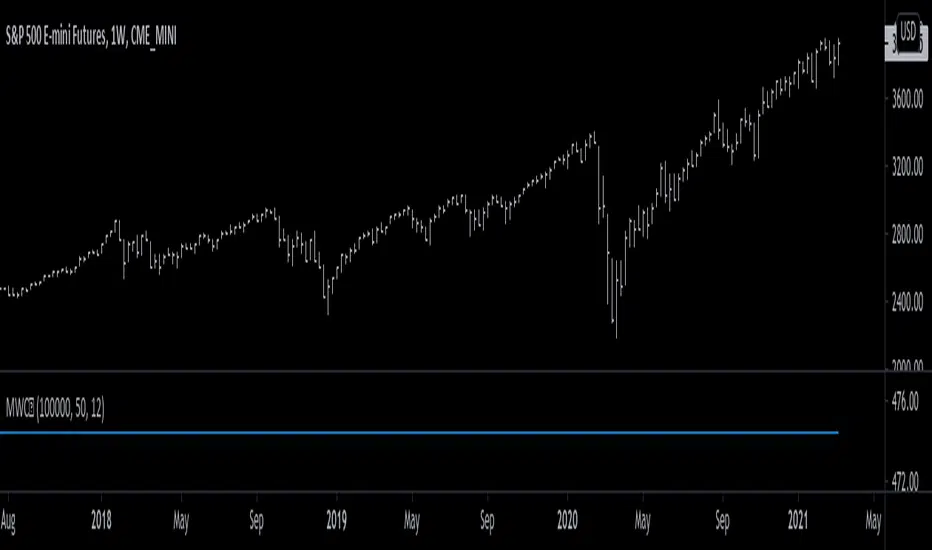
RSI Trend Indicator [paRSI]The Relative Strength Index ( RSI ) is a measurement used by traders to assess the price momentum. It is scaled from 0 to 100. when RSI reads below 30, it is usually interpreted as oversold and when RSI is above 70 it is usually interpreted as overbought. However, it is usually not profitable to trade based on overbought and oversold signal.
RSI Trend Indicator or as I like to call it "paRSI" ("Parsa (my name) + RSI") shows that when RSI is above a specific number (default value = 60) it indicates bullish trend and when RSI is below a specific number (default value = 40 ) it indicates bearish trend. Lastly when RSI is below the 2 specified numbers it indicates a neutral trend.
I don't recommend trading based on this single indicator. If you're a trend trader this might be useful tool in addition to your own strategy
Usage:
If the created pattern has worked previously on the chart, you could enter on the first stages of the green or red section (depending on the market's trend).
It is not recommended to trade in any direction when there is no color
*THIS IS A TREND FOLLOWING STRATEGY AND DOES NOT WORK ON ALL MARKETS*
"profitable" için komut dosyalarını ara

Interstellar / buy and sell
Interstellar is the buy and sell indicator for trading on TradingView
Buy and sell signals are tested, improved, developed and tried until we reach the highest precision we aspire to, so that we do not need further updates.
Before publishing the Interstellar indicator, we made sure that we reached the best and most accurate version, which exceeded the accuracy of the signals 90%
How does the Interstellar indicator work?
The algorithm behind buy and sell signals is based on a set of more important and accurate technical indicators that give signals to change direction early.
When conditions are met on all indicators, it produces only very accurate and high probability trading signals and significantly reduces false signals.
For a more detailed illustration of the strategy, see the following image:
i.imgur.com
Look at the picture above and imagine with me that there are a bunch of technical indicators going next to each other to get to level 20 and Level 20 represents the killer point that gives the entry or exit signals.
When all these indicators agree and reach Level 20, you have met all the requirements of the strategy and the buy or sell signal will appear on the chart.
i.imgur.com
In the image above we note that the RSI has not reached the 20th level, what happens in this case?
In this case the signals will not appear on the chart for the incompleteness of the terms of the strategy.
But in the next candle we will have one indicator which is the RSI indicator only and when it returns to level 20 the terms of the strategy are completed and the signal appears on the chart. The rest of the other indicators we will not need because they met the conditions in the previous candle.
When this situation occurs 9 out of 10 times returns the index at a level of 20
In this way the signals of the interstellar indicator are formed on the chart.
Note: The indicators shown in the image above are only for explanation and may not be part of the indicator
/
Why is the Interstellar Index the best deal you get?
It helps you find the best areas for early entry and exit.
It gives more profitable signals than false signals.
Unique strategy and easiest way to trade with high profit rate.
It works in all markets like stocks and forex, but the index is primarily developed in the cryptocurrency market.
Comes with an indicator called Interstellar Trend, this indicator displays Interstellar signals on all timeframes and helps to find solid opportunities.
Works great on large timeframes like 1d and 4h. It also works great on smaller timeframes but prefers to keep up with the trend.
It gives very high profit scores on background tests conducted over a historical period of 24 months.
Not repainted. Once the candle closes, the signal will not change.
Finally, try the indicator for yourself and you will not regret it. There is a 3-day free trial! Let me know if you are interested in the comments section. Send a message directly or request a free 3-day trial.

Hourly Scalp Engine◆ Purpose of this Script
The Hourly Scalp Engine (HSE) is designed to show scalp long opportunities on lower timeframes (H, 2H or 4H) based on a Fibonacci-valued MA-like structure. It was tested for Bitcoin and Ethereum, with the 2H timeframe seemingly giving the best test results. The chart shows a few instances where the price crossed below the HSE to trigger an entry (marked manually with arrows).
◆ Settings
Default scaling input (10.6) is tuned for Ethereum (ETH/USD) on Kraken.
Scaling input for Bitcoin (XBT/USD) on Kraken: 10.4.
Reasonable timeframes: H, 2H, 4H. Recommended timeframe: 2H.
You should probably set an alert for when Price crosses under the HSE.
◆ Instructions
As this is purely a scalp engine (and not feasible for long-term trades), the instructions have to be followed precisely for intended functionality:
As soon as Price crosses below the HSE, contemplate if you want to scalp, i.e. check current price, other indicators and market conditions. If yes, enter a scalp long. Do not enter the trade if : price has crossed above the HSE already and sits more than 1 % above it, or the down-wick was so deep and quick that it already retraced 10 % to the upside from the wick low (even if price is still below the HSE). In both cases it might be too late to enter.
Watch the 2H candle, at which you entered the trade, closing. Draw a 10 % price range from the wick low to the upside. The range high is your exit point. Set a take profit trigger there. Set a stop loss slightly below the wick low.
Observe the price action for the next 6 hours (i.e. the next three 2H candle closes). If price bounces up and hits the target, you exit with 10 % gains. If price hasn't moved to the target after 6 hours, close the trade at current price. If the stop loss should be hit in the meantime, you will have closed the trade automatically. The 10 % gain as a target was chosen because it seems to be hit very often, while higher targets are not reliably hit.
◆ Example Trade
Shown below is an example trade with correct drawing of the 10 % price range.
◆ Viability
From backtesting this should be a viable strategy for most instances where the HSE is crossed. However the HSE is not as hard as a boundary as e.g. the Confidence Bands (also published by DeanTrader), so that price can and will sometimes breach through (= close below) the HSE (as e.g. in the case of the March 2020 black swan event). Still even there a profitable trade could have been performed on the first bounce dependent on actual entry, although more risky due to very high volatility. Before using the HSE please make yourself familiar with the price action history of the considered asset and review the instances where the price crossed below the HSE in connection with the rules laid out in "Instructions" to understand the system and how to execute the trades. Also note that scalp trades are generally harder to perform than slower-paced swing trades, as timing becomes much more important and noise becomes relevant.
◆ Access
For access to this indicator please contact me via DM on TradingView or on Twitter (linked on my TradingView profile and in my signature).

ComboTrade V.2.1 (BuySell Signals,Take profit,4MA,Fibo,Ichi+QL)A WORD WITH ESTEEMED TRADERS:
The type of indicator that a trader uses to create a strategy depends on the type of strategy he intends to employ; this is related to the trading style and the trader's loss tolerance.
A trader looking for a long-term trade with high profits may adopt a follow-up strategy, and on the other hand, a trader who decides to make short-term trades with frequent but low profits may be eager to use a strategy based on price fluctuations. Different types of indicators can be used to confirm the results.
Indicators alone should not be used as a tool to make trading decisions. Instead, every trader should use indicators to receive trading signals and formulate trading strategies and determine his or her exact method.
Brief and essential description:
With the above description, traders are advised to use the ComboTrade indicator as a trading assistant. Using the tools embedded in this trading assistant makes it easy for traders and depending on the trading strategy, you can get the best result for positioning.
Note 1: The trading time frame for ComboTrade with over one hour (1H) will achieve best result. Checking out the lower time frame to buy or sell as a confirmation is recommended.
Note 2: At Trading View home screen choose “ Candles or ...” as “Bar’s Style”.
Once you added ComboTrade into to your chart, go to the setting gear of the ComboTrade indicator, which includes two sections: “Input” and “Style”.
The “Input” section is for the input values of the indicators and the “Style” section is for activating and deactivating the tools.
Activate Moving Average 7, 21, 50 and 200 with close (Default)
Activate Combo Cloud by tick the “Show ichimoku” if you use it (Default)
By activating ichimoku, three components will be added to the Como Cloud with below details:
1- The “Quality Line” shows the quality line (26 Kijun-sen future candlesticks) which helps the trader to understand the direction of the trend and will help the trader to make a decision.
2. The “Period Line” shows the 103-day period and can act as a support and resistance tool. In addition, this number can be changed.
3- The intersection of various Como cloud lines has also been installed.
The TP (Take Profit) signal indicates a similar buy or sell area using the RSI and Stochastic oscillators, and be sure to pay special attention to it. Be sure to tick the related box (TP) at “Style” section.
The “Trailing Stop” at “Style” section acts as a support and resistance line. It acts as a support when the price candle is placed above the Trailing Stop line and as a resistance if the price candle is placed below the Trailing Stop line.
At “Bot Key Value” in “Input” section, the number is adjustable from 0.25 to any number. According to the trader's strategy, the number of input and output signals in this section can be adjusted. The best number for BTC is 0.78 and for Altcoins is 0.78 to 1.
At “Bot ATR Period” in “Input” section, the best default number is 8. The best values for Altcoins is 8 to 10, which has a significant effect on the regulation of signaling and support and authority lines.
The “Bot Buy” and “Bot Sell” at “Style” section are the main and most important parts of the indicator that you must tick in order to active them both.
“Plot Background” can activate the Como Cloud and set it to green (ascending) and red (descending).
The “Labels” and “Lines” are related to the important Fibonacci tool, which by displaying the lines of the Fibonacci lines and by activating the label, the numbers related to the price and the Fibonacci numbers are displayed. It helps traders to extract data from the last few days.
DISCLAIMER:
ALL DECISIONS AND RISK MANAGEMENT, ETC. ARE THE FULL RESPONSIBILITY OF THE TRADER AND THE AUTHOR IS NOT RESPONSIBLE FOR THE POSITIONS AND THE RESULTS OF THE TRADES (POSSIBLE LOSSES) IN ANY WAYS. DO YOUR OWN RESEARCH (DYOR) BEFORE ENTERING/ EXISTING IN TO/ FROM ANY POSITIONS.
Please like and use your comments after using the indicator.
Always be Profitable!
JebraTrade
14 April 2021

TV Community AlgoTV Community Algo is a free TradingView script that I designed from the ground to benefit the traders of this community. It has plenty of features that you will enjoy, and I have included documentation for how to use this below!
Settings:
Basic:
Turn the Void Lines on or off
Turn the Dashboard on or off
Turn the Signal Bars on or off
Turn the Support & Resistance Lines on or off
Turn the EMA 8 and EMA 200 on or off
Turn the Buy & Sell Signals on or off
Turn the Fibonacci Retracement Tool on or off
Style:
Change the Dashboard's distance from the price action
Change the Dashboard's Color and Transparency
Change the Dashboard Text Color
Change the Fibonacci Deviation
Make the Fibonacci Retracement Tool reverse
Make the Fibonacci Lines extend left, right, both directions, or none
Turn Fibonacci Prices on or off
Turn Fibonacci Levels on or off and change between percent or value
Change Fibonacci Label Position from the left or the right
Usage:
This algo has many uses including but not limited to:
Finding entries and exits using the EMA 8 and EMA 200 crossovers
Using the Void Lines to identify bounces or reversals
Using the Signal Bars to identify trend and confirmation for entries and exits
Using the Dashboard information for confirmation and informational purposes
In the images below, I give a few examples of the many uses of the TV Community Algo!
VOID LINES
The Void Lines are very helpful when it comes to identifying reversals.
TV COMMUNITY ALGO DASHBOARD
The Dashboard is filled with useful information that all traders can benefit from!
SIGNAL BARS
The colored candles known as Signal Bars inform you of when the price action is above or below the midpoint of the Void Lines.
AUTO SUPPORT & RESISTANCE LINES
These lines help traders find accurate levels of support & resistance on all time frames, and the lines change color depending on if the price is above or below them.
EMA 8 AND 200
The EMA 8 and EMA 200 crossovers can be used as entry and exit signals.
BUY & SELL SIGNALS
The BUY & SELL signals can be used to find optimal entries and exits for trades on any time frame. Smaller time frames are best for scalping, while larger time frames are more suited for longer trades. When combined with the EMA lines and Dashboard information, these signals can produce incredibly profitable trades.
AUTO FIBONACCI RETRACEMENT TOOL
The Auto Fibonacci Retracement Tool allows you to plot perfect Fib Lines every time.
Conclusion:
I truly hope that the TV Community Algo benefits the TradingView community and that you all find some value in it. I worked very hard on this product and I would love to see it put to good use.
with love,
-Lemon 🍋
This work is licensed under a Attribution-NonCommercial-ShareAlike 4.0 International (CC BY-NC-SA 4.0) creativecommons.org

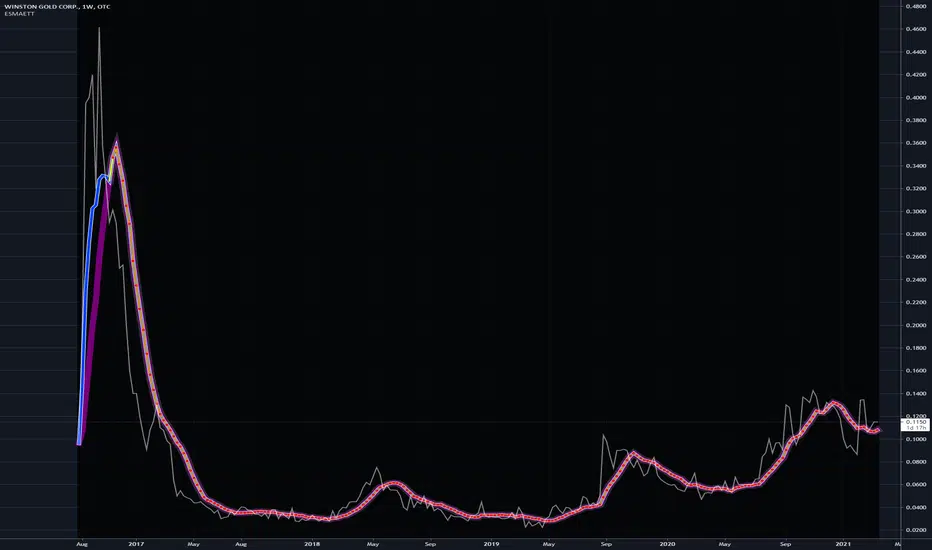
RSKYVNThis indicator is a combination of ema and sma which is good for trend analysis.
I put buy and sell signal in this indicator for an easy entry and exit.
How to use it?
First check our ma100. Ma100 shows trend analysis whether we are (uptrend and downtrend).
Second just wait for our biuy and sell signal.
This is profitable when ma100 is under our sma and ema region. So always wait that ma100 dive under ema and ma regions to enter a trade.
Disclaimer: This indicator is only good when there is a trend. The only flaw of this is when market is consolidating if that the case just switch to a support and resistance or fibonacci for entry and exit.
Always remember manage your own risk

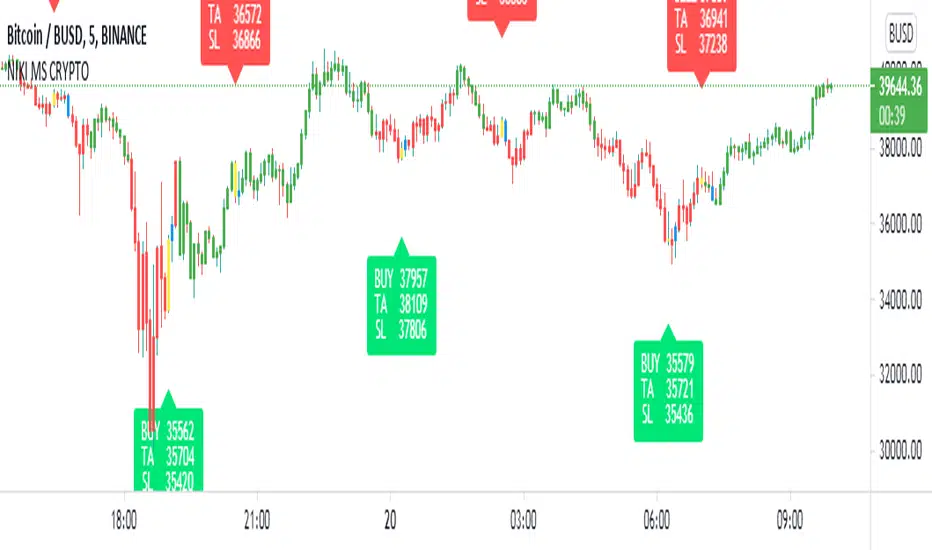
NIKI MS CRYPTOThis indicator is created specifically for BTCUSDTPERP, BTCBUSD, and BTCUSDT cryptocurrency pairs. It is not profitable in other cryptocurrency pairs. It only works on the 5-minute chart with a candle pattern. This indicator is just based on multi-timeframe Supertrend analysis. This indicator is more suitable for scalping. The target is 0.45% and the stop loss is 0.4%, which can be adjusted from the indicator settings. The yellow candle on the chart represents the entry and the blue candle represents the exit. All signals should be considered only after the candle is closed.
This indicator comes with Algo trading settings. By setting an alarm you can do robot trading in Binance.
Contact us using the links provided below to get access to this indicator.
Pivot Points AlgoThis is a Pivot Points Algo (PPA).
PPA uses an adaptive pivot algorithm that adapts to different market situations based on various factors.
PPA also includes depth filtering to make it more precise at its signal decision.
======= Signal Types ======
Main Signal of BUY and SELL shown by buy/sell labels.
Mini Signals of BUY and SELL shown by buy/sell arrows and shows additional breakouts after the Main Signal occurred.
Optional reversal signals show a possible reversal in trend (small triangle).
======= Alerts =======
Main Signals alerts - Alerts when a main Buy or Sell is triggered (Shown as Labels).
Combo Alerts - Alerts when main or mini signals of Buy and Sell are triggered (Shown as Arrows).
======= Assets and Time frames =======
Can be used on various assets, stocks, forex, crypto and works great for day trading as well as swing trading and long term investing.
PPA is designed to adjust to any time frame!
======= General info =======
The purpose of this indicator is to signal possible breakouts with a high rate of success.
PPA has been extensively tested and fine tuned to provide traders and investors with a valuable tool for timing long and short entries. However, no system is 100% perfect, and it is good practice to have a plan in place and use stop losses or other tools to mitigate unforeseen risk.
Also, note, I don't hide what PPA is doing as opposed to some other commercial indicators on the market. You can view pivot lines and pivot bands and so on.
The magic is the inner system itself which works for you to pinpoint the best entrance possible, I recommend confirming your own methods to make sure you want to take the trade.
To subscribe to Pivot Points Algo service see “Author's instructions” below.
For any question you can PM me.
Happy and profitable trading!

[astropark] Volume AnalyzerDear Followers,
today another awesome Analysis Tool, that you can use for day scalping: Volume Analyzer !
This indicator
works on every market, pair and timeframe
lets you see analysis of a different timeframes using the resolution parameter
has an optional trend colored background (I suggest to disable it if you use a different resolution)
integrates a tape profit strategy based on RSI (you can config it and enable/disable it)
lets you setup alarms on bull/bear signal as well as on TP RSI-based signals
I prefer to use this indicator in my day trading on low timeframes , like 5m - 15m - 1h, as you can have access to a more detailed volume information, but it works on high timeframes too as you can see in examples at the bottom of the description.
I truly think that Volume says a lot about future price action, as stated in my Cumulative Volume Delta (CVD) indicator, which you can find here below:
In this indicator, I'm much more interested in the bullish or bearish effect of volume generated by traders and following price action.
Be sure to understand that at current status this is not a complete automated strategy, but an analysis tool which aims to give you a positive bias, a profitable hedge in your trading journey.
As I always say, all tools are great if you use them correctly: this is not the "Holy Grail", so always use proper money and risk management strategies.
This indicator quite often calls bottoms and tops , most of the times it announces a coming reversals , sometimes it fails too of course.
Check this screenshot to have a clear idea of what I'm talking about:
You are supposed to discard signals of the same type that comes later and at a worse price (related to the trend) or you can use to re-fill your still-open position, using it as a re-entry.
You are supposed to act at first signals and average up/down if price goes against you when a new bear/bull signal appears at a better price.
Here it is another element you must consider: price action can deny a reversal stated by volume analysis .
In these cases, you must apply a stop loss in your trade and reverse your position. Don't average up/down your entry.
The reason in this screenshot below:
As you can see, the local downtrend was broken, as it was a simple pullback, previous bull trend was restored and price went up a lot!
The indicator here detected bears rejecting the run-up as much violently as they could, but that was a pullback, nothing more than that: main bull trend was still intact.
Another important advice: don't be greedy, always remember to take profits ! Avoid turning a winning trade into a losing one, which is a common mistake traders do.
That's why I decided to include an RSI based Take Profit algorithm inside:
when background is colored by green (and you can't see any bull signal), then you are in over bought region: start taking profits on you buy/long position or close it or set a trailing stop or a stop loss in profit!
when background is colored by red (and you can't see any bear signal), then you are in over sold region: start taking profits on you sell/short position or close it or set a trailing stop or a stop loss in profit!
when price is in a big overbought or oversold region, then you can see a "ob" label or a "os" label respectively
if you are in a bullish trend (you can see it from the trend colored green background as last signal was a "bull" one), "ob" becomes a clear "tp" - Take Profit advice
if you are in a bearish trend (you can see it from the trend colored red background as last signal was a "bear" one), "os" becomes a clear "tp" - Take Profit advice
Here some examples how you can use the signals produced by the indicator in order to be a successful trader.
I circled with pink signals you as supposed to take, then with a "$" pink backgrounded region where you are supposed to take profits, I finally put an X on failing signals, where you would theoretically have been stopped-out.
GBPUSD, 15m
ETHUSD, 1h
TSLA, 5m
BTCUSD, 15m
XAGUSD, 1h
EURUSD, 15m
SPX500, 1h
ETHUSD, 1D
ETHBTC, 6h
This is a premium indicator , so send me a private message in order to get access to this script.

Exotic SMA Explorations Treasure TroveThis is my "Exotic SMA Explorations Treasure Trove" intended for educational purposes, yet these functions will also have utility in special applications with other algorithms. Firstly, the Pine built-in sma() is exceedingly more efficient computationally on TV servers than these functions will be. I just wanted to make that very crystal clear. My notes elaborate on this in the code blatantly.
Anyhow, the simple moving average(SMA) is one of the most common averaging filters used in a wide variety of algorithms. "Simply put," it's name says a lot about it. The purpose of this script, is to demonstrate variations of it's calculation in a multitude of exotic forms. In certain scenarios our algorithms may require a specific mathemagical touch that is pertinent to our intended goals. Like screwdrivers, we often need different types depending on the objective we are trying to attain. The SMA also serves as the most basic of finite impulse response(FIR) algorithms. For example, things like weighted moving averages can be constructed by using the foundational code of SMA.
One other intended demonstration of this script, is running multiple functions for comparison. I have had to use this from time to time for my own comparisons of performance. Also, imbedded into this code is a method to generically and recklessly in this case, adapt an algorithm. I will warn you, RSI was NEVER intended to adapt an algorithm. It only serves as a crude method to display the versatility of these different algorithms, whether it be a benefit or hinderance concerning dynamic adaptability.
Lastly, this script shows the versatility of TV's NEW additions input(group=) and input(inline=) upgrades in action. The "Immense Power of Pine" is always evolving and will continue to do so, I assure you of that. We can now categorize our input()s without using the input(type=input.bool) hackTrick. Although, that still will have it's enduring versatility, at least for myself.
NOTICE: You have absolute freedom to use this source code any way you see fit within your new Pine projects. You don't have to ask for my permission to reuse these functions in your published scripts, simply because I have better things to do than answer requests for the reuse of these functions. Sufficient accreditation regarding this script and compliance with "TV's House Rules" regarding code reuse, is as easy as copying the functions in their entirety as is. Fair enough? Good!
When available time provides itself, I will consider your inquiries, thoughts, and concepts presented below in the comments section, should you have any questions or comments regarding this indicator. When my indicators achieve more prevalent use by TV members, I may implement more ideas when they present themselves as worthy additions. Have a profitable future everyone!
VuManChu ScalperThis indicator is a Moving Average crossing indicator .
Each alert is dependent upon the slow SMA, Medium EMA, and Fast EMA and can be highly profitable based on the time frame and DCA levels.
Adjusting each Moving Average length can result in various entries to be more aggressive or less aggressive.
To gain access to the script please send a message or visit the link below

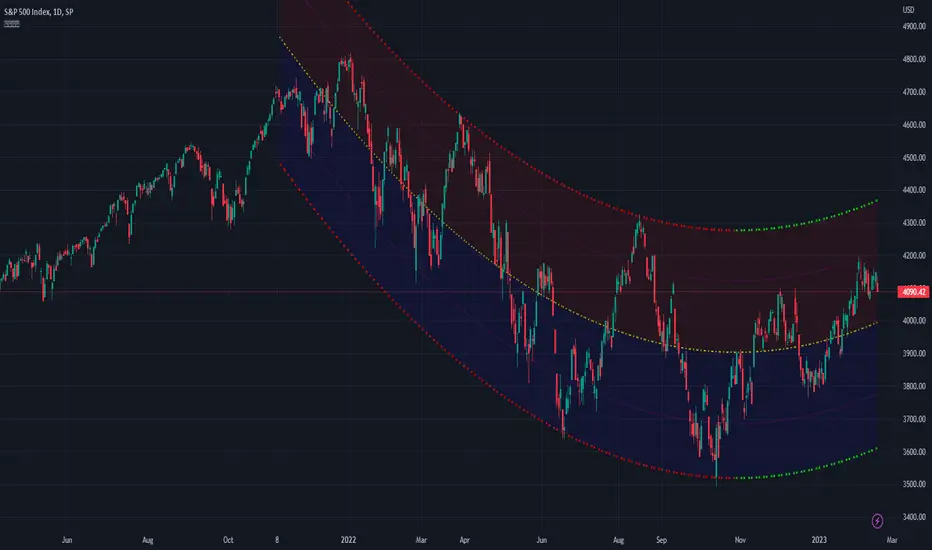
Quadratic Regression Trend ChannelIt's been a while since I have published anything meaningful for all members, but here is my next step in evolution of trend channel technology, my attempt at "Quadratic Regression Trend Channel" custom tailored for regression enthusiasts. I'm actually doing a lot more than my profile shall ever reveal. Many members may have heard of "polynomial regression channel"(PRC), but I wouldn't accurately label this as having the "poly-" capability in it with differing amounts of nth degrees/orders.
This indicator is derived from my "HLC Banded Quadratic Regression" indicator, the 3rd indicator I had ever published in my earliest days of tinkering around with Pine Script. It always had a destiny, and TV has graciously delivered on upgrading Pine with many new capabilities to run this algorithm with ease and in the manner that I wished to write it. Any subscribing TradingViewer has the freedom to use this indicator and as many as they shall desire.
Blessed is the "Immense Power of Pine" in 2021, as I utilized a multitude of new Pine features including extensive use of arrays for the quadratic regression formula, arrays of line.new(), input(group=), and input(inline=). I spent an incredible amount of time creating this, and it was no easy task to condense this amount of sophistication within less than 150 lines of code at the time of this original debut release. I have striven to achieve the indicator's computational efficiency potential to be as fast as possible with highly optimized code to handle the large amount of sampling it utilizes and is capable of. I hope you find it analytically favorable and beyond your expectations.
First of all, it has different sampling methods I haven't seen in any other PRC available, providing tightly snug and fit curvatures dependent on my optional choices not found in comparable indicators. This yields the best quality of fit I can provide by employing quadratic regression in order to provide a superb "visual analysis" of your price action in high noise environments. I also included my novel time warp feature to rewind the indicator regression into a previous state of time. If you're trading on really fast timeframes, I included an option to only calculate once per bar at it's closure. This will aid with computational efficiency of the TV servers, and it's intended to not to slow down your charting experience amongst a wide assortment of other indicators in your overlay chart.
I allowed a couple of variability methods for the confidence bands. A variety of coloring options, line thickness, and other perks are there to accommodate your distinct visual acuity. There is also a nifty option to color the regression by the slope of the curvatures. This is enabled by default, and I anticipate that you may find that color option uniquely useful. The amount of chords in the curvature are automatically calculated depending on the regression period selected to achieve a nice fluid arch for any setting.
Anyhow, I believe that sums up most of it's important characteristics in a brief explanation. It's potential is best personally discovered by simply using it with the myriad of control settings available. I published it with protected code, because I simply wanted to confine this monstrosity to my TradingView laboratory. I would rather not have this thing uncaged, rabidly running around the planet frothing out of the mouth on a Frankenstein AI later, unless it's mine on a short leash. Besides, I'm still trying to figure out the math behind "cubic regression". :)
Sorry in advance about not providing the source code, I hope you'll understand... We ALL know what devastation happens when things are "unleashed" from a BSL-4 lab to run amok. Countless billions have yet to learn a horrific lesson about the mania of evil at a future Geneva convention. If you don't know the mythical story about Pandora's box(a jar actually), look it up!
Features List Includes:
Calculation Throttling
Regression Period
Time Warp
Multiple Sampling Methods
Confidence Bands Variability Controls
Indicator Customization Options
When available time provides itself, I will consider your inquiries, thoughts, and concepts presented below in the comments section, should you have any questions or comments regarding this indicator. When my indicators achieve more prevalent use by TV members , I may implement more ideas when they present themselves as worthy additions. Have a profitable future everyone!
Monthly Withdrawals [racer8]This calculator tells you the maximum monthly withdrawal you can make based on amount of equity you have, your strategy's average annual return, and the maximum percentage reduction in monthly return that you are okay with. There are 3 parameters: $ Equity, % annual return, and % of return reduction. With these 3 parameters, it will calculate $ monthly withdrawal. % of return reduction tailors how much as a %, you want to withdraw from monthly returns. % of return reduction is a good approximation for annual % reduction in returns.
I built this calculator because I wanted to find a way to withdraw every month without hurting my portfolio's returns too much. This is very useful if say you are a full time trader, and you rely on trading for monthly income. Keep in mind that the bigger the withdrawals are, the higher the % reduction in annual returns will be for your portfolio. Also keep in mind that this only applies to profitable strategies with positive annual returns. The purpose is to make small withdrawals every month so that your trading account can still grow at a reasonable pace. Enjoy :)
Clean Market IndicatorI built this indicator to give a clear indication for when to look for long or short opportunities. It’s a very powerful indicator on both small- and large-time frames. So, whether you’re day-trading or trading a few times a week, this indicator will help you to improve your trading abilities. Since I’m a fond believer of the idea that a picture will tell a thousand words, please check out the pictures below.
Green = Bullish trend
Red = Bearish trend
Orange = Potential trend reversal
Black = No Signal
How to trade: in strong trending markets you could wait till the background changes into your desired color and trade that direction once it does. Another way to trade is to look for long opportunities in a certain market when the larger time frame’s background is green, since the trend is bullish and you don’t want to trade against the trend. In the end, countless possibilities to use this indicator to make yourself better at finding profitable opportunities.
Take a look at the pictures below where I show some different assets and timeframes with the Clean Market Indicator.
See below for examples:

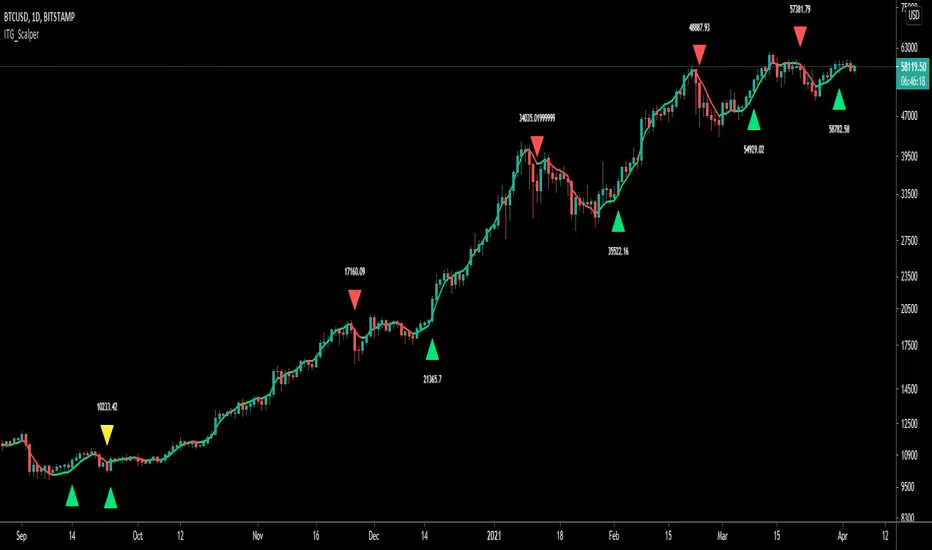
ITG ScalperITG Scalper by Complector.
Inspired by Juboal-Rabaroansa Perosteck Alseyn Balveda dam T'seif
Methology:
- I am using a TEMA (triple EMA) to determine the local trend direction and to give buy & sell signals when the trend changes.
- An optional filter, using moving average convergence divergence (MACD), can be switched on to filter out 'false' signals.
- The calculation of the TEMA does not request data from a resolution higher or lower than the resolution of the main charts symbol,
However, the filter function does, if another resolution is chosen for the filter.
- Persistent variables are used for buy and sell prices, enabling color-coding of the sell-signal (profitable or not).
Features:
- Color coded TEMA - bullish=green , bearish=red
- Buy/Sell indicator - Sell indicator: green=profit, yellow=loss
- Optional noise filter
- Optional variable time-frame for noise filter
Remarks:
In my experience, the default values works best on the daily time frame. I encourage everyone to experiment with the values for best results.
Using the script on non-standard charts (Heikin Ashi, Renko etc.) can produce unrealistic results.
Using a resolution higher or lower than the main charts symbol for the filter can possibly lead to repainting.
Thanks to Iain M. Banks for making my life richer :-)
Ravih Pro Momentum BreakoutThis is a Momentum Breakout Strategy on “DAILY Timeframe”
This Breakout Strategy is specially created for Momentum Traders and for Bursa Market. The learning applied here are derived from past market behavioural approach. It takes into account of recent strength of price action and volume.
However, it can be applied for other Exchanges as well; as long as the stock is active with unusual volume.
The Momentum Set-Ups Script is designed for Short Term traders as in 3 to 60 Trading Days holding period or unless and until Exit Signal appears. Sometimes it could extend longer depending on the pace of the Momentum.
It also caters the aggressive traders as in Buy Today Sell Tomorrow/Today (BTST) and Fast in Fast Out (FIFO). These are traders...usually looking for 5% to 7% or 12% gain in a short span of time. However, do take note; momentum stocks are explosive in their moves. Therefore one could maximise the Gain Ride until Exit/Sell Signal appears.
The Script provides you the best High-Probability Profitable Set-Up Entry. The system identifies the stock/s in action Right Now. It is a powerful strategy for trading both Fast and Slow Momentum Stocks.
The Momentum Script is built around 3 Primary Factors namely…
1. Volume
2. Price Action
3. Time
And 2 Secondary Factors namely…
1. Volatility
2. Liquidity
Buy Exit/Sell Arrows are triggered based on last candle bar closed. It plots automatically.
For Long
Light Blue Up Triangle denotes Buy at the Closing Price. Entry Price is Closing Price or with + or – 2% tolerance for the following market day.
For Exit/Sell
Orange Down Triangle denotes Exit to close any remaining position to free up capital. Or...
Red Down Triangle denotes Exit to close any remaining position to free up capital.
Either one of the arrow is Final.
For Setting Up Alerts
The user has the option to Setup Alerts for chart signals that is…for Long and for Exit/Sell.
For Demonstrative purpose...
I have on purpose chosen an O&G counter from a Cold Sector from MYX. This is a time of Pandemic. Therefore, choosing Technology or Glove and Healthcare Sectors would definitely reflect good performance. The idea here is to demonstrate that the Momentum Strategy application works on all market conditions anytime of the year.
Remember...
This strategy is only built for stocks. It is Not for Indices neither for any other financial instruments.
No SHORT signals in this strategy.

Multi-Indicator/Multi-Timeframe Panel | Agora AlgoWe strongly believe in order to be a profitable trader you need to understand what is happening on multiple timeframes, not just the timeframe you are trading on. We put together this script to help traders fix that problem and make multi-timeframe analysis as simple as a small "Panel" that you can glimpse at as well as customize. Too often we see traders focusing only on lower or singular timeframes resulting in opening positions at overbought/oversold areas or against the long-term trend. Hopefully with this approach we can help encourage all traders to take the initiative and responsibility to really do that multi-timeframe analysis.
The way it works is very simple but very useful. By default the script is looking for the direction of trend on all timeframes and sending that data to the "Panel". You as the user have the ability to change what the script/"Panel" will look for. Other available analysis methods are detecting RSI oversold and RSI overbought conditions on all of the timeframes as well as detecting Bollinger oversold and overbought conditions on all of the timeframes. You as the user also have the ability to customize all kinds of variables so that you are able to find what best suits your trading style.
Customizable options/variables:
MA Calculation Type
Fast/Short MA Length
Slow/Long MA Length
RSI Length
Bollinger Bands Length
Bollinger Bands Standard Deviation
Reference Manual/Documentation:
For Trend Detection the emoji ⏫ means UPTREND
For RSI Detection the emoji ⏫ means OVERBOUGHT
For Bollinger Detection the emoji ⏫ means OVERBOUGHT
For Trend Detection the emoji ⏬ means DOWNTREND
For RSI Detection the emoji ⏬ means OVERSOLD
For Bollinger Detection the emoji ⏬ means OVERSOLD
The 🔲 emoji means that neither of the above conditions are TRUE which usually when only happen when using RSI or Bollinger Mode.
The 🔲 emoji will also mask any timeframe lower than the timeframe you are currently viewing on the chart. Because security functions are used in this script/indicator we have taken the necessary precautions to follow
Tradingview/Pinescript best practices. With that being said best practices advise not to pull data from lower timeframes as security functions were initially intended for pulling higher timeframe data. Best practices tell us
there is a good chance of data loss when attempting to pull data from lower timeframes so we have removed the ability/chance of that happening.
Bonus Customizations:
You as the user also have the ability to enable a shortened version of the reference manual onto the "Panel" by enabling the option in the settings. If you need to get a quick idea of what the terminology stands for you could
check there and it will be defined for you.
We hope you enjoy what we have created and would appreciate any feedback! Remember guys, RISK MANAGEMENT and DO YOUR MULTI-TIMEFRAME ANALYSIS! Cheers!

Ravih Pro Trend BreakoutThis is a Trend Breakout Strategy on “DAILY Time-frame”
This Strategy is designed keeping in mind with Medium to Long Term traders. The strategy works only on Daily Time-frame and on Closing Price.
The concept here is to identify assets with potential change in trend. Primary focus is to position for the big move. There are times... trying to catch every trend, many of which can be unprofitable especially in side-way market. However, the primary purpose of this strategy is to catch all the major trend movements, which are much more profitable than minor market losses in all the side-way market.
I’ve simplified it to make it user-friendly.
How to use?
Set it to Daily Time-frame.
Buy, Take Profit 1,2,3 and Exit signals are included on chart based on the current Trend direction. The system shows an Exit signal if the system’s exit conditions are met. It works only on Daily Time-frame and on Closing Price.
Dark Blue Up Triangle denotes Buy at the Closing Price. Entry Price is Closing Price or with + or – 2% tolerance of the Closing Price for the following market day.
Purple Down Triangle denotes Exit to close any remaining position to free up capital.
Little Green Up Triangles denote the Bulls are in Control and Overpowering the Bears and represents minor Buying opportunities with strong probability of continuing up-moves.
Setting Up Alerts
The user has the option to Setup Alerts for all chart signals that is…
For Buy, for Exit, for Take Profit 1 set at 24%, for Take Profit 2 set at 48% and for Take Profit 3 set at 72%
The user also has the option to adjust the Take Profit as per their desire. However, the predetermined Take Profit set for this strategy does work reasonably well.
Remember...
This strategy is only built for stocks. It is Not for Indices neither for any other financial instruments.
No SHORT signals in this strategy.

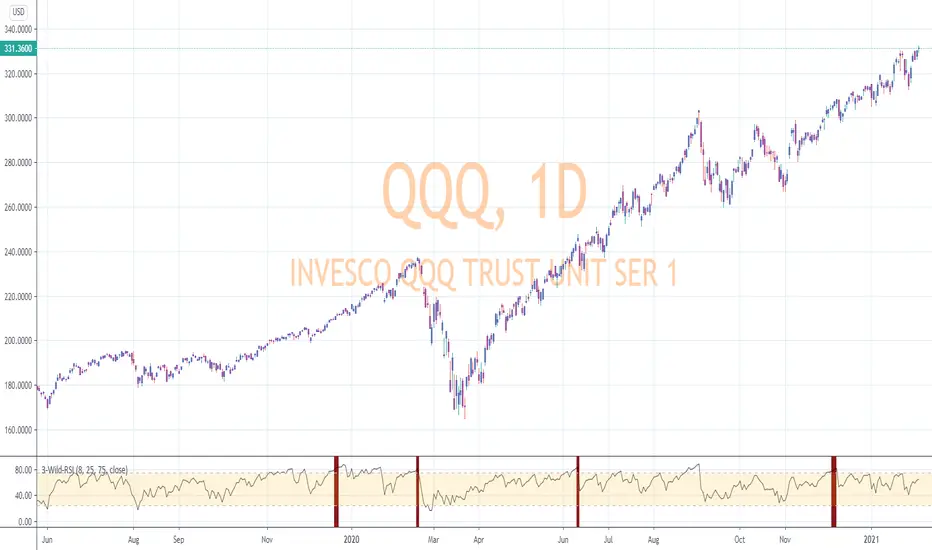
RSI-Last-3-ExtremaThis script indicates when the current Relative Strength Index of the last 8 closes is beyond a level from center oscillation which signals the equity is likely to reverse course. When it is the lowest RSI reading of the prior 3 readings and below 25, a green vertical bar will appear signaling a potential BUY point. Likewise, the highest reading of the prior 3 RSI readings and above 75 will signal a vertical red bar or SELL signal. The bar has to have a final close price for the signal to be active. Reversal could take a few more bars to occur depending on the timeframe and equity symbol.
You will be able to find many charts that have this signal perfectly finding the top or bottom of a significant trend.
It successfully indicates profitable reversal around 80% of the time. So far, It is 85% accurate or better in determining downtrend start points on the Daily, 120, 60, 30 Minute charts according to the study of more than 10,000 occurrences. It is 86% accurate on the 30 Minute chart.
This is another tool I use in finding or confirming potential price action. Hope you find it useful.
To add this, favorite the script by clicking "Add to your Favorite Indicators" at the top of the code portion below. On your top tool bar is an "fx" button with a downward arrow to the right of it. Click on the downward arrow/caret and scroll down to "RSI-Last-3-Extrema". Click on this title and it should add to the bottom of your current chart. If you do not see BUY (green vertical bars) or SELL (red vertical bars) right away, try other charts and timeframes.
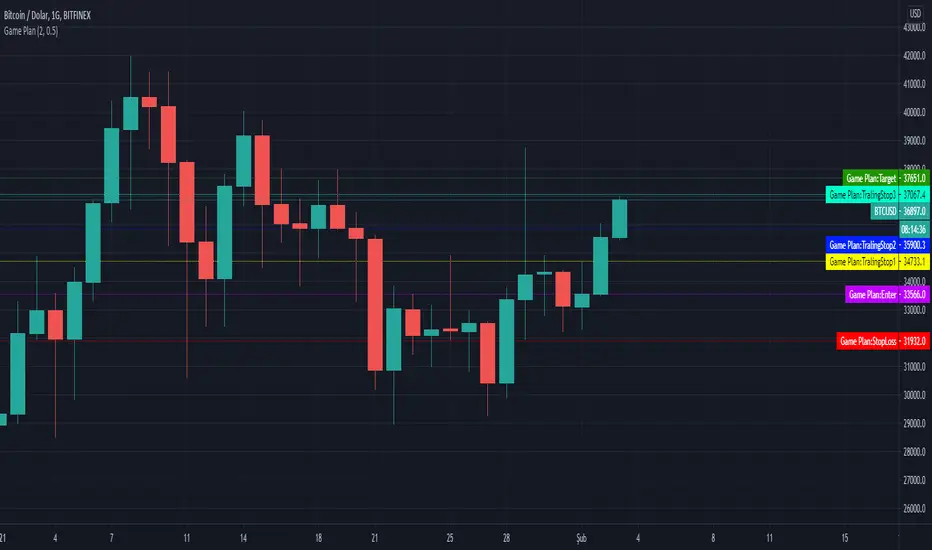
Game PlanAllows to automatically calculate Ali Persembe's, who wrote Teknik Analiz mi Dedin? Hadi canım sende, Game Plan Strategy
What is the Game Plan?
ALi Persembe claims, If you create a game plan for yourself and follow this plan completely, you will increase your profit. He tells that there is nothing to surprise you when your stop loss and target is determined in your game plan. You only need to follow this plan.
How does the indicator work?
It helps you determine your target price and stop point according to the risk ratio you will take on the basis of Atr, regardless of technical analysis.
The minumum risk ratio is calculated as 0.5 Atr according to the Atr 14 period. It automatically sets 2.5 times the risk ratio taken as your target price.
With this game plan, the more goals you reach by trading, the more profitable you will be. By reaching your target at risk ratio, you can determine the stops that follow the
Allows you to move your stoploss level up.
You can change your risk rate in the indicator settings. Minumum risk rate can be 0.5 maximum can be 5.
You can also choose the time you want to calculate your game plan from the indicator settings. Calculation can be made up to 100 bars before.
This indicator helps you to set a target on the basis of ATR, independent of technical analysis.
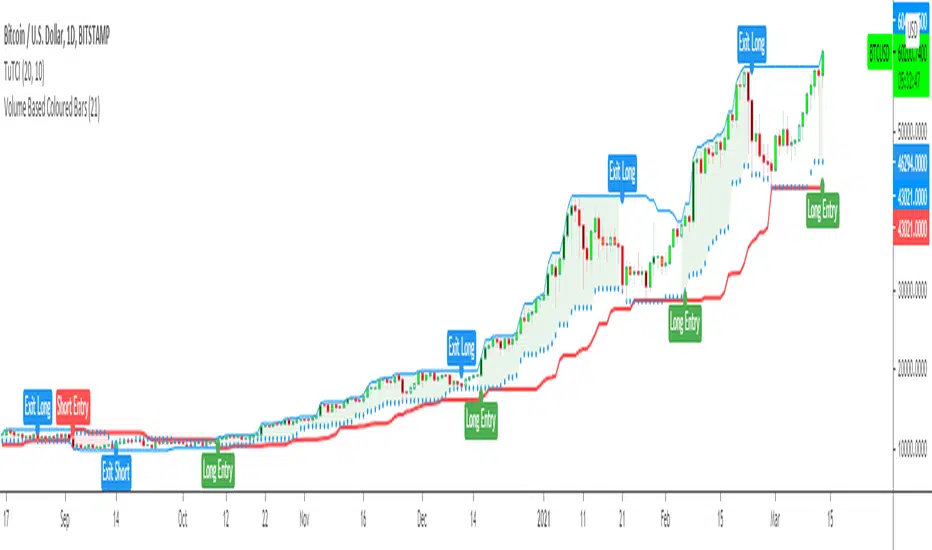
Turtle Trade Channels Indicator TUTCILegendary trade system which proved that great traders can be made, not born.
Turtle Trade Experiment made 80% annual return for 4 years and made 150 million $
Turtle Trade trend following system is a complete opposite to the "buy low and sell high" approach.
This trend following system was taught to a group of average and normal individuals, and almost everyone turned into a profitable trader.
They used the basis logic of well known DONCHIAN CHANNELS which developed by Richard Donchian.
The main rule is "Trade an 20-day breakout and take profits when an 10-day high or low is breached ". Examples:
Buy a 20-day breakout and close the trade when price action reaches a 10-day low.
Go short a 20-day breakout and close the trade when price action reaches a 10-day high.
In this indicator,
The red line is the trading line which indicates the trend directio n:
Price bars over the trend line indicates uptrend
Price bars under the trend line means downtrend
The dotted blue line is the exit line.
Original system is:
Go long when the price High is equal to or above previous 20 day Highest price.
Go short when the price Low is equal to or below previous 20 day Lowest price.
Exit long positions when the price touches the exit line
Exit short positions when the price touches the exit line
Recommended initial stop-loss is ATR * 2 from the opening price.
Default system parameters were 20,10 and 55,20.
Original Turtle Rules:
To trade exactly like the turtles did, you need to set up two indicators representing the main and the failsafe system.
Set up the main indicator with EntryPeriod = 20 and ExitPeriod = 10 (A.k.a S1)
Set up the failsafe indicator with EntryPeriod = 55 and ExitPeriod = 20 using a different color. (A.k.a S2)
The entry strategy using S1 is as follows
Buy 20-day breakouts using S1 only if last signaled trade was a loss.
Sell 20-day breakouts using S1 only if last signaled trade was a loss.
If last signaled trade by S1 was a win, you shouldn't trade -Irregardless of the direction or if you traded last signal it or not-
The entry strategy using S2 is as follows:
Buy 55-day breakouts only if you ignored last S1 signal and the market is rallying without you
Sell 55-day breakouts only if you ignored last S1 signal and the market is pluging without you
You can Highlight the chart with provided trade signals:
Green background color when Long
Red background color when Short
No background color when flat
WARNING: TURTLE TRADE STOP or ADDING more UNITS RULES ARE NOT INCLUDED.
Author: Kıvanç Özbilgiç
Also you can show or hide trade signals with the button on the settings menu
[FTA] Double Responsive Price FilterThis is a very special indicator which uses a series of double filtering methods to filter out bad price data.
Each filter uses a very complex mathematical formula to obtain the data, based on the Wave Function, then applies initial signal filtering on the output.
The output of each filter is then compared to each other, and the output of this stage goes through another signal filtering process which is used in aviation industry (NASA) to track objects and keep them under radar!
The final output is then squeezed through a truncated bandpass filter and plotted as two colors.
This is to ensure a very quick and responsive entry and exit signal without any lagging, and also to ensure that the trader stays in the trade as long as profitable!
Buy when color is aqua.
Sell when color is fuchsia.

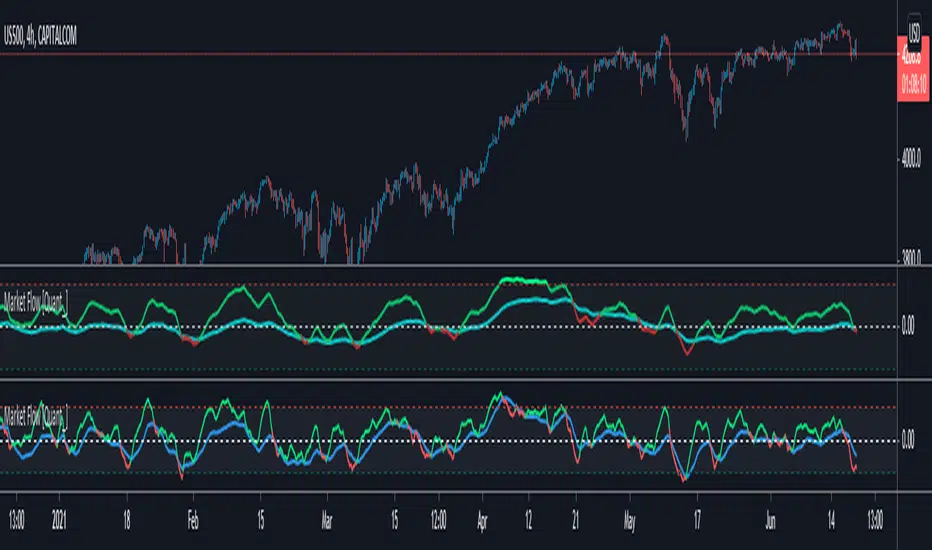
Market Flow IndicatorHOW IS THIS INDICATOR DIFFERENT ?
This is a forked and even simpler version of the premium indicator Trend Volume RSI Analysis . Please, read its description on my profile page so that you can understand what changes have been made here and why.
Although in Trend Volume RSI Analysis you have only one parameter to configure (length), you need to choose between 3 options for the analysis - Trend, Volume, or RSI. You also have an option to highlight the buy and sell zones. For me, this is a lot of switching. Alternatively, if I want to see the whole picture, I have to apply the indicator twice or even three times, which limits the space on my screen for the candlestick chart. However, a lot of work has gone into creating that indicator and it works great. If it isn't broken, why fix it, right?
So, I forked Trend Volume RSI Analysis and modified some of the formulas, as well as effectively combined the Trend and the RSI parts into one simpler indicator. No more switching. Also, the Buy and Sell colors change based on crossovers. No more zones either.
WHAT DOES THIS INDICATOR DO ?
Market Flow Indicator shows two things - price direction (blue line) and momentum (green line). In the first screenshot below the indicator is applied to the 1h chart of SPX500 to show direction and on the second screenshot I use a 1h chart of BTC/USD in which you notice divergence, formed as a result of exhausted momentum. The indicator works equally well with cryptocurrencies, indices, commodities, and currency pairs.
The line colored in green and red is a modified RSI and the blue line is called Momentum (those are their names for now, but please check the updates below if anything has changed). Their colors are configurable in the settings panel.
In order to standardize the numbers without any modifications to the formulas, the RSI numbers are brought down by 50. In other words, the equivalent of an RSI overbought extreme (100) is 50 in the Market Flow Indicator, and the equivalent of an oversold extreme (0) is -50 in this indicator. Default lines here are set at 25 and -25, which are the equivalent of 75 and 25 respectively.
That's pretty much it. The idea behind Market Flow Indicator was to be super simple and to be used with minimum configuration if any at all. Once you get a grasp of it, it shouldn't take you more than a few seconds to know if you should stay flat or look for a long/short position.
HOW MUCH DOES IT COST ?
Although this may look like a simple indicator, I have spent a great deal of time testing and optimizing it to achieve this level of simplicity and practicality. Also, I will continue to update Market Flow Indicator as well as introduce user-requested features if they will improve its overall performance. For these reasons, this is a paid indicator, but I do give a free trial so that you can test it out for yourself. If you want to gain access, please use the provided information below or just message me. Thank you for your time.
Disclaimer: The purpose of all indicators is to indicate potential setups, which may lead to profitable results. No indicator is perfect and certainly, no indicator has a 100% success rate. They are subject to flaws, wrongful interpretation, bugs, etc. This indicator makes no exception. It must be used with a sound money management plan that puts the main emphasis on protecting your capital. Please, do not rely solely on any single indicator to make trading decisions instead of you. Indicators are storytellers, not fortune tellers. They help you see the bigger picture, not the future.