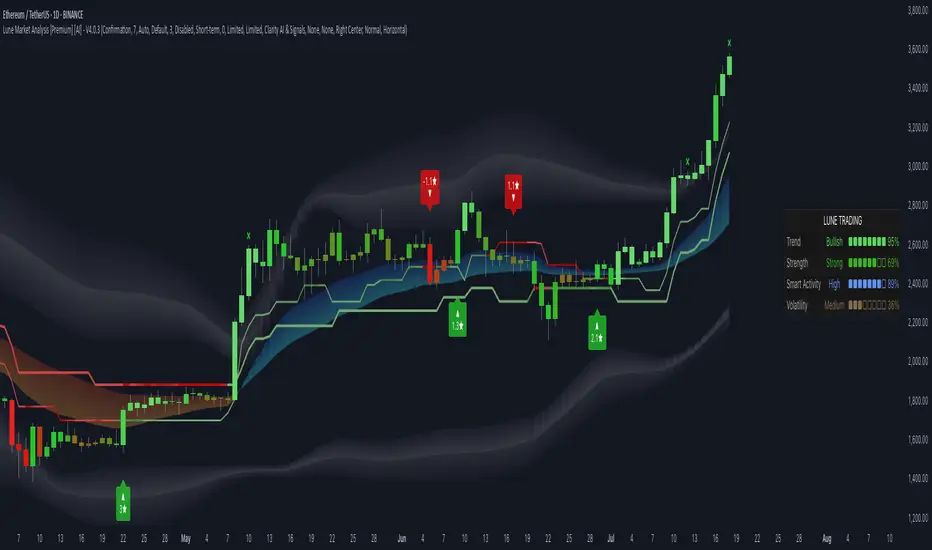
Lune Market Analysis Premium- Version 0.9 -
Lune Algo was developed and built by Lune Trading, utilizing years of their trading expertise. This indicator works on all stocks, cryptos, indices, forex, futures , currencies, ETF's, energy and commodities. All the tools and features you need to assist you on your trading journey. Best of all, Lune Algo is easy to use and many of our tools and strategies have been thoroughly backtested thousands of times to ensure that users have the best experience possible.
Overview
Trade Dashboard—Provides information about the current market conditions, Such as if the market is trending up or down, how much volatility is in the market and even displays information about the current signal.
Trade Statistics—This tool gives you a breakdown of the Statistics of the current selected strategy based on backtests. It tells you the percentage of how often a Take Profit or Stop Loss was hit within a specific time period. Risk and Trade management is very important in trading, and can be the difference between a winning and losing strategy. So we believe that this was mandatory.
Current Features:
Advanced Buy and Sell Signals
Exclusive built-in Strategies
Lune Confidence AI
EK Clouds
Reversal Bands
Vray (Volume Ray)
Divergence Signals
Reversal Signals
Support/Resistance Zones
Built-in Themes
Built-in Risk Management system (take profit/stop loss)
Trade Statistics
Trade Assistance
Trade Dashboard
Advanced Settings
+ More coming soon, Big plans!
Features Breakdown:
Lune Confirmation—Used to help you confirm your trades and trend direction. It uses unique calculations, and its settings can be adjusted to allow traders to adapt the settings to fit their trading style.
Lune Confidence AI—All strategies are equipped with our exclusive built-in Confidence AI. This feature tells you how much confluence there is in a trade. It uses a rating system where signals are given a number from 0 to 5. A rating of 0 indicates that there is not a lot of confluence or confidence in the signal, while a rating of 5 indicates that there is a lot of confidence in the trade. This feature is not perfect and will be improved overtime.
Support/Resistance Zones—Calculates the most important support/resistance levels based on how many times a level has been used as support or resistance. Traders also refer to these as supply and demand zones and key levels.
EK Clouds—Used to further help you confirm trend and was optimized to also be used as support and resistance. This feature is powered by custom moving averages.
Reversal Bands—An optimized and improved version of the infamous Bollinger Bands. When price action takes place within the Reversal Bands it usually indicates that the current symbol is overextended and a reversal is possible.
Vray—Also Known as "Volume Ray", Assists you in better visualizing volume. This helps you find key levels and areas of support that you wouldn't be able to see otherwise. It helps you trade like the institutions.
This indicator's signals DO NOT REPAINT.
If you are using this script you acknowledge past performance is not necessarily indicative of future results and there are many more factors that go into being a profitable trader.
"profitable" için komut dosyalarını ara
Trend101 v5Welcome to what I believe to be the best indicator on TradingView. Trend101 v5
"Not all trends are made equal"
You should be only trading the trends that matter most... The basis of this script is using volume to rank price trends and give more prominence to the trends that are backed by volume, enabling you to only focus on riding the trends that matter.
If we see a trend with high volume, this will show up in the indicator with larger green or red columns / bars & the trends with low volume will cause little movement in the indicator.
Some indicators are great at showing price trends, some are great at showing volume... Trend101 v5 is great at showing both of these.
This indicator can be used in a variety of ways:
1) The most simplistic is to trade crossovers from Bull > Bear trends and vice versa. This alone can be profitable with a "scalping" mindset where you ride the trend until it shows signs of weakness.
2) The other way I use this indicator is to act as a confirmation tool... for example if price is approach a level of support, you can wait until the price shows signs of rejection and then your confirmation for entry is that Trend101 v5 will change to green. (& the opposite for levels of resistance).
Finally you are also able to use the Timeframe input to select different timeframes, this is useful to use two Trend101 indicators together to filter trade entries. An example would be using one Trend101 indicator set on the 15min timeframe and one set on the Daily timeframe and when both of these align in the same trend direction you are able to enter your trade.
I will produce a video "How To..." guide for this indicator shortly to explain other details.
Let me know in the comments below how you are using the indicator and all feedback is welcome.

RT BUYSIGNALAccurate buy and sell signals live on chart. Use it in combination with the RSI and Bollinger Band and it will be a great addition to your trading strategy.
You hear so much about crypto these days. In all fairness, you easily get confused. People promoting their super star project and found the next big in trading. It is true though if you know what you are looking for you the opportunities are right there. A trading strategy that works and fits your style too. Most people however do not know what to look for and keep jumping from thing to another, ending up with no profits and certainly little to no joy.
We have been in this place. Until we finally came to a point where we started to get some sense of what was out there and more importantly what was working. This is where we started to become profitable and to actually enjoy whilst trading. Let us tell you though, this is no get rich quick scheme, you may be lucky, but in most cases, it does simply require effort. We thought ourselves, we like educating others, so why not combining this and get you to a flying start in trading crypto.

MM SIGMA STC+ADXThe Schaff Trend Cycle (STC) is a charting indicator that is commonly used to identify market trends and provide buy and sell signals to traders. Developed in 1999 by noted currency trader Doug Schaff, STC is a type of oscillator and is based on the assumption that, regardless of time frame, currency trends accelerate and decelerate in cyclical patterns.12
How STC Works
Many traders are familiar with the moving average convergence/divergence (MACD) charting tool, which is an indicator that is used to forecast price action and is notorious for lagging due to its slow responsive signal line . By contrast, STC’s signal line enables it to detect trends sooner. In fact, it typically identifies up and downtrends long before MACD indicator.
While STC is computed using the same exponential moving averages as MACD, it adds a novel cycle component to improve accuracy and reliability. While MACD is simply computed using a series of moving average, the cycle aspect of STC is based on time (e.g., number of days).
It should also be noted that, although STC was developed primarily for fast currency markets, it may be effectively employed across all markets, just like MACD. It can be applied to intraday charts, such as five minutes or one-hour charts, as well as daily, weekly, or monthly time frames.
Introduction to ADX
ADX is used to quantify trend strength. ADX calculations are based on a moving average of price range expansion over a given period of time. The default setting is 14 bars, although other time periods can be used.1 ADX can be used on any trading vehicle such as stocks, mutual funds, exchange-traded funds and futures.
ADX is plotted as a single line with values ranging from a low of zero to a high of 100. ADX is non-directional; it registers trend strength whether price is trending up or down.2 The indicator is usually plotted in the same window as the two directional movement indicator (DMI) lines, from which ADX is derived (shown below).Quantifying Trend Strength
ADX values help traders identify the strongest and most profitable trends to trade. The values are also important for distinguishing between trending and non-trending conditions. Many traders will use ADX readings above 25 to suggest that the trend is strong enough for trend-trading strategies. Conversely, when ADX is below 25, many will avoid trend-trading strategies.
ADX Value Trend Strength
0-25 Absent or Weak Trend
25-50 Strong Trend
50-75 Very Strong Trend
75-100 Extremely Strong Trend
Low ADX is usually a sign of accumulation or distribution. When ADX is below 25 for more than 30 bars, price enters range conditions, and price patterns are often easier to identify. Price then moves up and down between resistance and support to find selling and buying interest, respectively. From low ADX conditions, price will eventually break out into a trend. Below, the price moves from a low ADX price channel to an uptrend with strong ADX.
Added Buy/Sell alerts
ADX filters based on the threshold you put in the settings.
great for trend and trade confirmation

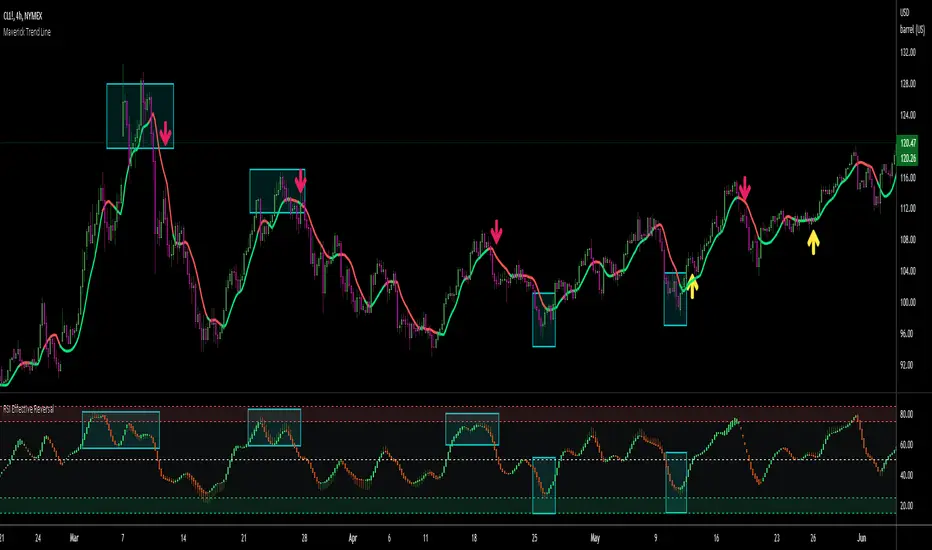
Maverick Trend LineBackstory of the Maverick Trend Line:
If you just want to know what the indicator does and how it works, you can skip this part and jump straight to the next section. However, I thought it would be useful to provide some background as to how I came up with this script, as it turned out to be quite different from what I originally planned it to be.
This is the second indicator, part of a trading strategy, which is constructed to work alongside " RSI Effective Reversal ". In some of the earlier (draft) versions, there were gazillion trend lines, so much so that they were obstructing what was the most important thing - price action. Gradually, I started reducing them, while incorporating other indicators like Directional Movement, RSI, Quantitative Qualitative Estimation (QQE) indicator, slope adaptive moving averages, etc.
Originally constructed as a strategy, when backtested, this indicator was profitable on the major assets I was trading - SPX500, Crude Oil, Copper, Natural Gas, BTC and ETH . I tested it on the 1h and 4h time frames (those that I trade in). I implemented fairly simple entry criteria - go long when RSI is oversold and price crosses up a certain trend line and go short when RSI is overbought and the price crosses down a certain trend line.
Now, why didn't I release this as a strategy? The results were good, but not nearly as good when trading experience and subjective decision-making were implemented. The script does not take into account trend lines that are easy to see with a naked eye, nor does it account for support and resistance levels. As such, a trader with some minor experience could make much more profit by implementing "the art of trading" as opposed to mechanically following entries and exits (at least with this script).
Maybe I didn't develop it well enough to be a comprehensive automatic strategy, but I've spent over 6 months testing different variations and it never outperformed manual trading with subjective entries, stop losses set at key levels (as opposed to trail stop-loss) and adding up to existing positions when the right opportunities come. So, let me just recap before we get to the important part of how the indicator works. Maverick Trend Line, when implemented with "RSI Effective Reversal" works like a charm when used manually (as guidance), and only merely outperforms a buy and hold strategy (based on a year-over-year basis on the backtesting engine).
What does the Maverick Trend Line do?
The now very trimmed version consists of two major elements - Price Base Line and Trend Base Line . The former is a Qualitative Quantitative Estimation (QQE) moving average with some smoothing modifications, while the latter is an adaptive moving average, again with some adjustments for smoother results. The parameters that you can tweak are:
lengths of the moving averages
QQE factor
smoothing factor
type of moving average, being used as a base for generating the base lines. You can choose between EMA, SMA, RMA, WMA and ALMA
Since Price Base Line follows the price closely and the Trend Base Line follows the overall trend, the Maverick Trend Line is a combination of both, following the price action closely, while still giving it some "room to breathe". You can switch between the two base lines or Maverick at any time.
How to use the Maverick Trend Line?
I am a huge fan of simplicity (which you may already know if you've checked some of my other indicators), so there's a minimum number of steps to follow before being able to use the indicator. By default it's switch to Maverick. I suggest unticking the box, tweaking the Price and Trend Base Lines according to the asset(s) you will trade (but do not attempt to perfectly fit it to the price) and once you are ready, switch back to Maverick. Alternatively, if you will find it useful, apply the indicator twice and have all the three lines at the same time. It's entirely up to you.
I would then suggest applying the RSI Effective Reversal Indicator and wait for overbought/sold situations. Once the price goes above or below the Maverick trend line after an oversold or overbought area, you can open a long/short order respectively. The added advantage of RSI Effective Reversal is that it's constructed of candles as opposed to a mere line. As such, it give you heads up when price is about revert, as the candles start turning from bullish to bearish.
Needless to say, no indicator or strategy is perfect, so I strongly suggest papertrading first until you get a grasp of the indicator, and as always - apply sound money management rules. Protect your capital, so that you can live to trade another day.
Questions and suggestions
I'm always open to suggestions as to how I can improve my indicators to serve you better, so if you have any ideas or questions about it, please feel free to drop them in the comment section below. Thank you for your interest and for checking my work. Good luck!
PhinkTrade Risk Manager EssentialsHello there, fellow traders!
So, happy to bring you a new, free tool: my Risk Manager Essentials .
(To use it, click on "Add to favorite indicators" below, and then look for it in your charts’ "Indicators & Strategies" dialog window, inside "Favorites" tab.)
The main objective of this indicator is to help and incentivize as many traders as possible to adopt essential risk management practices .
First and foremost, it helps you define how much you can buy or sell, at your chosen price levels, in order to keep your risk always under control (in other words: in order to limit the amount you can potentially lose with a trade if your stop loss order is hit).
This is fundamental if you want to have a lasting and successful trading career: protect your capital, always . Because without it, you know: it’s game over.
Indicator also helps you visualize where minimum ideal target / take profit level is , given your risk, using the popular 3:1 Return/Risk ratio (R/R) .
3:1 R/R ratio is popular because with it you only need to “be right” (have price reach your targets) about 33% of the time, in order to be profitable : in other words, the fewer successful trades will pay you more than the sum of your unsuccessful ones will take from you.
So, make sure your strategy has a success rate greater than 33% and apply 3:1 R/R to your trades . This indicator will help you that, and with developing the necessary discipline . For example, by knowing where the ideal target should be, given your choices, you can assess the likelihood of it being reached in current price context. If that would look like a hard to happen scenario, it would probably be a good idea to avoid taking that particular trade.
Now, let’s see how it works:
When you deploy the indicator to the chart for the first time, you’ll be asked to define:
Your 1st entry price (interactively: you can define and adjust levels directly on the chart, thanks to the new Interactive Mode introduced by TradingView (ty, TV team!))
Your stop loss price (likewise)
Your 1st target price (likewise)
Your starting capital (via initial Input dialog)
Your risk (likewise)
Your risk is how much of your starting capital you are willing to lose if your stop loss is hit (define it as a % of your starting capital).
There’s a good practice here too: to risk only 1 percent of your capital per trade . This way, you can reinforce the odds of making more money than you lose and keep your peace of mind in all trades – and avoid messing up with your plans – and statistics – along the way.
Successful trading is a statistics-based endeavor. So, you want to implement and maintain consistency. Again, this indicator helps with that.
After initial setup:
You can also define additional entries and targets (up to 3 each) . Just open indicator’s Settings window and adjust accordingly.
If you have more than one entry – or target, the amounts involved will be split evenly between them. You can also enable the display of the Average Entry and Average Target labels , to see the equivalent, should you have taken (or take) a single order for each.
You can also define (via Settings, then interactively) a particular date and time for the trade . This way, labels will be presented near that moment, instead of constantly show near the latest bar.
Finally, you can personalize some other display settings: levels precision (number of decimal places), labels positions , and labels colors .
In conclusion:
You are very welcome to check it out – and adopt it on your daily use!
Please let me know your feedbacks as well. If you find any issues, or have any suggestions, I’ll be glad to hear. You can contact me here, via TradingView, or Telegram.
Finally, check the updates section below , as new stuff may show from time to time.
Thank you very much for your attention, and enjoy!
PhinkTrade

SMOOTHED RSI SWITCHThis more complex take on the traditional RSI provides clearer entry and exit points and looks beyond just overbought/oversold levels, altogether creating a more robust trading strategy.
The RSI is smoothed by the Hull MA with adjustable periods.
Although a variety of strategies can be developed using this indicator. I intended its most profitable use be as follows:
Entries are to be taken when the oscillator flips from red to clear and/or directly from red to green. Sell/short positions are to be take when the oscillator flips from green to clear and/or directly from green to red.

SuperTrend WMA V10.0 [2022]STRATEGY version of SuperTrend WMA V4.5 Indicator:
We added and fixed the PERIOD section, adjust the interval to only work for M3 M30 H4.
M3 used for daily processing
M30 used for weekly processing
H4 used for monthly processing
Each time period can tell a trend and a market journey.
The most important thing is to stay on top of the average probability. We are trying to create a model of mean that differs in the form of two time periods merged into one period.
SuperTrend WMA is the most important indicator for Market Trend analysis.
This is the version you can trade for the following. Trend by M15 is the most profitable trend on Trend following
SuperTrend V1.5 (2021) The settings cannot be modified because we believe that the numbers we set for the market will be exact and accurate. with trading experience and proper use
You can use the 1 minute ( M1 ) interval to check the market gap in the 1 day boundary.
You can use the 15 minute ( M15 ) interval to check the market gap in the 1 week boundary.
You can use the 4 hour ( H4 ) interval to check the market gap in the 1 Month boundary.
All three of these periods can be used together because they are the corresponding periods with the market averages.
We use averages to read market probabilities. It consists of complex time gaps built up to 3 different average levels.
The line WMA Green indicates an uptrend where we believe not to sell during that period. It will put you at risk of losing.
The line WMA Red indicates a possible downtrend. We intend not to make a purchase during that time as it may damage you.
Buy or sell signals are on the words. BUY OR SELL, The use of signals must be based on the trend.
For example, an uptrend would like to buy only, not sell because it is against the average.
We believe that anything can fool us, but the average cannot tell us this is why we intend for everyone to use the indicator SuperTrend WMA V4.5
And we sincerely hope that it'll be useful to everyone. And our team will continue to develop to make the use better.
This indicator develops from indicator SuperTrend WMA Version 4.5

FieryTrading Long-Term Bitcoin Investor ToolDear community,
Today I want to present you one of my favorite scripts for long-term Bitcoin trading. I'm publishing this script because I think it will help traders to become more profitable in the long-term. Consequently, this script is targeted at long-term investors only, since it can take years before the price goes from the green area to the red area.
To use this script correctly you will need to use the BTCUSD index from Tradingview. Search "Bitcoin Index" in your symbol search bar, top result. Use daily candles on a logarithmic scale.
This scripts consists of two price bands, green and red. The green band has historically been a great area for the accumulation of BTC, whilst the red area has historically been a great area for exiting BTC. You could say that if the price is in (or below) the green bands BTC is undervalued, with the opposite being true for the red bands.
If you wish to add alerts to this script, simply click on the alert button > condition=Fierytrading BTC Tool. You can add alerts when the price enters the green area (Buy Area Cross) or red area (Sell Area Cross).
This simple script has historically proven to be very efficient at identifying bottoms (accumulation) and tops (distribution). Be aware that the usability of this script is not guaranteed in the future.

Trending Bollinger Bands by SiddWolfBollinger Bands are mostly used for trend reversal. I believe they should be used for Trend Continuation and Trend Confirmation.
In this Trending Bollinger Bands script you will see two bands drawn on chart. The Upper band is suggestive of Uptrend and Lower Band is suggestive of Downtrend Market. It just provides the guidance of where the market is now and where it is headed. It is not to be used as a standalone indicator. Use this to confirm your hypothesis of Uptrend or Downtrend.
Bollinger Bands Trend
When the price crosses the moving average it is interpreted as the price is gonna continue in that direction. But most of the time it is a fake breakout. With this script you get an additional confirmation so that you know it is not a fake breakout and the price have caught the trend.
Bollinger Bands Reversal:
This indicator can also work for reversal. For example when price closes outside the outer bands, it is most likely that the trend is gonna reverse. Don't just enter the trade wait for some other confirmation as reversal trading is more complicated.
Confluence:
Confluence is the key factor for profitable trading. Don't use this indicator as standalone indicator instead combine it with other indicators and price action. Like the divergence occurring when the price is outside the bands is suggestive of trend reversal. I have created a non-delay, non-repaint indicator for finding divergence. I'd soon publish that script. Stay tuned.
Settings is the Key:
Try to play around with the settings. It is a simple yet effective indicator. Change the moving average type or length. I've found moving average RMA or WMA works better than SMA. Find the best setting that works with your setup. Set the Band Source as High/Low to make the outer bands more extreme.
Conclusion:
This is my first script but it isn't my last. I've created quite a few gems that I'm gonna publish soon. If you have any questions or suggestions feel free to comment below. I'd love to connect with you. Thank you.

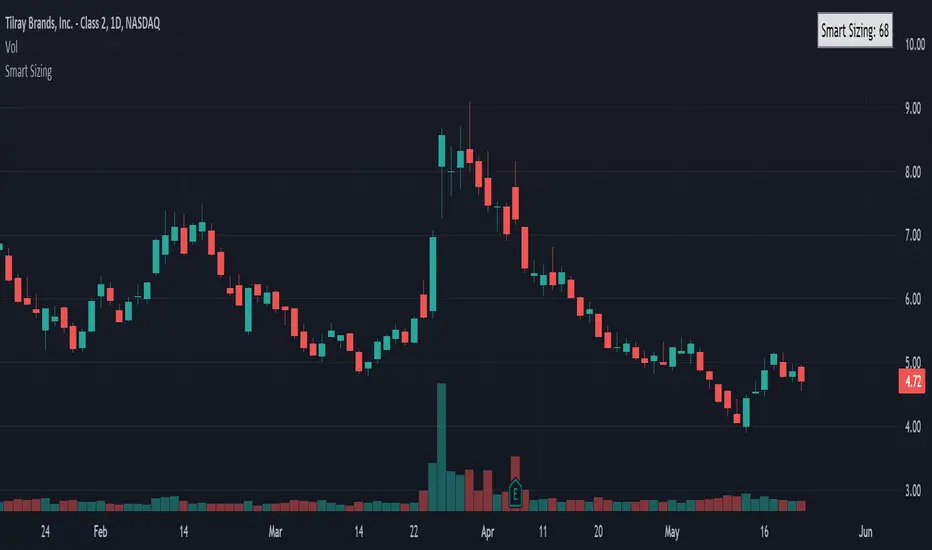
Smart SizingSmart Sizing is a simple indicator designed for stock traders to quickly see how many shares you should ideally trade to have an equal amount of risk on all of your trades. It uses your inputted values along with the ATR to determine the right amount of shares you should trade. Since every stock has a different level of volatility just simply buying 100 shares for every trade for example or an equal $ amount like $10,000 will leave your portfolio with concentrated risk in some stocks. If the more volatile stocks turn out to be losers then the wins from the less volatile stocks may not cover the losses, however if your positions were sized according to the volatility of each stock it may have resulted in being profitable overall instead.
That's what the Smart Sizing indicator does, it tells you directly on the chart in a small table and right next to the indicator a value that is how many shares to trade according to your account value and risk objectives. You simply enter in your account value in the indicator settings (I update mine everyday), what % of your account you want to risk, and what ATR Length and Timeframe you wish to use. For example, if you entered your account value at $10,000 with risk percentage at 1% and if you used the daily ATR which was 0.50 then it would show as 200 shares (10,000 x 0.01) / 0.50 = 200 and by trading 200 shares that means if the stock went against you by 1 daily ATR it would equal 1% of your account. So if you used a ATR trailing stop or a fixed stop based on the ATR this indicator can help you determine what your correct position size should be so you can practice good risk management.
Take the example below of two stocks with an almost identical price, Citigroup $C with a last traded price of $50.03 and Exelon $EXC with a last traded price of $50.02, you can see the Smart Sizing indicator is showing to trade 59 shares on Citigroup and 130 shares on Exelon, even though both stocks have almost the same stock price the different recommended position size is because Citigroup is much more volatile than Exelon which is a electric utility.
Please note this indicator is designed for stocks but could also be used for forex but shouldn't be used for futures. It can be used on any timeframe with stocks worldwide.
Jared.
Disclaimer: All my scripts and content are for educational purposes only. I'm not a financial advisor and do not give personal finance advice. Past performance is no guarantee of future performance. Please trade at your own risk.
Super OrderBlock / FVG / BoS Tools by makuchaku & eFeThis super indicator is a Swiss army knife for Smart Money traders for OrderBlocks / FVG / BoS
It provides many options for drawing (non-repainting) boxes for OrderBlocks, Fair Value Gaps (FVG) and Break of Structures. The boxes are extended into the future, until the first retest/mitigation.
Some of the additional options (not explained in the diagrams above)
PPDD OB : An order block which is formed after interacting with Liquidity (old low/high, fractal low/high, etc). Since these OB's are in the most premium or most discount, they are Premium Premium Discount Discount OB's (PPDD OB)
HVB Bars : When the volume of any bar is higher than the average volume of last N bars, it could mean something important (in the right context). Hence, the indicator allows for coloring them differently.
This indicator was built as a collaboration between @makuchaku & eFe
Pro tip : This indicator is a simply a tool to visualize trading concepts on the candle stick chart. It is the job of the trader to sequence these effectively into a profitable trade.
If you come across any bug or have a question on how to effectively use the indicator, please don't hesitate to ask questions.
Good luck & good trading!

Bitcoin BanditIntroducing "Bitcoin Bandit".
The market beating trading algorithm for Bitcoin .
"Bitcoin Bandit" buys and sells based on three proprietary indicators:
• Futures contract data
• Accumulation areas and various moving averages.
• Bitcoin hash rate
The indicator is unique because it doesn't give significant weight to historical price to predict future price action; instead it uses BTC hash rate momentum and futures contract data from BTCUSDPERP (transformed through various internal processes) as proxies for sentiment to look for buy and sell zones, then uses accumulation of moving averages as supporting data for signal delivery.
The strategy was built on two years of Binance data and and backtested on five years of Bitcoin data (Coinbase: BTCUSD ).
Finally, the strategy was validated over multiple investment time frames (5 years, 2 years, 1 year) without prior parameter adjustment.
Strategy backtesting checks include:
• 0.60% trading commission fees (the highest possible).
• No Heiken-Ashi candles (to preserve accuracy)
• No Stop-Losses
• Market orders only
The results speak for themselves.
See the positive excess return from the “Bitcoin Bandit” strategy returns versus a simple Bitcoin “Buy-and-Hold” strategy. "Bitcoin Bandit" is designed to function only on the Daily time frame of the BTCUSD trading pair.
Does it Repaint?
• Our indicator does NOT repaint. Although while setting an alert it may pop up the repaint alert, please take into consideration that once a signal is fired on a "CLOSED BAR", the signals will never disappear, they do not repaint.
What Markets is it usable with?
• BTCUSD on the Daily timeframe .
• Bitcoin Bandit can be applied to any chart or altcoin, but results will be unpredictable as this indicator is designed specifically for Bitcoin trading.
How to use:
• Simply plug and play it to your chart. You can also connect TV alerts with a bot and let it run. Please be aware that SLIPPAGE time is important, If you run a bot on this indicator you HAVE to know that the buy/sell price will be on the bar AFTER the Candle close (For example: the BUY/SELL alert is on a candle, the buy/sell your bot or you will execute WILL be in the following candle depending on your trading system. Bitcoin Bandit only works on the Daily timeframe on the BTCUSD trading pair. Please contact us if you do not understand how to use it.
Disclaimer: Nothing stated is financial advice, and is purely for education purposes. We do not promise all trades are profitable, the use of this indicator is up to your own judgement and liability.

KINSKI Multi Trend OscillatorThe Multi Trend Oscillator is a tool that combines the ratings of several indicators to facilitate the search for profitable trades. I was inspired by the excellent indicator "Technical Ratings" from Team TradingView to create an alternative with a technically new approach. Therefore, it is not a modified copy of the original, but newly conceived and implemented.
The recommendations of the indicator are based on the calculated ratings from the different indicators included in it. The special thing here is that all settings for the individual indicators can be changed according to your own needs and displayed as a histogram and MA line. This provides an excellent visual control of your own settings. Alarms are also triggered.
Criteria for determining the rating
Relative Strength Index (RSI)
Buy - Crossover oversold level and indicator < oversold level and rising
Sell - Crossunder oversold level and indicator >= oversold level and falling
Neutral - neither Buy nor Sell
Relative Strength Index (RSI) Laguerre
Buy - Crossover Oversold Level and Indicator < Oversold Level and rising
Sell - Crossunder oversold level and indicator >= oversold level and falling
Neutral - neither Buy nor Sell
Noise free Relative Strength Index (RSX)
Buy - Crossover Oversold Level and Indicator < Oversold Level and rising
Sell - Crossunder oversold level and indicator >= oversold level and falling
Neutral - neither Buy nor Sell
Money Flow Index (MFI)
Buy - Crossover Oversold Level and Indicator < Oversold Level and rising
Sell - Crossunder oversold level and indicator >= oversold level and falling
Neutral - neither Buy nor Sell
Commodity Channel Index (CCI)
Buy - Crossover Oversold Level and Indicator < Oversold Level and rising
Sell - Crossunder oversold level and indicator >= oversold level and falling
Neutral - neither Buy nor Sell
Moving Average Convergence/Divergence (MACD)
Buy - values of the main line > values of the signal line and rising
Sell - values of the main line < values of the signal line and falling
Neutral - neither Buy nor Sell
Klinger
Buy - indicator >= 0 and rising
Sell - indicator < 0 and falling
Neutral - neither Buy nor Sell
Average Directional Index (ADX)
Buy - indicator > 20 and +DI line crosses over the -DI line and rising
Sell - indicator > 20 and +DI line crosses below the -DI line and falling
Neutral - neither Buy nor Sell
Awesome Oscillator
Buy - Crossover 0 and values are greater than 0, or exceed the zero line
Sell - Crossunder 0 and values are lower than 0, or fall below the zero line
Neutral - neither Buy nor Sell
Ultimate Oscillator
Buy - Crossover oversold level and indicator < oversold level and rising
Sell - Crossunder oversold level and indicator >= oversold level and falling
Neutral - neither Buy nor Sell
Williams Percent Range
Buy - Crossover Oversold Level and Indicator < Oversold Level and rising
Sell - Crossunder Oversold Level and Indicator >= Oversold Level and falling
Neutral - neither Buy nor Sell
Momentum
Buy - Crossover 0 and indicator levels rising
Sell - Crossunder 0 and indicator values falling
Neutral - neither Buy nor Sell
Total Ratings
The numerical value of the rating "Sell" is 0, "Neutral" is 0 and "Buy" is 1. The total rating is calculated as the average of the ratings of the individual indicators and are determined according to the following criteria:
MaxCount = 12 (depending on whether other oscillators are added).
CompareSellStrong = MaxCount * 0.3
CompareMid = MaxCount * 0.5
CompareBuyStrong = MaxCount * 0.7
value <= CompareSellStrong - Strong Sell
value < CompareMid and value > CompareSellStrong - Sell
value == 6 - Neutral
value > CompareMid and value < CompareBuyStrong - Buy
value >= CompareBuyStrong - Strong Buy
Understanding the results
The Multi Trend Oscillator is designed so that its values fluctuate between 0 and currently 12 (maximum number of integrated indicators). Its values are displayed as a histogram with green, red and gray bars. The bars are gray when the value of the indicator is at half of the number of indicators used, currently 12. Increasingly saturated green bars indicate increasing values above 6, and increasingly saturated red bars indicate increasingly decreasing values below 6.
The table at the end of the histogram shows details (can be activated in the settings) about the overall rating and the individual indicators. Its color is determined by the rating value: gray for neutral, green for buy or strong buy, red for sell or strong sell.
The following alarms are triggered:
Multi Trend Oscillator: Sell
Multi Trend Oscillator: Strong Sell
Multi Trend Oscillator: Buy
Multi Trend Oscillator: Strong Buy

AlphaTrendAlphaTrend is a brand new indicator which I've personally derived from Trend Magic and still developing:
In Magic Trend we had some problems, Alpha Trend tries to solve those problems such as:
1-To minimize stop losses and overcome sideways market conditions.
2-To have more accurate BUY/SELL signals during trending market conditions.
3- To have significant support and resistance levels.
4- To bring together indicators from different categories that are compatible with each other and make a meaningful combination regarding momentum, trend, volatility, volume and trailing stop loss.
according to those purposes Alpha Trend:
1- Acts like a dead indicator like its ancestor Magic Trendin sideways market conditions and doesn't give many false signals.
2- With another line with 2 bars offsetted off the original one Alpha Trend have BUY and SELL signals from their crossovers.
BUY / LONG when Alpha Trend line crosses above its 2 bars offsetted line and there would be a green filling between them
SELL / SHORT when Alpha Trend line crosses below its 2 bars offsetted line and filling would be red then.
3- Alpha Trend lines
-act as support levels when an uptrend occurs trailing 1*ATR (default coefficient) distance from bar's low values
-conversely act as resistancelevels when a downtrend occurs trailing 1*ATR (default coefficient) distance from bar's high values
and acting as trailing stop losses
the more Alpha Trend lines straighter the more supports and resistances become stronger.
4- Trend Magic has CCI in calculation
Alpha Trend has MFI as momentum, but when there's no volume data MFI has 0 values, so there's abutton to change calculation considering RSI after checking the relevant box to overcome this problem when there is no volume data in that chart.
Momentum: RSI and MFI
Trend: Magic Trend
Volatility: ATR,
Trailing STOP: ATR TRAILING STOP
Volume: MFI
Alpha trend is really a combination of different types...
default values:
coefficient: 1 which is the factor of trailing ATR value
common period: 14 which is the length of ATR MFI and RSI
Wish you all use AlphaTrend in profitable trades.
Kıvanç Özbilgiç

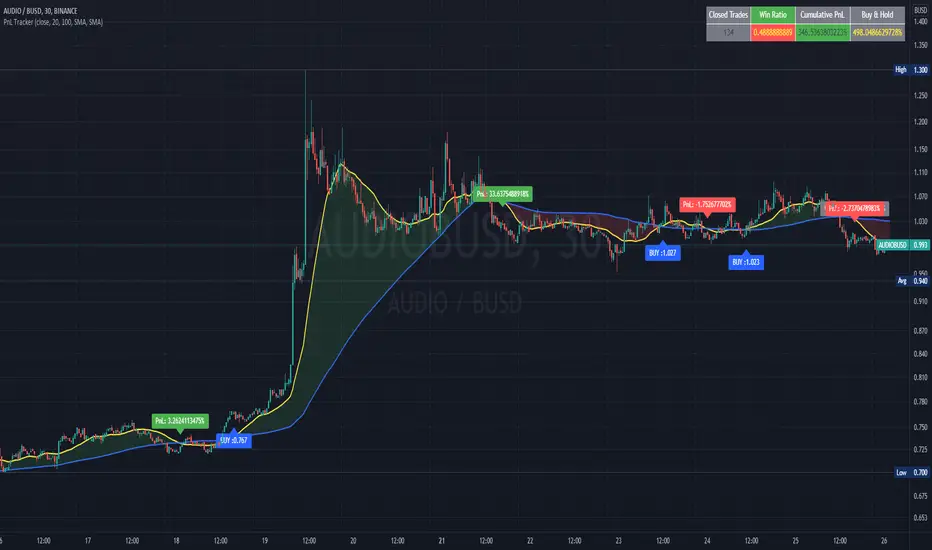
PnL and Buy & Hold TrackerIn this script I use a simple, not necessarily profitable, strategy of a cross of MAs to teach how to calculate and plot the PnL of each trade made by the indicator. I also show how to calculate the cumulative PnL of all trades and the Buy and Hold of the same period.
These calculations which are natively available in any strategy script, require a bit of resourcefulness to work in an indicator script.
It can be very useful to optimize parameters for the best performance of an indicator-based strategy.
I use variables to store the price of the asset at each buy signal to calculate the PnL with the closing price of that particular trade and another variable to store the price value of the first trade, which calculates the Buy and Hold percentage with the current price of the asset.
I plot the values of the trades in labels and the accumulated values in a table.
I also show how to calculate and plot the unrealized PnL of open trades.
Bitcoin Power Law Bands (BTC Power Law) Indicator█ OVERVIEW
The 'Bitcoin Power Law Bands' indicator is a set of three US dollar price trendlines and two price bands for bitcoin , indicating overall long-term trend, support and resistance levels as well as oversold and overbought conditions. The magnitude and growth of the middle (Center) line is determined by double logarithmic (log-log) regression on the entire USD price history of bitcoin . The upper (Resistance) and lower (Support) lines follow the same trajectory but multiplied by respective (fixed) factors. These two lines indicate levels where the price of bitcoin is expected to meet strong long-term resistance or receive strong long-term support. The two bands between the three lines are price levels where bitcoin may be considered overbought or oversold.
All parameters and visuals may be customized by the user as needed.
█ CONCEPTS
Long-term models
Long-term price models have many challenges, the most significant of which is getting the growth curve right overall. No one can predict how a certain market, asset class, or financial instrument will unfold over several decades. In the case of bitcoin , price history is very limited and extremely volatile, and this further complicates the situation. Fortunately for us, a few smart people already had some bright ideas that seem to have stood the test of time.
Power law
The so-called power law is the only long-term bitcoin price model that has a chance of survival for the years ahead. The idea behind the power law is very simple: over time, the rapid (exponential) initial growth cannot possibly be sustained (see The seduction of the exponential curve for a fun take on this). Year-on-year returns, therefore, must decrease over time, which leads us to the concept of diminishing returns and the power law. In this context, the power law translates to linear growth on a chart with both its axes scaled logarithmically. This is called the log-log chart (as opposed to the semilog chart you see above, on which only one of the axes - price - is logarithmic).
Log-log regression
When both price and time are scaled logarithmically, the power law leads to a linear relationship between them. This in turn allows us to apply linear regression techniques, which will find the best-fitting straight line to the data points in question. The result of performing this log-log regression (i.e. linear regression on a log-log scaled dataset) is two parameters: slope (m) and intercept (b). These parameters fully describe the relationship between price and time as follows: log(P) = m * log(T) + b, where P is price and T is time. Price is measured in US dollars , and Time is counted as the number of days elapsed since bitcoin 's genesis block.
DPC model
The final piece of our puzzle is the Dynamic Power Cycle (DPC) price model of bitcoin . DPC is a long-term cyclic model that uses the power law as its foundation, to which a periodic component stemming from the block subsidy halving cycle is applied dynamically. The regression parameters of this model are re-calculated daily to ensure longevity. For the 'Bitcoin Power Law Bands' indicator, the slope and intercept parameters were calculated on publication date (March 6, 2022). The slope of the Resistance Line is the same as that of the Center Line; its intercept was determined by fitting the line onto the Nov 2021 cycle peak. The slope of the Support Line is the same as that of the Center Line; its intercept was determined by fitting the line onto the Dec 2018 trough of the previous cycle. Please see the Limitations section below on the implications of a static model.
█ FEATURES
Inputs
• Parameters
• Center Intercept (b) and Slope (m): These log-log regression parameters control the behavior of the grey line in the middle
• Resistance Intercept (b) and Slope (m): These log-log regression parameters control the behavior of the red line at the top
• Support Intercept (b) and Slope (m): These log-log regression parameters control the behavior of the green line at the bottom
• Controls
• Plot Line Fill: N/A
• Plot Opportunity Label: Controls the display of current price level relative to the Center, Resistance and Support Lines
Style
• Visuals
• Center: Control, color, opacity, thickness, price line control and line style of the Center Line
• Resistance: Control, color, opacity, thickness, price line control and line style of the Resistance Line
• Support: Control, color, opacity, thickness, price line control and line style of the Support Line
• Plots Background: Control, color and opacity of the Upper Band
• Plots Background: Control, color and opacity of the Lower Band
• Labels: N/A
• Output
• Labels on price scale: Controls the display of current Center, Resistance and Support Line values on the price scale
• Values in status line: Controls the display of current Center, Resistance and Support Line values in the indicator's status line
█ HOW TO USE
The indicator includes three price lines:
• The grey Center Line in the middle shows the overall long-term bitcoin USD price trend
• The red Resistance Line at the top is an indication of where the bitcoin USD price is expected to meet strong long-term resistance
• The green Support Line at the bottom is an indication of where the bitcoin USD price is expected to receive strong long-term support
These lines envelope two price bands:
• The red Upper Band between the Center and Resistance Lines is an area where bitcoin is considered overbought (i.e. too expensive)
• The green Lower Band between the Support and Center Lines is an area where bitcoin is considered oversold (i.e. too cheap)
The power law model assumes that the price of bitcoin will fluctuate around the Center Line, by meeting resistance at the Resistance Line and finding support at the Support Line. When the current price is well below the Center Line (i.e. well into the green Lower Band), bitcoin is considered too cheap (oversold). When the current price is well above the Center Line (i.e. well into the red Upper Band), bitcoin is considered too expensive (overbought). This idea alone is not sufficient for profitable trading, but, when combined with other factors, it could guide the user's decision-making process in the right direction.
█ LIMITATIONS
The indicator is based on a static model, and for this reason it will gradually lose its usefulness. The Center Line is the most durable of the three lines since the long-term growth trend of bitcoin seems to deviate little from the power law. However, how far price extends above and below this line will change with every halving cycle (as can be seen for past cycles). Periodic updates will be needed to keep the indicator relevant. The user is invited to adjust the slope and intercept parameters manually between two updates of the indicator.
█ RAMBLINGS
The 'Bitcoin Power Law Bands' indicator is a useful tool for users wishing to place bitcoin in a macro context. As described above, the price level relative to the three lines is a rough indication of whether bitcoin is over- or undervalued. Users wishing to gain more insight into bitcoin price trends may follow the author's periodic updates of the DPC model (contact information below).
█ NOTES
The author regularly posts on Twitter using the @DeFi_initiate handle.
█ THANKS
Many thanks to the following individuals, who - one way or another - made the 'Bitcoin Power Law Bands' indicator possible:
• TradingView user 'capriole_charles', whose open-source 'Bitcoin Power Law Corridor' script was the basis for this indicator
• Harold Christopher Burger, whose Bitcoin’s natural long-term power-law corridor of growth article (2019) was the basis for the 'Bitcoin Power Law Corridor' script
• Bitcoin Forum user "Trololo", who posted the original power law model at Logarithmic (non-linear) regression - Bitcoin estimated value (2014)

Honey CypherHoney Cypher Aims to do 4 things
Momentum
Trend Strength
Overbought and oversold zones
Being the most beautiful indicator you ever see
Momentum
The big yellow honey waves primary use is to see the momentum of the market, they can be used in a similar way you would use a MACD or Chaikin Money Flow
On this image you see the honey waves being plotted to the 30 minute timeframe while on the 5 minute chart to have an understanding of longer time momentum in the chart.
Trend Strength
Most tools of the indicator can be used for that but the yellow and purple slope strength lines are made specificaly for this. When you see them curl down you know trend is strengthening towards the downside.
The candle color is based on the amount of Honey waves sloping in one direction. This might be the best tool in the indicator to find Trend Strength. Bright yellow candles mean strong bears while the bright blue candles mean strong bulls.
Overbought and oversold zones
By analysing the waves on a chart you start to learn how big waves can get before a reversal or consolidation period arrives.
You can become profitable with the indicator. But to be honest, my primary focus in making this indicator was find ways to visualise alot of data in a clear and beautiful way.
You should use the indicator with some out of the box ideas instead of just trusting the signals.
examples:
Find a head and shoulders pattern on the top of a huge honey wave.
Find a bottom small wave while the others honey waves are in the opposite direction for entering a pullback.
Use the honey for direction but the yellow and purple slope line crosses for entrys.
Comment your own strategys, I made this open source to be able to get community feedback.
The Honey Cypher waves are calculated in a similar way as the MACD histogram. I've combined MACD formula with some of the lazybear formula. It looks for the distance between 2 moving averages to find trend strength. After that the end results get's smoothed out. It is very satisfying to change that as you can see the honey waves create a melting like motion on each change of smoothing.
Below a preview of the honey cypher moving average lines, all lines have a length that is based on the fibonacci number sequence. Honey cypher measures the distance between for example length 5-8 averages.
I hope this inspires coders to create very beautiful scripts.

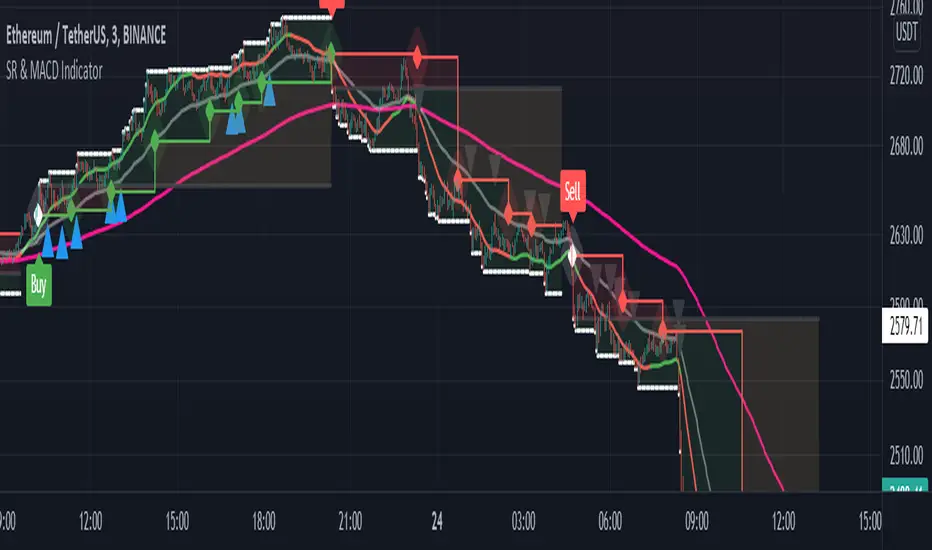
Support and Resistance with MACD IndicatorOriginal script from ©akpaswaniitk. I just added MACD to filter out bad trades and alert function so that we get notified whenever indicator gives us an entry signal. Most of the false breakout has been removed but the remaining ones only pop up during consolidation, so it's wait for the retest before entry. Works better in continuous market. Also look at the color of EMA for further confirmation, only focus on buy side when EMA is green and sell when EMA is red or when after the buy signal EMA changes color from red to green. These are the highly profitable setups I've found with this indicator.
Signals
Red or Green solid line with diamond are trailing stoploses
dotted black line is entry level
dotted white line is optimal exit
TrendsThe Trends indicator is created for trend trading and (Bitsgap) crypto bots of crypto assets over longer time periods.
Works best for 4h, Daily and Weekly candles (even Monthly), but unsuitable for hourly candles and day trading.
This indicator shows you if a crypto pair is in a Bear, Bull or Sideways market.
The idea is to simplify decision making when to sell or buy, or what pairs to use with trading bots.
Stick to the rule of not having bots in a Bear trend!
- Blue = Bull trend
- Red = Bear trend
- Green = Sideways trend - which can be profitable with trading bots

Price Clouds Oscillator (PCO)This is the oscillator version of Price Clouds (PS). Use this with (PS) for best results.
This indicator shows you over bought and over sold regions similarly to to rsi or stochastic. This indicator centers a moving average around the hl2 of the price. This is calculated as the difference of four moving averages. The signal line shows you how much momentum in any given direction you have. You can also see how much volatility there is by the band width. Just like the Bollinger band high volatility comes before low volatility and visa versa. You can also see what the market is doing based on the signal crosses. If the fast line is above the slow line you are going up and visa versa. This indicator works in most markets, especially crypto. There is a tool tip for every aspect of this indicator explaining how everything works.
Key Feature:
>See where the price is relative to a mean price
>Measure volatility
>Clean global settings
>Normalization feature lets you scale the band from 0 to 1. You loose some information but its easier to use if you aren't measuring volatility.
I hope you are very profitable with this one!
If you find this indicator is useful to you, Star it, Follow, Donate, Like and Share.
Your support is a highly motivation for me.
PCO
----------------------/\-----
-------------/\----/----\---
\----------/----\/--------\-
--\------/------------------
----\_/---------------------

Linear Regression Relative Strength[image/x/iZvwDWEY/
Relative Strength indicator comparing the current symbol to SPY (or any other benchmark). It may help to pick the right assets to complement the portfolio build around core ETFs such as SPY.
The general idea is to show if the current symbol outperforms or underperforms the benchmark (SPY by default) when bought some certain time ago. Relative performance is displayed as percent and is calculated for three different time ranges - short (1 mo by default), mid (1 quarter), and long (half a year). To smooth the volatility, the script uses linear regression to estimate the trend and takes the start and the end points of the linear regression line to compute the relative strength.
It is important to remember that the script shows the gain relative to SPY (or other selected benchmark), not the asset's gain. Therefore, it may indicate that the asset is profitable, but it still may lose value if SPY is in downtrend.
Therefore, it is crucial to check other indicators before making a decision. In the example above, standard linear regression for one quarter is used to indicate the direction of the trend.

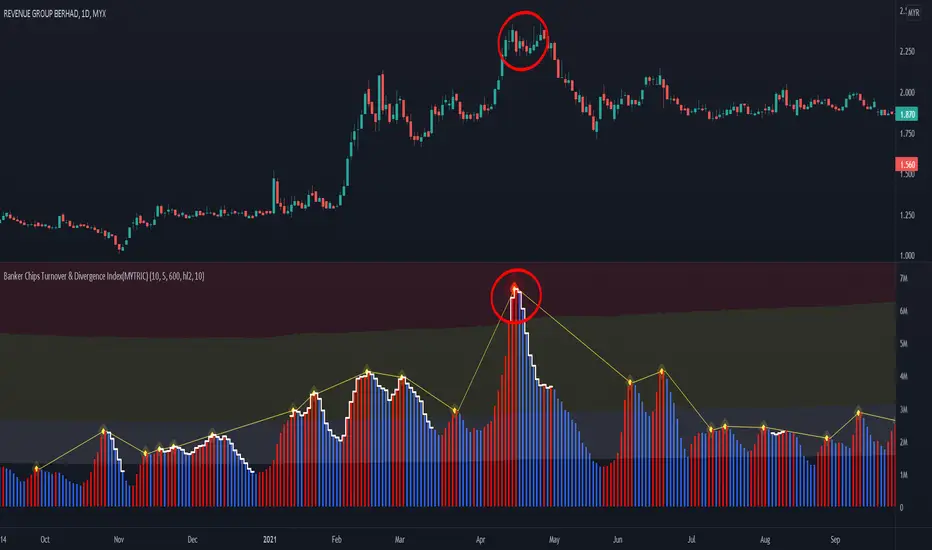
Banker Chips Turnover & Divergence Index(MYTRIC)█ OVERVIEW
Development of this toolkit is to understanding information provided by the market in depth before trading.
The main reason for losing money or not being profitable is that you do not understand the information given by the market.
If you master the information given by the market, the number of losses will be greatly reduce.
We composed a lot of algorithms module and innovative indicators,
to provide endless possibilities and meet all trading styles.
Our toolkit works in global trading market and any indices, through algorithms we extract 9️⃣ major information in the market.
Which 9️⃣ major market information are include :
• Overall Trend
• Trend Phase
• Demand & Supply
• Price Risk
• Game Theory
• Banker Chips
• Chart Pattern Meaning
• Business Model (Stocks)
• Companies Financial Health (Stocks)
This indicator provides 1️⃣ market information among the 9️⃣ major information.
The 1 market information as below :
✅ - Banker Chips (banker collect / banker disposed)
【Banker Chips Turnover & Market Divergence Index(MYTRIC)】
❌ - Game Theory
【Bull Bear Momentum Indicator】
❌ - Demand & Supply
【Dt Smart Trend (MYTRIC)】 & 【Bull Bear Momentum Indicator】
❌ - Price Risk
【Dt Smart Trend (MYTRIC)】 & 【Bull Bear Momentum Indicator】
❌ - Overall Trend
【Dt Smart Trend (MYTRIC)】
❌ - Trend Phase
【Dt Smart Trend (MYTRIC)】
❌ - Chart Pattern Meaning
【coming soon】
❌ - Business Model
【we didn't provide】
❌ - Companies Financial Health
【Financial Intelligent Evaluation】
██████████████████████████████████████████████████████████████████████████████████████████████████████████████████████
——————————————————————————————————————————————————————————————————————————————————————————————————————————————————
█ What market information does this indicator tell you ?
The Banker Chips Turnover & Divergence Index(MYTRIC) indicator is telling you 'Banker chips' or 'Market maker' activities.
• Track abnormal trade in the market.
The Banker Chips Turnover & Divergence Index(MYTRIC) indicator used to measure the divergence index of current trend and prices, a way to measure the potential accumulation or distribution of chips by banker or main force.
This indicator are calculation according to the relationship between volume and price, this is one of the methods to quantify "volume & price analysis". Volume & price analysis can provide insight the behavior of banker.
When the index appears at the high of the price, it mean banker may be distributing/disposing, the price is very soon to retracement(if retailer have a big support) or downtrend.
When the index appears at the low of the price, it mean banker may be accumulating/acquiring, if it break-out, the upward trend will be considerable.
The Banker Chips Turnover & Divergence Index(MYTRIC) indicator is used to track 'Banker' collecting & distribution activity.
Let you know the 'Banker' intention in advance to prevent 'Rug-pull or stock scammer' 'Chinese call '割韭菜 or 杀猪盘''.
We also can use this indicator to spot is the current market is a scam or Chinese call '杀猪盘', to avoid losing your huge capital in a moment.
• Usually the histogram bar excessive to 'Extremely High Turnover Area', we will judge it as a scam and '杀猪盘'
██████████████████████████████████████████████████████████████████████████████████████████████████████████████████████
——————————————————————————————————————————————————————————————————————————————————————————————————————————————————
█ CASE STUDY
before case study must know the every color intention.
• Histogram Bar = Market divergence index or Banker Chips Turnover Index
• White Step Line Above Bar = High probability of Banker Chips activity
• Red line is only mark up the peak of index above high turnover
• Must be attention when the higher histogram bar in higher level price, the price may fall or plunge after breaking support.
• Must be attention when the higher histogram bar in lower level price, the price may rise or skyrocket after breaking resistant.
Color Description :
Case Study 01 :
Scam Stock 1 HKEX:1343
——————————————————————————————————————————————————————————————————————————————————————————————————————————————————
Scam Stock 2 HKEX:3893
——————————————————————————————————————————————————————————————————————————————————————————————————————————————————
Scam Stock 3 MYX:VINVEST
Vinvest 1 , before pump activity
Vinvest 2 , after dump activity
——————————————————————————————————————————————————————————————————————————————————————————————————————————————————
Case Study 4 BINANCE:BTCUSDT
English News.
www.bloomberg.com
Chinese News.
www.chinapress.com.my
——————————————————————————————————————————————————————————————————————————————————————————————————————————————————
Case Study 5 MYX:SCIB