Refracted EMA for trendThis script is an evolution of "Refracted EMA" by fract, that you can find here:
The differences are in the design and intended uses of its early and pretty reliable signals.
This is a trend indicator, with signals and alerts, usable on any timeframe.
Note: 3 color themes are included: Light, dark, and my personal dark one. Feel free to change them in the code, and to remove the ones you don't need.
HOW TO USE IT?
When it gives a signal (arrow), a horizontal line starts, and expands until there's a signal in the opposite direction.
As long as the price moves away from this line, then the move should logically be profitable
If the price ranges, or turns back in direction of the line, then it might be time to reconsider.
The background colors offer a complement of information:
- When the price moves away from the line, the bgcolor is normal.
- When there has been 2 candles in the opposite direction, then the bgcolor turns a little darker. It might be an early sign of range or reversal.
- When the current price breaks through the signal's closing price, the bgcolor turns gray or black (depending on the theme and colors you chose), signaling a significative divergence with the signal, and a possible reversal. It is common though, for the first candle after the signal to go in the opposite direction. It might be a good idea to wait at least 2 candles after the signal.
You can switch the alerts on, by right clicking the chart and clicking "add alert". Alerts happen only after the close of the candle. They display the timeframe they were added on.
TRICKS
- If up and down arrows alternate quickly, then the market is undecided, and it might not be a good idea to trade. Or maybe on other timeframes.
- Trading against the indicator's direction is probably not a good idea, unless there is a very VERY good reason for this (like buying the dip of an up trend, for ex).
- Looking at different timeframes quickly reveals the bigger picture of the price movements. For ex, if the 4h, 1h, 30 min are bullish, but the 5 min bearish, then there might be a long opportunity. But if the 5 min is bearish, and the 10 min turns bearish, and the 30 min turns bearish too, then there might be a reversal on its way.
- The line can be used as a reference to decide where to place your stop loss. It is rare that the price crosses this line, but it can absolutely happen. So use this idea with caution, manage and protect your positions wisely.
- You can, and probably should, use the alerts on different timeframes at the same time, to constantly update your understanding of the trend.
DO NOT BASE YOUR TRADING DECISIONS ON 1 SINGLE INDICATOR'S SIGNALS.
Always confirm your ideas by other means, like price action and indicators of a different nature.
"profitable" için komut dosyalarını ara

Double Supertrend Entry with ADX Filter and ATR Exits/EntriesThe Double Supertrend Entry with ADX Filter and ATR Exits/Entries indicator is a custom trading strategy designed to help traders identify potential buy and sell signals in trending markets. This indicator combines the strengths of multiple technical analysis tools, enhancing the effectiveness of the overall strategy.
Key features:
Two Supertrend Indicators - The indicator includes two Supertrend indicators with customizable parameters. These trend-following indicators calculate upper and lower trendlines based on the ATR and price. Buy signals are generated when the price crosses above both trendlines, and sell signals are generated when the price crosses below both trendlines.
ADX Filter - The Average Directional Index (ADX) is used to filter out weak trends and only generate buy/sell signals when the market exhibits a strong trend. The ADX measures the strength of the trend, and a customizable threshold level ensures that trades are only entered during strong trends.
ATR-based Exits and Entries - The indicator uses the Average True Range (ATR) to set profit target and stop-loss levels. ATR is a measure of market volatility, and these levels help traders determine when to exit a trade to secure profit or minimize loss.
Performance Statistics Table - A table is displayed on the chart, recording and showing the total number of winning trades, losing trades, percentage of profitable trades, average profit, and average loss. This information helps traders evaluate the performance of the strategy over time.
The Double Supertrend Entry with ADX Filter and ATR Exits/Entries indicator is a powerful trend-following strategy that can assist traders in making more informed decisions in the financial markets. By combining multiple technical analysis tools and providing performance statistics, this indicator helps traders improve their trading strategy and evaluate its success.

Pivot Breaches by nnamdertWhat does this Indicator do?
This Pivot Point Line Breach Indicator is a simple yet powerful tool that automatically plots lines at the high and low pivot point levels and extends the lines forward to the most recent real-time bar. When the price breaches a line, the line stops at that breach point. The unbreached lines, however, continue on until they are eventually breached or the indictor reaches the maximum number of lines set by the user.
How is this Indicator helpful?
The pivot point lines plotted on the chart show areas where the price may eventually revert to. By knowing whether or not these lines have been breached, traders can easily identify potential entry points or support lines that are likely to be breached, especially when used with other indicators.
As shown in the screenshot below, some lines have been breached, while several others remain. Once the lines were breached, we could clearly see that the price moved quickly to the next level.
The indicator user inputs enable the plotting of up to 500 lines on the chart, if the user chooses to set the limit to 500. However, the default setting is currently set to a lower number, allowing traders to easily view the most recent unbreached pivot points.
The plotted lines are located at the close and high or low of the bar that generated the line. When there is a long wick, the two lines are plotted far from each other. A breach of both lines, particularly in the case of a long wick, indicates strong movement in the direction of the breach.
Thank you for using my indicator, and I hope it helps you make profitable trading decisions.

Spaghetti by RainbowLabsWhen I started trading, very few people gave me a hand or even a small piece of advice. One of them was @btc_charlie. From Charlie, I first saw the spaghetti chart, and he explained to me how it was useful in identifying which coin made the most sense to trade at a specific time.
In practice, it worked like this: in the "add" section, you add all the pairs you want and overlap them on the chart, creating the spaghetti chart. Although it worked, and still works, this way, I wondered if it would be better to write an indicator that does the same thing, maybe less invasive on the chart, that you can call as many times as you want and in different versions. In short, I tried to recreate the same thing but potentially better, let's see if I succeeded.
Introducing Spaghetti chart by RainbowLabs:
This indicator takes 20 different pairs as user input and works with any pair on any exchange provided the name is spelled correctly. In the settings, there are four columns: the first for the exchange, the second for the ticker, the third for the base pair, and lastly, the color. Again, it works with any pair on any exchange, but if you put something that does not exist or is misspelled, it will cause the script to error.
The second thing to do is to set when our spaghetti will be reset. By default, it resets every hour, but you can change it to any preferred timeframe in the menu, keeping in mind that we will write the timeframe in minutes, not alphanumeric. For example, 4h will not be four hours, but you will have to write 240.
In the settings, we can also change the position and size of the table.
How it works:
All pairs are reset when the timeframe defined by the user in the settings changes. The script then calculates the percentage difference from that moment onwards for each pair at the closing of the candle of the timeframe we are in. For example: by default, the timeframe resets every hour, so we will use it on one minute. It does not make sense on larger timeframes, and you will have to increase the reset timeframe.
How to use it:
Risk on\off BTC vs alts
As Charlie says in his tweet: "should I be risk on or off?" for SIX:ALTS rule might be ">70% of Alts recovering after a dip."
Identify a dip on bitcoin and compare what happens immediately after. If more than 70% of alts gain more than BTC, it may be better to remain positioned in alts. When the opposite happens, it is better to stay on BTC or stable.
Sell-off, Rally
During a significant sell-off or rally, it is important to analyze which coins were performing better or worse in the immediate past. It is statistically more profitable to trade those pairs that were over-performing, positively or negatively, just before the event.
Arbitrage and Triangular Arbitrage.
While it may be difficult to find large arbitrage opportunities in current market conditions, we can use tools to identify the best price of the same pair on multiple exchanges and compare it with one or multiple pairs on other exchanges. Having a comprehensive view of the market can be useful for anyone who is not using advanced trading bots to find arbitrage opportunities.
Quick Screener
You can add multiple spaghetti indicators to a single chart, and with the paid version of TradingView, you can use multiple layouts to plot as many coins on as many exchanges as you want. In the picture, you can see 240 pairs on four different exchanges all together. This feature allows you to quickly screen for potential trading opportunities and identify trends across multiple pairs and exchanges.
Known issues:
When the currency exchange rate is equal to 0.0000, the plotted line may not be visible.

On-Chart QQE of RSI on Variety MA [Loxx]On-Chart QQE of RSI on Variety MA (Quantitative Qualitative Estimation) is usually calculated using RSI. This version is uses an RSI of a Moving Average instead. The results are completely different than the original QQE. Also, this version is drawn directly on chart. There are four types of signals.
What is QQE?
Quantitative Qualitative Estimation (QQE) is a technical analysis indicator used to identify trends and trading opportunities in financial markets. It is based on a combination of two popular technical analysis indicators - the Relative Strength Index (RSI) and Moving Averages (MA).
The QQE indicator uses a smoothed RSI to determine the trend direction, and a moving average of the smoothed RSI to identify potential trend changes. The indicator then plots a series of bands above and below the moving average to indicate overbought and oversold conditions in the market.
The QQE indicator is designed to provide traders with a reliable signal that confirms the strength of a trend or indicates a possible trend reversal. It is particularly useful for traders who are looking to trade in markets that are trending strongly, but also want to identify when a trend is losing momentum or reversing.
Traders can use QQE in a number of different ways, including as a confirmation tool for other indicators or as a standalone indicator. For example, when used in conjunction with other technical analysis tools like support and resistance levels, the QQE indicator can help traders identify key entry and exit points for their trades.
One of the main advantages of the QQE indicator is that it is designed to be more reliable than other indicators that can generate false signals. By smoothing out the price action, the QQE indicator can provide traders with more accurate and reliable signals, which can help them make more profitable trading decisions.
In conclusion, QQE is a popular technical analysis indicator that traders use to identify trends and trading opportunities in financial markets. It combines the RSI and moving average indicators and is designed to provide traders with reliable signals that confirm the strength of a trend or indicate a possible trend reversal.
What is RSI?
RSI stands for Relative Strength Index . It is a technical indicator used to measure the strength or weakness of a financial instrument's price action.
The RSI is calculated based on the price movement of an asset over a specified period of time, typically 14 days, and is expressed on a scale of 0 to 100. The RSI is considered overbought when it is above 70 and oversold when it is below 30.
Traders and investors use the RSI to identify potential buy and sell signals. When the RSI indicates that an asset is oversold, it may be considered a buying opportunity, while an overbought RSI may signal that it is time to sell or take profits.
It's important to note that the RSI should not be used in isolation and should be used in conjunction with other technical and fundamental analysis tools to make informed trading decisions.
This indicator makes use of the following libraries:
Loxx's Moving Averages
Loxx's Expanded Source Types
Extras
Alerts
Signals
Signal Types
Change on Levels
Change on Slope
Change on Zero
Change on Original

GKD-C Double-Smoothed Stochastic QQE [Loxx]Giga Kaleidoscope GKD-C Double-Smoothed Stochastic QQE is a Confirmation module included in Loxx's "Giga Kaleidoscope Modularized Trading System".
█ Giga Kaleidoscope Modularized Trading System
What is Loxx's "Giga Kaleidoscope Modularized Trading System"?
The Giga Kaleidoscope Modularized Trading System is a trading system built on the philosophy of the NNFX (No Nonsense Forex) algorithmic trading.
What is the NNFX algorithmic trading strategy?
The NNFX (No-Nonsense Forex) trading system is a comprehensive approach to Forex trading that is designed to simplify the process and remove the confusion and complexity that often surrounds trading. The system was developed by a Forex trader who goes by the pseudonym "VP" and has gained a significant following in the Forex community.
The NNFX trading system is based on a set of rules and guidelines that help traders make objective and informed decisions. These rules cover all aspects of trading, including market analysis, trade entry, stop loss placement, and trade management.
Here are the main components of the NNFX trading system:
1. Trading Philosophy: The NNFX trading system is based on the idea that successful trading requires a comprehensive understanding of the market, objective analysis, and strict risk management. The system aims to remove subjective elements from trading and focuses on objective rules and guidelines.
2. Technical Analysis: The NNFX trading system relies heavily on technical analysis and uses a range of indicators to identify high-probability trading opportunities. The system uses a combination of trend-following and mean-reverting strategies to identify trades.
3. Market Structure: The NNFX trading system emphasizes the importance of understanding the market structure, including price action, support and resistance levels, and market cycles. The system uses a range of tools to identify the market structure, including trend lines, channels, and moving averages.
4. Trade Entry: The NNFX trading system has strict rules for trade entry. The system uses a combination of technical indicators to identify high-probability trades, and traders must meet specific criteria to enter a trade.
5. Stop Loss Placement: The NNFX trading system places a significant emphasis on risk management and requires traders to place a stop loss order on every trade. The system uses a combination of technical analysis and market structure to determine the appropriate stop loss level.
6. Trade Management: The NNFX trading system has specific rules for managing open trades. The system aims to minimize risk and maximize profit by using a combination of trailing stops, take profit levels, and position sizing.
Overall, the NNFX trading system is designed to be a straightforward and easy-to-follow approach to Forex trading that can be applied by traders of all skill levels.
Core components of an NNFX algorithmic trading strategy
The NNFX algorithm is built on the principles of trend, momentum, and volatility. There are six core components in the NNFX trading algorithm:
1. Volatility - price volatility; e.g., Average True Range, True Range Double, Close-to-Close, etc.
2. Baseline - a moving average to identify price trend
3. Confirmation 1 - a technical indicator used to identify trends
4. Confirmation 2 - a technical indicator used to identify trends
5. Continuation - a technical indicator used to identify trends
6. Volatility/Volume - a technical indicator used to identify volatility/volume breakouts/breakdown
7. Exit - a technical indicator used to determine when a trend is exhausted
What is Volatility in the NNFX trading system?
In the NNFX (No Nonsense Forex) trading system, ATR (Average True Range) is typically used to measure the volatility of an asset. It is used as a part of the system to help determine the appropriate stop loss and take profit levels for a trade. ATR is calculated by taking the average of the true range values over a specified period.
True range is calculated as the maximum of the following values:
-Current high minus the current low
-Absolute value of the current high minus the previous close
-Absolute value of the current low minus the previous close
ATR is a dynamic indicator that changes with changes in volatility. As volatility increases, the value of ATR increases, and as volatility decreases, the value of ATR decreases. By using ATR in NNFX system, traders can adjust their stop loss and take profit levels according to the volatility of the asset being traded. This helps to ensure that the trade is given enough room to move, while also minimizing potential losses.
Other types of volatility include True Range Double (TRD), Close-to-Close, and Garman-Klass
What is a Baseline indicator?
The baseline is essentially a moving average, and is used to determine the overall direction of the market.
The baseline in the NNFX system is used to filter out trades that are not in line with the long-term trend of the market. The baseline is plotted on the chart along with other indicators, such as the Moving Average (MA), the Relative Strength Index (RSI), and the Average True Range (ATR).
Trades are only taken when the price is in the same direction as the baseline. For example, if the baseline is sloping upwards, only long trades are taken, and if the baseline is sloping downwards, only short trades are taken. This approach helps to ensure that trades are in line with the overall trend of the market, and reduces the risk of entering trades that are likely to fail.
By using a baseline in the NNFX system, traders can have a clear reference point for determining the overall trend of the market, and can make more informed trading decisions. The baseline helps to filter out noise and false signals, and ensures that trades are taken in the direction of the long-term trend.
What is a Confirmation indicator?
Confirmation indicators are technical indicators that are used to confirm the signals generated by primary indicators. Primary indicators are the core indicators used in the NNFX system, such as the Average True Range (ATR), the Moving Average (MA), and the Relative Strength Index (RSI).
The purpose of the confirmation indicators is to reduce false signals and improve the accuracy of the trading system. They are designed to confirm the signals generated by the primary indicators by providing additional information about the strength and direction of the trend.
Some examples of confirmation indicators that may be used in the NNFX system include the Bollinger Bands, the MACD (Moving Average Convergence Divergence), and the MACD Oscillator. These indicators can provide information about the volatility, momentum, and trend strength of the market, and can be used to confirm the signals generated by the primary indicators.
In the NNFX system, confirmation indicators are used in combination with primary indicators and other filters to create a trading system that is robust and reliable. By using multiple indicators to confirm trading signals, the system aims to reduce the risk of false signals and improve the overall profitability of the trades.
What is a Continuation indicator?
In the NNFX (No Nonsense Forex) trading system, a continuation indicator is a technical indicator that is used to confirm a current trend and predict that the trend is likely to continue in the same direction. A continuation indicator is typically used in conjunction with other indicators in the system, such as a baseline indicator, to provide a comprehensive trading strategy.
What is a Volatility/Volume indicator?
Volume indicators, such as the On Balance Volume (OBV), the Chaikin Money Flow (CMF), or the Volume Price Trend (VPT), are used to measure the amount of buying and selling activity in a market. They are based on the trading volume of the market, and can provide information about the strength of the trend. In the NNFX system, volume indicators are used to confirm trading signals generated by the Moving Average and the Relative Strength Index. Volatility indicators include Average Direction Index, Waddah Attar, and Volatility Ratio. In the NNFX trading system, volatility is a proxy for volume and vice versa.
By using volume indicators as confirmation tools, the NNFX trading system aims to reduce the risk of false signals and improve the overall profitability of trades. These indicators can provide additional information about the market that is not captured by the primary indicators, and can help traders to make more informed trading decisions. In addition, volume indicators can be used to identify potential changes in market trends and to confirm the strength of price movements.
What is an Exit indicator?
The exit indicator is used in conjunction with other indicators in the system, such as the Moving Average (MA), the Relative Strength Index (RSI), and the Average True Range (ATR), to provide a comprehensive trading strategy.
The exit indicator in the NNFX system can be any technical indicator that is deemed effective at identifying optimal exit points. Examples of exit indicators that are commonly used include the Parabolic SAR, the Average Directional Index (ADX), and the Chandelier Exit.
The purpose of the exit indicator is to identify when a trend is likely to reverse or when the market conditions have changed, signaling the need to exit a trade. By using an exit indicator, traders can manage their risk and prevent significant losses.
In the NNFX system, the exit indicator is used in conjunction with a stop loss and a take profit order to maximize profits and minimize losses. The stop loss order is used to limit the amount of loss that can be incurred if the trade goes against the trader, while the take profit order is used to lock in profits when the trade is moving in the trader's favor.
Overall, the use of an exit indicator in the NNFX trading system is an important component of a comprehensive trading strategy. It allows traders to manage their risk effectively and improve the profitability of their trades by exiting at the right time.
How does Loxx's GKD (Giga Kaleidoscope Modularized Trading System) implement the NNFX algorithm outlined above?
Loxx's GKD v1.0 system has five types of modules (indicators/strategies). These modules are:
1. GKD-BT - Backtesting module (Volatility, Number 1 in the NNFX algorithm)
2. GKD-B - Baseline module (Baseline and Volatility/Volume, Numbers 1 and 2 in the NNFX algorithm)
3. GKD-C - Confirmation 1/2 and Continuation module (Confirmation 1/2 and Continuation, Numbers 3, 4, and 5 in the NNFX algorithm)
4. GKD-V - Volatility/Volume module (Confirmation 1/2, Number 6 in the NNFX algorithm)
5. GKD-E - Exit module (Exit, Number 7 in the NNFX algorithm)
(additional module types will added in future releases)
Each module interacts with every module by passing data between modules. Data is passed between each module as described below:
GKD-B => GKD-V => GKD-C(1) => GKD-C(2) => GKD-C(Continuation) => GKD-E => GKD-BT
That is, the Baseline indicator passes its data to Volatility/Volume. The Volatility/Volume indicator passes its values to the Confirmation 1 indicator. The Confirmation 1 indicator passes its values to the Confirmation 2 indicator. The Confirmation 2 indicator passes its values to the Continuation indicator. The Continuation indicator passes its values to the Exit indicator, and finally, the Exit indicator passes its values to the Backtest strategy.
This chaining of indicators requires that each module conform to Loxx's GKD protocol, therefore allowing for the testing of every possible combination of technical indicators that make up the six components of the NNFX algorithm.
What does the application of the GKD trading system look like?
Example trading system:
Backtest: Strategy with 1-3 take profits, trailing stop loss, multiple types of PnL volatility, and 2 backtesting styles
Baseline: Hull Moving Average
Volatility/Volume: Hurst Exponent
Confirmation 1: Double-Smoothed Stochastic QQE as shown on the chart above
Confirmation 2: Williams Percent Range
Continuation: Fisher Transform
Exit: Rex Oscillator
Each GKD indicator is denoted with a module identifier of either: GKD-BT, GKD-B, GKD-C, GKD-V, or GKD-E. This allows traders to understand to which module each indicator belongs and where each indicator fits into the GKD protocol chain.
Giga Kaleidoscope Modularized Trading System Signals (based on the NNFX algorithm)
Standard Entry
1. GKD-C Confirmation 1 Signal
2. GKD-B Baseline agrees
3. Price is within a range of 0.2x Volatility and 1.0x Volatility of the Goldie Locks Mean
4. GKD-C Confirmation 2 agrees
5. GKD-V Volatility/Volume agrees
Baseline Entry
1. GKD-B Baseline signal
2. GKD-C Confirmation 1 agrees
3. Price is within a range of 0.2x Volatility and 1.0x Volatility of the Goldie Locks Mean
4. GKD-C Confirmation 2 agrees
5. GKD-V Volatility/Volume agrees
6. GKD-C Confirmation 1 signal was less than 7 candles prior
Continuation Entry
1. Standard Entry, Baseline Entry, or Pullback; entry triggered previously
2. GKD-B Baseline hasn't crossed since entry signal trigger
3. GKD-C Confirmation Continuation Indicator signals
4. GKD-C Confirmation 1 agrees
5. GKD-B Baseline agrees
6. GKD-C Confirmation 2 agrees
1-Candle Rule Standard Entry
1. GKD-C Confirmation 1 signal
2. GKD-B Baseline agrees
3. Price is within a range of 0.2x Volatility and 1.0x Volatility of the Goldie Locks Mean
Next Candle:
1. Price retraced (Long: close < close or Short: close > close )
2. GKD-B Baseline agrees
3. GKD-C Confirmation 1 agrees
4. GKD-C Confirmation 2 agrees
5. GKD-V Volatility/Volume agrees
1-Candle Rule Baseline Entry
1. GKD-B Baseline signal
2. GKD-C Confirmation 1 agrees
3. Price is within a range of 0.2x Volatility and 1.0x Volatility of the Goldie Locks Mean
4. GKD-C Confirmation 1 signal was less than 7 candles prior
Next Candle:
1. Price retraced (Long: close < close or Short: close > close )
2. GKD-B Baseline agrees
3. GKD-C Confirmation 1 agrees
4. GKD-C Confirmation 2 agrees
5. GKD-V Volatility/Volume Agrees
PullBack Entry
1. GKD-B Baseline signal
2. GKD-C Confirmation 1 agrees
3. Price is beyond 1.0x Volatility of Baseline
Next Candle:
1. Price is within a range of 0.2x Volatility and 1.0x Volatility of the Goldie Locks Mean
3. GKD-C Confirmation 1 agrees
4. GKD-C Confirmation 2 agrees
5. GKD-V Volatility/Volume Agrees
█ GKD-C Double-Smoothed Stochastic QQE
What is the Double Smoothed Stochastic Oscillator (DSS)
The Double Smoothed Stochastic Oscillator (DSS) is a technical indicator used in financial analysis to measure the momentum of a security's price. It is an enhanced version of the traditional Stochastic Oscillator that reduces false signals and lag.
The traditional Stochastic Oscillator measures the position of a security's closing price relative to its price range over a specified period, usually 14 days. It calculates two lines, %K and %D, which oscillate between 0 and 100. When %K crosses above %D, it is considered a buy signal, and when %K crosses below %D, it is considered a sell signal.
The Double Smoothed Stochastic Oscillator adds an additional level of smoothing to the traditional Stochastic Oscillator by calculating two additional lines, DSS %K and DSS %D, using a double exponential moving average (DEMA) formula. The DEMA formula is a weighted moving average that gives more weight to recent data points than older data points.
The DSS %K line is calculated by taking a 3-period DEMA of the traditional Stochastic %K line, and the DSS %D line is calculated by taking a 3-period DEMA of the DSS %K line. The result is a smoother oscillator that responds more quickly to changes in price momentum.
Traders use the DSS to identify overbought and oversold conditions, as well as trend reversals. An overbought condition occurs when the oscillator is above 80, and an oversold condition occurs when the oscillator is below 20. Traders look for buy signals when the oscillator crosses above 20 from oversold conditions, and sell signals when the oscillator crosses below 80 from overbought conditions.
In summary, the Double Smoothed Stochastic Oscillator is an enhanced version of the traditional Stochastic Oscillator that reduces false signals and lag by adding an additional level of smoothing through the use of a double exponential moving average formula. It is used by traders to identify overbought and oversold conditions and trend reversals.
What is QQE?
Quantitative Qualitative Estimation (QQE) is a technical analysis indicator used to identify trends and trading opportunities in financial markets. It is based on a combination of two popular technical analysis indicators - the Relative Strength Index (RSI) and Moving Averages (MA).
The QQE indicator uses a smoothed RSI to determine the trend direction, and a moving average of the smoothed RSI to identify potential trend changes. The indicator then plots a series of bands above and below the moving average to indicate overbought and oversold conditions in the market.
The QQE indicator is designed to provide traders with a reliable signal that confirms the strength of a trend or indicates a possible trend reversal. It is particularly useful for traders who are looking to trade in markets that are trending strongly, but also want to identify when a trend is losing momentum or reversing.
Traders can use QQE in a number of different ways, including as a confirmation tool for other indicators or as a standalone indicator. For example, when used in conjunction with other technical analysis tools like support and resistance levels, the QQE indicator can help traders identify key entry and exit points for their trades.
One of the main advantages of the QQE indicator is that it is designed to be more reliable than other indicators that can generate false signals. By smoothing out the price action, the QQE indicator can provide traders with more accurate and reliable signals, which can help them make more profitable trading decisions.
In conclusion, QQE is a popular technical analysis indicator that traders use to identify trends and trading opportunities in financial markets. It combines the RSI and moving average indicators and is designed to provide traders with reliable signals that confirm the strength of a trend or indicate a possible trend reversal.
Requirements
Inputs
Confirmation 1 and Solo Confirmation: GKD-V Volatility / Volume indicator
Confirmation 2: GKD-C Confirmation indicator
Outputs
Confirmation 2 and Solo Confirmation Complex: GKD-E Exit indicator
Confirmation 1: GKD-C Confirmation indicator
Continuation: GKD-E Exit indicator
Solo Confirmation Simple: GKD-BT Backtest strategy
Additional features will be added in future releases.

GKD-C Juirk-Filtered QQE Histogram [Loxx]Giga Kaleidoscope GKD-C Juirk-Filtered QQE Histogram is a Confirmation module included in Loxx's "Giga Kaleidoscope Modularized Trading System".
█ Giga Kaleidoscope Modularized Trading System
What is Loxx's "Giga Kaleidoscope Modularized Trading System"?
The Giga Kaleidoscope Modularized Trading System is a trading system built on the philosophy of the NNFX (No Nonsense Forex) algorithmic trading.
What is the NNFX algorithmic trading strategy?
The NNFX (No-Nonsense Forex) trading system is a comprehensive approach to Forex trading that is designed to simplify the process and remove the confusion and complexity that often surrounds trading. The system was developed by a Forex trader who goes by the pseudonym "VP" and has gained a significant following in the Forex community.
The NNFX trading system is based on a set of rules and guidelines that help traders make objective and informed decisions. These rules cover all aspects of trading, including market analysis, trade entry, stop loss placement, and trade management.
Here are the main components of the NNFX trading system:
1. Trading Philosophy: The NNFX trading system is based on the idea that successful trading requires a comprehensive understanding of the market, objective analysis, and strict risk management. The system aims to remove subjective elements from trading and focuses on objective rules and guidelines.
2. Technical Analysis: The NNFX trading system relies heavily on technical analysis and uses a range of indicators to identify high-probability trading opportunities. The system uses a combination of trend-following and mean-reverting strategies to identify trades.
3. Market Structure: The NNFX trading system emphasizes the importance of understanding the market structure, including price action, support and resistance levels, and market cycles. The system uses a range of tools to identify the market structure, including trend lines, channels, and moving averages.
4. Trade Entry: The NNFX trading system has strict rules for trade entry. The system uses a combination of technical indicators to identify high-probability trades, and traders must meet specific criteria to enter a trade.
5. Stop Loss Placement: The NNFX trading system places a significant emphasis on risk management and requires traders to place a stop loss order on every trade. The system uses a combination of technical analysis and market structure to determine the appropriate stop loss level.
6. Trade Management: The NNFX trading system has specific rules for managing open trades. The system aims to minimize risk and maximize profit by using a combination of trailing stops, take profit levels, and position sizing.
Overall, the NNFX trading system is designed to be a straightforward and easy-to-follow approach to Forex trading that can be applied by traders of all skill levels.
Core components of an NNFX algorithmic trading strategy
The NNFX algorithm is built on the principles of trend, momentum, and volatility. There are six core components in the NNFX trading algorithm:
1. Volatility - price volatility; e.g., Average True Range, True Range Double, Close-to-Close, etc.
2. Baseline - a moving average to identify price trend
3. Confirmation 1 - a technical indicator used to identify trends
4. Confirmation 2 - a technical indicator used to identify trends
5. Continuation - a technical indicator used to identify trends
6. Volatility/Volume - a technical indicator used to identify volatility/volume breakouts/breakdown
7. Exit - a technical indicator used to determine when a trend is exhausted
What is Volatility in the NNFX trading system?
In the NNFX (No Nonsense Forex) trading system, ATR (Average True Range) is typically used to measure the volatility of an asset. It is used as a part of the system to help determine the appropriate stop loss and take profit levels for a trade. ATR is calculated by taking the average of the true range values over a specified period.
True range is calculated as the maximum of the following values:
-Current high minus the current low
-Absolute value of the current high minus the previous close
-Absolute value of the current low minus the previous close
ATR is a dynamic indicator that changes with changes in volatility. As volatility increases, the value of ATR increases, and as volatility decreases, the value of ATR decreases. By using ATR in NNFX system, traders can adjust their stop loss and take profit levels according to the volatility of the asset being traded. This helps to ensure that the trade is given enough room to move, while also minimizing potential losses.
Other types of volatility include True Range Double (TRD), Close-to-Close, and Garman-Klass
What is a Baseline indicator?
The baseline is essentially a moving average, and is used to determine the overall direction of the market.
The baseline in the NNFX system is used to filter out trades that are not in line with the long-term trend of the market. The baseline is plotted on the chart along with other indicators, such as the Moving Average (MA), the Relative Strength Index (RSI), and the Average True Range (ATR).
Trades are only taken when the price is in the same direction as the baseline. For example, if the baseline is sloping upwards, only long trades are taken, and if the baseline is sloping downwards, only short trades are taken. This approach helps to ensure that trades are in line with the overall trend of the market, and reduces the risk of entering trades that are likely to fail.
By using a baseline in the NNFX system, traders can have a clear reference point for determining the overall trend of the market, and can make more informed trading decisions. The baseline helps to filter out noise and false signals, and ensures that trades are taken in the direction of the long-term trend.
What is a Confirmation indicator?
Confirmation indicators are technical indicators that are used to confirm the signals generated by primary indicators. Primary indicators are the core indicators used in the NNFX system, such as the Average True Range (ATR), the Moving Average (MA), and the Relative Strength Index (RSI).
The purpose of the confirmation indicators is to reduce false signals and improve the accuracy of the trading system. They are designed to confirm the signals generated by the primary indicators by providing additional information about the strength and direction of the trend.
Some examples of confirmation indicators that may be used in the NNFX system include the Bollinger Bands, the MACD (Moving Average Convergence Divergence), and the MACD Oscillator. These indicators can provide information about the volatility, momentum, and trend strength of the market, and can be used to confirm the signals generated by the primary indicators.
In the NNFX system, confirmation indicators are used in combination with primary indicators and other filters to create a trading system that is robust and reliable. By using multiple indicators to confirm trading signals, the system aims to reduce the risk of false signals and improve the overall profitability of the trades.
What is a Continuation indicator?
In the NNFX (No Nonsense Forex) trading system, a continuation indicator is a technical indicator that is used to confirm a current trend and predict that the trend is likely to continue in the same direction. A continuation indicator is typically used in conjunction with other indicators in the system, such as a baseline indicator, to provide a comprehensive trading strategy.
What is a Volatility/Volume indicator?
Volume indicators, such as the On Balance Volume (OBV), the Chaikin Money Flow (CMF), or the Volume Price Trend (VPT), are used to measure the amount of buying and selling activity in a market. They are based on the trading volume of the market, and can provide information about the strength of the trend. In the NNFX system, volume indicators are used to confirm trading signals generated by the Moving Average and the Relative Strength Index. Volatility indicators include Average Direction Index, Waddah Attar, and Volatility Ratio. In the NNFX trading system, volatility is a proxy for volume and vice versa.
By using volume indicators as confirmation tools, the NNFX trading system aims to reduce the risk of false signals and improve the overall profitability of trades. These indicators can provide additional information about the market that is not captured by the primary indicators, and can help traders to make more informed trading decisions. In addition, volume indicators can be used to identify potential changes in market trends and to confirm the strength of price movements.
What is an Exit indicator?
The exit indicator is used in conjunction with other indicators in the system, such as the Moving Average (MA), the Relative Strength Index (RSI), and the Average True Range (ATR), to provide a comprehensive trading strategy.
The exit indicator in the NNFX system can be any technical indicator that is deemed effective at identifying optimal exit points. Examples of exit indicators that are commonly used include the Parabolic SAR, the Average Directional Index (ADX), and the Chandelier Exit.
The purpose of the exit indicator is to identify when a trend is likely to reverse or when the market conditions have changed, signaling the need to exit a trade. By using an exit indicator, traders can manage their risk and prevent significant losses.
In the NNFX system, the exit indicator is used in conjunction with a stop loss and a take profit order to maximize profits and minimize losses. The stop loss order is used to limit the amount of loss that can be incurred if the trade goes against the trader, while the take profit order is used to lock in profits when the trade is moving in the trader's favor.
Overall, the use of an exit indicator in the NNFX trading system is an important component of a comprehensive trading strategy. It allows traders to manage their risk effectively and improve the profitability of their trades by exiting at the right time.
How does Loxx's GKD (Giga Kaleidoscope Modularized Trading System) implement the NNFX algorithm outlined above?
Loxx's GKD v1.0 system has five types of modules (indicators/strategies). These modules are:
1. GKD-BT - Backtesting module (Volatility, Number 1 in the NNFX algorithm)
2. GKD-B - Baseline module (Baseline and Volatility/Volume, Numbers 1 and 2 in the NNFX algorithm)
3. GKD-C - Confirmation 1/2 and Continuation module (Confirmation 1/2 and Continuation, Numbers 3, 4, and 5 in the NNFX algorithm)
4. GKD-V - Volatility/Volume module (Confirmation 1/2, Number 6 in the NNFX algorithm)
5. GKD-E - Exit module (Exit, Number 7 in the NNFX algorithm)
(additional module types will added in future releases)
Each module interacts with every module by passing data between modules. Data is passed between each module as described below:
GKD-B => GKD-V => GKD-C(1) => GKD-C(2) => GKD-C(Continuation) => GKD-E => GKD-BT
That is, the Baseline indicator passes its data to Volatility/Volume. The Volatility/Volume indicator passes its values to the Confirmation 1 indicator. The Confirmation 1 indicator passes its values to the Confirmation 2 indicator. The Confirmation 2 indicator passes its values to the Continuation indicator. The Continuation indicator passes its values to the Exit indicator, and finally, the Exit indicator passes its values to the Backtest strategy.
This chaining of indicators requires that each module conform to Loxx's GKD protocol, therefore allowing for the testing of every possible combination of technical indicators that make up the six components of the NNFX algorithm.
What does the application of the GKD trading system look like?
Example trading system:
Backtest: Strategy with 1-3 take profits, trailing stop loss, multiple types of PnL volatility, and 2 backtesting styles
Baseline: Hull Moving Average
Volatility/Volume: Hurst Exponent
Confirmation 1: Juirk-Filtered QQE Histogram as shown on the chart above
Confirmation 2: Williams Percent Range
Continuation: Fisher Transform
Exit: Rex Oscillator
Each GKD indicator is denoted with a module identifier of either: GKD-BT, GKD-B, GKD-C, GKD-V, or GKD-E. This allows traders to understand to which module each indicator belongs and where each indicator fits into the GKD protocol chain.
Giga Kaleidoscope Modularized Trading System Signals (based on the NNFX algorithm)
Standard Entry
1. GKD-C Confirmation 1 Signal
2. GKD-B Baseline agrees
3. Price is within a range of 0.2x Volatility and 1.0x Volatility of the Goldie Locks Mean
4. GKD-C Confirmation 2 agrees
5. GKD-V Volatility/Volume agrees
Baseline Entry
1. GKD-B Baseline signal
2. GKD-C Confirmation 1 agrees
3. Price is within a range of 0.2x Volatility and 1.0x Volatility of the Goldie Locks Mean
4. GKD-C Confirmation 2 agrees
5. GKD-V Volatility/Volume agrees
6. GKD-C Confirmation 1 signal was less than 7 candles prior
Continuation Entry
1. Standard Entry, Baseline Entry, or Pullback; entry triggered previously
2. GKD-B Baseline hasn't crossed since entry signal trigger
3. GKD-C Confirmation Continuation Indicator signals
4. GKD-C Confirmation 1 agrees
5. GKD-B Baseline agrees
6. GKD-C Confirmation 2 agrees
1-Candle Rule Standard Entry
1. GKD-C Confirmation 1 signal
2. GKD-B Baseline agrees
3. Price is within a range of 0.2x Volatility and 1.0x Volatility of the Goldie Locks Mean
Next Candle:
1. Price retraced (Long: close < close or Short: close > close )
2. GKD-B Baseline agrees
3. GKD-C Confirmation 1 agrees
4. GKD-C Confirmation 2 agrees
5. GKD-V Volatility/Volume agrees
1-Candle Rule Baseline Entry
1. GKD-B Baseline signal
2. GKD-C Confirmation 1 agrees
3. Price is within a range of 0.2x Volatility and 1.0x Volatility of the Goldie Locks Mean
4. GKD-C Confirmation 1 signal was less than 7 candles prior
Next Candle:
1. Price retraced (Long: close < close or Short: close > close )
2. GKD-B Baseline agrees
3. GKD-C Confirmation 1 agrees
4. GKD-C Confirmation 2 agrees
5. GKD-V Volatility/Volume Agrees
PullBack Entry
1. GKD-B Baseline signal
2. GKD-C Confirmation 1 agrees
3. Price is beyond 1.0x Volatility of Baseline
Next Candle:
1. Price is within a range of 0.2x Volatility and 1.0x Volatility of the Goldie Locks Mean
3. GKD-C Confirmation 1 agrees
4. GKD-C Confirmation 2 agrees
5. GKD-V Volatility/Volume Agrees
█ GKD-C Juirk-Filtered QQE Histogram
What is Parabolic-Weighted Velocity?
Parabolic-Weighted Velocity (PWV) is a mathematical model used in sports science to estimate the velocity of an athlete during a given movement or exercise. This model uses a parabolic weighting function to give more importance to the velocities achieved in the middle of the movement and less importance to the velocities achieved at the beginning and end of the movement.
PWV takes into account the acceleration and deceleration of an athlete during the movement, and uses this information to calculate an average velocity. The model assumes that the athlete moves at a constant velocity during the middle portion of the movement and that the velocity increases and decreases smoothly at the beginning and end of the movement.
The parabolic weighting function used in PWV is based on the principle of impulse momentum, which states that the change in momentum of an object is equal to the impulse applied to it. The impulse is calculated as the force applied to an object multiplied by the time during which the force is applied. By giving more weight to the velocities achieved during the middle of the movement, PWV takes into account the impulse generated during this period of the movement.
PWV is commonly used in sports science to measure the performance of athletes during activities such as sprinting, jumping, and throwing. It is often used in conjunction with other metrics such as power and force to provide a comprehensive picture of an athlete's performance. Additionally, PWV can be used to compare the performance of different athletes or to track an athlete's progress over time.
Overall, Parabolic-Weighted Velocity is a useful tool in sports science for estimating an athlete's velocity during a movement or exercise, taking into account the acceleration and deceleration of the athlete during the movement.
What is QQE?
Quantitative Qualitative Estimation (QQE) is a technical analysis indicator used to identify trends and trading opportunities in financial markets. It is based on a combination of two popular technical analysis indicators - the Relative Strength Index (RSI) and Moving Averages (MA).
The QQE indicator uses a smoothed RSI to determine the trend direction, and a moving average of the smoothed RSI to identify potential trend changes. The indicator then plots a series of bands above and below the moving average to indicate overbought and oversold conditions in the market.
The QQE indicator is designed to provide traders with a reliable signal that confirms the strength of a trend or indicates a possible trend reversal. It is particularly useful for traders who are looking to trade in markets that are trending strongly, but also want to identify when a trend is losing momentum or reversing.
Traders can use QQE in a number of different ways, including as a confirmation tool for other indicators or as a standalone indicator. For example, when used in conjunction with other technical analysis tools like support and resistance levels, the QQE indicator can help traders identify key entry and exit points for their trades.
One of the main advantages of the QQE indicator is that it is designed to be more reliable than other indicators that can generate false signals. By smoothing out the price action, the QQE indicator can provide traders with more accurate and reliable signals, which can help them make more profitable trading decisions.
In conclusion, QQE is a popular technical analysis indicator that traders use to identify trends and trading opportunities in financial markets. It combines the RSI and moving average indicators and is designed to provide traders with reliable signals that confirm the strength of a trend or indicate a possible trend reversal.
What is the Jurik Filter?
The Jurik Filter is a technical analysis tool that is used to filter out market noise and identify trends in financial markets. It was developed by Mark Jurik in the 1990s and is based on a non-linear smoothing algorithm that provides a more accurate representation of price movements.
Traditional moving averages, such as the Simple Moving Average ( SMA ) or Exponential Moving Average ( EMA ), are linear filters that produce a lag between price and the moving average line. This can cause false signals during periods of market volatility , which can result in losses for traders and investors.
The Jurik Filter is designed to address this issue by incorporating a damping factor into the smoothing algorithm. This damping factor adjusts the filter's responsiveness to the changes in price, allowing it to filter out market noise without overshooting price peaks and valleys.
The Jurik Filter is calculated using a mathematical formula that takes into account the current and past prices of an asset, as well as the volatility of the market. This formula incorporates the damping factor and produces a smoother price curve than traditional moving average filters.
One of the advantages of the Jurik Filter is its ability to adjust to changing market conditions. The damping factor can be adjusted to suit different securities and time frames, making it a versatile tool for traders and investors.
Traders and investors often use the Jurik Filter in conjunction with other technical analysis tools, such as the MACD or RSI , to confirm or complement their trading strategies. By filtering out market noise and identifying trends in the financial markets, the Jurik Filter can help improve the accuracy of trading signals and reduce the risks of false signals during periods of market volatility .
Overall, the Jurik Filter is a powerful technical analysis tool that can help traders and investors make more informed decisions about buying and selling securities. By providing a smoother price curve and reducing false signals, it can help improve trading performance and reduce risk in volatile markets.
This indicator contains 7 different types of RSI:
RSX
Regular
Slow
Rapid
Harris
Cuttler
Ehlers Smoothed
What is RSI?
RSI stands for Relative Strength Index . It is a technical indicator used to measure the strength or weakness of a financial instrument's price action.
The RSI is calculated based on the price movement of an asset over a specified period of time, typically 14 days, and is expressed on a scale of 0 to 100. The RSI is considered overbought when it is above 70 and oversold when it is below 30.
Traders and investors use the RSI to identify potential buy and sell signals. When the RSI indicates that an asset is oversold, it may be considered a buying opportunity, while an overbought RSI may signal that it is time to sell or take profits.
It's important to note that the RSI should not be used in isolation and should be used in conjunction with other technical and fundamental analysis tools to make informed trading decisions.
What is RSX?
Jurik RSX is a technical analysis indicator that is a variation of the Relative Strength Index Smoothed ( RSX ) indicator. It was developed by Mark Jurik and is designed to help traders identify trends and momentum in the market.
The Jurik RSX uses a combination of the RSX indicator and an adaptive moving average (AMA) to smooth out the price data and reduce the number of false signals. The adaptive moving average is designed to adjust the smoothing period based on the current market conditions, which makes the indicator more responsive to changes in price.
The Jurik RSX can be used to identify potential trend reversals and momentum shifts in the market. It oscillates between 0 and 100, with values above 50 indicating a bullish trend and values below 50 indicating a bearish trend . Traders can use these levels to make trading decisions, such as buying when the indicator crosses above 50 and selling when it crosses below 50.
The Jurik RSX is a more advanced version of the RSX indicator, and while it can be useful in identifying potential trade opportunities, it should not be used in isolation. It is best used in conjunction with other technical and fundamental analysis tools to make informed trading decisions.
What is Slow RSI?
Slow RSI is a variation of the traditional Relative Strength Index ( RSI ) indicator. It is a more smoothed version of the RSI and is designed to filter out some of the noise and short-term price fluctuations that can occur with the standard RSI .
The Slow RSI uses a longer period of time than the traditional RSI , typically 21 periods instead of 14. This longer period helps to smooth out the price data and makes the indicator less reactive to short-term price fluctuations.
Like the traditional RSI , the Slow RSI is used to identify potential overbought and oversold conditions in the market. It oscillates between 0 and 100, with values above 70 indicating overbought conditions and values below 30 indicating oversold conditions. Traders often use these levels as potential buy and sell signals.
The Slow RSI is a more conservative version of the RSI and can be useful in identifying longer-term trends in the market. However, it can also be slower to respond to changes in price, which may result in missed trading opportunities. Traders may choose to use a combination of both the Slow RSI and the traditional RSI to make informed trading decisions.
What is Rapid RSI?
Same as regular RSI but with a faster calculation method
What is Harris RSI?
Harris RSI is a technical analysis indicator that is a variation of the Relative Strength Index ( RSI ). It was developed by Larry Harris and is designed to help traders identify potential trend changes and momentum shifts in the market.
The Harris RSI uses a different calculation formula compared to the traditional RSI . It takes into account both the opening and closing prices of a financial instrument, as well as the high and low prices. The Harris RSI is also normalized to a range of 0 to 100, with values above 50 indicating a bullish trend and values below 50 indicating a bearish trend .
Like the traditional RSI , the Harris RSI is used to identify potential overbought and oversold conditions in the market. It oscillates between 0 and 100, with values above 70 indicating overbought conditions and values below 30 indicating oversold conditions. Traders often use these levels as potential buy and sell signals.
The Harris RSI is a more advanced version of the RSI and can be useful in identifying longer-term trends in the market. However, it can also generate more false signals than the standard RSI . Traders may choose to use a combination of both the Harris RSI and the traditional RSI to make informed trading decisions.
What is Cuttler RSI?
Cuttler RSI is a technical analysis indicator that is a variation of the Relative Strength Index ( RSI ). It was developed by Curt Cuttler and is designed to help traders identify potential trend changes and momentum shifts in the market.
The Cuttler RSI uses a different calculation formula compared to the traditional RSI . It takes into account the difference between the closing price of a financial instrument and the average of the high and low prices over a specified period of time. This difference is then normalized to a range of 0 to 100, with values above 50 indicating a bullish trend and values below 50 indicating a bearish trend .
Like the traditional RSI , the Cuttler RSI is used to identify potential overbought and oversold conditions in the market. It oscillates between 0 and 100, with values above 70 indicating overbought conditions and values below 30 indicating oversold conditions. Traders often use these levels as potential buy and sell signals.
The Cuttler RSI is a more advanced version of the RSI and can be useful in identifying longer-term trends in the market. However, it can also generate more false signals than the standard RSI . Traders may choose to use a combination of both the Cuttler RSI and the traditional RSI to make informed trading decisions.
What is Ehlers Smoothed RSI?
Ehlers smoothed RSI is a technical analysis indicator that is a variation of the Relative Strength Index ( RSI ). It was developed by John Ehlers and is designed to help traders identify potential trend changes and momentum shifts in the market.
The Ehlers smoothed RSI uses a different calculation formula compared to the traditional RSI . It uses a smoothing algorithm that is designed to reduce the noise and random fluctuations that can occur with the standard RSI . The smoothing algorithm is based on a concept called "digital signal processing" and is intended to improve the accuracy of the indicator.
Like the traditional RSI , the Ehlers smoothed RSI is used to identify potential overbought and oversold conditions in the market. It oscillates between 0 and 100, with values above 70 indicating overbought conditions and values below 30 indicating oversold conditions. Traders often use these levels as potential buy and sell signals.
The Ehlers smoothed RSI can be useful in identifying longer-term trends and momentum shifts in the market. However, it can also generate more false signals than the standard RSI . Traders may choose to use a combination of both the Ehlers smoothed RSI and the traditional RSI to make informed trading decisions.
What is Juirk-Filtered QQE Histogram ?
This indicator is a complex combiation of Jurik filtering with QQE output.
Requirements
Inputs
Confirmation 1 and Solo Confirmation: GKD-V Volatility / Volume indicator
Confirmation 2: GKD-C Confirmation indicator
Outputs
Confirmation 2 and Solo Confirmation Complex: GKD-E Exit indicator
Confirmation 1: GKD-C Confirmation indicator
Continuation: GKD-E Exit indicator
Solo Confirmation Simple: GKD-BT Backtest strategy
Additional features will be added in future releases.
GKD-C QQE of Parabolic-Weighted Velocity [Loxx]Giga Kaleidoscope GKD-C QQE of Parabolic-Weighted Velocity is a Confirmation module included in Loxx's "Giga Kaleidoscope Modularized Trading System".
█ Giga Kaleidoscope Modularized Trading System
What is Loxx's "Giga Kaleidoscope Modularized Trading System"?
The Giga Kaleidoscope Modularized Trading System is a trading system built on the philosophy of the NNFX (No Nonsense Forex) algorithmic trading.
What is the NNFX algorithmic trading strategy?
The NNFX (No-Nonsense Forex) trading system is a comprehensive approach to Forex trading that is designed to simplify the process and remove the confusion and complexity that often surrounds trading. The system was developed by a Forex trader who goes by the pseudonym "VP" and has gained a significant following in the Forex community.
The NNFX trading system is based on a set of rules and guidelines that help traders make objective and informed decisions. These rules cover all aspects of trading, including market analysis, trade entry, stop loss placement, and trade management.
Here are the main components of the NNFX trading system:
1. Trading Philosophy: The NNFX trading system is based on the idea that successful trading requires a comprehensive understanding of the market, objective analysis, and strict risk management. The system aims to remove subjective elements from trading and focuses on objective rules and guidelines.
2. Technical Analysis: The NNFX trading system relies heavily on technical analysis and uses a range of indicators to identify high-probability trading opportunities. The system uses a combination of trend-following and mean-reverting strategies to identify trades.
3. Market Structure: The NNFX trading system emphasizes the importance of understanding the market structure, including price action, support and resistance levels, and market cycles. The system uses a range of tools to identify the market structure, including trend lines, channels, and moving averages.
4. Trade Entry: The NNFX trading system has strict rules for trade entry. The system uses a combination of technical indicators to identify high-probability trades, and traders must meet specific criteria to enter a trade.
5. Stop Loss Placement: The NNFX trading system places a significant emphasis on risk management and requires traders to place a stop loss order on every trade. The system uses a combination of technical analysis and market structure to determine the appropriate stop loss level.
6. Trade Management: The NNFX trading system has specific rules for managing open trades. The system aims to minimize risk and maximize profit by using a combination of trailing stops, take profit levels, and position sizing.
Overall, the NNFX trading system is designed to be a straightforward and easy-to-follow approach to Forex trading that can be applied by traders of all skill levels.
Core components of an NNFX algorithmic trading strategy
The NNFX algorithm is built on the principles of trend, momentum, and volatility. There are six core components in the NNFX trading algorithm:
1. Volatility - price volatility; e.g., Average True Range, True Range Double, Close-to-Close, etc.
2. Baseline - a moving average to identify price trend
3. Confirmation 1 - a technical indicator used to identify trends
4. Confirmation 2 - a technical indicator used to identify trends
5. Continuation - a technical indicator used to identify trends
6. Volatility/Volume - a technical indicator used to identify volatility/volume breakouts/breakdown
7. Exit - a technical indicator used to determine when a trend is exhausted
What is Volatility in the NNFX trading system?
In the NNFX (No Nonsense Forex) trading system, ATR (Average True Range) is typically used to measure the volatility of an asset. It is used as a part of the system to help determine the appropriate stop loss and take profit levels for a trade. ATR is calculated by taking the average of the true range values over a specified period.
True range is calculated as the maximum of the following values:
-Current high minus the current low
-Absolute value of the current high minus the previous close
-Absolute value of the current low minus the previous close
ATR is a dynamic indicator that changes with changes in volatility. As volatility increases, the value of ATR increases, and as volatility decreases, the value of ATR decreases. By using ATR in NNFX system, traders can adjust their stop loss and take profit levels according to the volatility of the asset being traded. This helps to ensure that the trade is given enough room to move, while also minimizing potential losses.
Other types of volatility include True Range Double (TRD), Close-to-Close, and Garman-Klass
What is a Baseline indicator?
The baseline is essentially a moving average, and is used to determine the overall direction of the market.
The baseline in the NNFX system is used to filter out trades that are not in line with the long-term trend of the market. The baseline is plotted on the chart along with other indicators, such as the Moving Average (MA), the Relative Strength Index (RSI), and the Average True Range (ATR).
Trades are only taken when the price is in the same direction as the baseline. For example, if the baseline is sloping upwards, only long trades are taken, and if the baseline is sloping downwards, only short trades are taken. This approach helps to ensure that trades are in line with the overall trend of the market, and reduces the risk of entering trades that are likely to fail.
By using a baseline in the NNFX system, traders can have a clear reference point for determining the overall trend of the market, and can make more informed trading decisions. The baseline helps to filter out noise and false signals, and ensures that trades are taken in the direction of the long-term trend.
What is a Confirmation indicator?
Confirmation indicators are technical indicators that are used to confirm the signals generated by primary indicators. Primary indicators are the core indicators used in the NNFX system, such as the Average True Range (ATR), the Moving Average (MA), and the Relative Strength Index (RSI).
The purpose of the confirmation indicators is to reduce false signals and improve the accuracy of the trading system. They are designed to confirm the signals generated by the primary indicators by providing additional information about the strength and direction of the trend.
Some examples of confirmation indicators that may be used in the NNFX system include the Bollinger Bands, the MACD (Moving Average Convergence Divergence), and the MACD Oscillator. These indicators can provide information about the volatility, momentum, and trend strength of the market, and can be used to confirm the signals generated by the primary indicators.
In the NNFX system, confirmation indicators are used in combination with primary indicators and other filters to create a trading system that is robust and reliable. By using multiple indicators to confirm trading signals, the system aims to reduce the risk of false signals and improve the overall profitability of the trades.
What is a Continuation indicator?
In the NNFX (No Nonsense Forex) trading system, a continuation indicator is a technical indicator that is used to confirm a current trend and predict that the trend is likely to continue in the same direction. A continuation indicator is typically used in conjunction with other indicators in the system, such as a baseline indicator, to provide a comprehensive trading strategy.
What is a Volatility/Volume indicator?
Volume indicators, such as the On Balance Volume (OBV), the Chaikin Money Flow (CMF), or the Volume Price Trend (VPT), are used to measure the amount of buying and selling activity in a market. They are based on the trading volume of the market, and can provide information about the strength of the trend. In the NNFX system, volume indicators are used to confirm trading signals generated by the Moving Average and the Relative Strength Index. Volatility indicators include Average Direction Index, Waddah Attar, and Volatility Ratio. In the NNFX trading system, volatility is a proxy for volume and vice versa.
By using volume indicators as confirmation tools, the NNFX trading system aims to reduce the risk of false signals and improve the overall profitability of trades. These indicators can provide additional information about the market that is not captured by the primary indicators, and can help traders to make more informed trading decisions. In addition, volume indicators can be used to identify potential changes in market trends and to confirm the strength of price movements.
What is an Exit indicator?
The exit indicator is used in conjunction with other indicators in the system, such as the Moving Average (MA), the Relative Strength Index (RSI), and the Average True Range (ATR), to provide a comprehensive trading strategy.
The exit indicator in the NNFX system can be any technical indicator that is deemed effective at identifying optimal exit points. Examples of exit indicators that are commonly used include the Parabolic SAR, the Average Directional Index (ADX), and the Chandelier Exit.
The purpose of the exit indicator is to identify when a trend is likely to reverse or when the market conditions have changed, signaling the need to exit a trade. By using an exit indicator, traders can manage their risk and prevent significant losses.
In the NNFX system, the exit indicator is used in conjunction with a stop loss and a take profit order to maximize profits and minimize losses. The stop loss order is used to limit the amount of loss that can be incurred if the trade goes against the trader, while the take profit order is used to lock in profits when the trade is moving in the trader's favor.
Overall, the use of an exit indicator in the NNFX trading system is an important component of a comprehensive trading strategy. It allows traders to manage their risk effectively and improve the profitability of their trades by exiting at the right time.
How does Loxx's GKD (Giga Kaleidoscope Modularized Trading System) implement the NNFX algorithm outlined above?
Loxx's GKD v1.0 system has five types of modules (indicators/strategies). These modules are:
1. GKD-BT - Backtesting module (Volatility, Number 1 in the NNFX algorithm)
2. GKD-B - Baseline module (Baseline and Volatility/Volume, Numbers 1 and 2 in the NNFX algorithm)
3. GKD-C - Confirmation 1/2 and Continuation module (Confirmation 1/2 and Continuation, Numbers 3, 4, and 5 in the NNFX algorithm)
4. GKD-V - Volatility/Volume module (Confirmation 1/2, Number 6 in the NNFX algorithm)
5. GKD-E - Exit module (Exit, Number 7 in the NNFX algorithm)
(additional module types will added in future releases)
Each module interacts with every module by passing data between modules. Data is passed between each module as described below:
GKD-B => GKD-V => GKD-C(1) => GKD-C(2) => GKD-C(Continuation) => GKD-E => GKD-BT
That is, the Baseline indicator passes its data to Volatility/Volume. The Volatility/Volume indicator passes its values to the Confirmation 1 indicator. The Confirmation 1 indicator passes its values to the Confirmation 2 indicator. The Confirmation 2 indicator passes its values to the Continuation indicator. The Continuation indicator passes its values to the Exit indicator, and finally, the Exit indicator passes its values to the Backtest strategy.
This chaining of indicators requires that each module conform to Loxx's GKD protocol, therefore allowing for the testing of every possible combination of technical indicators that make up the six components of the NNFX algorithm.
What does the application of the GKD trading system look like?
Example trading system:
Backtest: Strategy with 1-3 take profits, trailing stop loss, multiple types of PnL volatility, and 2 backtesting styles
Baseline: Hull Moving Average
Volatility/Volume: Hurst Exponent
Confirmation 1: QQE of Parabolic-Weighted Velocity as shown on the chart above
Confirmation 2: Williams Percent Range
Continuation: Fisher Transform
Exit: Rex Oscillator
Each GKD indicator is denoted with a module identifier of either: GKD-BT, GKD-B, GKD-C, GKD-V, or GKD-E. This allows traders to understand to which module each indicator belongs and where each indicator fits into the GKD protocol chain.
Giga Kaleidoscope Modularized Trading System Signals (based on the NNFX algorithm)
Standard Entry
1. GKD-C Confirmation 1 Signal
2. GKD-B Baseline agrees
3. Price is within a range of 0.2x Volatility and 1.0x Volatility of the Goldie Locks Mean
4. GKD-C Confirmation 2 agrees
5. GKD-V Volatility/Volume agrees
Baseline Entry
1. GKD-B Baseline signal
2. GKD-C Confirmation 1 agrees
3. Price is within a range of 0.2x Volatility and 1.0x Volatility of the Goldie Locks Mean
4. GKD-C Confirmation 2 agrees
5. GKD-V Volatility/Volume agrees
6. GKD-C Confirmation 1 signal was less than 7 candles prior
Continuation Entry
1. Standard Entry, Baseline Entry, or Pullback; entry triggered previously
2. GKD-B Baseline hasn't crossed since entry signal trigger
3. GKD-C Confirmation Continuation Indicator signals
4. GKD-C Confirmation 1 agrees
5. GKD-B Baseline agrees
6. GKD-C Confirmation 2 agrees
1-Candle Rule Standard Entry
1. GKD-C Confirmation 1 signal
2. GKD-B Baseline agrees
3. Price is within a range of 0.2x Volatility and 1.0x Volatility of the Goldie Locks Mean
Next Candle:
1. Price retraced (Long: close < close or Short: close > close )
2. GKD-B Baseline agrees
3. GKD-C Confirmation 1 agrees
4. GKD-C Confirmation 2 agrees
5. GKD-V Volatility/Volume agrees
1-Candle Rule Baseline Entry
1. GKD-B Baseline signal
2. GKD-C Confirmation 1 agrees
3. Price is within a range of 0.2x Volatility and 1.0x Volatility of the Goldie Locks Mean
4. GKD-C Confirmation 1 signal was less than 7 candles prior
Next Candle:
1. Price retraced (Long: close < close or Short: close > close )
2. GKD-B Baseline agrees
3. GKD-C Confirmation 1 agrees
4. GKD-C Confirmation 2 agrees
5. GKD-V Volatility/Volume Agrees
PullBack Entry
1. GKD-B Baseline signal
2. GKD-C Confirmation 1 agrees
3. Price is beyond 1.0x Volatility of Baseline
Next Candle:
1. Price is within a range of 0.2x Volatility and 1.0x Volatility of the Goldie Locks Mean
3. GKD-C Confirmation 1 agrees
4. GKD-C Confirmation 2 agrees
5. GKD-V Volatility/Volume Agrees
█ GKD-C QQE of Parabolic-Weighted Velocity
What is Parabolic-Weighted Velocity?
Parabolic-Weighted Velocity (PWV) is a mathematical model used in sports science to estimate the velocity of an athlete during a given movement or exercise. This model uses a parabolic weighting function to give more importance to the velocities achieved in the middle of the movement and less importance to the velocities achieved at the beginning and end of the movement.
PWV takes into account the acceleration and deceleration of an athlete during the movement, and uses this information to calculate an average velocity. The model assumes that the athlete moves at a constant velocity during the middle portion of the movement and that the velocity increases and decreases smoothly at the beginning and end of the movement.
The parabolic weighting function used in PWV is based on the principle of impulse momentum, which states that the change in momentum of an object is equal to the impulse applied to it. The impulse is calculated as the force applied to an object multiplied by the time during which the force is applied. By giving more weight to the velocities achieved during the middle of the movement, PWV takes into account the impulse generated during this period of the movement.
PWV is commonly used in sports science to measure the performance of athletes during activities such as sprinting, jumping, and throwing. It is often used in conjunction with other metrics such as power and force to provide a comprehensive picture of an athlete's performance. Additionally, PWV can be used to compare the performance of different athletes or to track an athlete's progress over time.
Overall, Parabolic-Weighted Velocity is a useful tool in sports science for estimating an athlete's velocity during a movement or exercise, taking into account the acceleration and deceleration of the athlete during the movement.
What is QQE?
Quantitative Qualitative Estimation (QQE) is a technical analysis indicator used to identify trends and trading opportunities in financial markets. It is based on a combination of two popular technical analysis indicators - the Relative Strength Index (RSI) and Moving Averages (MA).
The QQE indicator uses a smoothed RSI to determine the trend direction, and a moving average of the smoothed RSI to identify potential trend changes. The indicator then plots a series of bands above and below the moving average to indicate overbought and oversold conditions in the market.
The QQE indicator is designed to provide traders with a reliable signal that confirms the strength of a trend or indicates a possible trend reversal. It is particularly useful for traders who are looking to trade in markets that are trending strongly, but also want to identify when a trend is losing momentum or reversing.
Traders can use QQE in a number of different ways, including as a confirmation tool for other indicators or as a standalone indicator. For example, when used in conjunction with other technical analysis tools like support and resistance levels, the QQE indicator can help traders identify key entry and exit points for their trades.
One of the main advantages of the QQE indicator is that it is designed to be more reliable than other indicators that can generate false signals. By smoothing out the price action, the QQE indicator can provide traders with more accurate and reliable signals, which can help them make more profitable trading decisions.
In conclusion, QQE is a popular technical analysis indicator that traders use to identify trends and trading opportunities in financial markets. It combines the RSI and moving average indicators and is designed to provide traders with reliable signals that confirm the strength of a trend or indicate a possible trend reversal.
What is QQE of Parabolic-Weighted Velocity?
This version is using Parabolic Weighted Velocity and it can help in determining trend. Adjust the calculating period to your trading style: longer - to trend traders, shorter - for scalping.
Requirements
Inputs
Confirmation 1 and Solo Confirmation: GKD-V Volatility / Volume indicator
Confirmation 2: GKD-C Confirmation indicator
Outputs
Confirmation 2 and Solo Confirmation Complex: GKD-E Exit indicator
Confirmation 1: GKD-C Confirmation indicator
Continuation: GKD-E Exit indicator
Solo Confirmation Simple: GKD-BT Backtest strategy
Additional features will be added in future releases.

Diddly - Real Volume TrendDiddly Real Volume Trend is an indicator to help traders identify the real trending direction of an asset, it achieves this by using liquidity to assess the overall buying and selling volume sentiment of a market place.
What is Liquidity
Liquidity refers to the ability of an asset to be turned into cash. Cash is the more liquid form of any asset, whereas selling a house would take a little longer to liquidate and convert to cash. Liquidity in financial markets is in essence based on the same principle and refers to how easily an asset can be bought and sold.
Liquidity in simple terms is the volume of participants who are willing to be involved in the market at any given time. Markets are based on auction theory, the more participants who want to buy at a certain price than sell, will dictate that the price goes up. As a result it is important to understand the role that volume has in financial markets, as volume will directly correlate to liquidity and supply and demand.
What does it mean?
Although markets are based on auction theory, sadly we don't have the advantage of a traditional auction, where we are all sitting in a room putting our hands in the air when we are interested in paying x price for a particular item. In this environment it is very clear to see how popular the item for sale is and whether it is possible to pick up a bargain.
Being able to identify the prevailing direction of buying versus selling volume on a chart provides an insight into market sentiment. Also we have to consider that typically most retail traders participate in very liquid markets, where you can get in and out of a position with relative ease.
There are obviously exceptions, extremely low float stocks, but on the whole with liquid assets it takes some big orders to move price, especially with currencies and high float stocks. Understanding these principles helps us as retail traders identify where the big money is seeing a bargain, if buying or overpriced if selling.
However you identify liquidity, I hope you agree that it is an extremely important element to be considering before taking a trade. The last thing any trader wants to be doing if they can avoid it, is getting on the wrong side of the market.
Just as a side note, high and low "Float Stocks" refers to the number of shares in general circulation for buying and selling.
What is "Diddly Real Volume Trend"
This volume trend indicator in simple terms will display the combined accumulated bullish and bearish volume within a window below the main chart. What you will see is a line chart that will be doing one of three things. Either it could be stair stepping in an upwards direction, identifying that we are in a bullish trend or stepping down in a bearish trend. Alternatively it could just be going sideways, which would suggest a ranging market.
This enables traders to make an assessment of the market sentiment using the liquidity direction that it has identified. This can help form an overall daily bias for intra-day traders or help confirm a longer term trend for swing traders.
Although this indicator is not a true oscillator (where the limits of number are fixed between a known upper and lower limit) , it can still be extremely useful in identifying divergence in price and the volume sentiment. As well as assisting in the process of identifying and confirming peak formations and potential reversal points in a market.
How does it Work
The indicator is plotting the volume trend line based on the output of a set of volume calculations, which is confirmed on the close of each candle. The resultant output is either a positive (Bullish sentiment) or negative (Bearish Sentiment), which are all totalled up to show the next point on the graph. As a result the visual effect seen from this process is that the more bullish calculated volume identified than bearish, you will see a rising trend line and the reverse for a bearish market.
The algo calculation which is used on each candle and its related volume is using the following elements.
Volume
Rate of Change
Relative Strength
The indicator is not just looking at the volume total and saying this is a green candle and must provide a positive number. It is looking for the volume and liquidity extremes and filtering out the nothingness of a market that makes no difference to price either way. It is from using these extremes that the indicator is able to plot the activities and direction of the big money in the market.
What is the Indicator Showing me?
Examples:
Here on a stock VKTX, on a 1 minute chart the elements that make up the indicator are annotated on the chart.
There are 6 components highlighted in the above chart, these have been listed below.
Volume Trend Line
This is the indicator driving line and is the result of the calculations described in the previous section.
Fast Moving Average
This is the fast moving average of the "Volume Trend Line". The moving average type and length can be changed in the settings.
(Default = Exponential Moving Average, Length: 60)
Slow Moving Average
This is a slower moving average of the "Volume Trend Line". The moving average type and length can be changed in the settings.
(Default = Hull Moving Average, Length: 3500)
Long Term Moving Average
This is a long term moving average of the "Volume Trend Line". The moving average type and length can be changed in the settings.
(Default = Exponential Moving Average, Length: 400)
Bullish Confirmation
On the "Volume Trend Line", you will see coloured circles dotted along the line, the green circles signifying Bullish Confirmation.
Bearish Confirmation
On the "Volume Trend Line", you will see coloured circles dotted along the line, the red circles signifying Bearish Confirmation.
The Bullish and Bearish confirmation signals are not signals to take trades, they are there to highlight the predominant direction. Seeing one confirmation signal in isolation is not that helpful, but continued prints of confirmation in a single direction would be interesting.
There are a further two signal types that are displayed on the volume trend line, these should be seen infrequently across charts and represent potential extremes of price movement in a single direction. These signals act as a warning that price could stall in this area or potentially make a reversal. As with the other signals within this indicator they are not signals to buy or sell, they are there to provide warning alerts and should be considered with other pieces of information that you are working with.
Bullish Extreme
Plotted on the "Volume Trend Line", you will occasionally see a green coloured downwardly pointing triangle, this represents a Bullish Extreme.
GBPAUD Hourly chart October 2022
Bearish Extreme
Plotted on the "Volume Trend Line", you will occasionally see a red coloured upward pointing triangle, this represents a Bearish Extreme.
GBPAUD Daily chart (February - April) 2023
How Does It Help?
This indicator will compliment any existing strategy and is not intended to be used standalone.
It can be used on any chart from a monthly, one minute to one second, depending on your trading strategy. Using multiple time frame analysis can help traders with a number of decisions that need to be considered before taking entries.
What is my market direction bias?
This can be taken from an hourly for intraday trader or daily for swing traders. What that time frame is depends on your trading plan and objectives from the trades you take.
When do I take my trades?
Again depending on the trading strategy used will dictate many aspect of this decision, although using the volume trend on a lower time frame, can help confirm breakouts, reversals and divergence.
How should I manage my trade?
With any trade you should have a defined risk reward clearly defined, with stops and targets in mind before taking an entry.
The age old saying of "cut your losses quickly and let your winner run", is easier said than mastered. Once in a trade the volume trend can be really helpful to identify trades that could be real runners and allows you to change expectations after entering the trade. Maybe you want to take some profit at the original point and let the remaining run. Maybe there is such strength you want to add to the position. Being able to assess market sentiment once in a trade can help with optimising returns.
The "Volume Trend Line", which is the driving element of this indicator, will be doing one of three things. Either it could be stair stepping in an upwards direction, identifying that we are in a bullish trend, stepping down in a bearish trend or going sideways in a ranging market.
Bullish Volume Trending Market
Here is stock VKTX, on a 1 minute chart. Trend confirmation on price action is determined by Higher Highs and Higher Lows for an uptrend or Lower Lows and Lower Highs on a downtrend. The same principle applies for the volume trend line.
In this example we first see breakout volume on the indicator with the Bullish Break volume, following that the volume trend keeps making higher highs and higher lows, confirming that this asset has short-term upwards potential. (why short-term? this is the 1 minute chart, you would want to consult the daily or hourly for a longer term perspective).
Price also is making higher highs and higher lows, which is in alignment with the indicator and known as "convergence" and is a positive signal for a continued trend.
Bearish Market
So here on Tesla (TSLA) on the 4 hour chart we can see the big sell off that started in April 2022. Where it clearly shows a downward trend, with lots of confirmation for continuation.
Ranging Markets
On this example on the AUDJPY 1 Hour chart, we can see that price is in a ranging market. By drawing trend lines on price and the indicator, it is clear to see that price and the volume trend line are both showing a ranging market. What is more interesting is the structure of the ranges.
The price range at the top of the chart is in an upward direction, whereas the volume trend in the bottom window is showing a downward range. Giving us an early indication of what to expect from this asset.
Diverging Markets
"Divergence" is a very powerful mechanism for identifying potential reversal points in price actions. There is a wealth of published information on this topic which is well worth reviewing, if this is a new principle to you.
Here again on the same AUDJPY 1 Hour chart example, points of interest have been annotated on the chart where the historical range turns into a step down to the next level within the market cycle, as predicted by the divergence in range patterns, price point up and volume pointing down.
In the above example, after identifying the divergence the next most important element is an extremely fast accelerated move down which breaks the lower level of the range, this can be seen on the right side of the bottom window and is labelled "Bearish Breaking Volume".
What is interesting here is that the volume indicator has identified the range breakout when price was still above the lower level of the range. Following that break out volume signal, if we zoom out to a 4 hour chart to see what happened next.
The range breakout was confirmed and price and the volume trend continues to show a downward direction in the market. As for entries and stops that is not the intention of this indicator and will be down to other elements in your trading strategy or in our case other indicators.
Peak Formations
Peak formation refers to the point where an asset is over extended in one direction and there is a potential of change in direction, with a wider pullback or a reversal in the higher time frame trend. These formations are often seen with double bottoms (W patterns) or double tops (M patterns) . Unfortunately these patterns appear all over the chart and trading them in isolation will be challenging.
In this example of EURJPY on the 1 hour chart, we see price and the indicator in the bottom window for the first 3 weeks in March 2022. The pair is trending down which is confirmed by both price and the indicator. There are no signals points plotted on the volume trend line, until one appears on March 4th 2022.
Another one appeared on the next trading day of Monday the 7th and we now have these two signals relatively close to each other. This is interesting information, especially considering that there was no extreme signals for the previous couple of months.
Later that day the volume trend broke the previous volume level, after a W pattern was completed and a green bullish confirmation signal was printed. The following day another bullish confirmation signal is displayed to further confirm that we had made a peak formation reversal.
Please note that using the settings style tab, has enabled the change to the bearish extremes signal, changing the colour and shape to be an orange circle. Which for the purposes of this illustration is easier to see.
Another example of the same pair in August 2022, with a very similar confirmation sequence.
Stock Examples
Here on UBER on a 1 hour chart , is an example of how the indicator can be used in confluence with other trading strategies. If a trader was trading candle patterns, they may see this classic 1 hour bull flag pattern forming.
Without the volume trend analysis this looks like a good buy setup. Adding this analysis to the chart we clearly have a different view point.
Here is what subsequently happened to price and this is in a generally bullish market March 2023.
Scalping Entries
For those traders who work with super fast time frames like the 5 second or even on a 1 second charts, the volume indicator can be used to help time entries as a part of a wider trading strategy of trading a pullback or trading support and resistance levels.
Styling options in the indicator settings enabled this different view of the indicator output, which can be extremely useful for timing entries.
Here on this hot IPO stock, LUNR from February 16th 2023, we have an extremely strong move up from $13.80 to $18.00. One aspect of this move up, is that it is doing this on extremely light volume and the predominant market sentiment on the surface seems very bearish.
This would be a clear indication not to trade this stock at this moment in time, as a trader there would be lots of emotions of FOMO (fear of missing out) , seeing a stock making that kind off move on a new IPO - there is the sense that this stock will go to the moon and your not going to be involved.
As traders we have to consider the risk : reward potential. This stock could drop to $10.00 if someone put in a 50 k market sell order, as it is clear there are not the buyers to support that kind of liquidation.
The following charts are in the 5 second time frame, until otherwise stated
So we need to wait for some confirmation of buying liquidity before we can make any plans for taking an entry, which we get in the form of a couple of strong bullish candles on the chart below. Interestingly the price breaks the previous all time high for this stock, although the volume trend at this stage does not seem strong enough to consider an entry.
At this point we should be on the lookout for further buying liquidity, ideally to break the previous high volume line, which appears in the next chart. This would be the time to take an entry based on other aspects of a trading plan.
Having now taken an entry, we can use the indicator to understand the strength of the buying liquidity and identify areas where we should be looking to take profit or close out the trade. Looking at the volume trend profile shown in the chart below, there is no reason not to hold this stock for a wider move up.
In the next chart we see the first signs of some selling pressure, as the indicator shows signs of red. This would be the area to take some profit and look at a higher time frame perspective, to get the sense of whether to hold the remaining position.
Here on the 5 minute time frame the volume trend is still looking very strong to hold the remaining position. As it turned out it was a good place to take profit as it was just under the high of the day.
Knowing when an asset is going to reverse is not easy and this stock was way too over extended and a top had to finally come. This one minute view of the indicator, shows the point where you would see that the upward liquidity was over and you were now on the backside of the move, with no reason to trade further.
Here on a 15 minute chart you can see the full extent of the move and its reversal back to the original price. It provides a clear illustration that chasing trades through FOMO or holding and hoping is not a profitable approach. Being able to time your entries and exits, where you can clearly manage risk is one of the most important elements to any traders strategy.
This is an extreme example and not something you see every day in any market. It has been included within this narrative with the hope that it clearly illustrates the risk involved in trading and being able to mitigate them, has to be at the forefront of your mind.
Key Settings
Within the indicator settings there are a number of options that are available to users. All aspects of what you can see can either be changed or turned on or off in the "Style" tab as well as changing the colours and their transparency.
The available settings on the "Inputs" tab are for fine tuning the indicator to your style of trading. This fine tuning can be applied to the moving averages that can be displayed and follow the volume trend line as well as the volume filtering process.
The most important ones that are in need of explanation are outline below:
General Settings
"What type of asset is the Algo looking at" : Available Options = "Small Caps", "Large Caps", "Futures", "Currencies" (Default Setting = Currencies)
The indicator will make an assessment of the best settings to use as defaults for the volume filtering, confirmation and extremes signals. The defaults can be changed in the following sections using the override.
"Turn on Turbo Mode" : True or False (Default Settings = True)
This setting will give the indicator volume filtering processes a boost
Signal Settings
Based on the "Asset Type" from the general settings, the indicator will make an assessment of the best settings to use by default. These can be changed by using the settings below.
"Override Default Assessment Thresholds" = True / False
"Percentage Difference to Signify Trend Confirmation" = A percentage value that will tell the indicator how to identify the volume trend line swing points used to identify bullish or bearish confirmation signals. Values from 0.1 to 10 would make the most sense. A too high setting and you will not see any confirmation points plotted. Too low and you may see too many to be useful.
"Percentage Difference to Signify Extremes" = A percentage value that will tell the indicator how to identify the volume trend line swing points used to identify bullish or bearish confirmation signals. Values from 20 to 200 would make the most sense. A low a setting and you will see too many extreme points plotted.
Filter Settings
"Turn On Volume Assessment Filters" = True / False : The volume assessment filters are used to focus the "volume trend line" on higher volume extremes.
Based on the "Asset Type" from the general settings, the indicator will make an assessment of the best settings to use by default. These can be changed by using the settings below.
"Override Default Assessment Filters" = True / False
"Filter Volume using Setting" = The number used in this setting represents a value from 0 to 100. Zero will filter out no volume, whereas 100 would filter it all out. The default setting is 1, as there is a danger of setting this number too high and all you will see in the line chart is big steps up and down, with a plateaus in the middle. Which may be useful, although it would not be so helpful in divergence or volume line breaks.
Fast Moving Average
This is the fast moving average of the "Volume Trend Line".
"Moving Average Type" = The type of moving average calculation to be applied.
Default = "EMA"
Available Options: "SMA","EMA" ,"HMA" ,"SMMA (RMA)" ,"WMA" ,"VWMA"
Moving Average Key
SMA : Simple Moving Average
EMA : Exponential Moving Average
HMA : Hull Moving Average
SMMA (RMA) : Exponentially Weighted Moving Average (alpha = 1 / length.)
WMA : Weighted Moving Average
VWMA : Volume Weighted Moving Average
"Moving Average Length" = The number of candles back into the chart used to calculate the Moving Average. (The higher the number, the slower the moving average becomes)
Default Length = 60
"Apply Double Smoothing" = True or False : This is an option to turn on if an extra smoothing effect to the moving average if required.
Slow Moving Average
This is the slow moving average of the "Volume Trend Line".
"Moving Average Type" = The type of moving average calculation to be applied.
Default = "HMA"
Available Options: "SMA","EMA" ,"HMA" ,"SMMA (RMA)" ,"WMA" ,"VWMA"
(See moving average key)
"Moving Average Length" = The number of candles back into the chart used to calculate the Moving Average. (The higher the number, the slower the moving average becomes)
Default Length = 3500
(By default we have a higher number for the slow length compared to the long term length in the next setting. This is because using the Hull Moving Average, is an accelerated moving average that needs higher values to slow it down. If you were to change this to say an EMA, then you would need to change the length to something like 200, to put this slower moving average in context with the others).
Long Term Moving Average
This is a long term moving average of the "Volume Trend Line".
"Moving Average Type" = The type of moving average calculation to be applied.
Default = "EMA"
Available Options: "SMA","EMA" ,"HMA" ,"SMMA (RMA)" ,"WMA" ,"VWMA"
(See moving average key)
"Moving Average Length" = The number of candles back into the chart used to calculate the Moving Average. (The higher the number, the slower the moving average becomes)
Default Length = 400
"Apply Double Smoothing" = True or False : This is an option to turn on if an extra smoothing effect to the moving average if required.
Finally
We greatly appreciate the support and feedback from the Trading View community, and we are dedicated to continuing to improve our indicators with your support.
We want to help you manage risk, and that's why we emphasise that trading is risky and any technology used to support our trading decisions is based on information from the past. We encourage traders to take responsibility for their trading businesses and always prioritise risk management.

Impulse Momentum MACD - Slow and FastImpulse Momentum MACD - Slow and Fast
The Momentum indicator is a technical indicator that measures the speed and strength of the price movement of a financial asset. This indicator is used to identify the underlying strength of a trend and predict potential changes in price direction, when the indicator crosses the zero line, it can signal a change of direction in the price trend.
On the other hand, the MACD is an indicator used to identify the trend and strength of the market and shows the difference between two exponential moving averages ( EMA ) of different periods. The MACD is commonly used to determine the direction of an asset's price trend.
COPOSITION AND USE OF THE INDICATOR
This script is an implementation of the Impulse Momentum MACD indicator with two variations: slow and fast. It uses a combination of the Momentum indicator and the Moving Average Convergence/Divergence (MACD) indicator to identify trend reversals and momentum changes in an asset's price.
The combination of both indicators can help traders identify market entry and exit opportunities. The Impulse Momentum MACD is a Modified MACD, it is formed by filtering the values in a range of Modifiable Moving Averages by calculating their high and low ranges,This indicator has two parts: a slow part and a fast part. The slow part uses input values for the lengths of the moving averages and the length of the signal for the MACD indicator. The fast part uses different input values for the lengths of the moving averages. Also, each part has its own set of line colors and histogram colors for easy visualization.
The script also includes inputs to choose the type of moving average to use (SMA, EMA, etc.), the lookback period, the colors for the histogram lines and bars, and a zero trend line (also known as a horizontal trend line). ).
* Highest performing custom settings for the zero trend line. For Operations of:
- One Minute: Trend Line Time Frame = Five Minutes.
- Three Minutes: Trend Line Time Frame = Fifteen Minutes.
- Five Minutes: Trend Line Time Frame = Thirty Minutes.
- Fifteen Minutes: Trend Line Time Frame = Sixty Minutes.
Rules For Trading
🔹 Bullish:
* The Zero Horizontal Trend Line should be in Green Color.
* The Slow Histogram Bar should be in Green Color.
* The Fast Histogram Bar must be in Blue or Black Color or No Bar Appears.
* The Momentum Line or Momentum Area must be in Green Color.
crosses:
- When the Impulse Momentum MACD Slow line crosses the Impulse Momentum MACD Slow signal line upwards.
- When the Impulse Momentum MACD Fast line crosses the Impulse Momentum MACD Fast signal line upwards.
- Note 1: A Position is Opened when the condition of any of the aforementioned crossovers is met.
- Note 2: If the two aforementioned crossings anticipate the condition of the Zero Horizontal Tendency Line because it is in Red; A position is only opened immediately when the Zero Horizontal Trend line turns Green.
🔹 Bearish:
* The Zero Horizontal Trend Line should be in Red Color.
* The Slow Histogram Bar should be in Red Color.
* The Fast Histogram Bar must be in Blue or Black Color or No Bar Appears.
* The Momentum Line or Momentum Area must be in Red Color.
crosses:
- When the Impulse Momentum MACD Slow line crosses the Impulse Momentum MACD Slow signal line downwards.
- When the Impulse Momentum MACD Fast line crosses the Impulse Momentum MACD Fast signal line downwards.
- Note 1: A Position is Opened when the condition of any of the aforementioned crossovers is met.
- Note 2: If the two aforementioned crossings anticipate the condition of the Zero Horizontal Tendency Line because it is Green, an immediate position is only opened when the Zero Horizontal Tendency line turns Red.
This script can be used in different markets such as forex, indices and cryptocurrencies for analysis and trading. However, it is important to note that no trading strategy is guaranteed to be profitable, and traders should always conduct their own research and risk management.
RS - Relative Strength ScoreRelative strength (RS) is a measure of a stock's price performance relative to the overall market. It is calculated by dividing the stock's price change over a specified period by the market's price change over the same period. A stock with a high RS has outperformed the market, while a stock with a low RS has underperformed. (Stock can any asset that can be compared to a reference index like as Bitcoin, Altcoins etc ...)
Here are some advantages:
- Provides a measure of a stock's performance relative to a benchmark index or sector, allowing for a more accurate comparison of performance.
- Helps identify stocks with strong price momentum that are likely to continue outperforming the market in the short to medium term.
- Allows investors to identify the strongest performers within a particular sector or industry.
- Provides a quantitative and objective measure of a stock's performance, which can help reduce bias in investment decisions.
- Can be used in conjunction with other technical indicators and chart analysis to identify potentially profitable trades.
- Helps investors make more informed decisions by providing a more comprehensive picture of a stock's performance.
How to use it:
- The indicator can be used in daily and weekly timeframes.
- Check, if the default reference index is suited for your asset (Settings) The default is the combination of S&P500+Nasdaq+Dow Jones. For Crypto, it could be TOTAL (ticker for total stock market), for German stocks it could be DAX.
- Decide (settings), if you want to see the RS based on annual calculation (IBD style) or based only for the last quarter
Color coding:
- Red: Stock is performing worse than index (RS < 0)
- Yellow: Stock get momentum, starting to perform better than index (RS > 0)
- Green: Stock is outperforming the index
- Blue: Stock is a shooting star compared to index
- When RS turns positive and stays there, it could be an indication for an outbreak (maybe into a stage 2)
No financial advise. For education purposes only.
Day of Week - Volatility Report█ OVERVIEW
The indicator analyses the volatility and reports statistics by the days of the week.
█ CONCEPTS
On business days and weekends, different market participants get involved in the markets. How does this affect the markets during the week?
Here are some ideas to explore:
When are the best days for trading?
Which day of the week is the market the most volatile?
Should you trade on business days? Is it worth trading during the weekend?
How does this relate to your most profitable trades?
Is there a confluence with the days having the highest win rate?
Which days of the week should you stop trading?
Ethereum
USDCAD
NZDUSD
█ FEATURES
Configurable outputs
Output the report statistics as mean or median.
█ HOW TO USE
Plot the indicator and visit the 1D, 24H, or 1440 minutes timeframe.
█ NOTES
Gaps
The indicator includes the volatility from gaps.
Calculation
The statistics are not reported from absolute prices (does not favor trending markets) nor percentage prices (does not depict the different periods of volatility that markets can go through). Instead, the script uses the prices relative to the average range of previous weeks (weekly ATR).
Trading session
The indicator analyses weekdays from the daily chart, defined by the exchange trading session (see Symbol Info).
Extended trading session
The indicator can include the extended hours when activated on the chart, using the 24H or 1440 minutes timeframe.
Overnight session
The indicator supports overnight sessions (open and close on different calendar days). For example, EURUSD will report Monday’s volatility from Sunday open at 17:00 to Monday close at 17:00.
This is a PREMIUM indicator. In complement, you might find useful my free Time of Day - Volatility Report .

GKD-C Fast Discrete Cosine Transform of Price [Loxx]Giga Kaleidoscope GKD-C Fast Discrete Cosine Transform of Price is a Confirmation module included in Loxx's "Giga Kaleidoscope Modularized Trading System".
█ Giga Kaleidoscope Modularized Trading System
What is Loxx's "Giga Kaleidoscope Modularized Trading System"?
The Giga Kaleidoscope Modularized Trading System is a trading system built on the philosophy of the NNFX (No Nonsense Forex) algorithmic trading.
What is the NNFX algorithmic trading strategy?
The NNFX (No-Nonsense Forex) trading system is a comprehensive approach to Forex trading that is designed to simplify the process and remove the confusion and complexity that often surrounds trading. The system was developed by a Forex trader who goes by the pseudonym "VP" and has gained a significant following in the Forex community.
The NNFX trading system is based on a set of rules and guidelines that help traders make objective and informed decisions. These rules cover all aspects of trading, including market analysis, trade entry, stop loss placement, and trade management.
Here are the main components of the NNFX trading system:
1. Trading Philosophy: The NNFX trading system is based on the idea that successful trading requires a comprehensive understanding of the market, objective analysis, and strict risk management. The system aims to remove subjective elements from trading and focuses on objective rules and guidelines.
2. Technical Analysis: The NNFX trading system relies heavily on technical analysis and uses a range of indicators to identify high-probability trading opportunities. The system uses a combination of trend-following and mean-reverting strategies to identify trades.
3. Market Structure: The NNFX trading system emphasizes the importance of understanding the market structure, including price action, support and resistance levels, and market cycles. The system uses a range of tools to identify the market structure, including trend lines, channels, and moving averages.
4. Trade Entry: The NNFX trading system has strict rules for trade entry. The system uses a combination of technical indicators to identify high-probability trades, and traders must meet specific criteria to enter a trade.
5. Stop Loss Placement: The NNFX trading system places a significant emphasis on risk management and requires traders to place a stop loss order on every trade. The system uses a combination of technical analysis and market structure to determine the appropriate stop loss level.
6. Trade Management: The NNFX trading system has specific rules for managing open trades. The system aims to minimize risk and maximize profit by using a combination of trailing stops, take profit levels, and position sizing.
Overall, the NNFX trading system is designed to be a straightforward and easy-to-follow approach to Forex trading that can be applied by traders of all skill levels.
Core components of an NNFX algorithmic trading strategy
The NNFX algorithm is built on the principles of trend, momentum, and volatility. There are six core components in the NNFX trading algorithm:
1. Volatility - price volatility; e.g., Average True Range, True Range Double, Close-to-Close, etc.
2. Baseline - a moving average to identify price trend
3. Confirmation 1 - a technical indicator used to identify trends
4. Confirmation 2 - a technical indicator used to identify trends
5. Continuation - a technical indicator used to identify trends
6. Volatility/Volume - a technical indicator used to identify volatility/volume breakouts/breakdown
7. Exit - a technical indicator used to determine when a trend is exhausted
What is Volatility in the NNFX trading system?
In the NNFX (No Nonsense Forex) trading system, ATR (Average True Range) is typically used to measure the volatility of an asset. It is used as a part of the system to help determine the appropriate stop loss and take profit levels for a trade. ATR is calculated by taking the average of the true range values over a specified period.
True range is calculated as the maximum of the following values:
-Current high minus the current low
-Absolute value of the current high minus the previous close
-Absolute value of the current low minus the previous close
ATR is a dynamic indicator that changes with changes in volatility. As volatility increases, the value of ATR increases, and as volatility decreases, the value of ATR decreases. By using ATR in NNFX system, traders can adjust their stop loss and take profit levels according to the volatility of the asset being traded. This helps to ensure that the trade is given enough room to move, while also minimizing potential losses.
Other types of volatility include True Range Double (TRD), Close-to-Close, and Garman-Klass
What is a Baseline indicator?
The baseline is essentially a moving average, and is used to determine the overall direction of the market.
The baseline in the NNFX system is used to filter out trades that are not in line with the long-term trend of the market. The baseline is plotted on the chart along with other indicators, such as the Moving Average (MA), the Relative Strength Index (RSI), and the Average True Range (ATR).
Trades are only taken when the price is in the same direction as the baseline. For example, if the baseline is sloping upwards, only long trades are taken, and if the baseline is sloping downwards, only short trades are taken. This approach helps to ensure that trades are in line with the overall trend of the market, and reduces the risk of entering trades that are likely to fail.
By using a baseline in the NNFX system, traders can have a clear reference point for determining the overall trend of the market, and can make more informed trading decisions. The baseline helps to filter out noise and false signals, and ensures that trades are taken in the direction of the long-term trend.
What is a Confirmation indicator?
Confirmation indicators are technical indicators that are used to confirm the signals generated by primary indicators. Primary indicators are the core indicators used in the NNFX system, such as the Average True Range (ATR), the Moving Average (MA), and the Relative Strength Index (RSI).
The purpose of the confirmation indicators is to reduce false signals and improve the accuracy of the trading system. They are designed to confirm the signals generated by the primary indicators by providing additional information about the strength and direction of the trend.
Some examples of confirmation indicators that may be used in the NNFX system include the Bollinger Bands, the MACD (Moving Average Convergence Divergence), and the Stochastic Oscillator. These indicators can provide information about the volatility, momentum, and trend strength of the market, and can be used to confirm the signals generated by the primary indicators.
In the NNFX system, confirmation indicators are used in combination with primary indicators and other filters to create a trading system that is robust and reliable. By using multiple indicators to confirm trading signals, the system aims to reduce the risk of false signals and improve the overall profitability of the trades.
What is a Continuation indicator?
In the NNFX (No Nonsense Forex) trading system, a continuation indicator is a technical indicator that is used to confirm a current trend and predict that the trend is likely to continue in the same direction. A continuation indicator is typically used in conjunction with other indicators in the system, such as a baseline indicator, to provide a comprehensive trading strategy.
What is a Volatility/Volume indicator?
Volume indicators, such as the On Balance Volume (OBV), the Chaikin Money Flow (CMF), or the Volume Price Trend (VPT), are used to measure the amount of buying and selling activity in a market. They are based on the trading volume of the market, and can provide information about the strength of the trend. In the NNFX system, volume indicators are used to confirm trading signals generated by the Moving Average and the Relative Strength Index. Volatility indicators include Average Direction Index, Waddah Attar, and Volatility Ratio. In the NNFX trading system, volatility is a proxy for volume and vice versa.
By using volume indicators as confirmation tools, the NNFX trading system aims to reduce the risk of false signals and improve the overall profitability of trades. These indicators can provide additional information about the market that is not captured by the primary indicators, and can help traders to make more informed trading decisions. In addition, volume indicators can be used to identify potential changes in market trends and to confirm the strength of price movements.
What is an Exit indicator?
The exit indicator is used in conjunction with other indicators in the system, such as the Moving Average (MA), the Relative Strength Index (RSI), and the Average True Range (ATR), to provide a comprehensive trading strategy.
The exit indicator in the NNFX system can be any technical indicator that is deemed effective at identifying optimal exit points. Examples of exit indicators that are commonly used include the Parabolic SAR, the Average Directional Index (ADX), and the Chandelier Exit.
The purpose of the exit indicator is to identify when a trend is likely to reverse or when the market conditions have changed, signaling the need to exit a trade. By using an exit indicator, traders can manage their risk and prevent significant losses.
In the NNFX system, the exit indicator is used in conjunction with a stop loss and a take profit order to maximize profits and minimize losses. The stop loss order is used to limit the amount of loss that can be incurred if the trade goes against the trader, while the take profit order is used to lock in profits when the trade is moving in the trader's favor.
Overall, the use of an exit indicator in the NNFX trading system is an important component of a comprehensive trading strategy. It allows traders to manage their risk effectively and improve the profitability of their trades by exiting at the right time.
How does Loxx's GKD (Giga Kaleidoscope Modularized Trading System) implement the NNFX algorithm outlined above?
Loxx's GKD v1.0 system has five types of modules (indicators/strategies). These modules are:
1. GKD-BT - Backtesting module (Volatility, Number 1 in the NNFX algorithm)
2. GKD-B - Baseline module (Baseline and Volatility/Volume, Numbers 1 and 2 in the NNFX algorithm)
3. GKD-C - Confirmation 1/2 and Continuation module (Confirmation 1/2 and Continuation, Numbers 3, 4, and 5 in the NNFX algorithm)
4. GKD-V - Volatility/Volume module (Confirmation 1/2, Number 6 in the NNFX algorithm)
5. GKD-E - Exit module (Exit, Number 7 in the NNFX algorithm)
(additional module types will added in future releases)
Each module interacts with every module by passing data between modules. Data is passed between each module as described below:
GKD-B => GKD-V => GKD-C(1) => GKD-C(2) => GKD-C(Continuation) => GKD-E => GKD-BT
That is, the Baseline indicator passes its data to Volatility/Volume. The Volatility/Volume indicator passes its values to the Confirmation 1 indicator. The Confirmation 1 indicator passes its values to the Confirmation 2 indicator. The Confirmation 2 indicator passes its values to the Continuation indicator. The Continuation indicator passes its values to the Exit indicator, and finally, the Exit indicator passes its values to the Backtest strategy.
This chaining of indicators requires that each module conform to Loxx's GKD protocol, therefore allowing for the testing of every possible combination of technical indicators that make up the six components of the NNFX algorithm.
What does the application of the GKD trading system look like?
Example trading system:
Backtest: Strategy with 1-3 take profits, trailing stop loss, multiple types of PnL volatility, and 2 backtesting styles
Baseline: Hull Moving Average
Volatility/Volume: Hurst Exponent
Confirmation 1: Fast Discrete Cosine Transform of Price as shown on the chart above
Confirmation 2: Williams Percent Range
Continuation: Fisher Transform
Exit: Rex Oscillator
Each GKD indicator is denoted with a module identifier of either: GKD-BT, GKD-B, GKD-C, GKD-V, or GKD-E. This allows traders to understand to which module each indicator belongs and where each indicator fits into the GKD protocol chain.
Giga Kaleidoscope Modularized Trading System Signals (based on the NNFX algorithm)
Standard Entry
1. GKD-C Confirmation 1 Signal
2. GKD-B Baseline agrees
3. Price is within a range of 0.2x Volatility and 1.0x Volatility of the Goldie Locks Mean
4. GKD-C Confirmation 2 agrees
5. GKD-V Volatility/Volume agrees
Baseline Entry
1. GKD-B Baseline signal
2. GKD-C Confirmation 1 agrees
3. Price is within a range of 0.2x Volatility and 1.0x Volatility of the Goldie Locks Mean
4. GKD-C Confirmation 2 agrees
5. GKD-V Volatility/Volume agrees
6. GKD-C Confirmation 1 signal was less than 7 candles prior
Continuation Entry
1. Standard Entry, Baseline Entry, or Pullback; entry triggered previously
2. GKD-B Baseline hasn't crossed since entry signal trigger
3. GKD-C Confirmation Continuation Indicator signals
4. GKD-C Confirmation 1 agrees
5. GKD-B Baseline agrees
6. GKD-C Confirmation 2 agrees
1-Candle Rule Standard Entry
1. GKD-C Confirmation 1 signal
2. GKD-B Baseline agrees
3. Price is within a range of 0.2x Volatility and 1.0x Volatility of the Goldie Locks Mean
Next Candle:
1. Price retraced (Long: close < close or Short: close > close )
2. GKD-B Baseline agrees
3. GKD-C Confirmation 1 agrees
4. GKD-C Confirmation 2 agrees
5. GKD-V Volatility/Volume agrees
1-Candle Rule Baseline Entry
1. GKD-B Baseline signal
2. GKD-C Confirmation 1 agrees
3. Price is within a range of 0.2x Volatility and 1.0x Volatility of the Goldie Locks Mean
4. GKD-C Confirmation 1 signal was less than 7 candles prior
Next Candle:
1. Price retraced (Long: close < close or Short: close > close )
2. GKD-B Baseline agrees
3. GKD-C Confirmation 1 agrees
4. GKD-C Confirmation 2 agrees
5. GKD-V Volatility/Volume Agrees
PullBack Entry
1. GKD-B Baseline signal
2. GKD-C Confirmation 1 agrees
3. Price is beyond 1.0x Volatility of Baseline
Next Candle:
1. Price is within a range of 0.2x Volatility and 1.0x Volatility of the Goldie Locks Mean
3. GKD-C Confirmation 1 agrees
4. GKD-C Confirmation 2 agrees
5. GKD-V Volatility/Volume Agrees
█ GKD-C Fast Discrete Cosine Transform of Price
What is Fast Discrete Cosine Transform?
What is the Fast Discrete Cosine Transform?
Algolib is a C++ library for algorithmic trading that provides various algorithms for processing and analyzing financial data. The library includes a Fast Discrete Cosine Transform (FDCT) implementation, which is a fast version of the Discrete Cosine Transform (DCT) algorithm used for signal processing and data compression.
The FDCT implementation in Algolib is based on the FFT (Fast Fourier Transform) algorithm, which is a widely used method for computing the DCT. The implementation is optimized for performance and can handle large datasets efficiently. It uses the standard divide-and-conquer approach to compute the DCT recursively and combines the resulting coefficients to obtain the final DCT of the input signal.
The input to the FDCT algorithm in Algolib is a one-dimensional array of real numbers, which represents a time series or a financial signal. The algorithm then computes the DCT of the input sequence and returns a one-dimensional array of DCT coefficients, which represent the frequency components of the signal.
The implementation of the FDCT algorithm in Algolib uses C++ templates to provide a generic implementation that can work with different data types. It also includes various optimizations, such as loop unrolling, to improve the performance of the algorithm.
The steps involved in the FDCT algorithm in Algolib are:
-Divide the input sequence into even and odd parts.
-Compute the DCT of the even and odd parts recursively.
-Combine the DCT coefficients of the even and odd parts to obtain the final DCT coefficients.
-The implementation of the FDCT algorithm in Algolib uses the FFTW (Fastest Fourier Transform in the West) library to perform the FFT computations, which is a highly optimized library for computing Fourier transforms.
In summary, the Fast Discrete Cosine Transform implementation in Algolib is a fast and efficient implementation of the DCT algorithm, which is used for processing financial signals and time series data. The implementation is optimized for performance and uses the FFT algorithm for fast computation. The implementation is generic and can work with different data types, and includes optimizations such as loop unrolling to improve the performance of the algorithm.
What is the Fast Discrete Cosine Transform in terms of Forex trading?
The Fast Discrete Cosine Transform (FDCT) is an algorithm used for signal processing and data compression that can also be applied in trading forex. The FDCT is used to transform financial data into a set of coefficients that represent the data in terms of cosine functions of different frequencies. These coefficients can be used to analyze the frequency components of financial signals and to develop trading strategies based on these components.
In trading forex, the FDCT can be applied to various financial signals, such as price data, volume data, and technical indicators. By applying the FDCT to these signals, traders can identify the dominant frequency components of the signals and use this information to develop trading strategies.
For example, traders can use the FDCT to identify cycles in the market and use this information to develop trend-following strategies. The FDCT can also be used to identify short-term fluctuations in the market and develop mean-reversion strategies based on these fluctuations.
The FDCT can also be used in combination with other technical analysis tools, such as moving averages, to improve the accuracy of trading signals. For example, traders can apply the FDCT to the moving average of a financial signal to identify the dominant frequency components of the moving average and use this information to develop trading signals.
The FDCT can also be used in conjunction with machine learning algorithms to develop predictive models for financial markets. By applying the FDCT to financial data and using the resulting coefficients as inputs to a machine learning algorithm, traders can develop models that predict future price movements and identify profitable trading opportunities.
In summary, the FDCT can be applied in trading forex to analyze the frequency components of financial signals and develop trading strategies based on these components. The FDCT can be used in conjunction with other technical analysis tools and machine learning algorithms to improve the accuracy of trading signals and develop predictive models for financial markets.
This indicator has period lengths that are powers of powers of 2. There is also a features to increase the resolution of the FDCT.
Requirements
Inputs
Confirmation 1 and Solo Confirmation: GKD-V Volatility / Volume indicator
Confirmation 2: GKD-C Confirmation indicator
Outputs
Confirmation 2 and Solo Confirmation Complex: GKD-E Exit indicator
Confirmation 1: GKD-C Confirmation indicator
Continuation: GKD-E Exit indicator
Solo Confirmation Simple: GKD-BT Backtest strategy
Additional features will be added in future releases.

[JL] Control Your Emotions ReminderThe " Control Your Emotions Reminder" script is a valuable tool for traders, helping them to monitor and manage their emotions during trading. By showcasing a list of typical emotions on the chart, this script aims to increase awareness of the emotional traps that can adversely affect trading outcomes. Traders can utilize this reminder to stay focused and maintain discipline while making trading decisions.
Features:
Presents a checklist of 10 prevalent emotions that traders should address, including fear, greed, anxiety, frustration, overconfidence, euphoria, regret, envy, impatience, and boredom.
Enables users to customize the notification, label position, color, and distance from the current bar.
Designed to enhance trading performance by fostering emotional awareness and discipline.
While trading, it is crucial to manage your emotions to make well-informed and rational decisions. The following emotions are important to control during trading:
Fear: Fear may lead to premature trade exits or prevent entry into potentially profitable trades.
Greed: Greed can result in overtrading, holding positions for too long, or taking excessive risks.
Anxiety: Anxiety can cause impulsive decision-making, impacting your ability to analyze and execute trades effectively.
Frustration: Frustration may result in revenge trading or making impulsive decisions to recover losses rapidly.
Overconfidence: Overconfidence can lead to excessive risk-taking or failure to follow your trading plan.
Euphoria: Euphoria may cause you to overlook risks, resulting in potential losses when market conditions shift.
Regret: Regret can prompt emotional decision-making, such as pursuing missed opportunities or clinging to losing positions.
Envy: Envy may encourage you to mimic other traders without conducting your own analysis, leading to potentially unsound decisions.
Impatience: Impatience can result in hasty decision-making, entering trades too early, or exiting prematurely.
Boredom: Boredom can cause overtrading, entering trades without adequate analysis, or disregarding your trading plan.
Feel free to modify the text as needed.
How to use:
Add the script to your chart.
Adjust the label position, color, and distance from the current bar as desired.
Use the displayed checklist as a reminder to manage your emotions during trading.
By utilizing the " Control Your Emotions Reminder" script, traders can enhance their trading performance by becoming more aware of their emotions and maintaining discipline in their decision-making process. This can contribute to improved risk management, adherence to trading plans, and more informed trading decisions overall.

Multiple Standard MomentumMultiple Standard Momentum
The momentum indicator is a technical indicator that measures the speed and strength of the price movement of a financial asset. This indicator is used to identify the underlying strength of a trend and predict potential changes in price direction.
The calculation of the momentum indicator is based on the difference between the current price and the price of a previous period. The result is displayed on a chart, which can be positive or negative, depending on whether the current price is higher or lower than the price of the previous period. The indicator can be used on any time frame, but is generally used on short-term charts.
To use the momentum indicator , you look for two types of signals:
🔹 Crossover Signal – When the indicator crosses the zero line, it can signal a change of direction in the price trend.
🔹 Divergence – When the asset price moves in one direction and the indicator moves in the opposite direction, a divergence can be identified. This divergence may indicate a possible trend reversal.
COMPOSITION AND MODE OF USE OF THE INDICATOR
🔹 This indicator displays multiple Momentum levels on a single chart, allowing you to view multiple Momentum lines. Each level is represented on the chart where it can be hidden or shown as desired for better market analysis.
🔹 In addition, a zero trend line (also known as a horizontal trend line) has been added. The zero trend line is a horizontal line that indicates the point at which the current price equals the opening price, which allows users to draw a custom zero trend line on the chart using different colors and time periods of calculation.
* Highest performing custom setup for the Zero Trend Line. For Operations of:
- One Minute: Trend Line Time Frame = Five Minutes.
- Three Minutes: Trend Line Time Frame = Fifteen Minutes.
- Five Minutes: Trend Line Time Frame = Thirty Minutes.
- Fifteen Minutes: Trend Line Time Frame = Sixty Minutes.
Rules For Trading
🔹 Bullish:
* The Zero Trend Line must be in Green Color.
* When the Momentum Line Crosses the Zero Line from Bottom to Top.
🔹 Bearish:
* The Zero Trend Line must be in Red Color.
* When the Momentum Line Crosses the Zero Line from Top to Bottom.
In addition, parameters were defined to activate or deactivate the graphic signal taking into account the previous requirement (Bullish and Bearish):
🔹 Long or Buy = ▲
🔹 Short or Sell = ▼
This script can be used in different markets such as forex, indices, and cryptocurrencies for analysis and trading. However, it is important to note that no trading strategy is guaranteed to be profitable, and traders should always conduct their own research and risk management.
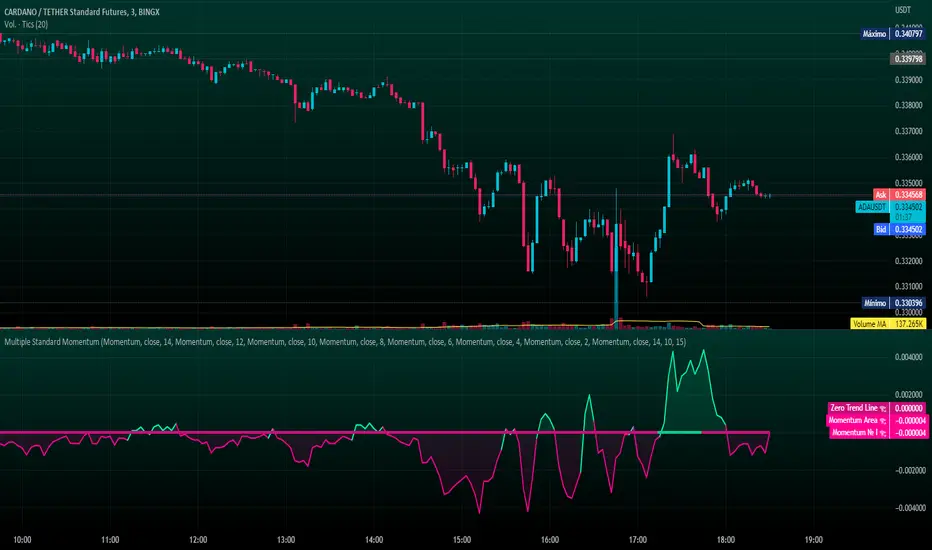
Stochastic MACD - Slow and FastStochastic MACD - Slow and Fast
The "Stochastic MACD - Slow and Fast" indicator combines two popular technical indicators, the Stochastic Oscillator and the Moving Average Convergence Divergence ( MACD ).
The Stochastic Oscillator is a momentum indicator that measures the current closing position of an asset relative to its recent price range. This indicator helps traders identify possible turning points in an asset's trend, it is used to identify if the market is overbought or oversold.
On the other hand, the MACD is an indicator used to identify the trend and strength of the market and shows the difference between two exponential moving averages ( EMA ) of different periods. The MACD is commonly used to determine the direction of an asset's price trend.
The combination of both indicators can help traders identify market entry and exit opportunities. This indicator has two parts: a slow part and a fast part. The slow part uses input values for the lengths of the moving averages and the length of the signal for the MACD indicator. The fast part uses different input values for the lengths of the moving averages. Also, each part has its own set of line colors and histogram colors for easy visualization.
In general, the "Stochastic MACD - Slow and Fast" indicator is used to identify possible turning points in the trend of an asset. Traders can use the indicator to determine when to enter or exit a position based on the signals generated by the indicator. The stochastic MACD is a variation of the regular MACD that incorporates a stochastic oscillator to provide additional signals.
In summary, this indicator can be useful for those looking for a combination of two popular indicators to help identify trading opportunities.
In addition, parameters were defined to activate or deactivate the graphic signal.
When the Stochastic MACD Slow Line Crosses the Stochastic MACD Slow Signal Line:
Long or Buy = ↑ // The Entry is more Effective if it is made when the signal is below the Zero Trend Line .
Short or Sell = ↓ // The Entry is more Effective if it is made when the signal is above the Zero Trend Line .
When the Fast Stochastic MACD Line Crosses the Slow Stochastic MACD Line:
Long or Buy = ▲ // The Entry is more Effective if it is made when the signal is below the Zero Trend Line .
Short or Sell = ▼ // The Entry is more Effective if it is made when the signal is above the Zero Trend Line .
Taking into account the above, alerts were also defined for possible Purchases or Sales or entries in Long or Short.
COPOSITION AND USE OF THE INDICATOR
This script is an implementation of the Stochastic MACD indicator with two variations - Slow and Fast. It uses a combination of the Stochastic Oscillator and the Moving Average Convergence Divergence (MACD) indicator to identify trend reversals and momentum shifts in the price of an asset.
The Slow version of the Stochastic MACD is built using three inputs - fastLength, slowLength, and signalLength. The fastLength and slowLength are used to calculate two exponential moving averages (EMAs), while the signalLength is used to calculate a signal line as an EMA of the difference between the two EMAs. The Stochastic Oscillator is then applied to the difference between the two EMAs, and the resulting values are plotted on the chart.
The Fast version of the Stochastic MACD is built using the same inputs as the Slow version, but with different values. It uses a shorter fastLength value and a longer slowLength value to generate the two EMAs, and the resulting values are plotted on the chart.
The script also includes inputs for choosing the type of moving average to use (SMA, EMA, etc.), the source of price data (open, close, etc.), the lookback period, and the colors for the lines and histogram bars.
This script can be used in different markets such as forex, indices, and cryptocurrencies for analysis and trading. However, it is important to note that no trading strategy is guaranteed to be profitable, and traders should always conduct their own research and risk management.

Flat Market and Low ADX Indicator [CHE]Why use the Flat Market and Low ADX Indicator ?
Flat markets, where prices remain within a narrow range for an extended period, can be both critical and dangerous for traders. In a flat market, the price action becomes less predictable, and traders may struggle to find profitable trading opportunities. As a result, many traders may decide to take a break from the market until a clear trend emerges.
However, flat markets can also be dangerous for traders who continue to trade despite the lack of clear trends. In the absence of a clear direction, traders may be tempted to take larger risks or make impulsive trades in an attempt to capture small profits. Such behavior can quickly lead to significant losses, especially if the market suddenly breaks out of its flat range, causing traders to experience large drawdowns.
Therefore, it is essential to approach flat markets with caution and to have a clear trading plan that incorporates strategies for both trending and flat markets. Traders may also use technical indicators, such as the Flat Market and Low ADX Indicator, to help identify flat markets and determine when it is appropriate to enter or exit a position.
The confluence between flat markets and low ADX readings can further increase the risk of trading during these periods. The ADX (Average Directional Index) is a technical indicator used to measure the strength of a trend. A low ADX reading indicates that the market is in a consolidation phase, which can coincide with a flat market. When a flat market occurs during a period of low ADX, traders should be even more cautious, as there is little to no directional bias in the market. In this situation, traders may want to consider waiting for a clear trend to emerge or using range-bound trading strategies to avoid taking excessive risks.
Introduction:
Pine Script is a programming language used for developing custom technical analysis indicators and trading strategies in TradingView. This particular script is an indicator designed to identify flat markets and low ADX conditions. In this description, we will delve deeper into the functionality of this script and how it can be used to improve trading decisions.
Description:
The first input in the script is the length of the moving average used for calculating the center line. This moving average is used to define the high and low range of the market. The script then calculates the middle value of the range by taking the double exponential moving average (EMA) of the high, low, and close prices.
The script then determines whether the market is flat by comparing the middle value of the range with the high and low values. If the middle value is greater than the high value or less than the low value, the market is not flat. If the middle value is within the high and low range, the script considers the market to be flat. The script also uses RSI filter settings to further confirm if the market is flat or not. If the RSI value is between the RSI min and max values, then the market is considered flat. If the RSI value is outside this range, the market is not considered flat.
The script also calculates the ADX (Average Directional Index) to determine whether it's in a low area. ADX is a technical indicator used to measure the strength of a trend. The script uses the ADX filter settings to define the ADX threshold value. If the ADX value is below the threshold value, the script considers the market to be in a low ADX area.
The script provides various input options to customize the display settings, including the option to show the flat market and low ADX areas. Users can choose their preferred colors for the flat market and low ADX areas and adjust the transparency levels to suit their needs.
Conclusion:
In conclusion, this Pine Script indicator is designed to identify flat market and low ADX conditions, which can help traders make informed trading decisions. The script uses a range of inputs and calculations to determine the market direction, RSI filter, and ADX filter. By customizing the display settings, users can adjust the indicator to suit their preferences and improve their trading strategies. Overall, this script can be a valuable tool for traders looking to gain an edge in the markets.
Acknowledgments:
Thanks to the Pine Script™ v5 User Manual www.tradingview.com
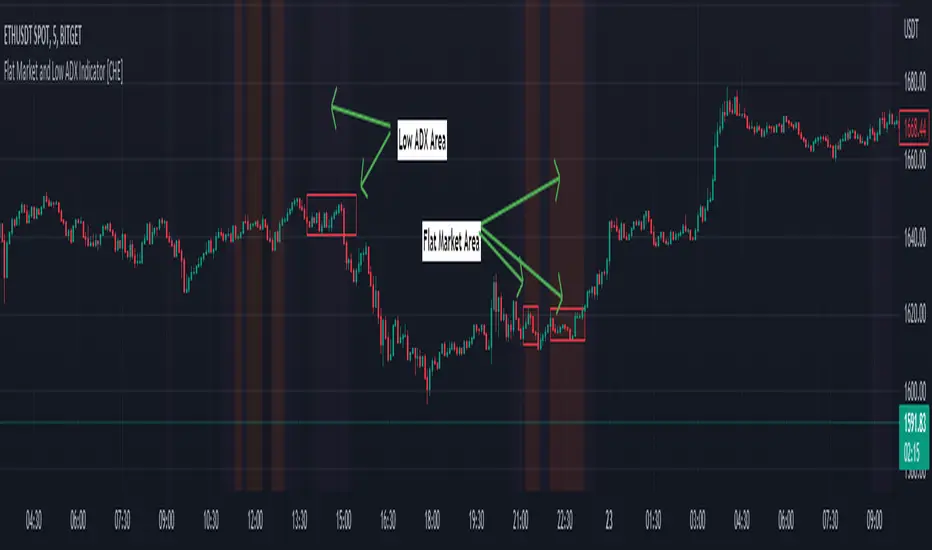
Rekt Edge Reversion BandRekt Edge Reversion band is a technical indicator that utilizes a combination of moving averages and standard deviations to determine optimal entry and exit points in the market. By comparing the current price to its moving average, the indicator identifies potential trends and determines how you can position around them by plotting buy/sell signals and two channels based on user input parameters. The user can choose between Simple Moving Average ( SMA ) or Exponential Moving Average ( EMA ) and select the moving average period, the unit of separation, the multiples of the unit, and other important parameters. The indicator's inputs can be adjusted to suit different trading styles, and it can be used on any time frame. The indicator can be used to identify potential trend reversals or breakouts (or breakdowns) when the price moves outside of the channels. The indicators potential use cases include identifying overbought or oversold conditions. With its ability to provide a clear signal on when to enter and exit a trade, this indicator is a popular tool among traders looking to make more informed and profitable trading decisions. This indicator can also be used in conjunction with other technical analysis tools to confirm or invalidate trading signals.

AutoBF by Tren10xBroadening Formation is a powerful technical analysis tool that is characterized by two converging trendlines that widen over time. This pattern typically signals a period of volatility and uncertainty in the market and can indicate a potential reversal in trend direction.
This script uses advanced algorithms to automatically detect and plot broadening formations on your chart, making it easy to identify these patterns and potentially profit from them, all while saving you time from drawing them yourself. With customizable settings, this indicator is a must-have tool for any trader looking to take advantage of this powerful chart pattern.
Features:
● Automatically detects and plots broadening formations on any chart within TradingView
● Customizable settings for greater flexibility and control
● Choose to draw your broadening formation from the outside bar to the "Previous Candle" or "Compound Candle" aka to the previous lowest/highest candle within the outside bar.
● Clear visual display of broadening formations and easy identification
● Compatible with all markets and timeframes, from stocks and forex to cryptocurrencies and commodities
● Designed for both novice and experienced traders, with user-friendly interface and comprehensive documentation
● By default, the year will look back 75 years, the quarter will look back 20 years, the month will look back 7 years, the week will look back 3 years, and the day will look back 90 days. However, you now have the ability to change these at your will.
● Added the ability to enable Broadening Formations on the 6 Month, 2 Month, 2 Week, and 2 Day charts.
● ALERTS! Receive timely notifications when the price breaches or activates a broadening formation.
All Timeframes available:
● Year
● 6 Month
● Quarter
● 2 Month
● Month
● 2 Week
● Week
● 2 Day
● Day
tinyurl.com
Predicting future outcomes is impossible. Nobody knows what the future will bring. With this Broadening Formation Indicator, you will have the edge you need to identify potentially profitable trading opportunities and make more informed decisions in the markets.
Regards,
Tren10x
Disclaimer: It is essential to note that returns on investments are not guaranteed, and investors should exercise prudence in conducting thorough due diligence before making any investment decisions
I would like to express my gratitude to my wife for her meticulous testing and insightful contributions throughout the course of this project. Additionally, I extend my appreciation to the esteemed Alpha Pack Group, whose exceptional acumen and investment expertise have been instrumental in the success of this endeavor.
ATR fluctuation abnormal warning RTA77 1.0//en
ATR fluctuation abnormal warning RTA77 1.0
COINBASE:BTCUSD
"coming? "
A classic technical term for impending volatility. But "coming" generally means that the question of whether volatility or a trend is coming is asked only after volatility has been observed.
By combining short-term volatility, long-term volatility, and abnormal changes in relative cycles, this indicator identifies potential changes in upcoming volatility (volatility changes) at an earlier stage, allowing the market to be asked the question "Is it coming?
Since volatility itself has a lag, and the longer the period, the more lagged the detection of abnormal volatility will be, so this indicator is only suitable for short-term, small period (15M - 1H) best. Because volatility is passed from small to large, there is a chance to detect large volatility quotes by catching potential volatility abnormal changes in small cycles.
The "volatility warning" of this indicator all refers to the plate is in abnormal volatility, or is about to occur volatility anomaly, can be used as a precursor warning of the emergence of volatility anomaly in the later market. When a golden cross between short-term volatility and long-term volatility is observed, it means that in a short period of time, or in the future, a high volatility market will be profitable in contrast to the previous low volatility market.
(Alert triggering is not only limited to a single time, if it is confirmed several times in a short period of time, if volatility has not yet occurred, the probability of volatility in the future market increases in the short term)
This indicator of "shock warning" all refers to the plate may have been from the previous state of high volatility, into a low volatility of the shock state, orderly or disorderly, suggesting that volatility in the short term appeared to reduce the higher the volatility of the previous section of the market, when the shock warning signal, the probability of starting to enter the shock adjustment market.
The ATR of two different cycles can be changed as needed, but must maintain the relationship between short-term and long-term correspondence, each subject has a different cycle, you need to judge and find the optimal parameters
Continuously updated.
//ch
ATR波动异常预警 RTA77 1.0
《来了?》
一个经典代表波动即将来临的专业术语。但“来了”一般情况下指有当人们观察到波动以后,才会发出对市场的提问,波动或趋势是否到来?
本指标通过结合短期波动率,长期波动率,在相对周期内的异常变化表现,从而在更早的阶段发现即将出现波动的潜在变化(波动率变化),使得能够更早的向市场提出疑问《来了?》
由于波动率本身具有滞后性,且周期越长,发现波动异常的时候就会越滞后,所以本指标仅适合在短期,小周期里使用(15M - 1H)最佳。因为波动是从小到大传递,所以通过抓取小周期内潜在的波动异常变化,从而有机会发现大波动行情。
本指标的 “波动预警” 皆指的是盘面正处于异常波动,或者即将发生波动异常,可做为对后市出现波动异常的前兆预警。当观察到短期波动与长期波动金叉时,意味着在短时间内,或者未来将盈利与之前低波动行情相反的高波动行情。
(警报触发不仅限单次,如在短期内多次确认时,如还未发生波动,则后市短期内出现波动概率增大)
本指标的 “震荡预警” 皆指的是盘面可能已经从之前的高波动状态,转变为低波动的震荡状态,有序或无序,提示短期内波动率出现降低,前段波动幅度越高的行情,当出现震荡预警信号时,则大概率开始进入震荡调整行情。
两条不同周期的ATR可以按需要更改,但必须保持短期和长期对应的关系,每个标的有着不同的周期,需要自行判断并找出最优参数
持续更新中。。
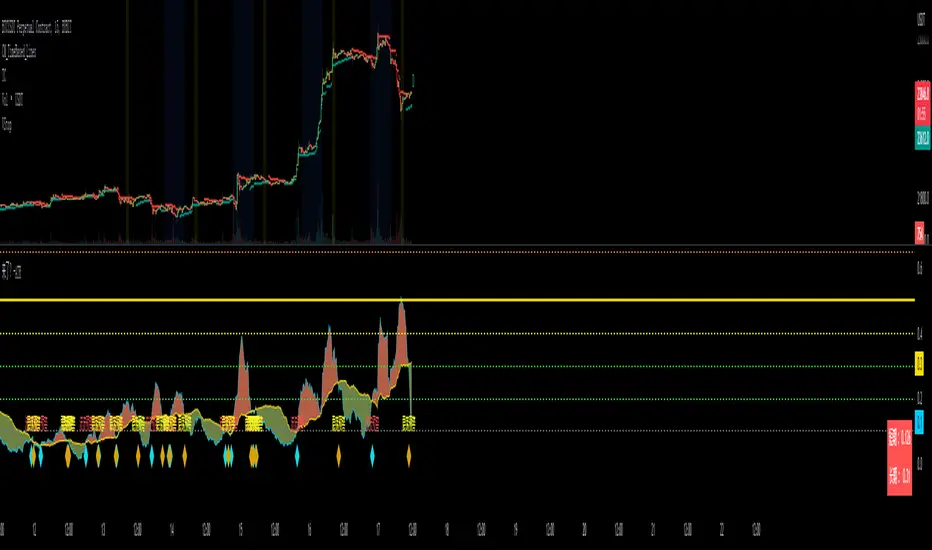
STructure Atr Cloud w/ TargetsThis indicator is part of our educational suite focused on teaching price structure, momentum, and mean reversion trading strategies. This indicator is recommended to be used with our “Price Action Trading Indicator” or PATI.
Components of this indicator:
Intraday and Swing Price Structure
Breaks of Structure Identification
Change of Character Identification
Fib-derived Price Targets
Dynamic ATR-based Trend Cloud
This indicator is intended to be used in conjunction with the education we provide to help our users determine their optimal trade plan to utilize their edge.
Intraday (Short-Term) Structure is displayed in gray as HH, HL, LH, LL by default, and the zig-zags can be turned on/off in the settings.
Swing Structure is displayed in yellow as HH, HL, LH, LL by default, and the zig-zags can be turned on/off in the settings.
EQL/EQH show areas where price made an equal low or high.
Dynamic ATR-based Trend Cloud (orange cloud) helps traders stay in profitable trades longer by giving them a visual aid of the current momentum. We have added a confirmation level that dynamically appears when the price breaks over/under the cloud giving validation to the potential trend shift. Failure to break this level tends to result in a rejection and continuation of the current orange cloud trend as you can see in the image above.
Change of Character (ChoCh) shows internal structural breaks where a minor level or supply/demand zone fail, resulting in a potential shift in a short-term trend. Above you can see two common ChoCh setups (head and shoulders/ inverse head and shoulders) that usually result in significant price reversals.
Above is an example of using this indicator on two timeframes to develop short and longer term targets. Previous targets can be used as areas of interest where we can look for price to bounce/reject. Target levels that develop above/below price make great areas to potentially take off some risk/ put risk on.
Please check the Author Instructions Below for how to gain access to our indicators.

Jerry J8 30-123 Spy Dashboard ProPlease watch the J8 Scalping Tutorial Video below for a walkthrough on how these indicators work.
This script is used in conjunction with Jerry J8 30-123 SPY Scalping PRO” Indicator(which creates the buy and sell orders as a strategy). The Dashboard shows the 4 main criteria statuses from the strategy. I find the dashboard makes scalping the SPY much easier.
This study project is designed for scalping options that expire daily with bull put and bear call credit spreads on a 3 minute chart. The name 30_123 is a reference to 4 main criteria being met to give a green light for a potential trade. The criteria:
* 30 = 30 minute trend
* 1 = 3 minute trend
* 2 = Moving average criteria
* 3 = RSI criteria
4 = Secondary trend. Bonus if in sync but not a requirement.
* The strategy also utilizes momentum as a criteria but this is not shown on the dashboard.
This indicator is designed to trade options that expire daily including the SPY, IWM, QQQ, and NDX. However, it can be used with multiple symbols on a 3 minute chart.
When the 30_123 conditions are all green with all criteria are met a bull signal is created.
When the 30_123 conditions are all red with all criteria are met a bear signal is created.
This study is the dashboard that is designed to show how the main J8 strategy indicator is working and it shows which criteria have been met. Additionally there are multiple user INPUTS that you can adjust for the 4 main criteria plus inputs to help you with your credit spread criteria.
For example, if the SPY is at 400 we could have an order to sell a BULL PUT CREDIT SPREAD and I would likely sell the 398p and buy the 397p; The 398p delta would be approximately -.2. The spread position profits with any close over 398 and/or can be closed early with a bullish price move. IMPORTANT: If the SPY closed the day at $399 on the chart it would look like a loss based on the buy and sell orders but the spread would be a full profit since the close was above 398.
---- IRON CONDOR
For the SPY ticker only an iron condor label is generated when the SPY is trading sideways and meets specified criteria. When the criteria is met the Iron Condor label appears and it provides a recommendation for what option to buy and sell. The iron condor recommendations can be adjusted with user inputs.
This Indicator dashboard shows the criteria labels and colors the criteria as green if bullish and red if bearish. When the criteria are not met the dashboard shows “NO CLEAR SIGNAL”. There is also a label that shows whether you are looking for bullish or bearish positions based on the 30 minute trend.
The chart shown on the indicator is the RSI and for this indicator an RSI over 50 is bullish and under 50 is bearish. The line color shows the RSI trend. RSI OB (overbought) and OS (oversold) areas are shaded. The RSI can remain in an OB or OS state for a prolonged period and while some people use OB and OS as a reversal signal I use it as a strong trend indication and recognize it will not last forever. You can SET the OB and OS levels with inputs.
---- USER INPUTS
Paint Bars: Turns on/off the candle coloring. Default is OFF.
Iron Condor Settings: Defaults are what I use and can be used as a guide.
Criteria: Trend, moving averages, and RSI settings can all be adjusted.
---- SETUP & HINTS
Add "Jerry J8 30-123 SPY Scalping PRO” indicator to show bull and bear signals
Add "Jerry J8 MACD Optimal Entry Zone” indicator to show best MACD range for entry
I also like to add "Jerry Momentum Dream" indicator to see the momentum
With this indicator we’re looking for the 30, 1, 2, and 3 criteria to be met which increases our likelihood of success. IMPORTANT. Never automatically enter a position without reviewing the other indicators and drawing your own conclusions. You want to choose the entries that are the most appealing to you that take into account volume, time of day, and risk/reward. Positions should be closed based on your risk/reward goals.
Indicators are not a magic pill and should be used to support trading decisions, not to make them for you. Past performance is not a guarantee of future returns. The results of individual stocks/indexes with any strategy do not constitute proof they will repeat in the future.
DISCLAIMER: The information contained in our scripts/indicators/ideas does not constitute financial advice or a solicitation to buy or sell any securities of any type. Trading and investing in the stock market and cryptocurrencies involves substantial risk of loss and is not suitable for every investor. I’m NOT a financial adviser. All trading strategies are used at your own risk.
Please Use the AUTHOR’s INSTRUCTIONS link below for more information.
NOTE: The PERFORMANCE SUMMARY below does not accurately reflect the trading strategy because the entry orders generated in the strategy are based on the stock price and our actual order is a credit spread that is profitable even if the price moves against us a little bit. What could show as a loss in the strategy could be a profit in the credit spread.

Cryptos Pump Hunter[liwei666]🔥 Cryptos Pump Hunter captured high volatility symbols in real-time, Up to 40 symbols can be monitored at same time.
Help you find the most profitable symbol with excellent visualization.
🔥 Indicator Design logic
🎯 The core pump/dump logic is quite simple
1. calc past bars highest and lowest High price, get movement by this formula
" movement = (highest - lowest) / lowest * 100 "
2. order by 'movement' value descending, you will get a volatility List
3. use Table tool display List, The higher the 'movement', the higher the ranking.
🔥 Settings
🎯 2 input properties impact on the results, 2 input impact on display effects, others look picture below.
pump_bars_cnt : lookback bar to calc pump/dump
resolution for pump : 1min to 1D
show_top1 : when ranking list top1 change, will draw a label
show pump : when symbol over threhold, draw a pump lable
🔥 How TO USE
🎯 only trade high volatility symbols
1. focus on top1 symbol on Table panel at top-right postion, trading symbols at label in chart.
2. Short when 'postion' ~ 0, Long when 'postion' ~ 1 on Table Cell
🎯 Monitor the symbols you like
1. 100+ symbols added in script, cancel remarks in code line if symbol is your want
2. add 1 line code if symbol not exist. if you want monitor 'ETHUSDTPERP ', then add
" ETHUSDTPERP = create_symbol_obj('BINANCE:ETHUSDTPERP'), array.unshift(symbol_a, ETHUSDTPERP ) "
🎯 Alert will be add soon, any questions or suggestion please comment below, I would appreciate it greatly.
Hope this indicator will be useful for you :)
enjoy! 🚀🚀🚀