MBY_Quant_HerculesHello.
This is MBY Lab.
We are very excited to deploy Hercules metrics.
Hercules strategy operates based on the Relative Strength Index , and displays the price when each Relative Strength Index maintains an upward trend or decreases.
When the stock price rises, the price at the time of entering the overbought or oversold section is displayed as the market price, or when the relative strength index falls when the stock price rises, it is captured and the market price is displayed.
Therefore, this indicator is a momentum indicator , and it can be said to be a non-trend following indicator.
The blue line that outputs as blue shows a graph of the asset change when buying or selling at the price pointed to by this indicator, including 0.2% slippage and 0.2% transaction fee.
Of course, this doesn't mean that this metric is always profitable.
This strategy was created to aid trading.
This indicator is a private indicator, please comment if you wish to use it.
**notice**
"Use the link(Invite only script Contact) below to obtain access to this indicator".
"profitable" için komut dosyalarını ara

Profit/Loss LabelOnce I entered a trade, I always wanted to know quickly if I am in a profitable position or losing NOW?
Here's the label to do the work for me, and if you like it, please give it a thumb up.
*** There's a setting to change your trade type to LONG or SHORT with a commission rate.
*** Color setups:
- If it's green: profitable position, including the pay for comission
- If it's orange: moving in favorite direction, but still a losing position due to the comission
- If it's red: losing position moving in the opposite direction

PRIMEVAL_SERIES_0001.0 - Hyper-bullish EMA SequenceThe Primeval Series is the domain of combinations between EMAs of any specific length that apparently dictates the fabric of equity price movements. For best use, the 45-minute timeframe is ideal for short-term, explosive plays.
The series can be split into major and minor sub-series, i.e., "Epoch" and "Triassic." Epoch EMAs refer to the lengths of 618 periods and 1618 periods - these are the averages that denote major directional shifts when they cross each other on any timeframe. The Triassic EMAs are the 21, 62, and 186 lengths of any timeframe that offer incredible directional insight when they interact with the Epoch EMAs.
Triassic EMAs' seldom interact with Epoch EMAs intraday. However, their interactions with each other can be useful for quick swing trades. After discovering these oddly specific EMA lengths, my study and application of their interactions have increased my understanding of markets ten-fold. I hope they do for you as well.
Aside from the EMA lines themselves, I have created colored background lines for specific crossovers that seem to follow a bullish sequence. I have annotated the sequence in the script itself, but will also include here for ease of use. See below for more details:
Hyper-bullish EMA Sequence:
1) For best use, look for charts that are in a long-term bullish trend and have pulled back over the last 2 months.
2) Once such a stock has been identified, set the chart timeframe to 45 minutes, and apply the script.
3) The sequence begins on the nearest AQUA colored crossover. This denotes the beginning of the most-local retracement from near-term (could be all-time) highs.
4) Then, find the next ROYAL BLUE crossover background line for a potential entry. If I were tracking a stock that just displayed a ROYAL BLUE crossover, I would enter 1/4th of my planned full position.
5) Next, search for the next crossover highlighted in DARK BLUE. This is the key crossover. Enter your full position, as it is a very strong bullish confirmation signal.
6) Hold the long position until you see the penultimate GREEN crossover line. In certain cases, this is the final confirmation for the uptrend and denotes an extension upward. I would not add here, but would alternatively take 1/3rd of my profits.
7) If you take 1/3rd of your profits, you can ride the extension knowing that the trade is profitable regardless. House money trades are my favorite trades for this reason.
8) The toughest part is selling the remaining 2/3rds of your position, but there is a solution: when you see the first RED crossover line after GREEN, sell half of your remaining position. The price could come down a bit but would hold the remaining position until the next RED line appears.
**IMPORTANT: This strategy assumes that there is only ONE AQUA line at the very beginning of any given sequence. If there appears another AQUA line at any point in the sequence, SELL ALL. That is the only hard rule and is extremely unlikely to occur after a DARK BLUE cross. Keep in mind that some charts are so bullish that a GREEN LINE may never appear because the price action is so far above the Epoch_Zero EMA (yellow EMA ) that it will not be a factor for some time. Lastly, most RED crossover lines are insignificant until the GREEN line appears. Even then, they are only potential places to sell. AQUA lines are most meaningful and if you see one occur after a GREEN line, exit immediately.
Before you use this strategy, backtest it in the following way: pick any bullish stock over the past 3 months and see how the sequence pans out. I have done this over 100 times and it has worked 100 times WHEN you follow the rules listed in the "IMPORTANT" section above. Once validated, use this as a powerful weapon during bullish times.
Good luck and I hope this can make the world profitable someday.
- Perma H. Pig

BOMBA SAR Parabollinger 2.1This is a redesign of the built-in Parabolic SAR indicator. I added a proper input system, an option to highlight initial points for both lines and an option to choose points width. So, customize it as you want.
Parabolic SAR was originally developed by J. Welles Wilder and described in his book "New Concepts in Technical Trading Systems" (1978). It is a trend-following indicator that can be used as a trailing stop loss.
To know which settings for PSAR are the most profitable on your instrument and timeframe you can use this tool
Profitable Parabolic SAR

GODMODE GUPPY ATRThis script includes volatility calibrated ATR ( Average True Range )
features :
* Custom time intervals for ATR
( example you can use 45 min ATR on any time frame for swing plays & you can use 15 min ATR on lower time frames like 15 min for scalping )
* Smooth Guppy : helps to understand support and resistance also helps to understand trend direction ( Red is bearish trend & Blue is bullish trend )
* Triangle shapes : Triangle shapes are extra confirmation for trend changing
HOW TO USE :
"BULL" signal is a bullish breakout
&
"BEAR" signal is a bearish breakdown
Stops above or below ATR as per the signal
Guppy shows trend direction
So,
when guppy is blue longs are profitable
and when red shorts are profitable
Buy/Sell on the candle close confirmation of signal is set on candle close
For access DM
*******************

LuxAlgo® - Signals & Overlays™Signals & Overlays™ is an all-in-one toolkit made up of more than 20+ features primarily focused on generating useful signals & overlays to fulfill any trader's technical analysis needs with relevant data.
Created directly with TradingView Pine Script Wizard, alexgrover - this is a first of its kind comprehensive script made fully from the ground-up to provide an all-in-one solution for traders.
Signals & Overlays™ can be used alongside other forms of technical analysis, however, it was also designed to be used as a stand-alone toolkit that can fit any trading style. Every feature included considers how not all technical indicators fit every market condition.
The ideal way to utilize this indicator is to explore through all of the features over time, pick & choose 2-3 features best suit your style of trading, and stick with those to create your own unique LuxAlgo trading strategy.
Providing Endless Possibilities Catering To All Trading Styles
Signals & Overlays™ works in any market for discretionary analysis & includes many features:
Beginner-friendly Presets to enable multiple features at once within one-click (locks other settings when enabled).
Confirmation Signals: Normal & Strong signals to help traders confirm trends (not to be followed blindly).
Contrarian Signals: Normal & Strong to help traders spot reversals (also not to be followed blindly).
Exit Signals: "x" marks that apply for both Confirmation Signals & Contrarian Signals to suggest potential take-profit areas during signals.
Signal Optimization Methods: Sensitivity / Agility, optimal sensitvity parameter displayed on dashboard, and Autopilot (dynamic setting).
Candle Coloring: Purple/Green/Red to visualize trends developing between 'normal' & 'strong'.
6+ Indicator Overlays that helps traders visualize trends, find reversal points, and get dynamic areas of support & resistance.
Filters within "Presets / Filters" to allow users to filter Confirmation Signals with Indicator Overlays & other metrics within LuxAlgo Premium.
A complete dashboard with highly actionable metrics such as Trend Strength, current volatility, volume analysis, etc.
Advanced Settings to display customizable TP/SL points, further enhance signal optimizations, & customize dashboard size/location.
Full Any Alert() Function Call Conditions included
Highly useful Filtered Alert Creator section to generate custom filtered signal alerts with Indicator Overlays & other metrics.
+ more. (Check the changelog below for current features)
🔶 USAGE
Basic Signals & Candle Coloring Demonstration
In the image below we can see a basic example of how these 2 core components function within Signals & Overlays™.
As explained earlier, the Confirmation Signals can generate normal labels as well as strong labels marked by the "+" symbol. These signals are directly correlated to the candle coloring in order to see the development of trends & navigate through different market conditions as best as possible.
The candle coloring comes especially in handy when using signals, whereas a positive sign for an uptrend to occur rather than a fake-out is to see candles consistently hold as green. This indicates the market is strong & is likely to continue an uptrend. Vice versa for sell signals & the candles holding as red.
Normal Confirmation Signals often occur with smaller trends, retracements within larger trends, or just as signals a user may not want to trust as much directly. In order to enhance your ability to trust signals more & find more actionable use cases out of LuxAlgo Premium, we recommend going to the settings menu of the indicator & activating some indicator overlays. These are covered in the next section.
🔶 INDICATOR OVERLAYS W/ SIGNALS
In the image below we have enabled the "Smart Trail" & "Reversal Zones" indicator overlays from within the settings of Signals & Overlays™. By using these overlays alongside the signals & candle coloring, users can find more confluence to create trading strategies or plans.
The Smart Trail provides an excellent area of dynamic support/resistance for traders, as well as an additional confluence for general trend following purposes alongside the Confirmation Signals.
The Reversal Zones are particularly useful for areas to immediately take profit on trades, however, during strong trends price may continue rising or falling through the Reversal Zones which makes a good use case of waiting for price to first exit the Reversal Zones before considering the next move in the market.
In the next image below we can see the market is generally ranging, making it more complicated for the standard Confirmation signals to perform greatly as they are meant to excel for finding developing trends. This image displays the Contrarian Signal Mode, Contrarian Gradient candle coloring, as well as the Trend Catcher Indicator Overlay to help us trade these market conditions specifically.
Paired with the Contrarian based candle coloring, these signals can be helpful to a trader looking to find confluent reversals. You can also see the Trend Catcher indicator overlay gives a hybrid approach to analyzing the underlying trend within this price action.
Some traders naturally are Contrarian in nature, so this signal mode may be of primary interest to them, however, most of the use cases will come from the standard Confirmation sigals paired with other overlays or regular technical analysis.
🔶 SIGNALS WITH AI CLASSIFICATION
Our toolkit is able to classify generated signals using a simple machine learning algorithm into four levels. These levels indicate if a signal will most likely indicate a trend continuation (level 3/4) or a reversal/retracement (1/2).
Users are able to filter out certain signals depending on their classification, only keeping signals of interest and potential filtering out false signals.
🔶 FILTERS
In the next image below we can see after resetting the Signals & Overlays™ indicator to it's defaults, we have simply enabled the "Smart Trail Filter" from within the Presets / Filters section at the top of the settings.
By doing this, we can filter out signals that are not aligned with the Smart Trail indicator overlay, which gives direct confluence in every signal that generates on the chart.
Applying filters to signals do not necessarily make them instantly "better" than using the indicator without them. Between every technical indicator, there are trade-offs. So while we can now use Confirmation signals & retests of the Smart Trail as great optimal entry points, at times the indicator may miss signals or retests of the Smart Trail.
The same is seen below with another one of the Filters within Signals & Overlays™; Trend Strength Filter.
We can see the indicator is using the Trend Strength metric to only generate Confirmation Signals that align with a trending market which can clean up a lot of noise during retracements as well as ranging markets.
However, the trade-off present now with this filter enabled is that at times the indicator will miss trends, in which we'd still need to be aware of the price action, candle coloring, or other forms of analysis to give us indications the market may start a new trend opposed to just relying on signals directly.
🔶 CONCLUSION
We believe that success lies in the association of the user with the indicator, opposed to many traders who have the perspective that the indicator itself can make them become profitable. The reality is much more complicated than that.
The aim is to provide an indicator comprehensive, customizable, and intuitive enough that any trader can be led to understand this truth and develop an actionable perspective of technical indicators as support tools for decision making.
You can see the Author's instructions below to get instant access to this indicator & our LuxAlgo Premium indicator suite.
🔶 RISK DISCLAIMER
Trading is risky & most day traders lose money. All content, tools, scripts, articles, & education provided by LuxAlgo are purely for informational & educational purposes only. Past performance does not guarantee future results.

Cracking Cryptocurrency - Bottom FeederThe Bottom Feeder
The Bottom Feeder is designed to algorithmically detect significantly oversold conditions in price that represent profitable buying opportunities. Combining this with it’s unique Stop and Target System, the Bottom Feeder is designed to return consistent return with minimal draw down. Whether used as a Market Bottom Detector or as a system for executing safe, profitable mean reversion trades, the Bottom Feeder is a powerful tool in any trader’s arsenal.
Bottom Feeder was designed to be used on BTCUSD , however it is also effective on other USD/USDT pairs. One will have to check the individual pair they wish to trade with the Strategy Tester to simulate performance.
Options
Let’s go through the input options one by one, so that you are able to comfortably navigate all that this indicator has to offer. The link below will display a picture of the layout of the settings for your convenience.
For the sake of simplicity, let’s note now that all settings marked **Conservative Mode** will not work in Aggressive Mode.
Mode: Determines how aggressively Bottom Feeder generates a buy signal. In Conservative Mode, trades can only be opened once per candle and the stop and target will update as new signals appear. In Aggressive Mode, a separate trade is opened each time Bottom Feeder signals, which may be multiple times within one Daily candle.
Plot Target and Stop Loss: Toggles on/off the visualized take profit and stop losses on the chart.
**Conservative Mode** TP Multiplier: This is an input box, it requires a float value. That is, it can accept either a whole number integer or a number with a decimal. This number will determine your Take Profit target. It will take whatever number is entered into this box and multiply the Average True Range against it to determine your Take Profit.
**Conservative Mode** SL Multiplier: See above - this will modify your Stop Loss Value.
**Conservative Mode** Average or Median True Range: This is a drop-down option, the two options are Average True Range or Median True Range. If Average True Range is selected, then this indicator will use the Average True Range calculation, that is, the average of a historical set of True Range values to determine the Average True Range value for Target and Stop Loss calculation. If Median True Range is selected, it will not take an average and will instead take the Median value of your historical look back period.
**Conservative Mode** True Range Length: This is an input that requires an integer. This will represent your historical look back period for Average/Median True Range calculation.
**Conservative Mode** True Range Smoothing: This is a drop-down with the following options: Exponential Moving Average ( EMA ), Simple Moving Average ( SMA ), Weighted Moving Average ( WMA ), Relative Moving Average (RMA). This will determine the smoothing type for calculating the Average True Range if it is selected. Note: if Median True Range is selected above, this option will not have any effect as there is no smoothing for a Median value.
**Conservative Mode** Custom True Range Value?: This is a true/false option that is false by default. If enabled, it will override the Average/Median True Range calculation in favor of a users custom True Range value to be input below.
**Conservative Mode** Custom True Range Value: This is an input box that requires a float value. If Custom True Range is enabled this is where a user will input their desired custom True Range value for Target and Stop Loss calculation.
Stop and Target Description
Because Bottom Feeder is designed only to scalp the various market bottoms that can appear over time in the market and not to identify trends or to trade ranges, it’s imperative that the indicator notify us not just to when to enter our trades, but when to exit! In the service of that, CC Bottom Feeder has a built in Stop and Target system that tracks and displays the stop loss and take profit levels of each individual open trade, whether in Aggressive or Conservative Mode.
Conservative Mode Targeting: In Conservative Mode, Bottom Feeder signals are aggregated into a compound trade. The signal will appear as a green label pointing up below a candle, and will appear upon a candle close. If Bottom Feeder then generates another signal the stop loss and target price will be updated. The process will continue until the aggregated trade completes in either direction. On a trade with multiple signals, a larger position is slowly entered into upon each buy signal.
Aggressive Mode Targeting: In Aggressive Mode, Bottom Feeder signals are individually displayed as they are generated, regardless of how many signals are generated on any single candle. If Bottom Feeder continues to signal, each individual open trade will have their own stop loss and target that will be displayed on the chart until the individual trade completes in either direction. As opposed to a large compound position, aggressive mode represents a higher number of independent signals with their own stop and target levels.
Stop losses and targets are designed to be hard, not soft. That is, they are intended to be stop market orders, not mental stop losses. If price wicks through the target or stop, it will activate.

WaveTrend Simple Oscillator [NinjaDawgz]Building on my previous I've attempted to distill everything down into its simplest form. All you need is to understand what the oscillator is telling you!
Oscillator line crosses will trigger a signal and are colored in the respective direction for clarity.
At its very basic usage, you can sell signals once they're oversold/overbought. Anything above/below the double lines are considered extreme. Using money management and standard trading techniques, like waiting for price to break the high/low of the triggering bar, will yield significant risk:reward ratio's that are profitable.
More advanced usage are using pattern recognition for both reversal and continuation signals. Any pair of opposite signals within a few bar's are powerful continuation signals.
Highly advanced usage is to find Elliot Wave patterns (mainly corrective patterns like flats but any pattern) in the oscillator itself, as well as leveraging the oscillator to identify corrections on chart. Finally, the oscillator will give you the (sub)pattern completion by printing a signal on oscillator.
This works for any security on any timeframe.

Patient Trendfollower (7)(alpha)Patient Trendfollower consists of 21 and 55 EMA, Commodity Channel Index and Supertrend indicator. It confirms a trend and gives you a signal on a pullback. Original creation worked on 1h EURUSD chart.
►Long setup:
• 21 EMA is above 55 EMA, which is above the Supertrend indicator.
• Commodity Channel Index is an oscillator, which prints into the chart if extreme levels are reached. Green is for a level above 100 or below -100, red is above 140 or below -140 and black is above 180 or below -180.
• If 21 EMA > 55EMA > Supertrend and an oversold signal appear, you can buy into the trend.
• When backtesting on 1h EURUSD, profit target 400 pips worked best with a stop-loss below Supertrend's bottom and the size of your spread.
• A picture shows two valid entries.
: This part still malfunctions and shows red dots over some green ones. It is important to disable red ones in the settings to see green ones.
Some more long signals:
Some short signals:
►Backtesting data with default settings and trading only green CCI signals with mentioned risk management strategy:
• 212 closed trades
• 58.96% profitable with average win trade 348 USD and average loss trade 263 USD when only green signals are followed.
• Profit factor 1.903, Sharpee 0.792
• 20 bars is average for all trades, short trades were 18 bars long on average.
With given data, you can see the strategy is profitable by itself. However, original risk management settings do work only on 1h charts of EURUSD and would need to be adjusted for other instruments based on average volatility.
Even though the profitability is low, you can increase your odds by a great margin, if you properly use price action (impulsive and corrective moves, patterns, bar analysis), if you trade when major exchanges are open, you may also use wave analysis such as Elliot Waves or Market Profiles to predict whether the next day might be a trending day. My backtesting program didn't consider these ideas.
Unfortunately, I won't be making backtesting strategy public with it anytime soon, because it still has some parts that do not work. I am ok with that since I understand the code and know what does malfunction and how. Then, there are parts which I am not sure how to fix yet. This is why the indicator is still considered alpha.
In the future when a strategy is published, you will also be able to set your own overbought/oversold values without entering the code itself and probably some other features. But I am not in a hurry for that. You can give me feedback on UX and try to figure out the best setups for other symbols, it might help to improve the automatic testing script when I know what I should achieve. My main point is to make this public for friends who can already be using it on EURUSD at least.
Close doesn't always have to be 400 pips, you might want to close on a logical level such as strong resistance or a trendline too.
Thanks to:
• @everget for providing Supertrend solution.
• Satik FX who hand-tested the system by hand and reported results in this article . He is my main inspiration for creating the complete indicator as one because I want to be able to show and hide it with a single click. My future scripts will also work as a whole strategy each by itself.
• The number in the script's name comes from Satik's numbering. A mentioned article was his seventh shared strategy.

Sideways Money - Bitcoin BeatsHello, Hello, Hello,
And welcome back to Bitcoin Beats.
This is another version of my previous script, "Range Indicator - Bitcoin Beats".
Designed initially for breakouts but shows adaptive ranges and consolidation in XBTUSD(Haven't tested other assets but should do the same thing).
If we are consolidating (which is most of the time) a good strategy to trade would be to trade ranges. However, as soon as you spot the range it can feel like the range has changed so you lose out on making the monies.
This indicator plots out the average range in a consolidation.
It also shows you when the range has broken in a direction that it previously hasn't broken in. This essentially signifies the the trend changing and gives warning that trading the range may no longer be valid.
There are a few ways to trade this indicator and I will explain 2 of them here.
PLEASE TRADE AT YOUR OWN RISK. YOUR FUNDS ARE YOUR RESPONSIBILITY.
IF YOU TRADE WITH THESE STRATEGIES, YOU ARE TO BLAME FOR YOUR OWN LOSSES.
BY USING THIS INDICATOR YOU AGREE THAT I WILL NOT BE HELD LIABLE IN THE CASE OF YOU LOSING FUNDS.
Strategy 1:
- Have 2 bitmex accounts open.
- Use on the 30m, 1h, 3h or 12h.
- Long AND Short on both accounts when we hit the middle area. This is called the "Reload Zone".
- When we hit the edge of each side of the plotted range, close the positions in profit.
- You will then have 1 trade underwater.
- If the range is solid, the price will move back to the Reload Zone in which you reload you position that you took profit with.
- You then have both a Long AND Short open after 1 profitable trade.
- Rinse and repeat until you get the "STRATEGY CAUTION" message signifying that the range will most likely break soon.
Strategy 2(least profitable):
- When the "STRATEGY CAUTION" Message appears, you can long or short depending on which side it breaks toward.
- If we break down, short.
- If we break up, Long.
I wouldn't advise this second strategy if you are a beginner as the results are inconclusive and it's more of a hybrid trading strategy, meaning you have to know how to trade with price action flowing.
Usually if it is appearing volatile, you can go to a higher time frame and find the exact range it's catering to, adjusting your strategy accordingly.
See you soon,
Goodbye, from Bitcoin Beats.

WaveTrend Chart {Momentum} {DarkTheme} [NinjaDawgz]This is just a default set of settings i feel are best suited for Momentum trading and if you are using the Dark Theme.
it is the same code as the original
Custom Wave Trend Code used to spot, confirm and trade cyclical peaks and troughs.
Can be used in isolation but extremely powerful in conjunction with extra analysis, like Wave Theory.
Icon Descriptions:
Triangles (▼/▲): These are confirmations that the trend has changed. Trading in direction of the the trend is conservative but reliable and relatively profitable.
Pluses (+): These are points for re-entry and/or accumulating addition positions to trade the trend (Triangles above). If you missed the trend change, this is best place to get in.
Crosses (x): Picking the top and bottom is hard, like catching falling knife. This will show you possible tops/bottoms as they happen. Can be noisy, should not be used in isolation.
Diamonds (♦): NEW! Wish the trend confirmation (triangles) was quicker? This does
Works on any time frame, any security (Stocks, Forex, Crypto's, etc.)
Green for Long, Red for Short.
All icons can be used for Alerts!
New Alert (Alt + A) > Change Condition to WaveTrend_Chart > Choose from the list of icons.

WaveTrend Chart {Momentum} [NinjaDawgz]This is just a default set of settings i feel are best suited for Momentum trading.
it is the same code as the original
-----------------------------------------------------------------------------------------------------------------
Icon Descriptions:
Triangles (▼/▲): These are confirmations that the trend has changed. Trading in direction of the the trend is conservative but reliable and relatively profitable.
Pluses (+): These are points for re-entry and/or accumulating addition positions to trade the trend (Triangles above). If you missed the trend change, this is best place to get in.
Crosses (x): Picking the top and bottom is hard, like catching falling knife. This will show you possible tops/bottoms as they happen. Can be noisy, should not be used in isolation.
Diamonds (♦): NEW! Wish the trend confirmation (triangles) was quicker? This does
Works on any time frame, any security (Stocks, Forex, Crypto's, etc.)
Green for Long, Red for Short.
All icons can be used for Alerts!
New Alert (Alt + A) > Change Condition to WaveTrend_Chart > Choose from the list of icons.

ALLinTension v5.0 ::: Allin® MarketEnergy™You need two indicators for it to work: AllinTension 5.0 and AllinStrategy 5.0 and use them in sinergy.
They measure and gather information and then present them in an intuitive way for better opportunity spotting and a better and quicker decision making about buy or sell entries in certain markets.
In works with crypto, stock, fiat and futures market.
I will explain how it works o a page but as a thumb rule: the more GREEN you see turning up like an energy the more LONG situation is and the more RED you see turning up like en energy the more SHORT the situation is.
The best thing about a product of mine is that it can be backtested. Results of backtesting yields up to 85% of accuracy and risk-reward ratio up to 5X or more.
Indicator - AllinTension 5.0
This indicator will enable you to actually feel the market on several levels. Exploiting informations from different timeframes and different oscillators with different setting and average them out.
With this indicator you will either confirm the sensed direction or you will skip the opportunity because signals are not properly aligned. To be able to resist FOMO is really crucial here. Opportunities are in abundance. There will be more. A lot more. Really.
How to read it and properly use it?
For more in depth understanding on how it works and proper usage of it There is lot of information on the page.
Strategy: AllinStrategy 5.0
This strategy indicator is used as a backtesting platform for different types of various settings for a selected pair.
Backtesting means you can test each TimeFrame (best 1-9min) with various AllinTension indicator settings. You will get a result for profitability in the last period (but it is not that important anything but for maybe feeling bad you missed it), success rate in percent (anything above 70% is good enough) and you have to watch the ratio of the max dropdown and average trade size (least acceptable is -5x, better is 2x or less).
So you will learn which strategy (TF and indicator setting) has steadily preformed best while being profitable in the past and assume it will do that in the same manner with same accuracy in the future. It sometimes changes so you need to preform rutine testing after some bigger market movements.
With this you will find the best preforming TImeFrame for each window. You will adjust settings for each window differently to diversify view on the market. My personal best setting are for the first window 4-16-64, second window 3-9-27, third window 2-8-32 and forth last window 5-20-80.
So ALLinStrategy is a visual representation of the market and the most important thing, it includes a feature "Strategy Tester" to backtest chosen strategy. The results may surprise you and they can all be proven!:) So what do you do in this case? :):)
But to really understand the market and given signals from this Strategy, you will need indicator ALLinTension or you are going blindfolded guess trading.
How to read it and properly use it?
For more in depth understanding on how it works and proper usage of it There is lot of information on the page.
For strategy to work you first have to find profitable and accurate enaugh TF (more than 70% should do the trick)and indicator settings (there are some favorites) and apply it to your executing strategy.

WaveTrend Chart And Signal v1 [NinjaDawgz]Custom Wave Trend Code used to spot, confirm and trade cyclical peaks and troughs.
Can be used in isolation but extremely powerful in conjunction with extra analysis, like Wave Theory.
Icon Descriptions:
Triangles (▼/▲): These are confirmations that the trend has changed. Trading in direction of the the trend is conservative but reliable and relatively profitable.
Pluses (+): These are points for re-entry and/or accumulating addition positions to trade the trend (Triangles above). If you missed the trend change, this is best place to get in.
Crosses (x): Picking the top and bottom is hard, like catching falling knife. This will show you possible tops/bottoms as they happen. Can be noisy, should not be used in isolation.
Diamonds (♦): NEW! Wish the trend confirmation (triangles) was quicker? This does
Works on any time frame, any security (Stocks, Forex, Crypto's, etc.)
Green for Long, Red for Short.
All icons can be used for Alerts!
New Alert (Alt + A) > Change Condition to WaveTrend_Chart > Choose from the list of icons.

DPMPrice action based volatility. Used to determine profitable intraday trading periods. Lower values indicate unprofitable periods, high values indicate more profitable periods. To be used on XBTUSD 1 day chart.

(2) MoTrend VS-1150A great deal has been written about trend trading, simply because it’s a profitable trading technique, that simply works. The MoTrend indicator displays trending, momentum and stiffness to the trader guiding them to potential trend trading opportunities. MoTrend also contains a very sophisticated exit strategy, allowing the trader to ride the trend to its most profitable exit point.
MoTrend was developed by determining when the Short-Term Hurst Channel(STHC) merge with the Long-Term Hurst Channel (LTHC). This event is flagged in two manors. First the STH channels blue line obscures the green or red lines of the LTH cycle channel. This triggers a change in the background color of your Cycles price chart to light green, as illustrated below, and in a change in color of the background of the MOTREND indicator to dark green on up-trends. These background colors shift to progressive shades of red when the trend is indicating down.
Because the MoTrend indicator was designed to work in concert with the Cycles indicator, the MoTrend signals are designed to progressively bleed into the Genie Cycles indicator. The two are not required to both be active on your screen at the same time, as each one is a free standing indicator working` completely independently of each other.
When the STH channel moves to the top of the LTH channel you are seeing the confirmed beginning of a positive trend. The MOTREND indicators most important asset is the ability to provide traders with a clear indications when, in all probability, the trend is coming to an end. This is accomplished by the magnetic effect of the STH channel. As long as the price range of the trades remain within the short-term channel, not exceeding the lower threshold of the bounding channel, the entire channel will remain attached to the top of the long-term channel. This magnetic effect of the short-term channel provides you with the ability to stay in your trade in the face of small, short-term reversals as long as those price changes don’t drag the STH channel lower. As soon as that occurs, your positive trend is demonstrating weakness and you should shift your trade evaluation to the stiffness histogram indicator show in the same indicator window.
The Stiffness indicator helps determine if you should continue in this trade after the Hurst cycles uncouples. The Stiffness indicator is simply counting the number of bars/days that your equity has remained above a specified moving average (MA) without penetrating that moving average. The indicator utilizes two adjustable variables, both a look-back or length for the moving average and a period of time or window that you are focused on. This is plotted as a series of columns plotted on two scales. Zero to 100 for uptrends (green columns) and 0 to -100 (red columns) for down trends. The period length provides the trader with a window of time that you want to determine if the price is penetrating the moving average you have set. The Stiffness indicator was described in the trading journal; Technical Analysis of Stocks and Commodities, by Markos Katsanos, Nov 25, 2018.
Finally, you can turn on a price line that is recalculated to become constrained within the parameters of the MoTrend indicators -100 to +100 range. This provides the trader the ability to see the relationship of price changes against the MoTrend and Stiffness indicators all in one indicator pane, window.
Access this Genie indicator for your Tradingview account, through our web site. (Links Below) This will provide you with additional educational information and reference articles, videos, input and setting options and trading strategies this indicator excels in.

EMASARPLEASE READ THE FULL DESCRIPTION BEFORE BUYING OR USING THIS INDICATOR
EMASAR (pronounced Emma-sar) is a strategy based on Exponential Moving Averages and the Parabolic SAR . This is a position trading approach that is derived from Tyler Jenks’ Consensio.
This strategy was developed with four objectives in mind: (1) managing risk (2) protecting from missing out on major moves (3) maximizing risk:reward (4) staying in a trending market and taking profit before it fully reverses.
EMASAR does a great job at accomplishing all of the above through the buy and sell signals that are generated. The data provided below is from the signals that occurred on Bitcoin (Bitstamp) from January 1, 2015 to present (November 11, 2019).
(1) Risk is tightly managed, relative to the winners, and losing positions will be exited before the market moves too far against.
The biggest losing trade on Bitcoin, for the time period outlined above, is -18.47%.
(2) Following the EMASAR buy and sell signals guarantees that one will not miss out on a major trend. As a result of the indicators used for this system it is mathematically impossible for a major trend to occur without providing a buy or sell signal. This system isn't meant to catch exact tops or bottoms but it will do a great job of capturing ~85% of a trend.
(3) On average the winning trades will be 5.55 times the losing trades. There will be stretches where the losers are bigger than the winners and this could last for many months, maybe even a year. However, over the long run the average reward is expected to be 5.55 times the average risk*.
*Past performance does not guarantee future results!
(4) This indicator was designed to capitalize on parabolic markets, specifically Bitcoin and alt coins. Crypto markets have a tendency to get moving so fast that many indicators become all but useless.
Entries can get signaled too late and exits will get signaled way too early. This is specifically true when using oscillators that are designed to identify overbought or oversold environments. EMASAR does a great job of keeping us in a position for the duration of a trend and this includes the major parabolic runs that Bitcoin has a tendency to go on.
Take a look at the two charts below which illustrates the buy and sell signals that occurred at the beginning and end of the 2017 and 2019 parabolic moves. Green = Buy | Blue = Exit | Red = Short
Long signaled at $4,190.27 on September 29th, 2017
Exit signaled at $13,647 on January 14th, 2018
Short signaled at $12,050 on January 16th, 2018
Close Short signaled at $3,684 on February 18th, 2019
Long signaled at $3,684 on February 18th, 2019
Exit signaled at $9,614 on July 16th, 2019
Short signaled at $10,328 on July 22nd, 2019
When Bitcoin, or other alts, really get moving it can be very difficult to distinguish between a correction and a full reversal. We do not want to be exiting during a minor correction, instead this is a time when we want to be holding on or looking to buy the dip.
This is a very fragile balance. The market has a very strong tendency to make corrections looks like reversals and to make reversals look like corrections. Therefore it is very important to have a tool(s) that you trust to distinguish in between the two.
I believe that EMASAR is the best way to find that balance - if I knew of a better way then I would be using it instead!
Following these signals will help us to hold onto positions while the market is still trending in our favor when most think that it has moved too far / too fast, and it will also get us out before a market fully reverses.
Keep in mind that there will be times when we exit a market that is in danger of reversing, only to buy back higher later on. That is okay because it enables us to properly manage risk during times of uncertainty and buying back in at a higher price is more than worth the opportunity cost.
Lets look at the signals above in chronological order:
1) Close Long: $2,274
2) Open Short: $2,347
3) Exit Short: $2,934
4) Open Long: $2,766
5) Close Long: $3,124
6) Enter Long: $4,190
A long was closed at $2,274 after Signal #1 and was re-entered after Signal #4 at $2,766. Additionally a long was closed at $3,124 after Signal #5 and was re-entered on the following signal at $4,190. These are examples of some of the bad signals that will occur. Something to pay attention to is the ratio of the risk to the reward. When the market turns against us EMASAR will quickly signal an exit or a re entry.
EMASAR also works great in traditional markets. The S&P 500 has been on a tear lately after creating new all time highs in October of 2019. It has resumed it's strong bull trend and therefore it is a great market to have long exposure to. That being said we are well overdue for a correction and most people, including myself, expect the next bear market to be much more severe than the last two. Therefore I would not want to have long exposure unless equipped with a very reliable method for taking profit before it fully reverses.
Let's take a look at the S&P 500 weekly EMASAR signals using the preferred settings outlined below:
In August of 1990 EMASAR signaled a 'Close Long' at $308. At that time the market was in danger of fully reversing. When that didn't happen EMASAR gave a signal to re enter at $369 which resulted in losing 19.8% in opportunity cost. That is quite okay because it would have allowed us to properly protect ourselves in the event that the market proceeded to crash. Instead we entered a massive bull market that culminated in the dot com bubble. Notice how EMASAR kept us in for the entire duration of that bull run and then signaled an exit very close to the top at $1,294. It got us back in by the end of 2004 after the market had bottomed. Yet again it kept us in for the following multi year bull market before signaling an exit very close to the top at $1,270.
The action that followed in 2016 looks very similar to what happened in 1990 - 1991. An exit was signaled when the market was in danger of fully reversing. When that didn't happen a re entry was signaled 14% higher. Now the market appears to be taking off in another parabolic advance. There is no way to know how far this next run will go or how long it will last. Nevertheless I feel highly confident that I will be able to hold on for the majority of the trend and then get fully out before it reverses thanks to the signals provided by EMASAR.
When looking at the signals on Gold we will notice striking similarities to the signals in the S&P 500 as well as Bitcoin.
Notice how an entry was signaled very close to the bottom at $323 in June of 2002. An exit was also signaled very close to the top at $1,441 in April of 2013. Throughout that runup there was one bad signal that cost some opportunity. It's very important to understand that missing out on opportunity is well worth the price because it allows us to effectively manage risk. EMASAR also recently provided a long signal at $1,401 which preceded this recent runup.
Settings
Default settings work best for crypto, however the time multiplier should be adjusted for markets that are not open 24/7. For commodities and FOREX my default is 40 and for stocks I use 24. The Moving Averages can be adjusted as well. The period can be changed and you can also select SMA or EMA. I always use the EMA's and strongly prefer the 50 and 200. We have noticed good results with the 9 and 54 EMA's as well. The shorter the period that the Moving Average is set to the more frequent the signals will be. This will generally improve risk:reward while decreasing strike rate. For crypto the best time frames are the 4h and 6h. For traditional markets the best time frames are the Daily, 3D and Weekly. EMASAR can be used on smaller time frames as well, specifically in crypto. The 15m and 1h have shown good results.
Risks
The biggest risks with trading EMASAR revolve around disobeying the signals. Risk management is built into this system with the exit signals that will occur, however it is up to the individual to execute those signals. Passing on an exit signal could lead to a big loss which would have a dramatic impact on the ROI. Most trading systems will have small and medium losses with small, medium and large wins. That is exactly how this works. The small - medium losses and wins will mostly be a wash and will account for roughly 80% of the trades. The large wins will happen about 20% of the time and will make up 80% - 90% of the profits.
Therefore the two biggest risks are passing on signals entirely, or exiting preemptively. Getting chopped in and out of a market can be quite frustrating. If you become overwhelmed with negative emotions then it could cause you to pass up on the next signal. That signal will often be the one that more than makes up for the small - medium losses that preceded.
On average EMASAR will provide one signal every 6 weeks when using the default settings on the 4h chart. Therefore missing one entry could turn an otherwise profitable year into a loser. If electing to trade a system, whether it is EMASAR or another, it is crucial to commit to taking every signal regardless of outside variables (namely your personal bias about market direction or frustration that follows a losing stretch).
Another major risk with this system is taking too much profit too soon. When getting into a trade that has the potential to be a big winner it can be challenging to continue holding through the swings. Anyone that has watched paper profits vanish will be inclined to start exiting after the market makes a big move in his or her favor. While this is better than watching profits completely evaporate, this mistake can be enough to turn a profitable system into one that loses to the market. If 80% - 90% of our profits come from 10% - 20% of our trades then it is vital we do not cut those positions off at the knees.
If taking too much profit too soon then you will consistently turn potential large winners into medium winners. This may lead to making money over the long run which will make it very difficult to realize that anything is wrong. However making money and beating the market are two very different things. Exiting early and making money is nearly as big of a risk as missing entries entirely.
If you have the discipline to execute signals in a timely manner after they are triggered and the emotional control to let the winners run despite the appearance of a vastly overbought / oversold market, then you should have what it takes to beat the market with EMASAR.
If you are not an experienced trader then it is very important to start out small. The only way to learn is to trade in a live environment and the only way to succeed is to risk much less than you can afford to lose. If you have $2,000 to trade with then start with a maximum position size of $20 - $50 and don’t be shy about scaling that down even further. Focus on ROI instead of actual dollars made. If you can return 100% on a $20 roll then you should be able to do the same with a $2,000 roll.
Important Notes
Make sure that you read / understand the risks outlined above. If you jump into this without understanding the unique risks that this system entails then you are going to have a bad time.
This indicator was developed around the 4h and that is where it works best. For crypto adjusting to higher TF’s will cause for bad results as the entries / exits will be late to the party. For traditional markets the Daily - Weekly time frames are preferred. It was not originally intended for smaller TF's but we have seen some good results on the 15m and 1h. The RSI can be a great compliment when using on smaller TF's. Adding a rule for not entering when RSI > 75 or < 25 and instead entering when RSI retests 50 will help to avoid some bad signals.
Alerts can be set for this indicator. Simply make sure that it is visible on the chart, then click the alert icon on the top panel. In the first dropdown set 'Condition' to 'EMASAR' and the second 'Condition' for the upcoming signal. For example if just entered long then set the second condition to 'Close Long' and you will be notified as soon as that signal occurs. If waiting for the next long entry then set the second condition to 'Open Long' so on and so forth. There is an 'All in One' alert that is also available. If you select that then you will be alerted any time that a signal occurs. The message will tell you to check the chart to see which signal caused the alert.
How to Buy
The EMASAR Indicator is available for purchase on my website. The link can be found in my signature or in the tagline of my Trading View profile.
The price is $500 per year which is only payable in Bitcoin. That also includes access to a private Telegram group.

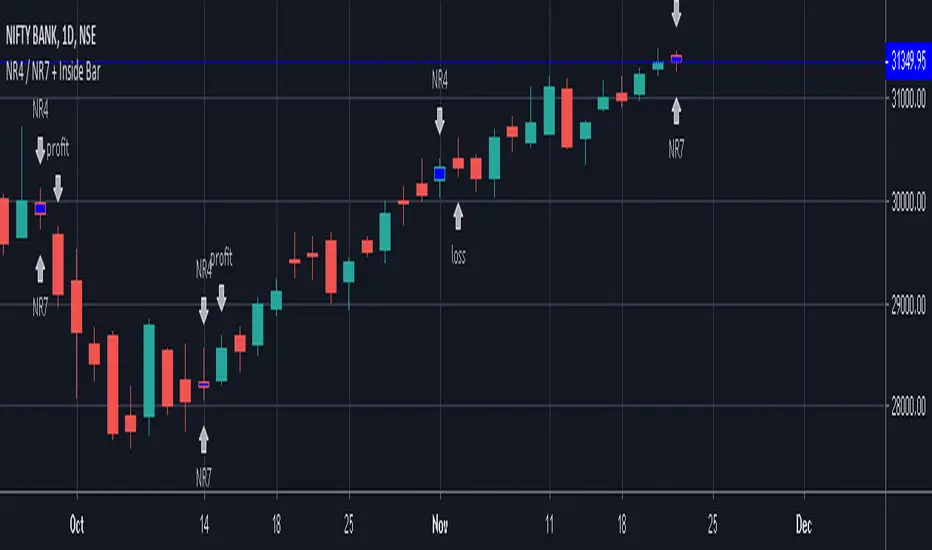
NR4 / NR7 + Inside BarIndicator Script for identifying Narrow Range 4 / 7 + Inside Bar
It also helps to check whether NR4 / NR7 breakout trading has been profitable or not in the past in a particular instrument.
It has helped me to select profitable scripts and avoid losing ones. Can be used for anytime frame.
SIGNAL
NR4 == Narrowest range of 4 periods + signal day is an inside bar
NR4 & NR7 == Narrowest range of 7 periods + signal day is an inside bar
SIGNAL "PROFIT" -
Prior day was NR4 / NR7 and next day price broke out of prior day range in 1 direction and closed in the direction of breakout away from breakout price, resulting in a profit trade.
SIGNAL "LOSS" -
Prior day was NR4 / NR7 and next day price broke out of prior day range and returned back to close inside the narrow zone OR went in opposite direction after the initial breakout, resulting in a loss trade.
SPY Weekly Trading Strategy - ARK IndicatorDisclaimer: This is not financial advise, please consult with your licensed Financial Advisor for investment advise
Hello everyone,
This Script is designed to spot trends and provide you with an entry and exit points.
Rules of Trading with this Indicator:
1- The best risk/reward ratio of this indicator is that you buy at the very first buy Signal "B" and Sell at the very first Sell Signal "S"
2- and Repeat ....as simple as that
Few notes:
1- The repeats of the buy/sell signal are just confirmation of the the trend so to maximize the chances of being profitable, always start when the trend flips (From Sell to buy and vice versa).
2- No signal indicates that you maybe on an up/down trend depending on what the last signal was but the trend is starting to get weak
3- Once a trend is spotted by the algorithm, it will plot a line to establish, entry and exit depending on the direction of the trend (green for buying and red for selling)
4- you will notice that during up trend since the indicator recommends buying only entry points will be suggested with the help of a green line to give you an exact entry point, it is important that the price reaches that entry point for you to pull the trigger, however once the trend gets exhausted it will start to plot a red line so you are mentally prepared that a counter trend might be just around the corner (this is a pretty useful feature)
5- Recommended Settings: The most important setting that you need to be mindful of is "Signal Frequency", based on my observation so far, 2 works best with Weekly & monthly Charts, 8 with Daily Charts , and 10 with hourly charts or lower. As you know the price of a security depends on countless variables, including but not limited to general market condition, success/failure of the underlying security, and the psychology of the market participants of the security, so you can play around with the signal frequency to see what gives you the optimal/profitable signal in the historical candles.
6- the indicator comes with 3 moving averages since some traders/investors like to use moving averages, if you don't need them feel free to turn them off in the settings. they aren't part of any thing used behind the scene.
any questions feel free to contact me by commenting below.
Note: if you have any useful ideas on how to enhance the indicator, please don't be shy!
Warm regards & best of luck!
Ahmad

Trend Pulse Pro V2Trend Pulse Pro V2 (Non Repaint)
TradingView Account Needed: Free
You don't need to be an expert to use Trend Pulse Pro.
Just follow the signals and that's all and use simple Fibonacci levels to find stop loss and take profit!
You can increase the win rate even more by following some simple technical analysis, for example, when trend breaks (price break signal level) you can use that as support become resistance level (sell) or resistance becomes support (buy):
No complex things. No waste of time.
And although you won't win 100% of the trades (no signals can guarantee that), your trading will surely improve a lot!
Even someone with almost no trading experience can read the simple trading rules given in the included user guide, watch the how-to videos and follow Trend Pulse Pro’s signals to consistently make smarter trades.
With Trend Pulse Pro you will get accurate buy and sell signals every time there is a new trading opportunity so that you never miss any big price movements and makes your trading both easier and more profitable.
How to use the signals and alerts:
Trend Pulse Pro automatically analyze trend and price action to give you a signal when there's a good trade.
These trend signals and alerts are derived from live data but the stability of our code allows it to not repaint.
Trend Pulse Pro allow you to easily determine the trend and will give you buy and sell entry levels.
Works on all markets on all time frames so it's suitable for scalpers, day and swing traders.
If you want more details, the link is in the signature.
Disclaimer:
Past performance is not indicative of future performance. No representation is being made that any results discussed within the service and its related media content will be achieved. All opinions, news, research, analyses, prices or other information is provided as general market commentary and not as investment advice. TradingWalk, their members, shareholders, employees, agents, representatives and resellers do not warrant the completeness, accuracy or timeliness of the information supplied, and they shall not be liable for any loss or damages, consequential or otherwise, which may arise from the use or reliance of the TradingWalk service and its content. © 2019 TradingWalk.
TradingWalk indicators are built for TradingView. TradingWalk is on no way a part of TradingView.

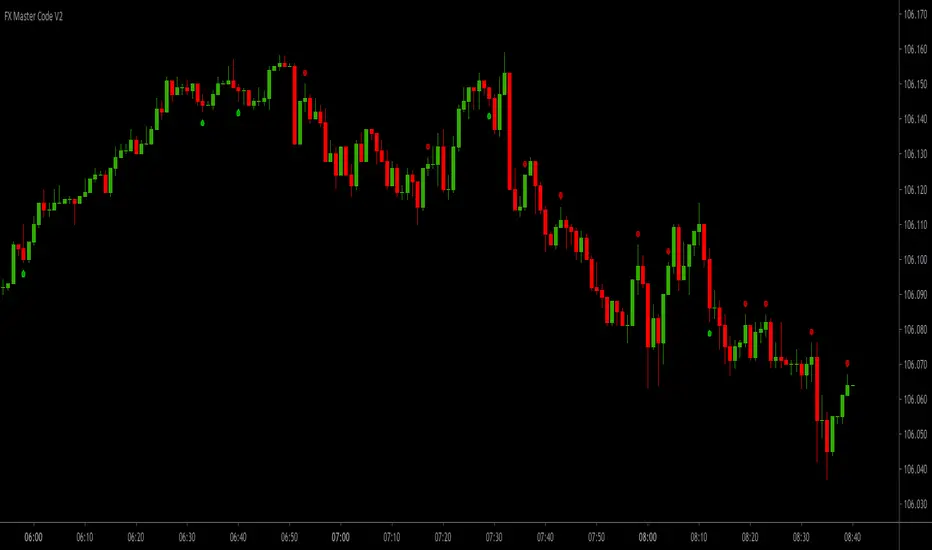
FX Master Code V2FX Master Code V2 (Non Repaint)
TradingView Account Needed: Free
Are you making the making the kind of results you want from trading right now?
Well, if the answer's no, then read this!
Even if you're a complete beginner in trading or an experienced trader, you can use these signals and alerts to start making great results.
The main goal of trading the 1-minute time frame is to make a profit through buying or selling currency pairs by holding a position for a very short period of time, and closing it for a profit.
FX Master Code will give you signals based on my proven and profitable 1-minute trading strategy.
You should be aware that this strategy will demand a certain amount of time and concentration. If you are not able to dedicate at least one hour a day to trade this strategy, then trading the 1-minute chart might not be the best strategy for you.
This is a day trading strategy suitable scalpers and binary options traders, as it involves opening a buy or sell position, gaining a few pips, and then closing the position 3 candlesticks after the signal (3 minute expiration time for binary options).
The exiting aspect of this is quantity. It is not unusual for traders to place more than +10 trades a day (and the more trades you place, the higher returns you can make).
Why not try FX Master Code and see if this system works for you?
The essence of the system will not allow for high losses. We will help you with risk management, use the best-practice risk and trade management for successful trading we give you with FX Master Code.
FX Master Code can be an extremely effective and profitable strategy – even for those who are beginners or use it purely as a supplementary strategy.
What is even better, using this strategy you are rewarded for quantitative work – the more trading you perform, the higher returns you can make.
If you want more details, the link is in the signature.
Disclaimer:
Past performance is not indicative of future performance. No representation is being made that any results discussed within the service and its related media content will be achieved. All opinions, news, research, analyses, prices or other information is provided as general market commentary and not as investment advice. TradingWalk, their members, shareholders, employees, agents, representatives and resellers do not warrant the completeness, accuracy or timeliness of the information supplied, and they shall not be liable for any loss or damages, consequential or otherwise, which may arise from the use or reliance of the TradingWalk service and its content. © 2019 TradingWalk.
TradingWalk indicators are built for TradingView. TradingWalk is on no way a part of TradingView.
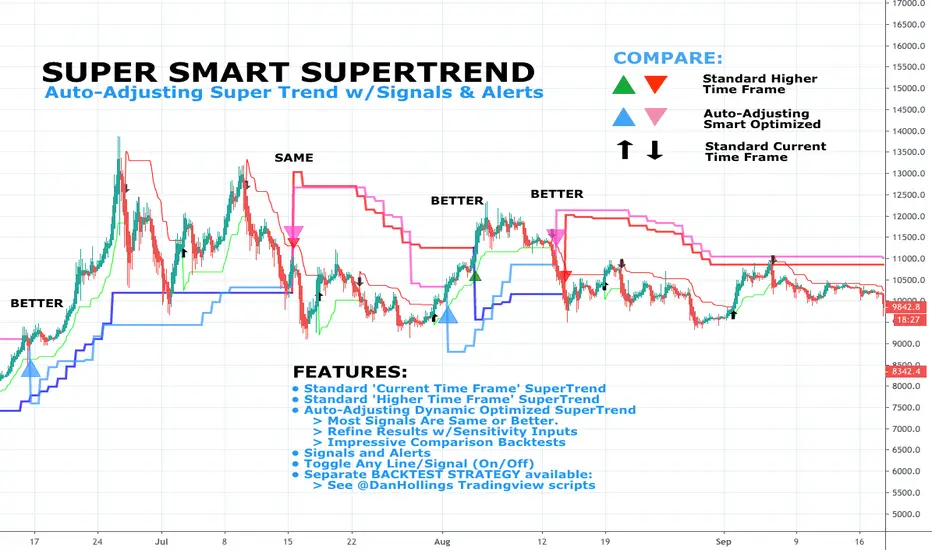
DH: (Study) Super Smart SuperTrend: Self AdjustingSUPER SMART SUPERTREND (Study Version w/Alerts)
Using data from other indicators I came up with a SMART SUPERTREND that auto-adjusts as the market changes - shall we call it "Artificial Intelligence?" Yes, you can fine tune it for specific assets and timeframes, but once the settings are entered, it auto-adjusts as the market and prices evolve.
This is the STUDY version of "Super Smart SuperTrend" with ALERTS. There is also a STRATEGY version which is designed for backtesting various settings.
STRATEGY VERSION FOR BACKTESTING IS HERE
ABOUT THIS INDICATOR
As the name suggests, 'Supertrend' is a trend-following indicator that is notably popular here on Tradingview and elsewhere. It does a remarkably great job of recognizing a trend (in progress) and it will signal you to initiate a position when the trend is clear. Perhaps the greater value of Supertrend is that it helps keep you in your position until that trend is over.
WHAT'S THE BEST ATR PERIOD AND MULTIPLIER?
There are two important data points we must enter for Supertrend to work, namely the 'period (ATR number of candles or days)' and the 'multiplier (value by which ATR is multiplied)' BTW, in case you don't know, ATR signals the degree of price volatility. A common default setting is 10 for the ATR period and 3 for the multiplier.
SORRY, BUT THE MOVIE STARTED HALF HOUR AGO...
Unfortunately Supertrend has a couple of big weaknesses. Generally, it fails in a sideways-moving market and when it does detect a trend, the signal to get in (or out) comes rather late. It's like someone telling you about a great movie they're watching, but by the time you start watching, one-third of the movie is over... bummer, right?
HOW TO IMPROVE SUPERTREND
One solution is to combine Supertrend with other indicators such as MACD, Parabolic SAR, RSI, etc. And another solution is to experiment (backtest) with the Period and Multiplier settings for the asset and timeframe you are considering for trade.
For the STANDARD SETTINGS in this "Super Smart SuperTrend" indicator, I have set 9 for the ATR and 2.2 for the multiplier as default after backtesting on Bitcoin and other crypto (mostly in the 15 minute to 6 HOUR timeframe). Of course you can change this easily to any ATR period and Multiplier you like.
BUT... WHY NOT GET SMART?
I started thinking, it might be best if we let the market determine candle-by-candle what the settings should be. If everyone says that Supertrend works best in conjunction with other indicators, why not do our "conjuncting" programmatically (ie: automatically) sorta like artificial intelligence!
HOW IT WORKS
So here's what I did. Using data from other indicators I came up with a SMART SUPERTREND that auto-adjusts as the market changes. It still has settings so you can fine tune it for specific assets and timeframes, but once the settings are entered, it auto-adjusts as the market and prices evolve.
With "Super Smart SuperTrend" there is no ATR period setting (that is determined programmatically) and now there are TWO multipliers you can experiment with... (a lower one set at 1.7 default and a higher one at 2.5). These multiplier settings create a multiplier range that can be used programmatically to adjust the multiplier as the market and prices evolve.
THE RESULTS
Across all time frames and assets I've tested, I generally get better results. Better entries, better exits and well defined trends. In comparison with a STANDARD Supertrend, it is not radically different, but when it does differ "Super Smart SuperTrend: is almost always better. All this is substantiated by backtesting of course.
SAMPLE BACKTEST RESULTS (BTC/USD)
Using Indicator Defaults
TIMEFRAME STANDARD RESULTS SUPER SMART RESULTS
% Profitable | Profit Factor % Profitable | Profit Factor
DAY 58.33% 9.38 75.00% 10.77
4 HOUR 78.43% 18.22 80.95% 21.78
1 HOUR 74.11% 8.98 70.13% 9.34
15 MIN 58.10% 6.10 71.43% 9.48
Keep in mind that "Profit Factor" is key. It basically tells you what you'd make for every ONE DOLLAR invested by consistently trading with the backtested parameters.
SUPER SMART SUPERTREND FEATURES
• There is a STUDY VERSION w/Alerts
• There is a STRATEGY VERSION for Backtesting
• Standard 'Current Time Frame' SuperTrend Line
• Standard 'Higher Time Frame' SuperTrend Line
• Auto-Adjusting Dynamic Optimized SuperTrend Line
> Most Signals Are Same or Better than Standard
> Refine Results w/Sensitivity Inputs (2 Multipliers)
> Impressive Comparison Backtests
• Both Standard and Smart Signals and Alerts
• Toggle Any Line/Signal (On/Off)
• Toggle Backtest
> Standard vs. "Smart Auto-Adjust"
> Backtest Higher Timeframe Only
WHAT MORE COULD YOU ASK FOR?
So glad you asked. Actually, there is more... Super Smart SuperTrend is incorporated into my premier indicator set called: STONEHENGE PLUS: SUPERTREND TRADING TOOLKIT.
With STONEHENGE, I'm combining this Super Smart SuperTrend with dozens of other indicators plus predictive "Stones." Check out STONEHENGE... you'll be in Trader's Heaven.
That's it. Get "SMART" Today!
STONEHENGE PLUS:
The Complete SuperTrend Trading Toolkit
SUPER SMART SUPERTREND ALSO WORKS WITH:
STONEHENGE BASIC: Double Stone Version (Study w/Alerts):
######
######
PLEASE HIT THE LIKE BUTTON (and follow me... lots of great stuff in the works!)
As always, I appreciate your support. Please share with others.
ENJOY!
Dan Hollings
Master Crypto Grid Trader
Stonehenge Master Mason
Host of the "High Leverage Lounge"
Please Explore My Other Indicators, Scripts, Grids and Educational Ideas.
@DanHollings on Tradingview.
Additional Links Below...
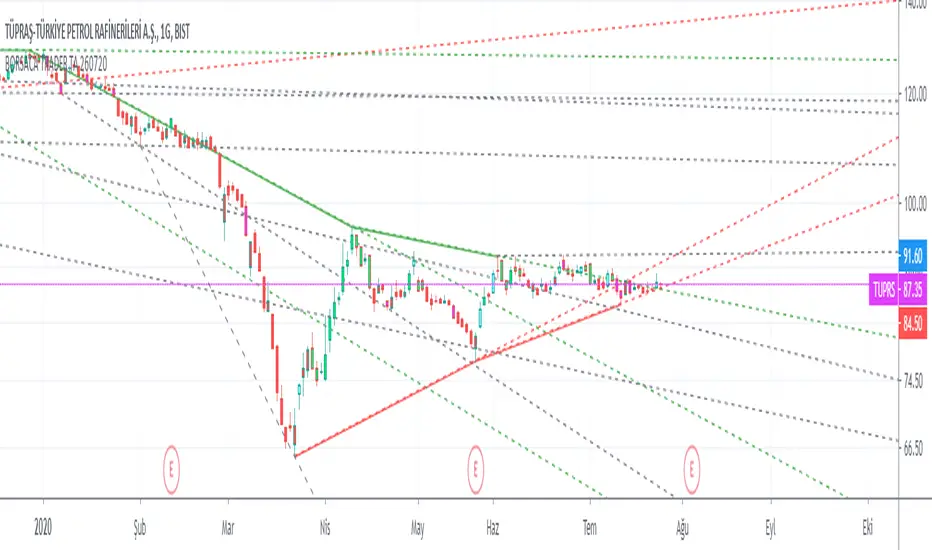
BORSACA TRADERBORSACA TRADER does NOT REPAINT. If the signal occurs it will be forever. Easy and profitable strategy optimized for Crypto, Foreks and Stock Markets...
This indicator gives you Long and Exit signals all timeframes...
BORSACA TRADER is optimized to catch trend movements as soon as possible and maximize profitability.
Strategy tester results. 96% Profitable on BTCUSD Daily scale. Test other markets you want.
WE RELY ON OUR INDICATOR TO THE END. AND WE ASSURE YOU THERE IS NOTHING BETTER THAN THE BORSACA TRADER INDICATOR.
Best regards and happy trading.
Herif's winning strategy option. Check the strategy tester results success than %96
Safe Mode as optional parameter. You can enable this to prevent some riskier trades to happen at the cost of some profitability. Use it if you are more conservative in trading.
Normal Mode signals for Buy and Sell. Trade Mode signals for buy and sell use with support and resistance levels.
Auto Support And Resistance ..
Auto Fibonacci Levels...
BORSACA TRADER indicator is the best option for everybody in financial markets. Check my Profile Page for more information and follow me, like and favorite my indicator and support your positive response and take a message for 10 days trial.
UPDATED PINE SCRIPT V4
Happy trading. Good luck :)