That One Indicator (Free) - [Backtester]This Backtester comes with the following indicators:
Bollinger Bands
ADX
Moving Average Trend Confirmation Filter ( EMA , SMA , DEMA , TEMA , WMA , VWMA , SMMA , HullMA, LSMA , ALMA , SSMA, TMA, ZLEMA )
And a few more indicators in the back-end to increase accuracy
This strategy works really well as a scalper on lower Time Frames as well as on higher Time Frames. Besides that you can also trade it on pretty much any coin or asset.
The alerts script is not repainting. We advise to use alerts on “Once Per Bar Close”.
If you’d like to automate this strategy you can do that by using our alerts script with AutoView, ProfitView, ProfitTrailer, CryptoHopper etc.
Alerts are set very clearly as Long and Short to avoid confusion.
Feel free to leave a comment and share it with your friends.
"profit" için komut dosyalarını ara

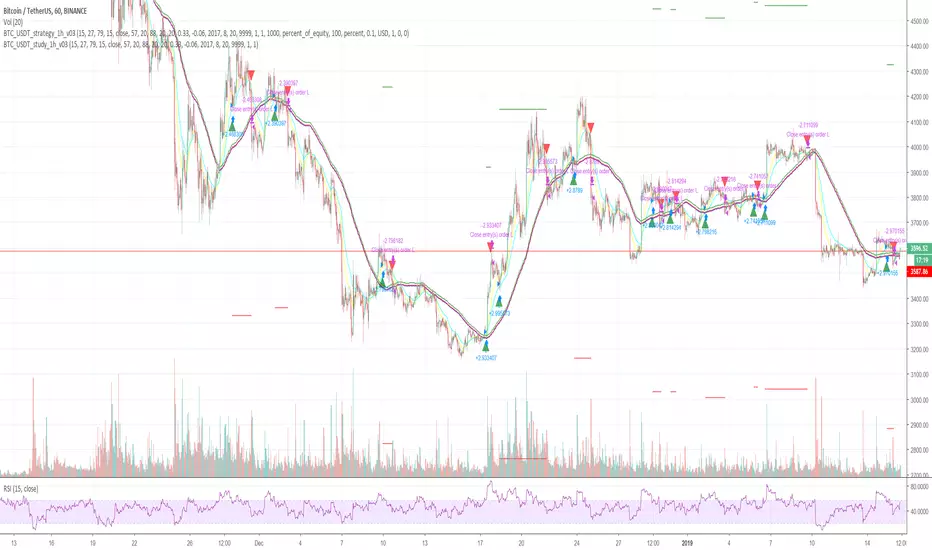
DH: (Strategy) Super SmartSuper Trend: Backtest VersionSUPER SMART SUPERTREND (Strategy Version w/ Backtesting)
Across all time frames and assets I've tested, this indicator gives me better results... Better entries, better exits and well defined trends. In comparison with a STANDARD Supertrend, it is not radically different, but when it does differ "Super Smart SuperTrend" is almost always better.
This is the STRATEGY version of "Super Smart SuperTrend" ready for your backtesting. There is also a STUDY version with ALERTS which might be better for live trading if you want Alerts.
STUDY VERSION WITH ALERTS IS HERE
##################################
##################################
ABOUT THIS INDICATOR
As the name suggests, 'Supertrend' is a trend-following indicator that is notably popular here on Tradingview and elsewhere. It does a remarkably great job of recognizing a trend (in progress) and it will signal you to initiate a position when the trend is clear. Perhaps the greater value of Supertrend is that it helps keep you in your position until that trend is over.
WHAT'S THE BEST ATR PERIOD AND MULTIPLIER?
There are two important data points we must enter for Supertrend to work, namely the 'period (ATR number of candles or days)' and the 'multiplier (value by which ATR is multiplied)' BTW, in case you don't know, ATR signals the degree of price volatility. A common default setting is 10 for the ATR period and 3 for the multiplier.
SORRY, BUT THE MOVIE STARTED HALF HOUR AGO...
Unfortunately Supertrend has a couple of big weaknesses. Generally, it fails in a sideways-moving market and when it does detect a trend, the signal to get in (or out) comes rather late. It's like someone telling you about a great movie they're watching, but by the time you start watching, one-third of the movie is over... bummer, right?
HOW TO IMPROVE SUPERTREND
One solution is to combine Supertrend with other indicators such as MACD, Parabolic SAR, RSI, etc. And another solution is to experiment (backtest) with the Period and Multiplier settings for the asset and timeframe you are considering for trade.
For the STANDARD SETTINGS in this "Super Smart SuperTrend" indicator, I have set 9 for the ATR and 2.2 for the multiplier as default after backtesting on Bitcoin and other crypto (mostly in the 15 minute to 6 HOUR timeframe). Of course you can change this easily to any ATR period and Multiplier you like.
BUT... WHY NOT GET SMART?
I started thinking, it might be best if we let the market determine candle-by-candle what the settings should be. If everyone says that Supertrend works best in conjunction with other indicators, why not do our "conjuncting" programmatically (ie: automatically) sorta like artificial intelligence!
HOW IT WORKS
So here's what I did. Using data from other indicators I came up with a SMART SUPERTREND that auto-adjusts as the market changes. It still has settings so you can fine tune it for specific assets and timeframes, but once the settings are entered, it auto-adjusts as the market and prices evolve.
With "Super Smart SuperTrend" there is no ATR period setting (that is determined programmatically) and now there are TWO multipliers you can experiment with... (a lower one set at 1.7 default and a higher one at 2.5). These multiplier settings create a multiplier range that can be used programmatically to adjust the multiplier as the market and prices evolve.
THE RESULTS
Across all time frames and assets I've tested, I generally get better results. Better entries, better exits and well defined trends. In comparison with a STANDARD Supertrend, it is not radically different, but when it does differ "Super Smart SuperTrend: is almost always better. All this is substantiated by backtesting of course.
SAMPLE BACKTEST RESULTS (BTC/USD)
*Using Indicator Defaults*
TIMEFRAME STANDARD RESULTS SUPER SMART RESULTS
% Profitable | Profit Factor % Profitable | Profit Factor
DAY 58.33% 9.38 75.00% 10.77
4 HOUR 78.43% 18.22 80.95% 21.78
1 HOUR 74.11% 8.98 70.13% 9.34
15 MIN 58.10% 6.10 71.43% 9.48
Keep in mind that "Profit Factor" is key. It basically tells you what you'd make for every ONE DOLLAR invested by consistently trading with the backtested parameters.
SUPER SMART SUPERTREND FEATURES
• There is a STUDY VERSION w/Alerts
• There is a STRATEGY VERSION for Backtesting
• Standard 'Current Time Frame' SuperTrend Line
• Standard 'Higher Time Frame' SuperTrend Line
• Auto-Adjusting Dynamic Optimized SuperTrend Line
> Most Signals Are Same or Better than Standard
> Refine Results w/Sensitivity Inputs (2 Multipliers)
> Impressive Comparison Backtests
• Both Standard and Smart Signals and Alerts
• Toggle Any Line/Signal (On/Off)
• Toggle Backtest
> Standard vs. "Smart Auto-Adjust"
> Backtest Higher Timeframe Only
WHAT MORE COULD YOU ASK FOR?
So glad you asked. Actually, there is more... Super Smart SuperTrend is incorporated into my premier indicator set called: STONEHENGE PLUS: SUPERTREND TRADING TOOLKIT.
By combining Super Smart SuperTrend with dozens of other indicators plus the predictive "Stones" of Stonehenge, you'll be in Trader's Heaven.
That's it. Get "SMART" Today!
STONEHENGE PLUS:
The Complete SuperTrend Trading Toolkit
#################################
#################################
SUPER SMART SUPERTREND ALSO WORKS WITH:
STONEHENGE BASIC: Double Stone Version (Study w/Alerts):
PLEASE HIT THE LIKE BUTTON (and follow me... lots of great stuff in the works!)
As always, I appreciate your support. Please share with others.
ENJOY!
Dan Hollings
Master Crypto Grid Trader
Stonehenge Master Mason
Host of the "High Leverage Lounge"
Please Explore My Other Indicators, Scripts, Grids and Educational Ideas.
@DanHollings on Tradingview.
Additional Links Below...

PD Crypto Performer (Backtest)Description:
This is the backtesting version of the PD Crypto Performer (Alert) . The strategy assumes the same capital amount invested ($10,000) each trade. You can also see how your capital grows over time by enabling the reinvesting proceeds option. For details, please check out this tutorial . The backtesting results could be easily improved in live trading by following the recommended methods of use below.
To assist the decision-making process, the code currently references BTCUSD. As a result, it is only suitable for crypto traders. However, we are working on the stock and forex versions, and the Performer will have these compatibilities soon.
Most importantly, our signals DO NOT REPAINT !
Recommended Use:
- Time Frame: 1HR
- Asset: Large cap crypto assets.
For lower risk tolerance, we recommend using the indicator on ETHUSD. For maximizing profits, we recommend using the indicator on BCHUSD.
- Always set stop loss according to your own risk tolerance
- Take profits along the way.
Recommended Use for Advanced Traders:
- Position sizing:
Larger position if the 1HR signal is in the same direction compared to the 4HR trend.
Smaller position if the 1HR signal is in the opposite direction compared to the 4HR trend.
- Better entry/exit points:
Track the 1HR signal for the asset you are trading on other exchanges along with the BTCUSD 1HR signal. Sometimes, the signals from different exchanges occur with a 1-2 hour difference. You could use these earlier signals along with a lower time frame (eg. 15min) entry confirmation from your own exchange for better entry / exit points.
Go to www.phi-deltalytics.com and sign up for a FREE trial today!
Let us know if you have any questions or recommendations. We are here for your success!
Disclaimer:
It should not be assumed that the methods, techniques, or indicators presented will be profitable or that they will not result in losses. Past results are not necessarily indicative of future results. This is not a solicitation of any order to buy or sell.

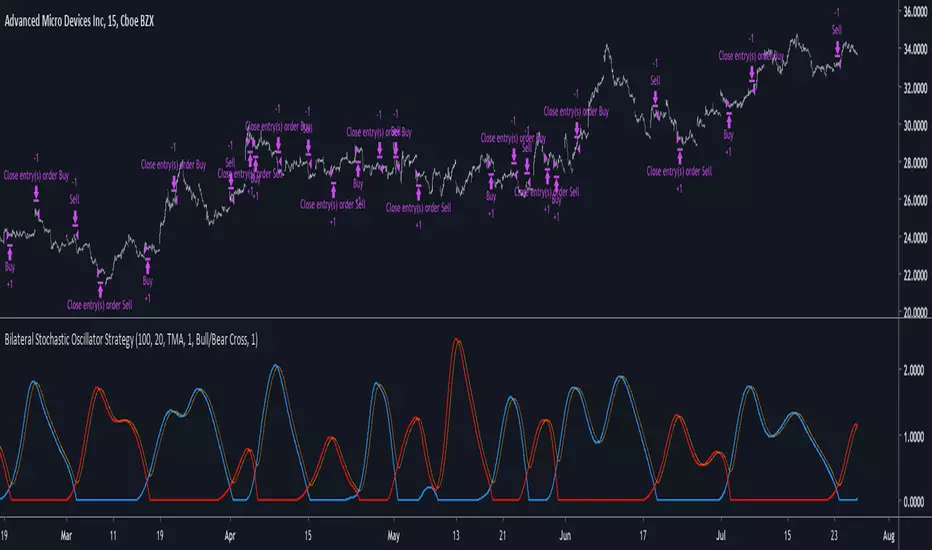
Bilateral Stochastic Oscillator StrategyIntroduction
Strategy based on the bilateral stochastic oscillator, this oscillator aim to detect trends and possible reversal points of the current trend. The oscillator is composed of 1 bull line in blue and 1 bear line in red as well as a signal line in orange, the strategy have many options such as two different strategy framework and a martingale mode. If you require more information about the indicator go check it into my uploaded indicators.
Strategy Frameworks
There are two frameworks available that can be selected from the strategy settings window. Both have the same closing conditions, the "Bull/Bear Cross" entry conditions are :
Buy : when the bull line cross over the bear line
Sell : when the bear line cross over the bull line
The "Signal Cross" entry conditions are :
Buy : when the bull line cross over the signal line
Sell : when the bear line cross over the signal line
Both have the same close conditions that is : close when bull/bear cross under the signal line.
Introduction To Martingale
The martingale money management system consist to double the order size after a loosing trade and can be described as a 2^x where x is the current number of loosing trades since the last win trade, when we win a trade the order size return to the default order size. Therefore our order size function is based on exponential growth.
This system enable the trader to win back his previous losses plus a potential profit, martingales must always be used with stops and sometimes take profits in order to get control in a strategy.
It must always be taken into account that in a series of losses the balance can exponentially decay thus ending to 0 in a matter of trades, this is why it is not recommended to use such system. The strategy allow you to select a martingale multiplier that can be inferior to 2 thus limiting risks, a multiplied of 1 disable the martingale.
Results
Those are the some statistics of the strategy applied to some forex majors by using the default settings in a time frames of 15 minutes.
//-------------------------------------------------------
EURUSD - Order Size 1000 - Spread 0.0002
Profit : $ 21.08
Trades : 19
PP : 57.89 %
Profit Factor : 3.228
Max Drawdown : -$ 3.81
Average Trade : $ 1.11
//-------------------------------------------------------
GBPUSD - Order Size 1000 - Spread 0.0002
Profit : $ 2.31
Trades : 20
PP : 55 %
Profit Factor : 0.938
Max Drawdown : -$ 20.29
Average Trade : $ 0.12
//-------------------------------------------------------
EURAUD - Order Size 1000 - Spread 0.0002
Profit : -$ 9.22
Trades : 20
PP : 40 %
Profit Factor : 0.698
Max Drawdown : -$ 23.44
Average Trade : $ 0.46
//-------------------------------------------------------
EURCHF - Order Size 1000 - Spread 0.0002
Profit : $ 1.58
Trades : 24
PP : 54.17 %
Profit Factor : 1.103
Max Drawdown : -$ 7.23
Average Trade : $ 0.07
//-------------------------------------------------------
Conclusions
Based on the results the strategy does not posses the sufficient performance in order to apply a martingale or any other growth systems as order size. Parameters might be subject to drastic changes depending on the market/time-frame in order to return long-term positive results. I let you draw your conclusions.
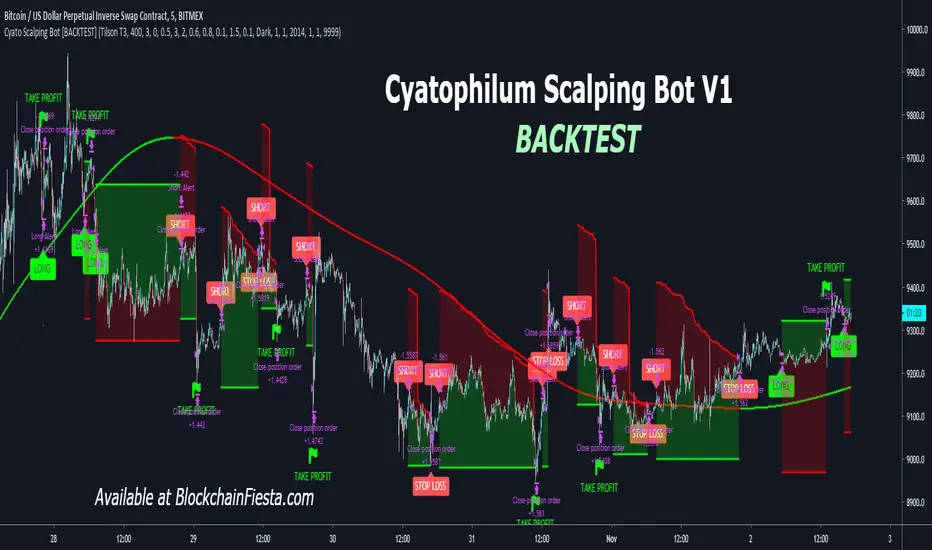
Cyatophilum Scalping Bot [BACKTEST]This indicator triggers Short or/and Long entries and exits.
Example with a Long trade:
The integrated stop loss will trigger an alert to exit the trade.
It is possible that a trend reverses during a trade.
In this case, the "LONG EXIT" alert will trigger at the same
time as the "SHORT ENTRY".
The Trend Detector feature, using EMA or Tilson T3 will filter trades that are against the main trend and thus increase profitability.
BONUS FEATURE
Trailing Take Profit with configurable % deviation.
SAMPLE USE CASES
ETH/BTC
ETH/USD
FOREX: GBP/USD
FOREX: XAU/USD
BTC/USDT
LTC/BTC
XRP/BTC
Read More
> Get access to the Cyatophilum Indicators <
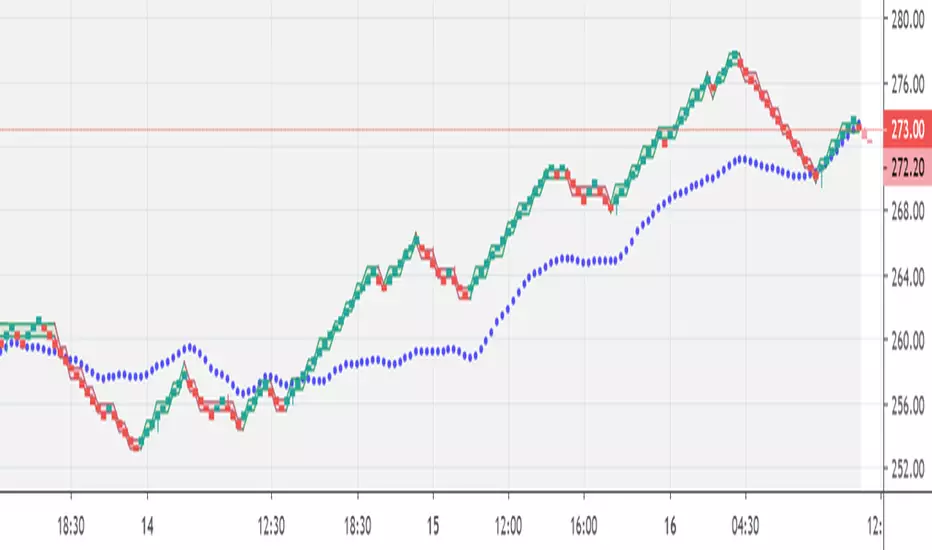
Renko Ghost, v. 2.0Renko Ghost
Custom-designed to take advantage of the smoothing signals from Renko charting, Renko Ghost creates client-side ATR calculations to build an overlay of “ghost” Renko blocks which emulate the popular ATR blocks on top of TradingView’s Traditional Renko charts. By combining constant ATR updates with the “trend anticipation” patterning of our other systems, Renko Ghost can deliver more responsive, finely-tuned reads on market turns. (Check out results below) Contact us for a free trial to test Renko Ghost on your go-to charts. And be sure to check out our other dynamic trading systems.
We are always available for questions, comments, and suggestions. There is always room for improvement.
Results Chart
The backtests below show 1-year returns against a Buy and Hold (B+H) approach for 40 of the world’s top traded instruments (as measured by price volume or similar indicator). The Renko Ghost system was run on the top 10 instruments in four major markets: Equities, ETFs, Cryptocurrencies, and Forex. All tests were on a 30min chart, set to Renko “Traditional” blocks (because TradingView does not support realtime alerts from ATR-based charts). Block size was set proportionately to price to give the instrument positive results, but there was no “cherry-picking”. (In fact, changing time frames would have produced even better returns in some cases, but it seemed best to use a consistent measure.) Subscribers to the system receive a full, step-by-step breakdown on how to customize the parameters to get the best from their favorite markets.
(For each instrument, you see listed its Symbol (name), Profit % (annual return using Renko Ghost), Winning Trade % (being “right”), ProfitFactor (Ratio of money won to money lost), Max Draw Down % (point of worst % loss during the year), and B+H (how much the asset would have returned with no trades, via "buy-and-hold" )...)
Renko Ghost
Settings: 30 min, Traditional Renko box, over 1 year (June 1, 2018 - June 1, 2019)
EQUITIES
Symbol,_.,_.Profit %,_.Trade %,_.Pf,_.Max Dr Dn,_.B + H
AMZN,_.,_.,_.1,874,_.,_.62,_.,_.6.3,_.,_.3,_.,_.,_.,_.7
AAPL,_.,_.,_.,_.141,_.,_.48,_.,_.3.4,_.,_.5,_.,_.,_.,_.5
TSLA,_.,_.,_._6,603,_.,_.58,_.,_.5.6,_.,_.6,_.,_.,_.(-38)
FB,_.,_.,_.,_.,_.170,_.,_.48,_.,_.3,_.,_.,_8,_.,_.,_.(-7)
BABA,_.,_.,_.,_.220,_.,_.56,_.,_.3.2,_.,_.9,_.,_.,_.(-23)
BYND,_.,_.,_.,_.305,_.,_.60,_.,_.7.1,_.,_.5,_.,_.,_,_140
MSFT,_.,_.,_.,_.191,_.,_.57,_.,_.6,_.,_.,_3,_.,_.,_.,,_28
AMD,_.,_.,_.,_.,142,_.,_.45,_.,_.2.3,_.,_13,_.,_.,_.,_,0
NFLX_,_.,_.,_.1,902,_.,_.54,_.,_.1.4,_.,_11,_.,_.,_.,(-5)
BA,_.,_.,_.,_.,_.560,_.,_.54,_.,_.4.9,_.,_.3,_.,_.,_.,,_97
ETFs
Symbol,_.Profit %,_.Trade %,_.Pf,_.Max DrDn,_.B + H
SPY,_.,_.,_.724,_.,_.64,_.,_.,_8.3,_.,_.1,_.,_.,_.4
QQQ,_.,_.2,553,_.,_.63,_.,_.,_9.3,_.,_.1,_.,_.,_.5
EEM,_.,_.,_.340,_.,_.52,_.,_.,_5.5,_.,_.2,_.,_.,_.0
IWM,_.,_.,1,801,_.,_.61,_.,_.,_7.7,_.,_.1,_.,_.,(-3)
HYG,_.,_.,_.,17,_.,_.45,_.,_.,_2.5,_.,_.1,_.,_.,,0.5
EWZ,_.,_.4,855,_.,_.59,_.,_.,_9.2,_.,_.2,_.,_.,_.26
LQD,_.,_.,_.,12,_.,_.48,_.,_.,_1.7,_.,_.2,_.,_.,_.6
EFA,_.,_.,_.192,_.,_.52,_.,_.,_4.9,_.,_.2,_.,_.,_(-7)
FXI,_.,_.,_.669,_.,_.55,_.,_.,_6.3,_.,_.,1,_.,_.,(-15)
XLF,_.,_.,_.287,_.,_.55,_.,_.,_4.8,_.,_.,2,_.,_.,(-3)
CRYPTOCURRENCIES
Symbol,_.,_.Profit %,_.Trade %,_.Pf,_.Max DrDn,_.B + H
BTC/USD,_.22 million,_.,_.54,_.,8.1,_.,_3,_.,_.,_.(-8)
ETH/USD,_.15 million,_.,_.50,_.,5.1,_.,_7,_.,_.,_(-54)
XRP/USD,_.26 million,_.,_.49,_.,4.3,_.,_8,_.,_.,_(-21)
LTC/USD,_.785,000,_.,_.,_50,_.,5,_.,_.,12,_.,_.,_.13
BCH/USD,_.756,000,_.,_.,_46,_.,3.6,_.,15,_.,_.,_.(-5)
EOS/USD,_.258,000,_.,_.,_47,_.,3.5,_.,,27,_.,_.,_.13
BNB/USDT,_22 million,_.,_55,_.,7.3,_.,_.8,_.,_.,_143
BSV/USD,_.170,000,_.,_.,_64,.100,_.,_.,,4,_.,_.,_(-8)
XLM/USD,_.15 billion,_.,_.61,_.,7.7,_.,_.5,_.,_.,_.34
ADA/USD,_.136,000,_.,_.,70,_.20,_.,_.,_.2,_.,_.,_.3
FOREX PAIRS
Symbol,_.,_.Profit %,_.Trade %,_.Pf,_.Max Dr Dn,_.B + H
EUR/USD,_.,_.13,_.,_.,_36,_.,_.,1.5,_.,_.,_2,_.,_.,_(-4)
USD/JPY,_.,_.,,5,_.,_.,_31,_.,_.,1.2,_.,_.,_2,_.,_.,_(-1)
AUD/USD,_.,_.26,_.,_.,_44,_.,_.,2,_.,_.,_.,3,_.,_.,_.10
USD/CAD,_.,_.16,_.,_.,_37,_.,_.,1.6,_.,_.,_2,_.,_.,_.,3
GBP/USD,_.,_.37,_.,_.,_37,_.,_.,1.7,_.,_.,_2,_.,_.,_(-5)
NZD/USD,_.,_.24,_.,_.,_50,_.,_.,2,_.,_.,_.,2,_.,_.,_(-6)
GBP/JPY,_.,_.57,_.,_.,_41,_.,_.,1.8,_.,_.,_3,_.,_.,_(-6)
EUR/JPY,_.,_.19,_.,_.,_39,_.,_.,1.4,_.,_.,_4,_.,_.,_(-5)
AUD/JPY,_.,_.50,_.,_.,_36,_.,_.,1.7,_.,_.,_4,_.,_.,(-10)
EUR/GBP,_.,_.13,_.,_.,_41,_.,_.,1.4,_.,_.,_3,_.,_.,_0.1
TrendMaster Gold, v. 6.2xTrendMaster Gold
The ultimate refinement of last year’s TrendMaster system, TrendMaster Gold takes deep pattern recognition to a new level tracking over 20 indicators triggering seven decision gates to trade in a Renko-smoothed charting environment. Optimized for higher returns over a wider range of instruments (see returns below), you are invited to trial this market-mirroring engine. Subscribers receive full breakdown for fine-tuning results to their market favorites while avoiding bot traps. Reach out by message to get your free trial. We are always available for questions, comments, and suggestions. There’s always room for improvement.
Results Chart
The backtests below show 1-year returns against a Buy and Hold (B+H) approach for 40 of the world’s top traded instruments (as measured by price volume or similar indicator). The TrendMaster system was run on the top 10 instruments in each of four major markets: Equities, ETFs, Cryptocurrencies, and Forex. All tests were on a 30min chart, set to Renko “Traditional” blocks (because TradingView does not support realtime alerts from ATR-based charts). Block size was set proportionately to price to give the instrument positive results, but there was no “cherry-picking”. (In fact, changing time frames would have produced even better returns in some cases, but it seemed best to use a consistent measure.) Subscribers to the system receive a full, step-by-step breakdown on how to customize the parameters to get the best from their favorite markets.
(For each instrument, you see listed its Symbol (name), Profit % (annual return using TrendMaster Gold), Winning Trade % (being “right”), ProfitFactor (Ratio of money won to money lost), Max Draw Down % (point of worst % loss during the year), and B+H (how much the asset would have returned with no trades, via "buy-and-hold" )...)
TrendMaster Gold
Settings: 30 min, Traditional Renko box, over 1 year (June 1, 2018 - June 1, 2019)
EQUITIES
Symbol Profit % Trade % PF Max DrDn B + H
AMZN 2,212 62 6.6 3 7
AAPL 158 49 3.7 5 5
TSLA 8,263 57 5 6 -38
FB 179 47 3 8 -7
BABA 247 56 3.4 9 -23
BYND 348 67 17.9 6 140
MSFT 224 58 6.8 3 28
AMD 171 50 2.6 13 0
NFLX 2,132 55 5.2 11 -5
BA 560 54 4.9 3 97
ETFs
Symbol Profit % Trade % PF Max DrDn B + H
SPY 275 64 5.5 3 4
QQQ 865 62 6.1 3 5
EEM 278 60 5.3 2 0
IWM 783 61 6.1 2 -3
HYG 21 51 2.7 1 0.5
EWZ 798 58 5.6 5 26
LQD 12 54 2 1 6
EFA 121 61 4.5 2 -7
FXI 391 63 5.4 3 -15
XLF 200 58 3.4 5 -3
CRYPTOCURRENCIES
Symbol Profit % Trade % PF Max DrDn B + H
BTC/USD 3 million 55 4.7 8 -8
ETH/USD 2 million 52 4.9 21 -54
XRP/USD 6 million 52 4 13 -16.6
LTC/USD 222,000 54 3 13 13
BCH/USD 380,000 54 4.6 28 -5
EOS/USD 147,000 55 2.7 20 13
BNB/USDT 2 million 54 4.4 14 143
BSV/USD 334,000 65 18 5 -8
XLM/USD 34 million 51 2.8 12 34
ADA/USD 48,000 64 7 6 3
FOREX PAIRS
Symbol Profit % Trade % PF Max DrDn B + H
EUR/USD 13 41 1.3 5 -4
USD/JPY 3 37 1.1 4 -1
AUD/USD 24 43 1.4 4 10
USD/CAD 20 43 1.7 4 3
GBP/USD 36 46 1.8 2 -5
NZD/USD 21 47 1.6 2 -6
GBP/JPY 40 42 1.6 2 -6
EUR/JPY 18 54 3.2 2 -5
AUD/JPY 47 44 1.8 5 -10
EUR/GBP 17 46 1.7 4 0.1

Kozlod - Simple BB Strategy - XBTUSD - 1 minuteReally nice performance for simple BB on XBTUSD Bitmex 1 minute chart.
BB length = 55, BB mult = 4.
No SL or PT used.
Amazingly performance for the last week, 92% profitable. Tested on entire May percent profitable become 80%, still not bad.
And remember:
Past performance does not guarantee future results.

Peak Valley Estimation StrategyIntroduction
Its the first strategy that i post here, so don't expect ground breaking stuff, when testing my indicators i always used prorealtime and not tradingview. This strategy use signals generated by the peak/valley estimator indicator i posted long ago, i think the signals generated where sometimes quite accurate in some markets thus providing potential material for a profitable strategy.
The indicator use 3 parameters, therefore the optimisation process is not easy, but i selected what i judged good parameters values at first glance. The strategy is in its more simple form without stop or anything, the detection of peaks and valley can allow for tighter stops since we expect the price to reverse, but take into account that sops and take profits are parameters subject to optimization process except if selected with strict money management rules and not profit optimization.
Of course trading the strategy in this form is far from being great, if we take into account the market non stationarity then we might expect loss during trending markets. Trend strength indicators could help switch from a reversal to breakout strategy thus maybe providing more control.
I really hope you find an use for the strategy.
Notes
Its been three long years since i started tradingview, and i put more efforts in my indicators than in my studies and life overall, this have created complicated situations and i can't afford to follow up with this, therefore i announce that in the end of june i will leave tradingview for quite a long time, at least until i have my degree. I announce it in advance in case some of you want helps of any kind. I will post all the indicators, both in progress and finished i have made during those three years. I hope you can all understand.
Thanks for reading !

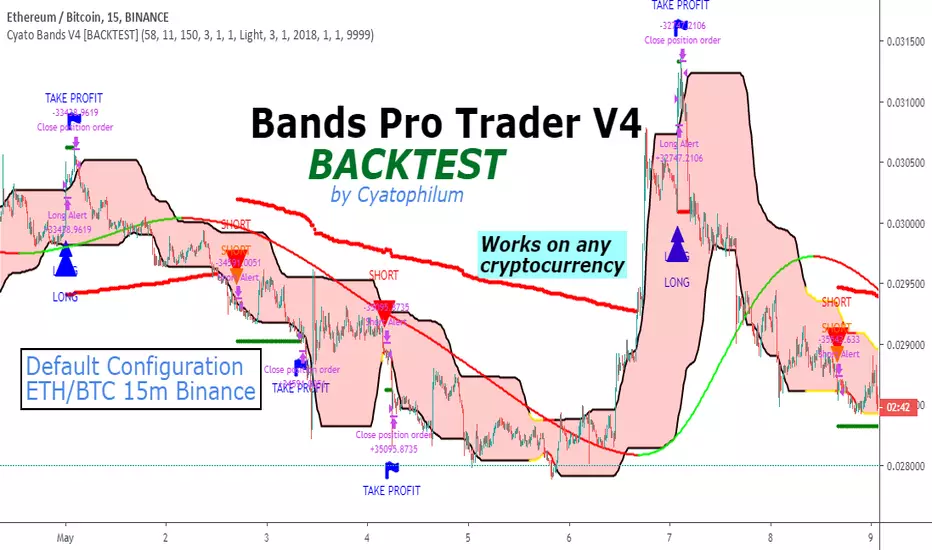
Cyatophilum Bands Pro Trader V4 [BACKTEST]This version includes a new feature, engineered to increase profitability.
About the backtest below:
Short + Long Strategy
0.05% Commission
10% of 10 000% equity per trade. Net Profit can be increased with a bigger % of equity.
Strategy data from 01/11/2019 to 30/04/2019
The Cyatophilum Bands, Trailing Stop Loss and Take Profit System are explained in the last version:
The access to this indicator and its Alert Setup version are included in the Cyatophilum Indicators pack available on my website blockchainfiesta.com
To get a free trial, leave a comment, thank you.

Cryptocurrency trend following EMA Ribbon LONG only strategyThis strategy is based on EMA Ribbon and uses multiple indicators to find optimal time to enter/exit the trade and filter out false signals. The script with default setting is developed mainly for trading altcoins/stable coin pair such as ADA/USDT etc on 4h timeframe but it can be applied to any pair/any timeframe with some settings adjustments.
For plot on chart features make sure that you have both study and strategy scripts on chart with same settings.
Strategy settings description:
1. Signal EMA Length - Value for exponencial moving average (slowest from EMA Ribbon)
1a. Buy price toleration (%) - Price deviation for filtering bounces of EMA - price must close defined percents above EMA to open long trade
1b. Sell price toleration (%) - Price deviation for filtering bounces of EMA - price must close defined percents bellow EMA to close long trade
1c. EMA deelay - EMA id delayed by defined bars for smoothening
2. Filter by Fast EMA - Strategy filters signals to prevent buy while coin is dropping
2a. Fast EMA Length - Value for fast exponencial moving average
3. Filter by SMA - Strategy filters signals to confirm trend change
3a. SMA Length - Value for simple moving average
4. Filter by RSI - Strategy filters signals to prevent buing/selling overbought/oversold coins
4a. RSI Length - Length of RSI identificator
4b. RSI Source candle - What price of candle is used for RSI calculation (open, close, high, low)
4c. RSI Long condition - When buy, RSI indicator must be below this value to prevent of buying already overbought coin
4d. RSI Short condition - When sell, RSI indicator must be above this value to prevent of selling already oversold coin
5. RSI Close Trade Condition - Strategy sell coin once RSI reach defined value
5a. RSI close trade condition - Sell once RSI indicator acquires defined value
6. Close trade by Take Profit or Stop Loss Condition (STRATEGY ONLY) - Strategy sell coin once defined take profit / stoploss level is reached
6a. Take Profit (%) - Take profit value in percent
6b. Stop Loss (%) - Stop loss value in percent
6c. Plot targets on chart - defined targets will be plotted as lines on chart
7. Date range from
7a From Year - To run strategy in interval
7b From Month - To run strategy in interval
7c From Day - To run strategy in interval
8. Date range to
8a To Year - To run strategy in interval
8b To Month - To run strategy in interval
8c To Day - To run strategy in interval
9. Wait to confirm the signal
9a Wait candless to buy - strategy will wait defined candless to confirm the signal before buy
9b Wait candless to sell - strategy will wait defined candless to confirm the signal before sell
10. Plotting on chart (STUDY ONLY)
10a Plot signal line channel with bows on chart
10b Plot simple moving average on chart
10c Plot EMA Ribbon on chart
10d Plot recent support and resistance levels on chart
11. Show Every signal (STUDY ONLY) - Unchecked shows only first signal based on strategy. But if you use take profit/stoploss settings within your bot, you might want to rebuy on next signal. Checked shows signal on each candle.
Throw on chart also buld-in RSI indicator and set the same as strategy
Notice that there might be false signals, especially when the coin is not trending or is strongly manipulated. Overall strategy is profitable though. You just take some minor loses and wont miss the big move.
You may also consider to compare buy&hold return vs profit from trading this strategy. In downtrend as we have seen recently, profit may not be as high as you expect but it is still much better than just hold and hope.
You can use the strategy script for fine tunning settings and find best settings for yourself.
Study script helps you to automate trading with use of alerts perharps with 3commas bot or even trade manually based on email/sms notification setted by tradingview
Notice that study script does not handle takeprofit/stoploss order. That is why sell arrows could be plotted by study script later than strategy script. To rebuy after takeprofit/stop-loss use "11. Show Every signal (STUDY ONLY)" setting
Make sure that you keep same settings for strategy and study scripts.
If you need any help with settings do not hesitate to ask. I would also appriciate any feedback and ideas how to improve this script.
Here is backtest result from 1. Nov 2018 using constant 100USD Buy ammount:

Cryptocurrency trend following LONG only strategyThis strategy uses multiple indicators to find optimal time to enter/exit the trade. The default setting is mainly for trading bitcoin/stable coin pair such as USDT etc on 1h timeframe but it can be applied to any pair/any timeframe with some settings adjustments.
Strategy settings description:
ID Name Descrption
1 FastMA - Value for fast exponencial moving average
2 SlowEMA - Value for slow exponencial moving average
3 SMA - Value for simple moving average
4 RSI Length - Length of RSI identificator
5 RSI Source candle - What price of candle is used for RSI calculation (open, close, high, low)
6 RSI Long condition - When buy, RSI indicator must be below this value to prevent of buying already overbought coin
7 RSI Short condition - When sell, RSI indicator must be above this value to prevent of selling already oversold coin
8 RSI close trade condition - Sell once RSI indicator acquires defined value
9 Take Profit (%) - Take profit value in percent
10 Stop Loss (%) - Stop loss value in percent
11 Long price toleration (%) - Price deviation for filtering bounces of simple moving average - price must close defined percents above SMA to open long trade
12 Short price toleration (%) - Price deviation for filtering bounces of simple moving average - price must close defined percents bellow SMA to close long trade
13 From Year - To run strategy in interval
14 From Month - To run strategy in interval
15 From Day - To run strategy in interval
16 To Year - To run strategy in interval
17 To Month - To run strategy in interval
18 To Day - To run strategy in interval
19 Show every signal? - (Study only) Unchecked shows only first signal based on strategy. But if you use take profit/stoploss settings within your bot, you might want to rebuy on next signal. Checked shows signal on each candle.
Notice that there are also false signals, especially when the coin is not trending or is strongly manipulated. Overall strategy is profitable though. You just take some minor loses and wont miss the big move.
You may also consider to compare buy&hold return vs profit from trading this strategy. In downtrend as we have seen recently, profit may not be as high as you expect but it is still much better than just hold and hope.
You can use the strategy script for fine tunning settings and find best settings for yourself
Study script helps you to automate trading with use of alerts perharps with 3commas bot or even trade manually based on email/sms notification setted by tradingview
Make sure that you keep same settings for strategy and study scripts.
If you need any help with settings do not hesitate to ask. I would also appriciate any feedback and ideas how to improve this script.
Here is backtest result from 23.08.2017:
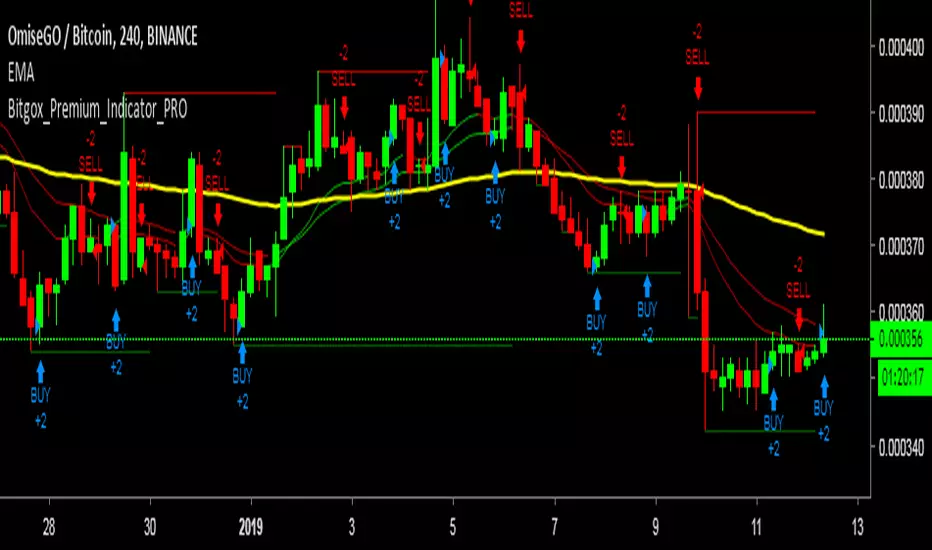
Bitgox_Premium_Indicator_PRO!--- ENGLISH ---
Indicator for cryptocurrencies
Can you use the indicator in other currencies? Of course, but we recommend cryptocurrencies because they are more volatile and you can obtain better results.
The way to use it is very simple, simply follow these steps:
First set the minimum candles in 1h, we recommend using 4h or 1d to get higher results and percentages.
1) Add the indicator to the currency you want to analyze
2) Verify that the currency is volatile, this will give you better results to obtain more percentages.
3) You can also see that the buy and sell indicators have an acceptable% profitability in the previous signals to have an idea of what to expect in said signal.
4) Wait until a buy signal appears and perform the action in your exchange, do not forget to adjust your stop loss!
5) Wait until the sign to sell appears, do not worry you do not have to be all day in the computer, you can buy your positions in the morning and review them in the afternoon.
6) You can also use the indicator in any asset, but we recommend in cryptocurrency since it is more volatile and you can obtain better income.
7) Take control of your trades in a notebook or excel sheet, use a daily risk limit and diversify your capital in 10 or more parts.
Good luck and that the profits come to you in quantity!
---- ESPAÑOL ----
Indicador para criptomonedas
Puede usar el indicador en otras divisas? Claro que si, pero recomendamos criptomonedas porque son más volátiles y se puede obtener mejores resultados.
La forma de utilizarlo es muy sencilla, simplemente siga estos pasos:
Primero configure las velas mínimo en 1h, recomendamos usar 4h o 1d para obtener mayores resultados y porcentajes.
1) Añada el indicador a la moneda que desea analizar
2) Verifique que la moneda sea volatil, esto le dará mejores resultados para obtener más porcentajes.
3) Tambien puede ver que los indicadores de compra y vendan tengan un % aceptable de rentabilidad en las anteriores señales para tener una idea de qué puede esperar en dicha señal.
4) Espere a que aparezca una señal de compra y realice la acción en su exchange, no olvide ajustar su stop loss!
5) Espere a que aparezca la señal para vender, no se preocupe no tiene que estar todo el día en el computador, puede comprar sus posiciones en la mañana y revisarlas en la tarde.
6) Tambien puede usar el indicador en cualquier activo, pero recomendamos en criptomoneda ya que es más volátil y se pueden obtener mejores ingresos.
7) Lleve el control de sus trades en un cuaderno u hoja de excel, use un límite de riesgo diario y diversifique su capital en 10 o más partes.
Buena suerte y que las ganancias vengan hacia usted en cantidad!
SecretSauceForLife X1SecretSauceForLife X1 Is Finally here!
Finally after so much trial and error we have it! Our 3% DD indicator.
This indicator gives 'long' 'short' 'close short' and 'close long' calls, we made this indicator based of the original GODMODE indicator credits to the original author for that!
It was pretty complicated to understand the calls that the indicator gave so we made it easy for you guys. THIS IS STILL AN INDICATOR so not a get rich quick method.
This indicator works best on USD forex pairs, and on BTC, ETH and XRP. It is optimized for scalps and daytrades.
If you don't manage your risk well your account will still be blown.
BUT if you use this indicator next to your own knowledge about charts you should see a significant increase in profitable trades. If there are enough people interested we will make a Chat group where we will add all the people that get this indicator and keep updating you guys on the newest updates and share our own trades taken with this indicator.
We are not advertising this indicator as an flawless signal provider, it does have losing trades but at the end its always in a net profit. We made this to add value to your trading experience so if you think that this is something you want to use send me a PM and we will see if you are committed enough. FYI this is NOT a FREE indicator, but ask yourself this: is it a matter of money or a matter of value? if you need to invest a couple hundred or even a couple thousands
into something that will help you for the rest of your tradinglife does it even matter to pay that price?
So again, we want to help people that take trading seriously and KNOW that trading isn't a get rich quick scheme (if you do it the right way :)). If you can relate to that and you are interested in investing in yourself don't hesitate to shoot me a PM!
Have a nice start of 2019 and don't forget that you are the only one that can make a change to your life, so get up and start today!
***EDIT****
The indicator summary is based of a certain timeframe. Wider and more accurate info PM!

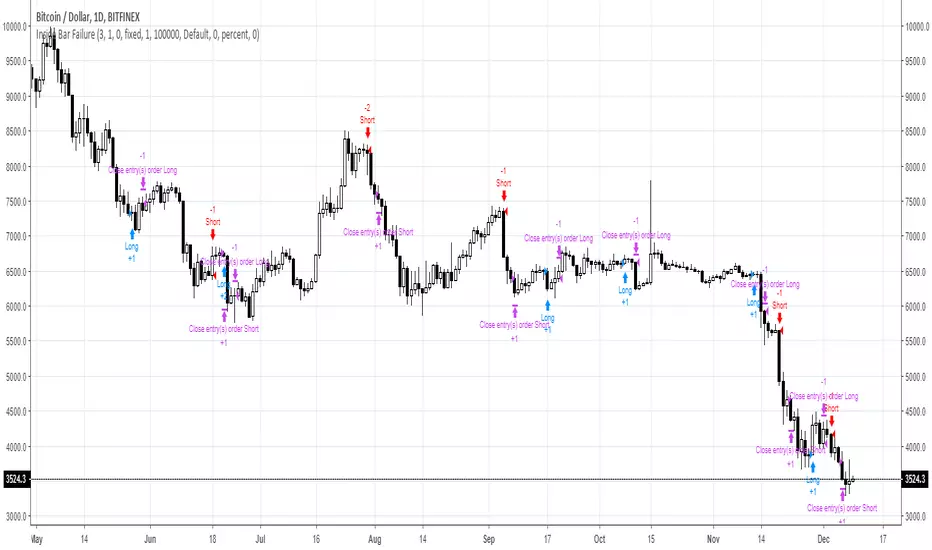
Inside Bar FailureYou can check edge profitability by adjusting the forward looking input, eg. how profitable is this signal after X bars.