Triple EMA Crossover StrategyTriple EMA Crossover Strategy
Overview
The Triple EMA Crossover Strategy is a trend-following trading system that utilizes three Exponential Moving Averages (EMAs) to identify potential entry and exit points in the market. This strategy is based on the principle that when shorter-term prices cross above longer-term prices, it can indicate a bullish trend, and conversely when they cross below, it can signal a bearish trend.
Components
Exponential Moving Averages (EMAs):
Short EMA: A fast-moving average that reacts quickly to price changes (commonly set to 9 periods).
Medium EMA: A medium-term average that smooths out price data and helps confirm trends (commonly set to 21 periods).
Long EMA: A slow-moving average that helps identify the overall trend direction (commonly set to 55 periods).
Trading Signals:
Buy Signal: A long entry is triggered when:
The Short EMA (9) crosses above the Medium EMA (21).
The Medium EMA (21) is above the Long EMA (55).
Sell Signal: A short entry is signaled when:
The Short EMA (9) crosses below the Medium EMA (21).
The Medium EMA (21) is below the Long EMA (55).
Stop Loss and Take Profit:
Stop Loss: Implement a predefined percentage or ATR-based stop loss to limit potential losses.
Take Profit: Set a target based on a risk-to-reward ratio that reflects your trading strategy's goals.
Advantages
Trend Identification: The EMA crossover system allows traders to identify the current trend dynamically, focusing on upward or downward price movements.
Simplicity: The strategy is straightforward, making it accessible for both new and experienced traders.
Flexibility: This method can be applied across multiple timeframes and asset classes, making it versatile for various trading styles.
Disadvantages
Lagging Indicator: Moving averages are lagging indicators, meaning signals may come later than the actual price movement, which can lead to missed opportunities.
Whipsaw Effect: In ranging markets, the strategy may produce false signals leading to potential losses.
"profit" için komut dosyalarını ara

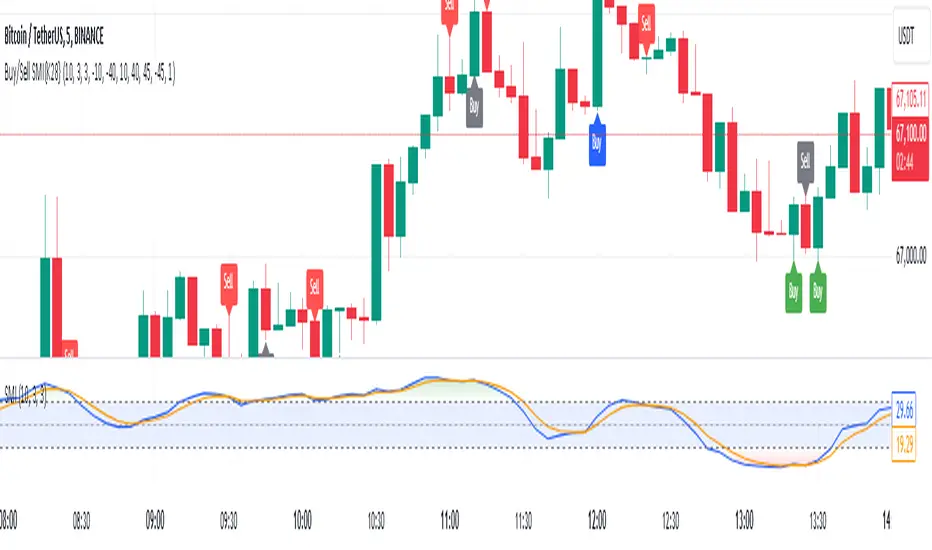
Buy and Sell Signals Based on SMI {K28}Buy/Sell Signals Based on SMI
This indicator provides buy and sell signals based on the Stochastic Momentum Index (SMI) to assist traders in identifying potential entry and exit points in the market. Here’s how to effectively use this indicator:
Usage Instructions:
Signal Interpretation:
No signal is 100% guaranteed
Green Labels: Indicate strong buy signals when the SMI crosses above its EMA, especially if the candle is green (closing price higher than opening price).
Red Labels: Indicate strong sell signals when the SMI crosses below its EMA.
Cautious Signals:
Blue Buy Labels: These buy signals appear when the SMI is in a cautious zone (between -20 and 20). They may not be as reliable, so confirm these signals with other indicators before acting.
Yellow Sell Labels: These buy signals appear when the SMI is in a cautious zone (between -20 and 20). They may not be as reliable, so confirm these signals with other indicators before acting.
Gray Buy and Sell Labels: Indicate potential false signals (when the SMI is overbought or oversold). Use other confirmation indicators to verify these signals.
Trade Strategy:
This indicator is designed for traders looking to make small, consistent profits. Focus on executing more trades rather than waiting for larger price movements.
Be mindful that the indicator may yield frequent signals, so it's essential to maintain discipline and only take trades that meet your criteria for confirmation.
Important Notes:
Caution with Signals: Always exercise caution when acting on blue or gray labels. These may indicate less reliable signals, so it's crucial to confirm with additional indicators.
No Perfect Indicator: Please remember that no trading indicator is perfect. Use this indicator at your own risk, and consider incorporating risk management strategies into your trading plan.
Conclusion:
By employing this SMI indicator, you can enhance your trading strategy focused on generating small, consistent profits through frequent trades. However, always verify signals and stay aware of market conditions to optimize your trading performance.
Price Action StrategyThe **Price Action Strategy** is a tool designed to capture potential market reversals by utilizing classic reversal candlestick patterns such as Hammer, Shooting Star, Doji, and Pin Bar near dinamic support and resistance levels.
***Note to moderators
- The moving average was removed from the strategy because it was not suitable for the strategy and not participating in the entry or exit criteria.
- The moving average length has been replaced/renamed by the support/resistance lenght.
- The bullish engulfing and bearish engulfing patterns were also removed because in practice they were not working as entry criteria, since the candle price invariably closes far from the support/resistance level even considering the sensitivity range. There was no change in the backtest results after removing these patterns.
### Key Elements of the Strategy
1. Support and Resistance Levels
- Support and resistance are pivotal price levels where the asset has previously struggled to move lower (support) or higher (resistance). These levels act as psychological barriers where buying interest (at support) or selling interest (at resistance) often increases, potentially causing price reversals.
- In this strategy, support is calculated as the lowest low and resistance as the highest high over a 16-period length. When the price nears these levels, it indicates possible zones for a reversal, and the strategy looks for specific candlestick patterns to confirm an entry.
2. Candlestick Patterns
- This strategy uses classic reversal patterns, including:
- **Hammer**: Indicates a buy signal, suggesting rejection of lower prices.
- **Shooting Star**: Suggests a sell signal, showing rejection of higher prices.
- **Doji**: Reflects indecision and potential reversal.
- **Pin Bar**: Represents price rejection with a long shadow, often signaling a reversal.
By combining these reversal patterns with the proximity to dinamic support or resistance levels, the strategy aims to capture potential reversal movements.
3. Sensitivity Level
- The sensitivity parameter adjusts the acceptable range (Default 0.018 = 1.8%) around support and resistance levels within which reversal patterns can trigger trades (i.e. the closing price of the candle must occur within the specified range defined by the sensitivity parameter). A higher sensitivity value expands this range, potentially leading to less accurate signals, as it may allow for more false positives.
4. Entry Criteria
- **Buy (Long)**: A Hammer, Doji, or Pin Bar pattern near support.
- **Sell (Short)**: A Shooting Star, Doji, or Pin Bar near resistance.
5. Exit criteria
- Take profit = 9.5%
- Stop loss = 16%
6. No Repainting
- The Price Action Strategy is not subject to repainting.
7. Position Sizing by Equity and risk management
- This strategy has a default configuration to operate with 35% of the equity. The stop loss is set to 16% from the entry price. This way, the strategy is putting at risk about 16% of 35% of equity, that is, around 5.6% of equity for each trade. The percentage of equity and stop loss can be adjusted by the user according to their risk management.
8. Backtest results
- This strategy was subjected to deep backtest and operations in replay mode on **1000000MOGUSDT.P**, with the inclusion of transaction fees at 0.12% and slipagge of 5 ticks, and the past results have shown consistent profitability. Past results are no guarantee of future results. The strategy's backtest results may even be due to overfitting with past data.
9. Chart Visualization
- Support and resistance levels are displayed as green (support) and red (resistance) lines.
- Only the candlestick pattern that generated the entry signal to triger the trade is identified and labeled on the chart. During the operation, the occurrence of new Doji, Pin Bar, Hammer and Shooting Star patterns will not be demonstrated on the chart, since the exit criteria are based on percentage take profit and stop loss.
Doji:
Pin Bar and Doji
Shooting Star and Doji
Hammer
10. Default settings
Chart timeframe: 20 min
Moving average lenght: 16
Sensitivity: 0.018
Stop loss (%): 16
Take Profit (%): 9.5
BYBIT:1000000MOGUSDT.P

Macros ICT KillZones [TradingFinder] Times & Price Trading Setup🔵 Introduction
ICT Macros, developed by Michael Huddleston, also known as ICT (Inner Circle Trader), is a powerful trading tool designed to help traders identify the best trading opportunities during key time intervals like the London and New York trading sessions.
For traders aiming to capitalize on market volatility, liquidity shifts, and Fair Value Gaps (FVG), understanding and using these critical time zones can significantly improve trading outcomes.
In today’s highly competitive financial markets, identifying the moments when the market is seeking buy-side or sell-side liquidity, or filling price imbalances, is essential for maximizing profitability.
The ICT Macros indicator is built on the renowned ICT time and price theory, which enables traders to track and leverage key market dynamics such as breaks of highs and lows, imbalances, and liquidity hunts.
This indicator automatically detects crucial market times and optimizes strategies for traders by highlighting the specific moments when price movements are most likely to occur. A standout feature of ICT Macros is its automatic adjustment for Daylight Saving Time (DST), ensuring that traders remain synced with the correct session times.
This means you can rely on accurate market timing without the need for manual updates, allowing you to focus on capturing profitable trades during critical timeframes.
🔵 How to Use
The ICT Macros indicator helps you capitalize on trading opportunities during key market moments, particularly when the market is breaking highs or lows, filling Fair Value Gaps (FVG), or addressing imbalances. This indicator is particularly beneficial for traders who seek to identify liquidity, market volatility, and price imbalances.
🟣 Sessions
London Sessions
London Macro 1 :
UTC Time : 06:33 to 07:00
New York Time : 02:33 to 03:00
London Macro 2 :
UTC Time : 08:03 to 08:30
New York Time : 04:03 to 04:30
New York Sessions
New York Macro AM 1 :
UTC Time : 12:50 to 13:10
New York Time : 08:50 to 09:10
New York Macro AM 2 :
UTC Time : 13:50 to 14:10
New York Time : 09:50 to 10:10
New York Macro AM 3 :
UTC Time : 14:50 to 15:10
New York Time : 10:50 to 11:10
New York Lunch Macro :
UTC Time : 15:50 to 16:10
New York Time : 11:50 to 12:10
New York PM Macro :
UTC Time : 17:10 to 17:40
New York Time : 13:10 to 13:40
New York Last Hour Macro :
UTC Time : 19:15 to 19:45
New York Time : 15:15 to 15:45
These time intervals adjust automatically based on Daylight Saving Time (DST), helping traders to enter or exit trades during key market moments when price volatility is high.
Below are the main applications of this tool and how to incorporate it into your trading strategies :
🟣 Combining ICT Macros with Trading Strategies
The ICT Macros indicator can easily be used in conjunction with various trading strategies. Two well-known strategies that can be combined with this indicator include:
ICT 2022 Trading Model : This model is designed based on identifying market liquidity, structural price changes, and Fair Value Gaps (FVG). By using ICT Macros, you can identify the key time intervals when the market is seeking liquidity, filling imbalances, or breaking through important highs and lows, allowing you to enter or exit trades at the right moment.
Silver Bullet Strategy : This strategy, which is built around liquidity hunting and rapid price movements, can work more accurately with the help of ICT Macros. The indicator pinpoints precise liquidity times, helping traders take advantage of market shifts caused by filling Fair Value Gaps or correcting imbalances.
🟣 Capitalizing on Price Volatility During Key Times
Large market algorithms often seek liquidity or fill Fair Value Gaps (FVG) during the intervals marked by ICT Macros. These periods are when price volatility increases, and traders can use these moments to enter or exit trades.
For example, if sell-side liquidity is drained and the market fills an imbalance, the price might move toward buy-side liquidity. By identifying these moments, which may also involve breaking a previous high or low, you can leverage rapid market fluctuations to your advantage.
🟣 Identifying Liquidity and Price Imbalances
One of the important uses of ICT Macros is identifying points where the market is seeking liquidity and correcting imbalances. You can determine high or low liquidity levels in the market before each ICT Macro, as well as Fair Value Gaps (FVG) and price imbalances that need to be filled, using them to adjust your trading strategy. This capability allows you to manage trades based on liquidity shifts or imbalance corrections without needing a bias toward a specific direction.
🔵 Settings
The ICT Macros indicator offers various customization options, allowing users to tailor it to their specific needs. Below are the main settings:
Time Zone Mode : You can select one of the following options to define how time is displayed:
UTC : For traders who need to work with Universal Time.
Session Local Time : The local time corresponding to the London or New York markets.
Your Time Zone : You can specify your own time zone (e.g., "UTC-4:00").
Your Time Zone : If you choose "Your Time Zone," you can set your specific time zone. By default, this is set to UTC-4:00.
Show Range Time : This option allows you to display the time range of each session on the chart. If enabled, the exact start and end times of each interval are shown.
Show or Hide Time Ranges : Toggle on/off for visual clarity depending on user preference.
Custom Colors : Set distinct colors for each session, allowing users to personalize their chart based on their trading style.These settings allow you to adjust the key time intervals of each trading session to your preference and customize the time format according to your own needs.
🔵 Conclusion
The ICT Macros indicator is a powerful tool for traders, helping them to identify key time intervals where the market seeks liquidity or fills Fair Value Gaps (FVG), corrects imbalances, and breaks highs or lows. This tool is especially valuable for traders using liquidity-based strategies such as ICT 2022 or Silver Bullet.
One of the key features of this indicator is its support for Daylight Saving Time (DST), ensuring you are always in sync with the correct trading session timings without manual adjustments. This is particularly beneficial for traders operating across different time zones.
With ICT Macros, you can capitalize on crucial market opportunities during sensitive times, take advantage of imbalances, and enhance your trading strategies based on market volatility, liquidity shifts, and Fair Value Gaps.

Bitcoin 100 Pips Indicator 5Bitcoin 100 Pips Indicator
Description: The Bitcoin 100 Pips Indicator is a powerful tool designed for traders who seek to capitalize on rapid price movements in the Bitcoin market. This indicator provides clear entry and exit signals based on a combination of price action analysis and pre-defined profit targets.
Key Features:
Quick Entry and Exit Signals: The indicator generates buy and sell signals in real-time, allowing traders to enter and exit positions quickly and effectively.
Targeting 100 Pips: Specifically designed to target 100 pips of profit for each trade, this indicator sets clear take profit and stop loss levels, helping traders manage their risk and reward effectively.
User-Friendly Interface: With easily visible signals and annotations directly on the chart, the indicator enhances your trading experience without cluttering your view.
Adjustable Settings: Traders can customize the pip target and stop loss levels according to their individual strategies, providing flexibility to accommodate different trading styles.
Ideal for Short-Term Trading: Whether you are a scalper or a day trader, this indicator is optimized for M5 and M15 timeframes, making it ideal for capturing quick price movements in the volatile Bitcoin market.
How to Use:
Apply the Bitcoin 100 Pips Indicator to your chart and select your preferred trading timeframe (M5 or M15).
Look for buy signals indicated by green labels when market conditions favor upward movement.
Conversely, watch for sell signals marked by red labels during downward trends.
Use the provided take profit and stop loss levels to manage your trades effectively.
Disclaimer: This indicator is for informational purposes only and does not guarantee profits. Always practice proper risk management and conduct your own analysis before trading.

Ping Pong Bot StrategyOverview:
The Ping Pong Bot Strategy is designed for traders who focus on scalping and short-term opportunities using support and resistance levels. This strategy identifies potential buy entries when the price reaches a key support area and shows bullish momentum (a green bar). It aims to capitalize on small price movements with predefined risk management and take profit levels, making it suitable for active traders looking to maximize quick trades in trending or ranging markets.
How It Works:
Support & Resistance Calculation:
The strategy dynamically identifies support and resistance levels using the lowest and highest price points over a user-defined period. These levels help pinpoint potential price reversal areas, guiding traders on where to enter or exit trades.
Buy Entry Criteria:
A buy signal is triggered when the closing price is at or below the support level, and the bar is green (i.e., the closing price is higher than the opening price). This ensures that entries are made when prices show signs of upward momentum after hitting support.
Risk Management:
For each trade, a stop loss is calculated based on a user-defined risk percentage, helping to protect against significant drawdowns. Additionally, a take profit level is set at a ratio relative to the risk, ensuring a disciplined approach to exit points.
0.5% Take Profit Target:
The strategy also includes a 0.5% quick take profit target, indicated by an orange arrow when reached. This feature helps traders lock in small gains rapidly, making it ideal for volatile market conditions.
Customizable Inputs:
Length: Adjusts the period for calculating support and resistance levels.
Risk-Reward Ratio: Allows traders to set the desired risk-to-reward ratio for each trade.
Risk Percentage: Defines the risk tolerance for stop loss calculations.
Take Profit Target: Enables the customization of the quick take profit target.
Ideal For:
Traders who prefer an active trading style and want to leverage support and resistance levels for precise entries and exits. This strategy is particularly useful in markets that experience frequent price bounces between support and resistance, allowing traders to "ping pong" between these levels for profitable trades.
Note:
This strategy is developed mainly for the 5-minute chart and has not been tested on longer time frames. Users should perform their own testing and adjustments if using it on different time frames.

Trade Entry Detector, Wick to Body Ratio Trade Entry Detector: Wick-to-Body Ratio Strategy with Bollinger Bands
Overview
The Trade Entry Detector is a custom strategy for TradingView that leverages the Bollinger Bands and a unique wick-to-body ratio approach to capture precise entry opportunities. This indicator is designed for traders who want to pinpoint high-probability reversal points when price interacts with Bollinger Bands, all while offering flexible entry fill options.
The strategy performs primary analysis on the daily time frame, regardless of your current chart setting, allowing you to view daily Bollinger Band levels and entry signals even on lower time frames. This approach is suitable for swing traders and short-term traders looking to align intraday moves with higher time frame signals.
How the Strategy Works
1. Bollinger Band Analysis on the Daily Time Frame
Bollinger Bands are calculated using a 20-period simple moving average (SMA) and a standard deviation multiplier (default is 2). These bands dynamically expand and contract based on market volatility, making them ideal for identifying overbought and oversold conditions:
* Upper Band: Indicates potential overbought levels.
* Lower Band: Indicates potential oversold levels.
2. Wick-to-Body Ratio Condition
This strategy places significant emphasis on candle wicks relative to the candle body. Here’s why:
* A large upper wick relative to the body signals potential selling pressure after testing the upper Bollinger Band.
* A large lower wick relative to the body indicates buying support after testing the lower Bollinger Band.
* Ratio Threshold: You can set a minimum wick-to-body ratio (default is 1.0), meaning that the wick must be at least equal in size to the body. This ensures only candles with significant reversals are considered for entry.
3. Flexible Entry Timing
To adapt to various trading styles, the indicator allows you to choose the entry fill timing:
* Daily Close: Enter at the close of the daily candle.
* Daily Open: Enter at the open of the following daily candle.
* HOD (High of Day): Set entry at the daily high, for those who want confirmation of upward momentum.
* LOD (Low of Day): Set entry at the daily low, ideal for confirming downward movement.
4. Position Sizing and Risk Management
The strategy calculates position size based on a fixed risk percentage of your account balance (default is 1%). This approach dynamically adjusts position sizes based on stop-loss distance:
* Stop Loss: Placed at the nearest swing high (for shorts) or swing low (for longs).
* Take Profit: Exits are triggered when the price reaches the opposite Bollinger Band.
5. Order Expiration
Each pending order (long or short) expires after two days if unfilled, allowing for new setups on subsequent candles if conditions are met again.
Using the Trade Entry Detector
Step-by-Step Guide
1. Set the Primary Time Frame
The core calculations run on the daily time frame, but the strategy can be applied to intraday charts (e.g., 65-minute or 15-minute) for deeper insights.
2. Adjust Bollinger Band Settings
* Length: Default is 20, which determines the period for calculating the moving average.
* Standard Deviation Multiplier: Default is 2.0, which sets the width of the bands. Adjusting this can help you capture broader or tighter volatility ranges.
3. Define the Wick-to-Body Ratio
Set the minimum ratio between wick and body (default 1.0). Higher values filter out candles with less wick-to-body contrast, focusing on stronger rejection moves.
4. Choose Entry Fill Timing
Select your preferred fill condition:
* Daily Close: Confirms the trade at the end of the daily session.
* Daily Open: Executes the entry at the open of the next day.
* HOD/LOD: Uses the daily high or low as an additional confirmation for upward or downward moves.
5. Position Sizing and Risk Management
* Set your account balance and risk percentage. The strategy automatically calculates position sizes based on the stop distance to manage risk efficiently.
* Stop Loss and Take Profit points are automatically set based on swing highs/lows and opposing Bollinger Bands, respectively.
Practical Example
Let’s say SPY (S&P 500 ETF) tests the lower Bollinger Band on the daily time frame, with a lower wick that is twice the size of the body (meeting the 1.0 ratio threshold). Here’s how the strategy might proceed:
1. Signal: The lower wick on SPY suggests buying interest at the lower Bollinger Band.
2. Entry Fill Timing: If you’ve selected "Daily Open," the entry order will be placed at the next day's open price.
3. Stop Loss: Positioned at the nearest daily swing low to minimize risk.
4. Take Profit: If SPY price moves up and reaches the upper Bollinger Band, the position is automatically closed.
Indicator Features and Benefits
* Multi-Time Frame Compatibility: Perform daily analysis while tracking signals on any intraday chart.
* Automatic Position Sizing: Tailor risk per trade based on account balance and desired risk percentage.
* Flexible Entry Options: Choose from close, open, HOD, or LOD for optimal timing.
* Effective Trend Reversal Identification: Uses wick-to-body ratio and Bollinger Band interaction to pinpoint potential reversals.
* Dynamic Visualization: Bollinger Bands are displayed on your chosen time frame, allowing seamless intraday tracking.
Summary
The Trade Entry Detector provides a unique, data-driven way to spot reversal points with customizable entry options. By combining Bollinger Bands with wick-to-body ratio conditions, it identifies potential trade setups where price has tested extremes and shown reversal signals. With its flexible entry timing, risk management features, and multi-time frame compatibility, this indicator is ideal for traders looking to blend daily market context with shorter-term execution.
Tips for Usage:
* For swing trading, consider the Daily Open or Close entry options.
* For momentum entries, HOD or LOD may offer better alignment with the direction of the wick.
* Backtest on different assets to find optimal Bollinger Band and wick-to-body settings for your market.
Use this indicator to enhance your understanding of price behavior at key levels and improve the precision of your entry points. Happy trading!

Gold Scalping Strategy with Precise EntriesThe Gold Scalping Strategy with Precise Entries is designed to take advantage of short-term price movements in the gold market (XAU/USD). This strategy uses a combination of technical indicators and chart patterns to identify precise buy and sell opportunities during times of consolidation and trend continuation.
Key Elements of the Strategy:
Exponential Moving Averages (EMAs):
50 EMA: Used as the shorter-term moving average to detect the recent price trend.
200 EMA: Used as the longer-term moving average to determine the overall market trend.
Trend Identification:
A bullish trend is identified when the 50 EMA is above the 200 EMA.
A bearish trend is identified when the 50 EMA is below the 200 EMA.
Average True Range (ATR):
ATR (14) is used to calculate the market's volatility and to set a dynamic stop loss based on recent price movements. Higher ATR values indicate higher volatility.
ATR helps define a suitable stop-loss distance from the entry point.
Relative Strength Index (RSI):
RSI (14) is used as a momentum oscillator to detect overbought or oversold conditions.
However, in this strategy, the RSI is primarily used as a consolidation filter to look for neutral zones (between 45 and 55), which may indicate a potential breakout or trend continuation after a consolidation phase.
Engulfing Patterns:
Bullish Engulfing: A bullish signal is generated when the current candle fully engulfs the previous bearish candle, indicating potential upward momentum.
Bearish Engulfing: A bearish signal is generated when the current candle fully engulfs the previous bullish candle, signaling potential downward momentum.
Precise Entry Conditions:
Long (Buy):
The 50 EMA is above the 200 EMA (bullish trend).
The RSI is between 45 and 55 (neutral/consolidation zone).
A bullish engulfing pattern occurs.
The price closes above the 50 EMA.
Short (Sell):
The 50 EMA is below the 200 EMA (bearish trend).
The RSI is between 45 and 55 (neutral/consolidation zone).
A bearish engulfing pattern occurs.
The price closes below the 50 EMA.
Take Profit and Stop Loss:
Take Profit: A fixed 20-pip target (where 1 pip = 0.10 movement in gold) is used for each trade.
Stop Loss: The stop-loss is dynamically set based on the ATR, ensuring that it adapts to current market volatility.
Visual Signals:
Buy and sell signals are visually plotted on the chart using green and red labels, indicating precise points of entry.
Advantages of This Strategy:
Trend Alignment: The strategy ensures that trades are taken in the direction of the overall trend, as indicated by the 50 and 200 EMAs.
Volatility Adaptation: The use of ATR allows the stop loss to adapt to the current market conditions, reducing the risk of premature exits in volatile markets.
Precise Entries: The combination of engulfing patterns and the neutral RSI zone provides a high-probability entry signal that captures momentum after consolidation.
Quick Scalping: With a fixed 20-pip profit target, the strategy is designed to capture small price movements quickly, which is ideal for scalping.
This strategy can be applied to lower timeframes (such as 1-minute, 5-minute, or 15-minute charts) for frequent trade opportunities in gold trading, making it suitable for day traders or scalpers. However, proper risk management should always be used due to the inherent volatility of gold.

E9 Shark-32 Pattern Strategy The E9 Shark-32 Pattern is a powerful trading tool designed to capitalize on the Shark-32 pattern—a specific Candlestick pattern.
The Shark-32 Pattern: What Is It?
The Shark-32 pattern is a technical formation that occurs when the following conditions are met:
Higher Highs and Lower Lows: The low of two bars ago is lower than the previous bar, and the previous bar's low is lower than the current bar. At the same time, the high of two bars ago is higher than the previous bar, and the previous bar’s high is higher than the current bar.
This unique setup forms the "Shark-32" pattern, which signals potential volume squeezes and trend changes in the market.
How Does the Strategy Work?
The E9 Shark-32 Pattern Strategy builds upon this pattern by defining clear entry and exit rules based on the pattern's confirmation. Here's a breakdown of how the strategy operates:
1. Identifying the Shark-32 Pattern
When the Shark-32 pattern is confirmed, the strategy "locks" the high and low prices from the initial bar of the pattern. These locked prices serve as key levels for future trade entries and exits.
2. Entry Conditions
The strategy waits for the price to cross the pattern's locked high or low, signaling potential market direction.
Long Entry: A long trade is triggered when the closing price crosses above the locked pattern high (green line).
Short Entry: A short trade is triggered when the closing price crosses below the locked pattern low (red line).
The strategy ensures that only one trade is taken for each Shark-32 pattern, preventing overtrading and allowing traders to focus on high-probability setups.
3. Stop Loss and Take Profit Levels
The strategy has built-in risk management through stop-loss and take-profit levels, which are visually represented by the lines on the chart:
Stop Loss:
Stop loss can be adjusted in settings.
Take Profit:
For long trades: The take-profit target is set at the upper white dotted line, which is projected above the pattern high.
For short trades: The take-profit target is set at the lower white dotted line, which is projected below the pattern low.
These clearly defined levels help traders to manage risk effectively while maximizing potential returns.
4. Visual Cues
To make trading decisions even easier, the strategy provides helpful visual cues:
Green Line (Pattern High): This line represents the high of the Shark-32 pattern and serves as a resistance level and short entry signal.
Red Line (Pattern Low): This line represents the low of the Shark-32 pattern and serves as a support level and long entry signal.
White Dotted Lines: These lines represent potential profit targets, projected both above and below the pattern. They help traders define where the market might go next.
Additionally, the strategy highlights the pattern formation with color-coded bars and background shading to draw attention to the Shark-32 pattern when it is confirmed. This adds a layer of visual confirmation, making it easier to spot opportunities in real-time.
5. No Repeated Trades
An important aspect of the strategy is that once a trade is taken (either long or short), no additional trades are executed until a new Shark-32 pattern is identified. This ensures that only valid and confirmed setups are acted upon.

Fibonacci Swing Trading BotStrategy Overview for "Fibonacci Swing Trading Bot"
Strategy Name: Fibonacci Swing Trading Bot
Version: Pine Script v5
Purpose: This strategy is designed for swing traders who want to leverage Fibonacci retracement levels and candlestick patterns to enter and exit trades on higher time frames.
Key Components:
1. Multiple Timeframe Analysis:
The strategy uses a customizable timeframe for analysis. You can choose between 4hour, daily, weekly, or monthly time frames to fit your preferred trading horizon. The high and low-price data is retrieved from the selected timeframe to identify swing points.
2. Fibonacci Retracement Levels:
The script calculates two key Fibonacci retracement levels:
0.618: A common level where price often retraces before resuming its trend.
0.786: A deeper retracement level, often used to identify stronger support/resistance areas.
These levels are dynamically plotted on the chart based on the highest high and lowest low over the last 50 bars of the selected timeframe.
3. Candlestick Based Entry Signals:
The strategy uses candlestick patterns as the only indicator for trade entries:
Bullish Candle: A green candle (close > open) that forms between the 0.618 retracement level and the swing high.
Bearish Candle: A red candle (close < open) that forms between the 0.786 retracement level and the swing low.
When these candlestick patterns align with the Fibonacci levels, the script triggers buy or sell signals.
4. Risk Management:
Stop Loss: The stop loss is set at 1% below the entry price for long trades and 1% above the entry price for short trades. This tight risk management ensures controlled losses.
Take Profit: The strategy uses a 2:1 risk-to-reward ratio. The take profit is automatically calculated based on this ratio relative to the stop loss.
5. Buy/Sell Logic:
Buy Signal: Triggered when a bullish candle forms above the 0.618 retracement level and below the swing high. The bot then places a long position.
Sell Signal: Triggered when a bearish candle forms below the 0.786 retracement level and above the swing low. The bot then places a short position.
The stop loss and take profit levels are automatically managed once the trade is placed.
Strengths of This Strategy:
Swing Trading Focus: The strategy is ideal for swing traders, targeting longer-term price moves that can take days or weeks to play out.
Simple Yet Effective Indicators: By only relying on Fibonacci retracement levels and basic candlestick patterns, the strategy avoids complexity while capitalizing on well-known support and resistance zones.
Automated Risk Management: The built-in stop loss and take profit mechanism ensures trades are protected, adhering to a strict 2:1 risk/reward ratio.
Multiple Timeframe Analysis: The script adapts to various market conditions by allowing users to switch between different timeframes (4hour, daily, weekly, monthly), giving traders flexibility.
Strategy Use Cases:
Retracement Traders: Traders who focus on entering the market at key retracement levels (0.618 and 0.786) will find this strategy especially useful.
Trend Reversal Traders: The strategy’s reliance on candlestick formations at Fibonacci levels helps traders spot potential reversals in price trends.
Risk Conscious Traders: With its 1% risk per trade and 2:1 risk/reward ratio, the strategy is ideal for traders who prioritize risk management in their trades.

Mean Reversion Cloud (Ornstein-Uhlenbeck) // AlgoFyreThe Mean Reversion Cloud (Ornstein-Uhlenbeck) indicator detects mean-reversion opportunities by applying the Ornstein-Uhlenbeck process. It calculates a dynamic mean using an Exponential Weighted Moving Average, surrounded by volatility bands, signaling potential buy/sell points when prices deviate.
TABLE OF CONTENTS
🔶 ORIGINALITY
🔸Adaptive Mean Calculation
🔸Volatility-Based Cloud
🔸Speed of Reversion (θ)
🔶 FUNCTIONALITY
🔸Dynamic Mean and Volatility Bands
🞘 How it works
🞘 How to calculate
🞘 Code extract
🔸Visualization via Table and Plotshapes
🞘 Table Overview
🞘 Plotshapes Explanation
🞘 Code extract
🔶 INSTRUCTIONS
🔸Step-by-Step Guidelines
🞘 Setting Up the Indicator
🞘 Understanding What to Look For on the Chart
🞘 Possible Entry Signals
🞘 Possible Take Profit Strategies
🞘 Possible Stop-Loss Levels
🞘 Additional Tips
🔸Customize settings
🔶 CONCLUSION
▅▅▅▅▅▅▅▅▅▅▅▅▅▅▅▅▅▅▅▅▅▅▅▅▅▅▅▅▅▅▅▅▅▅▅▅▅▅▅▅▅▅▅▅▅▅
🔶 ORIGINALITY The Mean Reversion Cloud (Ornstein-Uhlenbeck) is a unique indicator that applies the Ornstein-Uhlenbeck stochastic process to identify mean-reverting behavior in asset prices. Unlike traditional moving average-based indicators, this model uses an Exponentially Weighted Moving Average (EWMA) to calculate the long-term mean, dynamically adjusting to recent price movements while still considering all historical data. It also incorporates volatility bands, providing a "cloud" that visually highlights overbought or oversold conditions. By calculating the speed of mean reversion (θ) through the autocorrelation of log returns, this indicator offers traders a more nuanced and mathematically robust tool for identifying mean-reversion opportunities. These innovations make it especially useful for markets that exhibit range-bound characteristics, offering timely buy and sell signals based on statistical deviations from the mean.
🔸Adaptive Mean Calculation Traditional MA indicators use fixed lengths, which can lead to lagging signals or over-sensitivity in volatile markets. The Mean Reversion Cloud uses an Exponentially Weighted Moving Average (EWMA), which adapts to price movements by dynamically adjusting its calculation, offering a more responsive mean.
🔸Volatility-Based Cloud Unlike simple moving averages that only plot a single line, the Mean Reversion Cloud surrounds the dynamic mean with volatility bands. These bands, based on standard deviations, provide traders with a visual cue of when prices are statistically likely to revert, highlighting potential reversal zones.
🔸Speed of Reversion (θ) The indicator goes beyond price averages by calculating the speed at which the price reverts to the mean (θ), using the autocorrelation of log returns. This gives traders an additional tool for estimating the likelihood and timing of mean reversion, making the signals more reliable in practice.
🔶 FUNCTIONALITY The Mean Reversion Cloud (Ornstein-Uhlenbeck) indicator is designed to detect potential mean-reversion opportunities in asset prices by applying the Ornstein-Uhlenbeck stochastic process. It calculates a dynamic mean through the Exponentially Weighted Moving Average (EWMA) and plots volatility bands based on the standard deviation of the asset's price over a specified period. These bands create a "cloud" that represents expected price fluctuations, helping traders to identify overbought or oversold conditions. By calculating the speed of reversion (θ) from the autocorrelation of log returns, the indicator offers a more refined way of assessing how quickly prices may revert to the mean. Additionally, the inclusion of volatility provides a comprehensive view of market conditions, allowing for more accurate buy and sell signals.
Let's dive into the details:
🔸Dynamic Mean and Volatility Bands The dynamic mean (μ) is calculated using the EWMA, giving more weight to recent prices but considering all historical data. This process closely resembles the Ornstein-Uhlenbeck (OU) process, which models the tendency of a stochastic variable (such as price) to revert to its mean over time. Volatility bands are plotted around the mean using standard deviation, forming the "cloud" that signals overbought or oversold conditions. The cloud adapts dynamically to price fluctuations and market volatility, making it a versatile tool for mean-reversion strategies. 🞘 How it works Step one: Calculate the dynamic mean (μ) The Ornstein-Uhlenbeck process describes how a variable, such as an asset's price, tends to revert to a long-term mean while subject to random fluctuations. In this indicator, the EWMA is used to compute the dynamic mean (μ), mimicking the mean-reverting behavior of the OU process. Use the EWMA formula to compute a weighted mean that adjusts to recent price movements. Assign exponentially decreasing weights to older data while giving more emphasis to current prices. Step two: Plot volatility bands Calculate the standard deviation of the price over a user-defined period to determine market volatility. Position the upper and lower bands around the mean by adding and subtracting a multiple of the standard deviation. 🞘 How to calculate Exponential Weighted Moving Average (EWMA)
The EWMA dynamically adjusts to recent price movements:
mu_t = lambda * mu_{t-1} + (1 - lambda) * P_t
Where mu_t is the mean at time t, lambda is the decay factor, and P_t is the price at time t. The higher the decay factor, the more weight is given to recent data.
Autocorrelation (ρ) and Standard Deviation (σ)
To measure mean reversion speed and volatility: rho = correlation(log(close), log(close ), length) Where rho is the autocorrelation of log returns over a specified period.
To calculate volatility:
sigma = stdev(close, length)
Where sigma is the standard deviation of the asset's closing price over a specified length.
Upper and Lower Bands
The upper and lower bands are calculated as follows:
upper_band = mu + (threshold * sigma)
lower_band = mu - (threshold * sigma)
Where threshold is a multiplier for the standard deviation, usually set to 2. These bands represent the range within which the price is expected to fluctuate, based on current volatility and the mean.
🞘 Code extract // Calculate Returns
returns = math.log(close / close )
// Calculate Long-Term Mean (μ) using EWMA over the entire dataset
var float ewma_mu = na // Initialize ewma_mu as 'na'
ewma_mu := na(ewma_mu ) ? close : decay_factor * ewma_mu + (1 - decay_factor) * close
mu = ewma_mu
// Calculate Autocorrelation at Lag 1
rho1 = ta.correlation(returns, returns , corr_length)
// Ensure rho1 is within valid range to avoid errors
rho1 := na(rho1) or rho1 <= 0 ? 0.0001 : rho1
// Calculate Speed of Mean Reversion (θ)
theta = -math.log(rho1)
// Calculate Volatility (σ)
sigma = ta.stdev(close, corr_length)
// Calculate Upper and Lower Bands
upper_band = mu + threshold * sigma
lower_band = mu - threshold * sigma
🔸Visualization via Table and Plotshapes
The table shows key statistics such as the current value of the dynamic mean (μ), the number of times the price has crossed the upper or lower bands, and the consecutive number of bars that the price has remained in an overbought or oversold state.
Plotshapes (diamonds) are used to signal buy and sell opportunities. A green diamond below the price suggests a buy signal when the price crosses below the lower band, and a red diamond above the price indicates a sell signal when the price crosses above the upper band.
The table and plotshapes provide a comprehensive visualization, combining both statistical and actionable information to aid decision-making.
🞘 Code extract // Reset consecutive_bars when price crosses the mean
var consecutive_bars = 0
if (close < mu and close >= mu) or (close > mu and close <= mu)
consecutive_bars := 0
else if math.abs(deviation) > 0
consecutive_bars := math.min(consecutive_bars + 1, dev_length)
transparency = math.max(0, math.min(100, 100 - (consecutive_bars * 100 / dev_length)))
🔶 INSTRUCTIONS
The Mean Reversion Cloud (Ornstein-Uhlenbeck) indicator can be set up by adding it to your TradingView chart and configuring parameters such as the decay factor, autocorrelation length, and volatility threshold to suit current market conditions. Look for price crossovers and deviations from the calculated mean for potential entry signals. Use the upper and lower bands as dynamic support/resistance levels for setting take profit and stop-loss orders. Combining this indicator with additional trend-following or momentum-based indicators can improve signal accuracy. Adjust settings for better mean-reversion detection and risk management.
🔸Step-by-Step Guidelines
🞘 Setting Up the Indicator
Adding the Indicator to the Chart:
Go to your TradingView chart.
Click on the "Indicators" button at the top.
Search for "Mean Reversion Cloud (Ornstein-Uhlenbeck)" in the indicators list.
Click on the indicator to add it to your chart.
Configuring the Indicator:
Open the indicator settings by clicking on the gear icon next to its name on the chart.
Decay Factor: Adjust the decay factor (λ) to control the responsiveness of the mean calculation. A higher value prioritizes recent data.
Autocorrelation Length: Set the autocorrelation length (θ) for calculating the speed of mean reversion. Longer lengths consider more historical data.
Threshold: Define the number of standard deviations for the upper and lower bands to determine how far price must deviate to trigger a signal.
Chart Setup:
Select the appropriate timeframe (e.g., 1-hour, daily) based on your trading strategy.
Consider using other indicators such as RSI or MACD to confirm buy and sell signals.
🞘 Understanding What to Look For on the Chart
Indicator Behavior:
Observe how the price interacts with the dynamic mean and volatility bands. The price staying within the bands suggests mean-reverting behavior, while crossing the bands signals potential entry points.
The indicator calculates overbought/oversold conditions based on deviation from the mean, highlighted by color-coded cloud areas on the chart.
Crossovers and Deviation:
Look for crossovers between the price and the mean (μ) or the bands. A bullish crossover occurs when the price crosses below the lower band, signaling a potential buying opportunity.
A bearish crossover occurs when the price crosses above the upper band, suggesting a potential sell signal.
Deviations from the mean indicate market extremes. A large deviation indicates that the price is far from the mean, suggesting a potential reversal.
Slope and Direction:
Pay attention to the slope of the mean (μ). A rising slope suggests bullish market conditions, while a declining slope signals a bearish market.
The steepness of the slope can indicate the strength of the mean-reversion trend.
🞘 Possible Entry Signals
Bullish Entry:
Crossover Entry: Enter a long position when the price crosses below the lower band with a positive deviation from the mean.
Confirmation Entry: Use additional indicators like RSI (above 50) or increasing volume to confirm the bullish signal.
Bearish Entry:
Crossover Entry: Enter a short position when the price crosses above the upper band with a negative deviation from the mean.
Confirmation Entry: Look for RSI (below 50) or decreasing volume to confirm the bearish signal.
Deviation Confirmation:
Enter trades when the deviation from the mean is significant, indicating that the price has strayed far from its expected value and is likely to revert.
🞘 Possible Take Profit Strategies
Static Take Profit Levels:
Set predefined take profit levels based on historical volatility, using the upper and lower bands as guides.
Place take profit orders near recent support/resistance levels, ensuring you're capitalizing on the mean-reversion behavior.
Trailing Stop Loss:
Use a trailing stop based on a percentage of the price deviation from the mean to lock in profits as the trend progresses.
Adjust the trailing stop dynamically along the calculated bands to protect profits as the price returns to the mean.
Deviation-Based Exits:
Exit when the deviation from the mean starts to decrease, signaling that the price is returning to its equilibrium.
🞘 Possible Stop-Loss Levels
Initial Stop Loss:
Place an initial stop loss outside the lower band (for long positions) or above the upper band (for short positions) to protect against excessive deviations.
Use a volatility-based buffer to avoid getting stopped out during normal price fluctuations.
Dynamic Stop Loss:
Move the stop loss closer to the mean as the price converges back towards equilibrium, reducing risk.
Adjust the stop loss dynamically along the bands to account for sudden market movements.
🞘 Additional Tips
Combine with Other Indicators:
Enhance your strategy by combining the Mean Reversion Cloud with momentum indicators like MACD, RSI, or Bollinger Bands to confirm market conditions.
Backtesting and Practice:
Backtest the indicator on historical data to understand how it performs in various market environments.
Practice using the indicator on a demo account before implementing it in live trading.
Market Awareness:
Keep an eye on market news and events that might cause extreme price movements. The indicator reacts to price data and might not account for news-driven events that can cause large deviations.
🔸Customize settings 🞘 Decay Factor (λ): Defines the weight assigned to recent price data in the calculation of the mean. A value closer to 1 places more emphasis on recent prices, while lower values create a smoother, more lagging mean.
🞘 Autocorrelation Length (θ): Sets the period for calculating the speed of mean reversion and volatility. Longer lengths capture more historical data, providing smoother calculations, while shorter lengths make the indicator more responsive.
🞘 Threshold (σ): Specifies the number of standard deviations used to create the upper and lower bands. Higher thresholds widen the bands, producing fewer signals, while lower thresholds tighten the bands for more frequent signals.
🞘 Max Gradient Length (γ): Determines the maximum number of consecutive bars for calculating the deviation gradient. This setting impacts the transparency of the plotted bands based on the length of deviation from the mean.
🔶 CONCLUSION
The Mean Reversion Cloud (Ornstein-Uhlenbeck) indicator offers a sophisticated approach to identifying mean-reversion opportunities by applying the Ornstein-Uhlenbeck stochastic process. This dynamic indicator calculates a responsive mean using an Exponentially Weighted Moving Average (EWMA) and plots volatility-based bands to highlight overbought and oversold conditions. By incorporating advanced statistical measures like autocorrelation and standard deviation, traders can better assess market extremes and potential reversals. The indicator’s ability to adapt to price behavior makes it a versatile tool for traders focused on both short-term price deviations and longer-term mean-reversion strategies. With its unique blend of statistical rigor and visual clarity, the Mean Reversion Cloud provides an invaluable tool for understanding and capitalizing on market inefficiencies.

Multi-Step FlexiSuperTrend - Indicator [presentTrading]This version of the indicator is built upon the foundation of a strategy version published earlier. However, this indicator version focuses on providing visual insights and alerts for traders, rather than executing trades. This one is mostly for @thorcmt.
█ Introduction and How it is Different
The **Multi-Step FlexiSuperTrend Indicator** is a versatile tool designed to provide traders with a highly customizable and flexible approach to trend analysis. Unlike traditional supertrend indicators, which focus on a single factor or threshold, the **FlexiSuperTrend** allows users to define multiple levels of take-profit targets and incorporate different trend normalization methods.
It comes with several advanced customization features, including multi-step take profits, deviation plotting, and trend normalization, making it suitable for both novice and expert traders.
BTCUSD 6hr Performance
█ Strategy, How It Works: Detailed Explanation
The **Multi-Step FlexiSuperTrend** works by calculating a supertrend based on multiple factors and incorporating oscillations from trend deviations. Here’s a breakdown of how it functions:
🔶 SuperTrend Calculation
At the heart of the indicator is the SuperTrend formula, which dynamically adjusts based on price movements.
🔶 Normalization of Deviations
To enhance accuracy, the **FlexiSuperTrend** calculates multiple deviations from the trend and normalizes them.
🔶 Multi-Step Take Profit Levels
The indicator allows setting up to three take profit levels, which are displayed via price level alerts. lows traders to exit part of their position at various profit intervals.
For more detail, please check the strategy version - Multi-Step-FlexiSuperTrend-Strategy:
and 'FlexiSuperTrend-Strategy'
█ Trade Direction
The **Multi-Step FlexiSuperTrend Indicator** supports both long and short trade directions.
This flexibility allows traders to adapt to trending, volatile, or sideways markets.
█ Usage
To use the **FlexiSuperTrend Indicator**, traders can set up their preferences for the following key features:
- **Trading Direction**: Choose whether to focus on long, short, or both signals.
- **Indicator Source**: The price source to calculate the trend (e.g., close, hl2).
- **Indicator Length**: The number of periods to calculate the ATR and trend (the larger the value, the smoother the trend).
- **Starting and Increment Factor**: These adjust how reactive the trend is to price movements. The starting factor dictates how far the initial trend band is from the price, and the increment factor adjusts subsequent trend deviations.
The indicator then displays buy and sell signals on the chart, along with alerts for each take-profit level.
Local picture
█ Default Settings
The default settings of the **Multi-Step FlexiSuperTrend** are carefully designed to provide an optimal balance between sensitivity and accuracy. Let’s examine these default parameters and their effect on performance:
🔶 Indicator Length (Default: 10)
The **Indicator Length** determines the lookback period for the ATR calculation. A smaller value makes the indicator more reactive to price changes, but may generate more false signals. A longer length smooths the trend and reduces noise but may delay signals.
Effect on performance: Shorter lengths perform better in volatile markets, while longer lengths excel in trending markets.
🔶 Starting Factor (Default: 0.618)
This factor adjusts the starting distance of the SuperTrend from the current price. The smaller the starting factor, the closer the trend is to the price, making it more sensitive. Conversely, a larger factor allows more distance, reducing sensitivity but filtering out false signals.
Effect on performance: A smaller factor provides quicker signals but can lead to frequent false positives. A larger factor generates fewer but more reliable signals.
🔶 Increment Factor (Default: 0.382)
The **Increment Factor** controls how the trend bands adjust as the price moves. It increases the distance of the bands from the price with each iteration.
Effect on performance: A higher increment factor can result in wider stop-loss or trend reversal bands, allowing for longer trends to develop without frequent exits. A lower factor keeps the bands closer to the price and is more suited for shorter-term trades.
🔶 Take Profit Levels (Default: 2%, 8%, 18%)
The default take-profit levels are set at 2%, 8%, and 18%. These values represent the thresholds at which the trader can partially exit their positions. These multi-step levels are highly customizable depending on the trader’s risk tolerance and strategy.
Effect on performance: Lower take-profit levels (e.g., 2%) capture small, quick profits in volatile markets, while higher levels (8%-18%) allow for a more gradual exit in strong trends.
🔶 Normalization Method (Default: None)
The default normalization method is **None**, meaning the deviations are not normalized. However, enabling normalization (e.g., **Max-Min**) can improve the clarity of the indicator’s signals in volatile or choppy markets by smoothing out the noise.
Effect on performance: Using a normalization method can reduce the effect of extreme deviations, making signals more stable and less prone to false positives.

TPS Short Strategy by Larry ConnersThe TPS Short strategy aims to capitalize on extreme overbought conditions in an ETF by employing a scaling-in approach when certain technical indicators signal potential reversals. The strategy is designed to short the ETF when it is deemed overextended, based on the Relative Strength Index (RSI) and moving averages.
Components:
200-Day Simple Moving Average (SMA):
Purpose: Acts as a long-term trend filter. The ETF must be below its 200-day SMA to be eligible for shorting.
Rationale: The 200-day SMA is widely used to gauge the long-term trend of a security. When the price is below this moving average, it is often considered to be in a downtrend (Tushar S. Chande & Stanley Kroll, "The New Technical Trader: Boost Your Profit by Plugging Into the Latest Indicators").
2-Period RSI:
Purpose: Measures the speed and change of price movements to identify overbought conditions.
Criteria: Short 10% of the position when the 2-period RSI is above 75 for two consecutive days.
Rationale: A high RSI value (above 75) indicates that the ETF may be overbought, which could precede a price reversal (J. Welles Wilder, "New Concepts in Technical Trading Systems").
Scaling-In Mechanism:
Purpose: Gradually increase the short position as the ETF price rises beyond previous entry points.
Scaling Strategy:
20% more when the price is higher than the first entry.
30% more when the price is higher than the second entry.
40% more when the price is higher than the third entry.
Rationale: This incremental approach allows for an increased position size in a worsening trend, potentially increasing profitability if the trend continues to align with the strategy’s premise (Marty Schwartz, "Pit Bull: Lessons from Wall Street's Champion Day Trader").
Exit Conditions:
Criteria: Close all positions when the 2-period RSI drops below 30 or the 10-day SMA crosses above the 30-day SMA.
Rationale: A low RSI value (below 30) suggests that the ETF may be oversold and could be poised for a rebound, while the SMA crossover indicates a potential change in the trend (Martin J. Pring, "Technical Analysis Explained").
Risks and Considerations:
Market Risk:
The strategy assumes that the ETF will continue to decline once shorted. However, markets can be unpredictable, and price movements might not align with the strategy's expectations, especially in a volatile market (Nassim Nicholas Taleb, "The Black Swan: The Impact of the Highly Improbable").
Scaling Risks:
Scaling into a position as the price increases may increase exposure to adverse price movements. This method can amplify losses if the market moves against the position significantly before any reversal occurs.
Liquidity Risk:
Depending on the ETF’s liquidity, executing large trades in increments might affect the price and increase trading costs. It is crucial to ensure that the ETF has sufficient liquidity to handle large trades without significant slippage (James Altucher, "Trade Like a Hedge Fund").
Execution Risk:
The strategy relies on timely execution of trades based on specific conditions. Delays or errors in order execution can impact performance, especially in fast-moving markets.
Technical Indicator Limitations:
Technical indicators like RSI and SMA are based on historical data and may not always predict future price movements accurately. They can sometimes produce false signals, leading to potential losses if used in isolation (John Murphy, "Technical Analysis of the Financial Markets").
Conclusion
The TPS Short strategy utilizes a combination of long-term trend filtering, overbought conditions, and incremental shorting to potentially profit from price reversals. While the strategy has a structured approach and leverages well-known technical indicators, it is essential to be aware of the inherent risks, including market volatility, liquidity issues, and potential limitations of technical indicators. As with any trading strategy, thorough backtesting and risk management are crucial to its successful implementation.

Average True Range with Price MAATR with Price Moving Average Indicator
This custom indicator combines the Average True Range (ATR) with a Price Moving Average (MA) to help traders analyze market volatility in percent to the price.
Key Components:
Average True Range (ATR)
Price Moving Average (MA)
ATR/Price in Percent
ATR/Price in Percent
Purpose: This ratio helps traders understand the relative size of the ATR compared to the current price, providing a clearer sense of how significant the volatility is in proportion to the price level.
Calculation: ATR is divided by the current closing price and multiplied by 100 to express it as a percentage. This makes it easier to compare volatility across assets with different price ranges.
Plot: This is plotted as a percentage, making it easier to gauge whether the volatility is proportionally high or low compared to the asset's price.
Usage:
This indicator is designed to help identify the most volatile tokens, making it ideal for configuring a Grid Bot to maximize profit. By focusing on high-volatility assets, traders can capitalize on larger price swings within the grid, increasing the potential for more profitable trades.
Features:
Customizable Smoothing Method: Choose from RMA (Relative Moving Average), SMA (Simple Moving Average), EMA (Exponential Moving Average), or WMA (Weighted Moving Average) for both ATR and the Price Moving Average.
Dual Perspective: The indicator provides both volatility analysis (ATR) and trend analysis (Price MA) in a single view.
Proportional Volatility: The ATR/Price (%) ratio adds a layer of context by showing how volatile the asset is relative to its current price.

Descriptive Backtesting Framework (DBF)As the name suggests, this is a backtesting framework made to offer full backtesting functionality to any custom indicator in a visually descriptive way.
Any trade taken will be very clear to visualize on the chart and the equity line will be updated live allowing us to use the REPLAY feature to view the strategy performing in real time.
Stops and Targets will also get draw on the chart with labels and tooltips and there will be a table on the top right corner displaying lots of descriptive metrics to measure your strategy's performance.
IF YOU DECIDE TO USE THIS FRAMEWORK, PLEASE READ **EVERYTHING** BELOW
HOW TO USE IT
Step 1 - Insert Your Strategy Indicators:
Inside this framework's code, right at the beginning, you will find a dedicated section where you can manually insert any set of indicators you desire.
Just replace the example code in there with your own strategy indicators.
Step 2 - Specify The Conditions To Take Trades:
After that, there will be another section where you need to specify your strategy's conditions to enter and exit trades.
When met, those conditions will fire the trading signals to the trading engine inside the framework.
If you don't wish to use some of the available signals, please just assign false to the signal.
DO NOT DELETE THE SIGNAL VARIABLES
Step 3 - Specify Entry/Exit Prices, Stops & Targets:
Finally you'll reach the last section where you'll be able to specify entry/exit prices as well as add stops and targets.
On most cases, it's easier and more reliable to just use the close price to enter and exit trades.
If you decide to use the open price instead, please remember to change step 2 so that trades are taken on the open price of the next candle and not the present one to avoid the look ahead bias.
Stops and targets can be set in any way you want.
Also, please don't forget to update the spread. If your broker uses commissions instead of spreads or a combination of both, you'll need to manually incorporate those costs in this step.
And that's it! That's all you have to do.
Below this section you'll now see a sign warning you about not making any changes to the code below.
From here on, the framework will take care of executing the trades and calculating the performance metrics for you and making sure all calculations are consistent.
VISUAL FEATURES:
Price candles get painted according to the current trade.
They will be blue during long trades, purple on shorts and white when no trade is on.
When the framework receives the signals to start or close a trade, it will display those signals as shapes on the upper and lower limits of the chart:
DIAMOND: represents a signal to open a trade, the trade direction is represented by the shape's color;
CROSS: means a stop loss was triggered;
FLAG: means a take profit was triggered;
CIRCLE: means an exit trade signal was fired;
Hovering the mouse over the trade labels will reveal:
Asset Quantity;
Entry/Exit Prices;
Stops & Targets;
Trade Profit;
Profit As Percentage Of Trade Volume;
**Please note that there's a limit as to how many labels can be drawn on the chart at once.**
If you which to see labels from the beginning of the chart, you'll probably need to use the replay feature.
PERFORMANCE TABLE:
The performance table displays several performance metrics to evaluate the strategy.
All the performance metrics here are calculated by the framework. It does not uses the oficial pine script strategy tester.
All metrics are calculated in real time. If using the replay feature, they will be updated up to the last played bar.
Here are the available metrics and their definition:
INITIAL EQUITY: the initial amount of money we had when the strategy started, obviously...;
CURRENT EQUITY: the amount of money we have now. If using the replay feature, it will show the current equity up to the last bar played. The number on it's right side shows how many times our equity has been multiplied from it's initial value;
TRADE COUNT: how many trades were taken;
WIN COUNT: how many of those trades were wins. The percentage at the right side is the strategy WIN RATE;
AVG GAIN PER TRADE: the average percentage gain per trade. Very small values can indicate a fragile strategy that can behave in unexpected ways under high volatility conditions;
AVG GAIN PER WIN: the average percentage gain of trades that were profitable;
AVG GAIN PER LOSS: the average percentage loss on trades that were not profitable;
EQUITY MAX DD: the maximum drawdown experienced by our equity during the entire strategy backtest;
TRADE MAX DD: the maximum drawdown experienced by our equity after one single trade;
AVG MONTHLY RETURN: the compound monthly return that our strategy was able to create during the backtested period;
AVG ANNUAL RETURN: this is the strategy's CAGR (compound annual growth rate);
ELAPSED MONTHS: number of months since the backtest started;
RISK/REWARD RATIO: shows how profitable the strategy is for the amount of risk it takes. Values above 1 are very good (and rare). This is calculated as follows: (Avg Annual Return) / mod(Equity Max DD). Where mod() is the same as math.abs();
AVAILABLE SETTINGS:
SPREAD: specify your broker's asset spread
ENABLE LONGS / SHORTS: you can keep both enable or chose to take trades in only one direction
MINIMUM BARS CLOSED: to avoid trading before indicators such as a slow moving average have had time to populate, you can manually set the number of bars to wait before allowing trades.
INITIAL EQUITY: you can specify your starting equity
EXPOSURE: is the percentage of equity you wish to risk per trade. When using stops, the strategy will automatically calculate your position size to match the exposure with the stop distance. If you are not using stops then your trade volume will be the percentage of equity specified here. 100 means you'll enter trades with all your equity and 200 means you'll use a 2x leverage.
MAX LEVERAGE ALLOWED: In some situations a short stop distance can create huge levels of leverage. If you want to limit leverage to a maximum value you can set it here.
SEVERAL PLOTTING OPTIONS: You'll be able to specify which of the framework visuals you wish to see drawn on the chart.
FRAMEWORK **LIMITATIONS**:
When stop and target are both triggered in the same candle, this framework isn't able to enter faster timeframes to check which one was triggered first, so it will take the pessimistic assumption and annul the take profit signal;
This framework doesn't support pyramiding;
This framework doesn't support both long and short positions to be active at the same time. So for example, if a short signal is received while a long trade is open, the framework will close the long trade and then open a short trade;
FINAL CONSIDERATIONS:
I've been using this framework for a good time and I find it's better to use and easier to analyze a strategy's performance then relying on the oficial pine script strategy tester. However, I CANNOT GUARANTEE IT TO BE BUG FREE.
**PLEASE PERFORM A MANUAL BACKTEST BEFORE USING ANY STRATEGY WITH REAL MONEY**

Grid Bot Parabolic [xxattaxx]🟩 The Grid Bot Parabolic, a continuation of the Grid Bot Simulator Series , enhances traditional gridbot theory by employing a dynamic parabolic curve to visualize potential support and resistance levels. This adaptability is particularly useful in volatile or trending markets, enabling traders to explore grid-based strategies and gain deeper market insights. The grids are divided into customizable trade zones that trigger signals as prices move into new zones, empowering traders to gain deeper insights into market dynamics and potential turning points.
While traditional grid bots excel in ranging markets, the Grid Bot Parabolic’s introduction of acceleration and curvature adds new dimensions, enabling its use in trending markets as well. It can function as a traditional grid bot with horizontal lines, a tilted grid bot with linear slopes, or a fully parabolic grid with curves. This dynamic nature allows the indicator to adapt to various market conditions, providing traders with a versatile tool for visualizing dynamic support and resistance levels.
🔑 KEY FEATURES 🔑
Adaptable Grid Structures (Horizontal, Linear, Curved)
Buy and Sell Signals with Multiple Trigger/Confirmation Conditions
Secondary Buy and Secondary Sell Signals
Projected Grid Lines
Customizable Grid Spacing and Zones
Acceleration and Curvature Control
Sensitivity Adjustments
📐 GRID STRUCTURES 📐
Beyond its core parabolic functionality, the Parabolic Grid Bot offers a range of grid configurations to suit different market conditions and trading preferences. By adjusting the "Acceleration" and "Curvature" parameters, you can transform the grid's structure:
Parabolic Grids
Setting both acceleration and curvature to non-zero values results in a parabolic grid.This configuration can be particularly useful for visualizing potential turning points and trend reversals. Example: Accel = 10, Curve = -10)
Linear Grids
With a non-zero acceleration and zero curvature, the grid tilts to represent a linear trend, aiding in identifying potential support and resistance levels during trending phases. Example: Accel =1.75, Curve = 0
Horizontal Grids
When both acceleration and curvature are set to zero, the indicator reverts to a traditional grid bot with horizontal lines, suitable for ranging markets. Example: Accel=0, Curve=0
⚙️ INITIAL SETUP ⚙️
1.Adding the Indicator to Your Chart
Locate a Starting Point: To begin, visually identify a price point on your chart where you want the grid to start.This point will anchor your grid.
2. Setting Up the Grid
Add the Grid Bot Parabolic Indicator to your chart. A “Start Time/Price” dialog will appear
CLICK on the chart at your chosen start point. This will anchor the start point and open a "Confirm Inputs" dialog box.
3. Configure Settings. In the dialog box, you can set the following:
Acceleration: Adjust how quickly the grid reacts to price changes.
Curve: Define the shape of the parabola.
Intervals: Determine the distance between grid levels.
If you choose to keep the default settings, with acceleration set to 0 and curve set to 0, the grid will display as traditional horizontal lines. The grid will align with your selected price point, and you can adjust the settings at any time through the indicator’s settings panel.
⚙️ CONFIGURATION AND SETTINGS ⚙️
Grid Settings
Accel (Acceleration): Controls how quickly the price reacts to changes over time.
Curve (Curvature): Defines the overall shape of the parabola.
Intervals (Grid Spacing): Determines the vertical spacing between the grid lines.
Sensitivity: Fine tunes the magnitude of Acceleration and Curve.
Buy Zones & Sell Zones: Define the number of grid levels used for potential buy and sell signals.
* Each zone is represented on the chart with different colors:
* Green: Buy Zones
* Red: Sell Zones
* Yellow: Overlap (Buy and Sell Zones intersect)
* Gray: Neutral areas
Trigger: Chooses which part of the candlestick is used to trigger a signal.
* `Wick`: Uses the high or low of the candlestick
* `Close`: Uses the closing price of the candlestick
* `Midpoint`: Uses the middle point between the high and low of the candlestick
* `SWMA`: Uses the Symmetrical Weighted Moving Average
Confirm: Specifies how a signal is confirmed.
* `Reverse`: The signal is confirmed if the price moves in the opposite direction of the initial trigger
* `Touch`: The signal is confirmed when the price touches the specified level or zone
Sentiment: Determines the market sentiment, which can influence signal generation.
* `Slope`: Sentiment is based on the direction of the curve, reflecting the current trend
* `Long`: Sentiment is bullish, favoring buy signals
* `Short`: Sentiment is bearish, favoring sell signals
* `Neutral`: Sentiment is neutral. No secondary signals will be generated
Show Signals: Toggles the display of buy and sell signals on the chart
Chart Settings
Grid Colors: These colors define the visual appearance of the grid lines
Projected: These colors define the visual appearance of the projected lines
Parabola/SWMA: Adjust colors as needed. These are disabled by default.
Time/Price
Start Time & Start Price: These set the starting point for the parabolic curve.
* These fields are automatically populated when you add the indicator to the chart and click on an initial location
* These can be adjusted manually in the settings panel, but he easiest way to change these is by directly interacting with the start point on the chart
Please note: Time and Price must be adjusted for each chart when switching assets. For example, a Start Price on BTCUSD of $60,000 will not work on an ETHUSD chart.
🤖 ALGORITHM AND CALCULATION 🤖
The Parabolic Function
At the core of the Parabolic Grid Bot lies the parabolic function, which calculates a dynamic curve that adapts to price action over time. This curve serves as the foundation for visualizing potential support and resistance levels.
The shape and behavior of the parabola are influenced by three key user-defined parameters:
Acceleration: This parameter controls the rate of change of the curve's slope, influencing its tilt or steepness. A higher acceleration value results in a more pronounced tilt, while a lower value leads to a gentler slope. This applies to both curved and linear grid configurations.
Curvature: This parameter introduces and controls the curvature or bend of the grid. A higher curvature value results in a more pronounced parabolic shape, while a lower value leads to a flatter curve or even a straight line (when set to zero).
Sensitivity: This setting fine-tunes the overall responsiveness of the grid, influencing how strongly the Acceleration and Curvature parameters affect its shape. Increasing sensitivity amplifies the impact of these parameters, making the grid more adaptable to price changes but potentially leading to more frequent adjustments. Decreasing sensitivity reduces their impact, resulting in a more stable grid structure with fewer adjustments. It may be necessary to adjust Sensitivity when switching between different assets or timeframes to ensure optimal scaling and responsiveness.
The parabolic function combines these parameters to generate a curve that visually represents the potential path of price movement. By understanding how these inputs influence the parabola's shape and behavior, traders can gain valuable insights into potential support and resistance areas, aiding in their decision-making process.
Sentiment
The Parabolic Grid Bot incorporates sentiment to enhance signal generation. The "Sentiment" input allows you to either:
Manually specify the market sentiment: Choose between 'Long' (bullish), 'Short' (bearish), or 'Neutral'.
Let the script determine sentiment based on the slope of the parabolic curve: If 'Slope' is selected, the sentiment will be considered 'Long' when the curve is sloping upwards, 'Short' when it's sloping downwards, and 'Neutral' when it's flat.
Buy and Sell Signals
The Parabolic Grid Bot generates buy and sell signals based on the interaction between the price and the grid levels.
Trigger: The "Trigger" input determines which part of the candlestick is used to trigger a signal (wick, close, midpoint, or SWMA).
Confirmation: The "Confirm" input specifies how a signal is confirmed ('Reverse' or 'Touch').
Zones: The number of "Buy Zones" and "Sell Zones" determines the areas on the grid where buy and sell signals can be generated.
When the trigger condition is met within a buy zone and the confirmation criteria are satisfied, a buy signal is generated. Similarly, a sell signal is generated when the trigger and confirmation occur within a sell zone.
Secondary Signals
Secondary signals are generated when a regular buy or sell signal contradicts the prevailing sentiment. For example:
A buy signal in a bearish market (Sentiment = 'Short') would be considered a "secondary buy" signal.
A sell signal in a bullish market (Sentiment = 'Long') would be considered a "secondary sell" signal.
These secondary signals are visually represented on the chart using hollow triangles, differentiating them from regular signals (filled triangles).
While they can be interpreted as potential contrarian trade opportunities, secondary signals can also serve other purposes within a grid trading strategy:
Exit Signals: A secondary signal can suggest a potential shift in market sentiment or a weakening trend. This could be a cue to consider exiting an existing position, even if it's currently profitable, to lock in gains before a potential reversal
Risk Management: In a strong trend, secondary signals might offer opportunities for cautious counter-trend trades with controlled risk. These trades could utilize smaller position sizes or tighter stop-losses to manage potential downside if the main trend continues
Dollar-Cost Averaging (DCA): During a prolonged trend, the parabolic curve might generate multiple secondary signals in the opposite direction. These signals could be used to implement a DCA strategy, gradually accumulating a position at potentially favorable prices as the market retraces or consolidates within the larger trend
Secondary signals should be interpreted with caution and considered in conjunction with other technical indicators and market context. They provide additional insights into potential market reversals or consolidation phases within a broader trend, aiding in adapting your grid trading strategy to the evolving market dynamics.
Examples
Trigger=Wick, Confirm=Touch. Signals are generated when the wick touches the next gridline.
Trigger=Close, Confirm=Touch. Signals require the close to touch the next gridline.
Trigger=SWMA, Confirm=Reverse. Signals are triggered when the Symmetrically Weighted Moving Average reverse crosses the next gridline.
🧠THEORY AND RATIONALE 🧠
The innovative approach of the Parabolic Grid Bot can be better understood by first examining the limitations of traditional grid trading strategies and exploring how this indicator addresses them by incorporating principles of market cycles and dynamic price behavior
Traditional Grid Bots: One-Dimensional and Static
Traditional grid bots operate on a simple premise: they divide the price chart into a series of equally spaced horizontal lines, creating a grid of trading zones. These bots excel in ranging markets where prices oscillate within a defined range. Buy and sell orders are placed at these grid levels, aiming to profit from mean reversion as prices bounce between the support and resistance zones.
However, traditional grid bots face challenges in trending markets. As the market moves in one direction, the bot continues to place orders in that direction, leading to a stacking of positions. If the market eventually reverses, these stacked trades can be profitable, amplifying gains. But the risk lies in the potential for the market to continue trending, leaving the trader with a series of losing trades on the wrong side of the market
The Parabolic Grid Bot: Adding Dimensions
The Parabolic Grid Bot addresses the limitations of traditional grid bots by introducing two additional dimensions:
Acceleration (Second Dimension): This parameter introduces a second dimension to the grid, allowing it to tilt upwards or downwards to align with the prevailing market trend. A positive acceleration creates an upward-sloping grid, suitable for uptrends, while a negative acceleration results in a downward-sloping grid, ideal for downtrends. The magnitude of acceleration controls the steepness of the tilt, enabling you to fine-tune the grid's responsiveness to the trend's strength
Curvature (Third Dimension): This parameter adds a third dimension to the grid by introducing a parabolic curve. The curve's shape, ranging from gentle bends to sharp turns, is controlled by the curvature value. This flexibility allows the grid to closely mirror the market's evolving structure, potentially identifying turning points and trend reversals.
Mean Reversion in Trending Markets
Even in trending markets, the Parabolic Grid Bot can help identify opportunities for mean reversion strategies. While the grid may be tilted to reflect the trend, the buy and sell zones can capture short-term price oscillations or consolidations within the broader trend. This allows traders to potentially pinpoint entry and exit points based on temporary pullbacks or reversals.
Visualize and Adapt
The Parabolic Grid Bot acts as a visual aid, enhancing your understanding of market dynamics. It allows you to "see the curve" by adapting the grid to the market's patterns. If the market shows a parabolic shape, like an upward curve followed by a peak and a downward turn (similar to a head and shoulders pattern), adjust the Accel and Curve to match. This highlights potential areas of interest for further analysis.
Beyond Straight Lines: Visualizing Market Cycle
Traditional technical analysis often employs straight lines, such as trend lines and support/resistance levels, to interpret market movements. However, many analysts, including Brian Millard, contend that these lines can be misleading. They propose that what might appear as a straight line could represent just a small part of a larger curve or cycle that's not fully visible on the chart.
Markets are inherently cyclical, marked by phases of expansion, contraction, and reversal. The Parabolic Grid Bot acknowledges this cyclical behavior by offering a dynamic, curved grid that adapts to these shifts. This approach helps traders move beyond the limitations of straight lines and visualize potential support and resistance levels in a way that better reflects the market's true nature
By capturing these cyclical patterns, whether subtle or pronounced, the Parabolic Grid Bot offers a nuanced understanding of market dynamics, potentially leading to more accurate interpretations of price action and informed trading decisions.
⚠️ DISCLAIMER⚠️
This indicator utilizes a parabolic curve fitting approach to visualize potential support and resistance levels. The mathematical formulas employed have been designed with adaptability and scalability in mind, aiming to accommodate various assets and price ranges. While the resulting curves may visually resemble parabolas, it's important to note that they might not strictly adhere to the precise mathematical definition of a parabola.
The indicator's calculations have been tested and generally produce reliable results. However, no guarantees are made regarding their absolute mathematical accuracy. Traders are encouraged to use this tool as part of their broader analysis and decision-making process, combining it with other technical indicators and market context.
Please remember that trading involves inherent risks, and past performance is not indicative of future results. It is always advisable to conduct your own research and exercise prudent risk management before making any trading decisions.
🧠 BEYOND THE CODE 🧠
The Parabolic Grid Bot, like the other grid bots in this series, is designed with education and community collaboration in mind. Its open-source nature encourages exploration, experimentation, and the development of new grid trading strategies. We hope this indicator serves as a framework and a starting point for future innovations in the field of grid trading.
Your comments, suggestions, and discussions are invaluable in shaping the future of this project. We welcome your feedback and look forward to seeing how you utilize and enhance the Parabolic Grid Bot.

Trend Signals with TP & SL [UAlgo] StrategyThe "Trend Signals with TP & SL Strategy" is a trading strategy designed to capture trend continuation signals while incorporating sophisticated risk management techniques. This strategy is tailored for traders who wish to capitalize on trending market conditions with precise entry and exit points, automatically calculating Take Profit (TP) and Stop Loss (SL) levels based on either Average True Range (ATR) or percentage values. The strategy aims to enhance trade management by preventing multiple simultaneous positions and dynamically adapting to changing market conditions.
This strategy is highly configurable, allowing traders to adjust sensitivity, the ATR calculation method, and the cloud moving average length. Additionally, the strategy can display buy and sell signals directly on the chart, along with visual representation of entry points, stop losses, and take profits. It also features a cloud-based trend analysis using a MACD-driven color fill that indicates the strength and direction of the trend.
🔶 Key Features
Configurable Trend Continuation Signals:
Source Selection: The strategy uses the midpoint of the high-low range as the default source, but it is adjustable.
Sensitivity: The sensitivity of the trend signals can be adjusted using a multiplier, ranging from 0.5 to 5.
ATR Calculation: The strategy allows users to choose between two ATR calculation methods for better adaptability to different market conditions.
Cloud Moving Average: Traders can adjust the cloud moving average length, which is used in conjunction with MACD to provide a visual trend indication.
Take Profit & Stop Loss Management:
ATR-Based or Percent-Based: The strategy offers flexibility in setting TP and SL levels, allowing traders to choose between ATR-based multipliers or fixed percentage values.
Dynamic Adjustment: TP and SL levels are dynamically adjusted according to the selected method, ensuring trades are managed based on real-time market conditions.
Prevention of Multiple Positions:
Single Position Control: To reduce risk and enhance strategy reliability, the strategy includes an option to prevent multiple positions from being opened simultaneously.
Visual Trade Indicators:
Buy/Sell Signals: Clearly displays buy and sell signals on the chart for easy interpretation.
Entry, SL, and TP Lines: Draws lines for entry price, stop loss, and take profit directly on the chart, helping traders to monitor trades visually.
Trend Cloud: A color-filled cloud based on MACD and the cloud moving average provides a visual cue of the trend’s direction and strength.
Performance Summary Table:
In-Chart Statistics: A table in the top right of the chart displays key performance metrics, including total trades, wins, losses, and win rate percentage, offering a quick overview of the strategy’s effectiveness.
🔶 Interpreting the Indicator
Trend Signals: The strategy identifies trend continuation signals based on price action relative to an ATR-based threshold. A buy signal is generated when the price crosses above a key level, indicating an uptrend. Conversely, a sell signal occurs when the price crosses below a level, signaling a downtrend.
Cloud Visualization: The cloud, derived from MACD and moving averages, changes color to reflect the current trend. A positive cloud in aqua suggests an uptrend, while a red cloud indicates a downtrend. The transparency of the cloud offers further nuance, with more solid colors denoting stronger trends.
Entry and Exit Management: Once a trend signal is generated, the strategy automatically sets TP and SL levels based on your chosen method (ATR or percentage). The stop loss and take profit lines will appear on the chart, showing where the strategy will exit the trade. If the price reaches either the SL or TP, the trade is closed, and the respective line is deleted from the chart.
Performance Metrics: The strategy’s performance is tracked in real-time with an in-chart table. This table provides essential information about the number of trades executed, the win/loss ratio, and the overall win rate. This information helps traders assess the strategy's effectiveness and make necessary adjustments.
This strategy is designed for those who seek to engage with trending markets, offering robust tools for entry, exit, and overall trade management. By understanding and leveraging these features, traders can potentially improve their trading outcomes and risk management.
🔷 Related Script
🔶 Disclaimer
Use with Caution: This indicator is provided for educational and informational purposes only and should not be considered as financial advice. Users should exercise caution and perform their own analysis before making trading decisions based on the indicator's signals.
Not Financial Advice: The information provided by this indicator does not constitute financial advice, and the creator (UAlgo) shall not be held responsible for any trading losses incurred as a result of using this indicator.
Backtesting Recommended: Traders are encouraged to backtest the indicator thoroughly on historical data before using it in live trading to assess its performance and suitability for their trading strategies.
Risk Management: Trading involves inherent risks, and users should implement proper risk management strategies, including but not limited to stop-loss orders and position sizing, to mitigate potential losses.
No Guarantees: The accuracy and reliability of the indicator's signals cannot be guaranteed, as they are based on historical price data and past performance may not be indicative of future results.

Price & Volume Breakout Fibonacci Probability [TradeDots]📝 OVERVIEW
The "Price & Volume Breakout Fibonacci Probability" indicator is designed to detect the probability of the maximum run-up and drawdown of each breakout trade on an asset, assisting traders in optimizing their take profit and stop loss strategies.
🧮 CALCULATIONS
The algorithm detects price and volume breakouts to activate the Fibonacci levels displayed on the chart. It calculates these levels using the period pivot high and low, with the close price of the breakout bar as the reference price.
The indicator then forward-tests within an user-selected number of bars, detecting the maximum run-up and drawdown during that period. Consequently, it calculates the probability of the price hitting either side of the Fibonacci levels, showing the likelihood of reaching take profit and stop loss targets for each breakout trade.
📊 EXAMPLE
The above example shows two breakout trades, circled within the yellow rectangle zone.
The first trade has a maximum run-up above the +0.382 Fibonacci level zone and a maximum drawdown below the -0.618 Fibonacci level zone.
When the price reaches the maximum run-up, it only has a ~45% probability of moving further upward into the last two zones (25% + 19.44%). This indicates that setting a take profit at a higher level may have less than a 50% chance of success.
Conversely, when the price reaches its maximum drawdown, there is only an ~8% probability of moving further downward into the last drawdown zone. This could indicate a potential reversal.
⚙️ SETTINGS
Breakout Condition: Determines the type of breakout condition to track: "Price", "Volume", "Price & Volume".
Backtest Period: The maximum run-up and drawdown are detected within this bar period.
Price Breakout Period: Specifies the number of bars the price needs to break out from.
Volume Breakout Period: Specifies the number of bars the volume needs to break out from.
Trendline Confirmation: Confirms that the close price needs to be above the trendline.
📈 HOW TO USE
By understanding the probabilities of price movements to both the upside and downside, traders can set take profit and stop loss targets with greater accuracy.
For instance, placing a stop loss order below the zone with the highest probability minimizes the chances of being stopped out of a profitable trade. Conversely, setting a take profit target at the zone with the highest probability increases the win rate.
Additionally, if the price breaches multiple Fibonacci levels during the breakout period, it may indicate an abnormal state, signaling a potential reversal or pullback. This can help traders exit trades in a timely manner.
Traders can adjust their take profit and stop loss levels based on their individual risk tolerance.
RISK DISCLAIMER
Trading entails substantial risk, and most day traders incur losses. All content, tools, scripts, articles, and education provided by TradeDots serve purely informational and educational purposes. Past performances are not definitive predictors of future results.

ChartArt-Bankniftybuying5minName: ChartArt-BankNifty Buying Strategy (5-Minute)
Timeframe: 5-Minute Candles
Asset: BankNifty (Indian Stock Market Index)
Trading Hours: 9:30 AM - 2:45 PM IST (Indian Standard Time)
This strategy is designed for BankNifty intraday traders who want to capitalize on short-term price movements within a defined trading window. It combines technical indicators like Simple Moving Averages (SMA), Relative Strength Index (RSI), and candlestick patterns to identify potential buy signals during intraday downtrends. The strategy employs specific entry, stop-loss, and target conditions to manage trades effectively and minimize risk.
Technical Indicators Used
Simple Moving Averages (SMA):
EMA7: 7-period SMA on closing price.
EMA5: 5-period SMA on closing price.
Purpose: Used to identify the intraday trend by comparing short-term moving averages. The strategy focuses on situations where the market is in a minor downtrend, indicated by EMA5 being below EMA7.
Relative Strength Index (RSI):
RSI14: 14-period RSI, a momentum oscillator that measures the speed and change of price movements.
SMA14: 14-period SMA of the RSI.
Purpose: RSI is used to identify potential reversal points. The strategy looks for situations where the RSI is below its own moving average, suggesting weakening momentum in the downtrend.
Candlestick Patterns:
Relaxed Hammer or Doji (2nd Candle): A pattern where the second candle in a 3-candle sequence shows a potential reversal signal (Hammer or Doji), indicating indecision or a potential turning point.
Bearish 1st Candle: The first candle is bearish, setting up the context for a potential reversal.
Bullish 3rd Candle: The third candle must be bullish with specific characteristics (closing near the high, surpassing the previous high), confirming the reversal.
Strategy Conditions
Time Condition:
The strategy is only active during specific hours (9:30 AM to 2:45 PM IST). This ensures that trades are only taken during the most liquid hours of the trading day, avoiding potential volatility or lack of liquidity towards market close.
Intraday Downtrend Condition:
EMA5 < EMA7: Indicates that the market is in a minor downtrend. The strategy looks for reversal opportunities within this trend.
RSI Condition:
RSI14 <= SMA14: Indicates that the current RSI value is below its 14-period SMA, suggesting potential weakening momentum, which can precede a reversal.
Candlestick Patterns:
1st Candle: Must be bearish, setting up the context for a potential reversal.
2nd Candle: Must either be a Hammer or Doji, indicating a potential reversal pattern.
3rd Candle: Must be bullish, with specific characteristics (closing near the high, breaking the previous high, etc.), confirming the reversal.
RSI Crossover Condition:
A crossover of the RSI over its SMA in the last 5 periods is also checked, adding further confirmation to the reversal signal.
Entry and Exit Rules
Entry Signal:
A buy signal is generated when all the conditions (time, intraday downtrend, bearish 1st candle, hammer/doji 2nd candle, bullish 3rd candle, and RSI condition) are met. The trade is entered at the high of the bullish third candle.
Stop Loss:
The stop loss is calculated based on the difference between the entry price and the low of the second candle. If this difference is greater than 90 points, the stop loss is placed at the midpoint of the second candle's range (average of high and low). Otherwise, it is placed at the low of the second candle.
Target 1:
The first target is set at 1.8 times the difference between the entry price and the stop loss. When this target is hit, half of the position is exited to lock in partial profits.
Target 2:
The second target is set at 3 times the difference between the entry price and the stop loss. The remaining position is exited at this point, or if the price hits the stop loss.
Originality and Usefulness
This strategy is original in its combination of multiple technical indicators and candlestick patterns to identify potential reversals in a specific intraday timeframe. By focusing on minor downtrends and utilizing a 3-candle reversal pattern, the strategy seeks to capture quick price movements with a structured approach to risk management.
Key Benefits:
High Precision: The strategy’s multi-step filtering process (time condition, trend confirmation, candlestick pattern analysis, and momentum evaluation via RSI) increases the likelihood of accurate trade signals.
Risk Management: The use of a dynamic stop-loss based on candle characteristics, combined with partial profit-taking, allows traders to lock in profits while still giving the trade room to develop further.
Structured Approach: The strategy provides a clear, rule-based system for entering and exiting trades, which can help remove emotional decision-making from the trading process.
Charts and Signals
The strategy produces signals in the form of labels on the chart:
Buy Signal: A green label is plotted below the candle that meets all entry conditions, indicating a potential buy opportunity.
Stop Loss (SL): A red dashed line is drawn at the stop-loss level with a label indicating "SL".
Target 1 (1st TG): A blue dashed line is drawn at the first target level with a label indicating "1st TG".
Target 2 (2nd TG): Another blue dashed line is drawn at the second target level with a label indicating "2nd TG".
These visual aids help traders quickly identify entry points, stop loss levels, and target levels on the chart, making the strategy easy to follow and implement.
Backtesting and Optimization
Backtesting: The strategy can be backtested on TradingView using historical data to evaluate its performance. Traders should consider testing across different market conditions to ensure the strategy's robustness.
Optimization: Parameters such as the RSI period, moving averages, and target multipliers can be optimized based on backtesting results to refine the strategy further.
Conclusion
The ChartArt-BankNifty Buying Strategy offers a well-rounded approach to intraday trading, focusing on capturing reversals in minor downtrends. With a strong emphasis on technical analysis, precise entry and exit rules, and robust risk management, this strategy provides a solid framework for traders looking to engage in intraday trading on BankNifty.

Multi-Factor StrategyThis trading strategy combines multiple technical indicators to create a systematic approach for entering and exiting trades. The goal is to capture trends by aligning several key indicators to confirm the direction and strength of a potential trade. Below is a detailed description of how the strategy works:
Indicators Used
MACD (Moving Average Convergence Divergence):
MACD Line: The difference between the 12-period and 26-period Exponential Moving Averages (EMAs).
Signal Line: A 9-period EMA of the MACD line.
Usage: The strategy looks for crossovers between the MACD line and the Signal line as entry signals. A bullish crossover (MACD line crossing above the Signal line) indicates a potential upward movement, while a bearish crossover (MACD line crossing below the Signal line) signals a potential downward movement.
RSI (Relative Strength Index):
Usage: RSI is used to gauge the momentum of the price movement. The strategy uses specific thresholds: below 70 for long positions to avoid overbought conditions and above 30 for short positions to avoid oversold conditions.
ATR (Average True Range):
Usage: ATR measures market volatility and is used to set dynamic stop-loss and take-profit levels. A stop loss is set at 2 times the ATR, and a take profit at 3 times the ATR, ensuring that risk is managed relative to market conditions.
Simple Moving Averages (SMA):
50-day SMA: A short-term trend indicator.
200-day SMA: A long-term trend indicator.
Usage: The strategy uses the relationship between the 50-day and 200-day SMAs to determine the overall market trend. Long positions are taken when the price is above the 50-day SMA and the 50-day SMA is above the 200-day SMA, indicating an uptrend. Conversely, short positions are taken when the price is below the 50-day SMA and the 50-day SMA is below the 200-day SMA, indicating a downtrend.
Entry Conditions
Long Position:
-MACD Crossover: The MACD line crosses above the Signal line.
-RSI Confirmation: RSI is below 70, ensuring the asset is not overbought.
-SMA Confirmation: The price is above the 50-day SMA, and the 50-day SMA is above the 200-day SMA, indicating a strong uptrend.
Short Position:
MACD Crossunder: The MACD line crosses below the Signal line.
RSI Confirmation: RSI is above 30, ensuring the asset is not oversold.
SMA Confirmation: The price is below the 50-day SMA, and the 50-day SMA is below the 200-day SMA, indicating a strong downtrend.
Opposite conditions for shorts
Exit Strategy
Stop Loss: Set at 2 times the ATR from the entry price. This dynamically adjusts to market volatility, allowing for wider stops in volatile markets and tighter stops in calmer markets.
Take Profit: Set at 3 times the ATR from the entry price. This ensures a favorable risk-reward ratio of 1:1.5, aiming for higher rewards on successful trades.
Visualization
SMAs: The 50-day and 200-day SMAs are plotted on the chart to visualize the trend direction.
MACD Crossovers: Bullish and bearish MACD crossovers are highlighted on the chart to identify potential entry points.
Summary
This strategy is designed to align multiple indicators to increase the probability of successful trades by confirming trends and momentum before entering a position. It systematically manages risk with ATR-based stop loss and take profit levels, ensuring that trades are exited based on market conditions rather than arbitrary points. The combination of trend indicators (SMAs) with momentum and volatility indicators (MACD, RSI, ATR) creates a robust approach to trading in various market environments.

Fibonacci-Only StrategyFibonacci-Only Strategy
This script is a custom trading strategy designed for traders who leverage Fibonacci retracement levels to identify potential trade entries and exits. The strategy is versatile, allowing users to trade across multiple timeframes, with built-in options for dynamic stop loss, trailing stops, and take profit levels.
Key Features:
Custom Fibonacci Levels:
This strategy calculates three specific Fibonacci retracement levels: 19%, 82.56%, and the reverse 19% level. These levels are used to identify potential areas of support and resistance where price reversals or breaks might occur.
The Fibonacci levels are calculated based on the highest and lowest prices within a 100-bar period, making them dynamic and responsive to recent market conditions.
Dynamic Entry Conditions:
Touch Entry: The script enters long or short positions when the price touches specific Fibonacci levels and confirms the move with a bullish (for long) or bearish (for short) candle.
Break Entry (Optional): If the "Use Break Strategy" option is enabled, the script can also enter positions when the price breaks through Fibonacci levels, providing more aggressive entry opportunities.
Stop Loss Management:
The script offers flexible stop loss settings. Users can choose between a fixed percentage stop loss or an ATR-based stop loss, which adjusts based on market volatility.
The ATR (Average True Range) stop loss is multiplied by a user-defined factor, allowing for tailored risk management based on market conditions.
Trailing Stop Mechanism:
The script includes an optional trailing stop feature, which adjusts the stop loss level as the market moves in favor of the trade. This helps lock in profits while allowing the trade to run if the trend continues.
The trailing stop is calculated as a percentage of the difference between the entry price and the current market price.
Multiple Take Profit Levels:
The strategy calculates seven take profit levels, each at incremental percentages above (for long trades) or below (for short trades) the entry price. This allows for gradual profit-taking as the market moves in the trade's favor.
Each take profit level can be customized in terms of the percentage of the position to be closed, providing precise control over exit strategies.
Strategy Backtesting and Results:
Realistic Backtesting:
The script has been backtested with realistic account sizes, commission rates, and slippage settings to ensure that the results are applicable to actual trading scenarios.
The backtesting covers various timeframes and markets to ensure the strategy's robustness across different trading environments.
Default Settings:
The script is published with default settings that have been optimized for general use. These settings include a 15-minute timeframe, a 1.0% stop loss, a 2.0 ATR multiplier for stop loss, and a 1.5% trailing stop.
Users can adjust these settings to better fit their specific trading style or the market they are trading.
How It Works:
Long Entry Conditions:
The strategy enters a long position when the price touches the 19% Fibonacci level (from high to low) or the reverse 19% level (from low to high) and confirms the move with a bullish candle.
If the "Use Break Strategy" option is enabled, the script will also enter a long position when the price breaks below the 19% Fibonacci level and then moves back up, confirming the break with a bullish candle.
Short Entry Conditions:
The strategy enters a short position when the price touches the 82.56% Fibonacci level and confirms the move with a bearish candle.
If the "Use Break Strategy" option is enabled, the script will also enter a short position when the price breaks above the 82.56% Fibonacci level and then moves back down, confirming the break with a bearish candle.
Stop Loss and Take Profit Logic:
The stop loss for each trade is calculated based on the selected method (fixed percentage or ATR-based). The strategy then manages the trade by either trailing the stop or taking profit at predefined levels.
The take profit levels are set at increments of 0.5% above or below the entry price, depending on whether the position is long or short. The script gradually exits the trade as these levels are hit, securing profits while minimizing risk.
Usage:
For Fibonacci Traders:
This script is ideal for traders who rely on Fibonacci retracement levels to find potential trade entries and exits. The script automates the process, allowing traders to focus on market analysis and decision-making.
For Trend and Swing Traders:
The strategy's flexibility in handling both touch and break entries makes it suitable for trend-following and swing trading strategies. The multiple take profit levels allow traders to capture profits in trending markets while managing risk.
Important Notes:
Originality: This script uniquely combines Fibonacci retracement levels with dynamic stop loss management and multiple take profit levels. It is not just a combination of existing indicators but a thoughtful integration designed to enhance trading performance.
Disclaimer: Trading involves risk, and it is crucial to test this script in a demo account or through backtesting before applying it to live trading. Users should ensure that the settings align with their individual risk tolerance and trading strategy.

Chieu - Bollinger Bands SMA 50 StrategyOverview
The Custom Bollinger Bands Indicator is a versatile tool designed to help traders identify potential market reversals and optimize their trading strategies. This indicator combines Bollinger Bands with an ATR-based stop-loss mechanism, configurable take-profit levels, and dynamic position sizing to manage risk effectively. By highlighting key market conditions and providing clear visual cues, it enables traders to make informed decisions and execute trades with precision.
Key Features
Bollinger Bands Calculation:
The indicator calculates Bollinger Bands based on a configurable Simple Moving Average (SMA) length.
Standard deviation multiplier is adjustable, allowing traders to fine-tune the width of the bands.
Candlestick Highlighting:
Candles that touch the upper or lower Bollinger Bands are highlighted, indicating potential overbought or oversold conditions.
Reversal candles are identified and highlighted based on specific criteria:
The candle must touch the Bollinger Bands for two consecutive periods.
The reversal candle must have a body at least twice the size of the previous candle's body.
The reversal candle must close in the opposite direction to the previous candle (e.g., a bullish candle following a bearish one).
Stop-Loss and Take-Profit Levels:
Stop-loss levels are calculated using the ATR (Average True Range) indicator, ensuring they are dynamically adjusted based on market volatility.
Two configurable take-profit levels (1R and 2R) are plotted based on the initial risk (distance between entry and stop-loss).
Take-profit and stop-loss lines are visually represented on the chart for easy reference.
Position Sizing and Risk Management:
The indicator includes configurable inputs for account balance, leverage, and risk percentage.
It calculates the nominal value (position size without leverage) and cost value (position size with leverage) based on the specified risk parameters.
Combined labels display SL, TP, nominal value, and cost value, replacing the default "Reversal" text for clear, concise information.
Customization Options:
Users can configure the length of the take-profit lines.
The option to toggle the highlighting of candles touching the Bollinger Bands on or off, while always highlighting the identified reversal candles.
How to Use
Configuration:
Set the desired SMA length and Bollinger Bands multiplier in the input settings.
Configure the ATR length for accurate stop-loss calculations.
Adjust the risk-reward ratio and take-profit line length according to your trading strategy.
Specify your account balance, leverage, and risk percentage for precise position sizing.
Chart Analysis:
Monitor the chart for candles touching the upper or lower Bollinger Bands. These highlights indicate potential overbought or oversold conditions.
Look for highlighted reversal candles, which meet the specified criteria and suggest a potential market reversal.
Use the plotted stop-loss and take-profit lines to manage your trades effectively. The combined labels provide all necessary information (SL, TP, nominal value, and cost value) for quick decision-making.
Execution and Risk Management:
Enter trades based on the reversal candle signals.
Set your stop-loss at the indicated level using the ATR calculation.
Take partial profits at the first take-profit level (1R) and adjust your stop-loss to the entry point to secure the remaining position.
Exit the trade entirely at the second take-profit level (2R) or if the price returns to the adjusted stop-loss level.
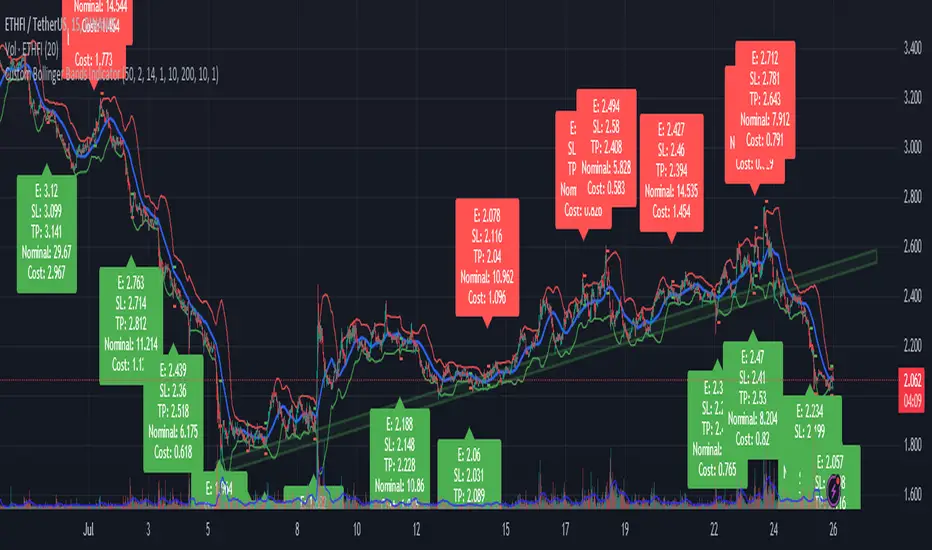
Improved Volume Based Indicator# Improved Volume Based Indicator
## Overview
The Improved Volume Based Indicator is a technical analysis tool designed to identify potential trading opportunities based on volume patterns, price action, and trend direction. This indicator combines volume analysis with moving averages and the Average True Range (ATR) to generate buy and sell signals.
## Key Components
1. Volume Analysis
- Tracks consecutive volume direction (up or down) for 3 periods
- Calculates volume ratio compared to a short-term moving average
2. Trend Direction
- Uses a 200-period Exponential Moving Average (EMA) to determine overall trend
3. Volatility Measurement
- Incorporates the Average True Range (ATR) for stop-loss and take-profit calculations
## Signal Generation
### Buy Signal Criteria
1. Three consecutive periods of up volume (close > open)
2. Volume ratio > 1.5 (current volume is 50% higher than the short-term average)
3. Current price is above the 200 EMA
### Sell Signal Criteria
1. Three consecutive periods of down volume (close < open)
2. Volume ratio > 1.5 (current volume is 50% higher than the short-term average)
3. Current price is below the 200 EMA
## Risk Management
The indicator calculates stop-loss and take-profit levels based on the ATR:
- Stop Loss: ATR * 1.5 (default)
- Take Profit: ATR * 2.5 (default)
These levels are adjustable through input parameters.
## Usage
1. Add the indicator to your chart
2. Adjust input parameters as needed:
- Volume Period (2-5)
- ATR Period (default 14)
- ATR Multipliers for Stop Loss and Take Profit
- EMA Period (default 200)
3. Monitor for buy and sell signals
4. Use the provided stop-loss and take-profit levels for risk management
## Interpretation
- Buy signals suggest potential upward price movement
- Sell signals suggest potential downward price movement
- Always consider other factors and perform additional analysis before making trading decisions
## Limitations
- This indicator may generate false signals in choppy or ranging markets
- It's best used in conjunction with other technical analysis tools and fundamental analysis
- Past performance does not guarantee future results
Remember to thoroughly test this indicator on historical data and in various market conditions before using it in live trading.
---
# 改進的基於交易量的指標
## 概述
改進的基於成交量的指標是一種技術分析工具,旨在根據成交量模式、價格行為和趨勢方向識別潛在的交易機會。此指標將成交量分析與移動平均線和平均真實波動幅度 (ATR) 結合起來,以產生買入和賣出訊號。
## 關鍵部件
1. 成交量分析
- 追蹤 3 個週期的連續成交量方向(向上或向下)
- 計算與短期移動平均線相比的成交量比率
2. 趨勢方向
- 使用 200 週期指數移動平均線 (EMA) 來確定整體趨勢
3. 波動率測量
- 納入平均真實波動範圍 (ATR) 以進行停損和停盈計算
## 訊號生成
### 購買訊號標準
1. 連續三個週期的成交量上漲(收盤>開盤)
2.成交量比率>1.5(目前成交量較短期平均高50%)
3. 當前價格高於200 EMA
### 賣出訊號標準
1.連續三個週期的成交量下跌(收盤<開盤)
2.成交量比率>1.5(目前成交量較短期平均高50%)
3. 目前價格低於200 EMA
## 風險管理
此指標根據 ATR 計算停損和止盈水準:
- 停損:ATR * 1.5(預設)
- 止盈:ATR * 2.5(預設)
這些等級可透過輸入參數進行調整。
## 用法
1. 將指標加入您的圖表中
2. 根據需要調整輸入參數:
- 卷期 (2-5)
- ATR 週期(預設 14)
- 用於停損和止盈的 ATR 乘數
- EMA 週期(預設 200)
3. 監控買賣訊號
4. 使用提供的停損和停利水準進行風險管理
## 解釋
- 買進訊號表示價格可能上漲
- 賣出訊號表示價格可能下跌
- 在做出交易決策之前始終考慮其他因素並進行額外分析
## 限制
- 此指標可能會在波動或波動的市場中產生錯誤訊號
- 最好與其他技術分析工具和基本面分析結合使用
- 過去的表現並不能保證未來的結果
請記住,在實際交易中使用該指標之前,請根據歷史數據和各種市場條件徹底測試該指標。
