All Divergences with trend / SL - Uncle SamThanks to the main inspiration behind this strategy and the hard work of:
"Divergence for many indicators v4 by LonesomeTheBlue"
The "All Divergence" strategy is a versatile approach for identifying and acting upon various divergences in the market. Divergences occur when price and an indicator move in opposite directions, often signaling potential reversals. This strategy incorporates both regular and hidden divergences across multiple indicators (MACD, Stochastics, CCI, etc.) for a comprehensive analysis.
Key Features:
Comprehensive Divergence Analysis: The strategy scans for regular and hidden divergences across a variety of indicators, increasing the probability of identifying potential trade setups.
Trend Filter: To enhance accuracy, a moving average (MA) trend filter is integrated. This ensures trades align with the overall market trend, reducing the risk of false signals.
Customizable Risk Management: Users can adjust parameters for long/short stop-loss and take-profit levels to match their individual risk tolerance.
Additional Risk Management (Optional): An experimental MA-based risk management feature can be enabled to close positions if the market shows consecutive closes against the trend.
Clear Visuals: The script plots pivot points, divergence lines, and stop-loss levels on the chart for easy reference.
Strategy Settings (Defaults):
Enable Long/Short Strategy: True
Long/Short Stop Loss %: 2%
Long/Short Take Profit %: 5%
Enable MA Trend: True
MA Type: HMA (Hull Moving Average)
MA Length: 500
Use MA Risk Management: False (Experimental)
MA Risk Exit Candles: 2 (If enabled)
Pivot Period: 9
Source for Pivot Points: Close
Backtest Details (Example):
The strategy has been backtested on XAUUSD 1H (Goold/USD 1 hour timeframe) with a starting capital of $1,000. The backtest period covers around 2 years. A commission of 0.02% per trade and a 0.1% slippage per trade were factored in to simulate real-world trading costs.
Disclaimer:
This strategy is for educational and informational purposes only. Backtested results are not indicative of future performance. Use this strategy at your own risk. Always conduct your own analysis and consider consulting a financial professional before making any trading decisions.
Important Notes:
The default settings are a good starting point, but feel free to experiment to find optimal parameters for your specific trading style and market.
The MA-based risk management is an experimental feature. Use it with caution and thoroughly test it before deploying in live trading.
Backtest results can vary depending on the market, timeframe, and specific settings used. Always consider slippage and commission fees when evaluating a strategy's potential profitability.
"profit" için komut dosyalarını ara

Smoothed Heiken Ashi Strategy Long OnlyThis is a trend-following approach that uses a modified version of Heiken Ashi candles with additional smoothing. Here are the key components and features:
1. Heiken Ashi Modification: The strategy starts by calculating Heiken Ashi candles, which are known for better trend visualization. However, it modifies the traditional Heiken Ashi by using Exponential Moving Averages (EMAs) of the open, high, low, and close prices.
2. Double Smoothing: The strategy applies two layers of smoothing. First, it uses EMAs to calculate the Heiken Ashi values. Then, it applies another EMA to the Heiken Ashi open and close prices. This double smoothing aims to reduce noise and provide clearer trend signals.
3. Long-Only Approach: As the name suggests, this strategy only takes long positions. It doesn't short the market during downtrends but instead exits existing long positions when the sell signal is triggered.
4. Entry and Exit Conditions:
- Entry (Buy): When the smoothed Heiken Ashi candle color changes from red to green (indicating a potential start of an uptrend).
- Exit (Sell): When the smoothed Heiken Ashi candle color changes from green to red (indicating a potential end of an uptrend).
5. Position Sizing: The strategy uses a percentage of equity for position sizing, defaulting to 100% of available equity per trade. This should be tailored to each persons unique approach. Responsible trading would use less than 5% for each trade. The starting capital used is a responsible and conservative $1000, reflecting the average trader.
This strategy aims to provide a smooth, trend-following approach that may be particularly useful in markets with clear, sustained trends. However, it may lag in choppy or ranging markets due to its heavy smoothing. As with any strategy, it's important to thoroughly backtest and forward test before using it with real capital, and to consider using it in conjunction with other analysis tools and risk management techniques.
This has been created mainly to provide data to judge what time frame is most profitable for any single asset, as the volatility of each asset is different. This can bee seen using it on AUXUSD, which has a higher profitable result on the daily time frame, whereas other currencies need a higher or lower time frame. The user can toggle between each time frame and watch for the higher profit results within the strategy tester window.
Other smoothed Heiken Ashi indicators also do not provide buy and sell signals, and only show the change in color to dictate a change in trend. By adding buy and sell signals after the close of the candle in which the candle changes color, alerts can be programmed, which helps this be a more hands off protocol to experiment with. Other smoothed Heiken Ashi indicators do not allow for alarms to be set.
This is a unique HODL strategy which helps identify a change in trend, without the noise of day to day volatility. By switching to a line chart, it removes the candles altogether to avoid even more noise. The goal is to HODL a coin while the color is bullish in an uptrend, but once the indicator gives a sell signal, to sell the holdings back to a stable coin and let the chart ride down. Once the chart gives the next buy signal, use that same capital to buy back into the asset. In essence this removes potential losses, and helps buy back in cheaper, gaining more quantitity fo the asset, and therefore reducing your average initial buy in price.
Most HODL strategies ride the price up, miss selling at the top, then riding the price back down in anticipation that it will go back up to sell. This strategy will not hit the absolute tops, but it will greatly reduce potential losses.

CCI and MACD Auto Trading Strategy with Risk/RewardOverview:
This strategy combines the Commodity Channel Index (CCI) and the Moving Average Convergence Divergence (MACD) indicators to automate trading decisions. It dynamically sets stop-loss and take-profit levels based on recent lows and highs, ensuring a risk/reward ratio of 1:1.5. This script aims to leverage trend and momentum signals while maintaining effective risk management.
Originality and Usefulness:
This script is not just a simple mashup of CCI and MACD indicators; it incorporates dynamic risk management by setting stop-loss and take-profit levels based on recent price action. This approach helps traders to:
・Identify potential trend reversals using the combination of CCI and MACD signals.
・Manage trades effectively by setting realistic stop-loss and take-profit levels based on recent market data.
・Maintain a balanced risk/reward ratio, which is essential for sustainable trading.
Indicators Used:
・CCI (Commodity Channel Index):
・Measures the deviation of the price from its average over a specified period, typically ranging from -100 to +100.
・Helps identify overbought and oversold conditions.
・MACD (Moving Average Convergence Divergence):
・Utilizes the difference between short-term and long-term moving averages to indicate trend strength and direction.
・Provides momentum signals that can be used for timing entries and exits.
How It Works:
Entry Conditions:
Long Entry:
・The MACD histogram is above zero.
・The CCI crosses above the -100 line.
Short Entry:
・The MACD histogram is below zero.
・The CCI crosses below the +100 line.
Exit Conditions:
Long Positions:
・The stop-loss is set at the recent low.
・The take-profit is set at 1.5 times the distance between the entry price and the stop-loss.
Short Positions:
・The stop-loss is set at the recent high.
・The take-profit is set at 1.5 times the distance between the entry price and the stop-loss.
Risk Management:
・The script dynamically adjusts stop-loss and take-profit levels based on recent market data, ensuring that the risk/reward ratio is maintained at 1:1.5.
・This approach helps in managing the risk effectively while aiming for consistent profits.
Strategy Properties:
・Account Size: Configured for a realistic account size suitable for the average trader.
・Commission and Slippage: Includes settings for realistic commission and slippage to reflect real market conditions.
・Risk per Trade: Designed to risk no more than 5-10% of equity per trade, aligning with sustainable trading practices.
・Backtesting Results: Configured to generate a sufficient sample size (ideally more than 100 trades) for reliable backtesting results.
Revised Backtesting Settings
Ensure that your backtesting settings are realistic:
・Account Size: Set a realistic initial capital suitable for the average trader.
・Commission and Slippage: Include realistic commission fees and slippage.
・Risk Management: Ensure that each trade risks no more than 5-10% of the account equity.
・Sufficient Sample Size: Choose a dataset that will generate more than 100 trades to provide a robust sample size.

Advanced Gold Scalping Strategy with RSI Divergence# Advanced Gold Scalping Strategy with RSI Divergence
## Overview
This Pine Script implements an advanced scalping strategy for gold (XAUUSD) trading, primarily designed for the 1-minute timeframe. The strategy utilizes the Relative Strength Index (RSI) indicator along with its moving average to identify potential trade setups based on divergences between price action and RSI movements.
## Key Components
### 1. RSI Calculation
- Uses a customizable RSI length (default: 60)
- Allows selection of the source for RSI calculation (default: close price)
### 2. Moving Average of RSI
- Supports multiple MA types: SMA, EMA, SMMA (RMA), WMA, VWMA, and Bollinger Bands
- Customizable MA length (default: 3)
- Option to display Bollinger Bands with adjustable standard deviation multiplier
### 3. Divergence Detection
- Implements both bullish and bearish divergence identification
- Uses pivot high and pivot low points to detect divergences
- Allows for customization of lookback periods and range for divergence detection
### 4. Entry Conditions
- Long Entry: Bullish divergence when RSI is below 40
- Short Entry: Bearish divergence when RSI is above 60
### 5. Trade Management
- Stop Loss: Customizable, default set to 11 pips
- Take Profit: Customizable, default set to 33 pips
### 6. Visualization
- Plots RSI line and its moving average
- Displays horizontal lines at 30, 50, and 70 RSI levels
- Shows Bollinger Bands when selected
- Highlights divergences with "Bull" and "Bear" labels on the chart
## Input Parameters
- RSI Length: Adjusts the period for RSI calculation
- RSI Source: Selects the price source for RSI (close, open, high, low, hl2, hlc3, ohlc4)
- MA Type: Chooses the type of moving average applied to RSI
- MA Length: Sets the period for the moving average
- BB StdDev: Adjusts the standard deviation multiplier for Bollinger Bands
- Show Divergence: Toggles the display of divergence labels
- Stop Loss: Sets the stop loss distance in pips
- Take Profit: Sets the take profit distance in pips
## Strategy Logic
1. **RSI Calculation**:
- Computes RSI using the specified length and source
- Calculates the chosen type of moving average on the RSI
2. **Divergence Detection**:
- Identifies pivot points in both price and RSI
- Checks for higher lows in RSI with lower lows in price (bullish divergence)
- Checks for lower highs in RSI with higher highs in price (bearish divergence)
3. **Trade Entry**:
- Enters a long position when a bullish divergence is detected and RSI is below 40
- Enters a short position when a bearish divergence is detected and RSI is above 60
4. **Position Management**:
- Places a stop loss order at the entry price ± stop loss pips (depending on the direction)
- Sets a take profit order at the entry price ± take profit pips (depending on the direction)
5. **Visualization**:
- Plots the RSI and its moving average
- Draws horizontal lines for overbought/oversold levels
- Displays Bollinger Bands if selected
- Shows divergence labels on the chart for identified setups
## Usage Instructions
1. Apply the script to a 1-minute XAUUSD (Gold) chart in TradingView
2. Adjust the input parameters as needed:
- Increase RSI Length for less frequent but potentially more reliable signals
- Modify MA Type and Length to change the sensitivity of the RSI moving average
- Adjust Stop Loss and Take Profit levels based on current market volatility
3. Monitor the chart for Bull (long) and Bear (short) labels indicating potential trade setups
4. Use in conjunction with other analysis and risk management techniques
## Considerations
- This strategy is designed for short-term scalping and may not be suitable for all market conditions
- Always backtest and forward test the strategy before using it with real capital
- The effectiveness of divergence-based strategies can vary depending on market trends and volatility
- Consider using additional confirmation signals or filters to improve the strategy's performance
Remember to adapt the strategy parameters to your risk tolerance and trading style, and always practice proper risk management.

Universal Algo [Coff3eG]Universal Algo By G
Overview:
Universal Algo By G is a comprehensive LONG-ONLY trading strategy specifically designed for medium to long-term use in cryptocurrency markets, particularly Bitcoin. This algorithm can be manually adjusted to fit the volatility of specific coins, ensuring the best possible results. While it does not generate a large number of trades due to the nature of bull and bear market cycles, it has been rigorously backtested and forward-tested to ensure the strategy is not overfitted.
Core Features:
Integrated Systems: Universal Algo is built around five core systems, each contributing unique analytical perspectives to enhance trade signal reliability. These systems are designed to identify clear trend opportunities for significant gains while also employing logic to navigate through ranging markets effectively.
Optional Ranging Market Filter: Helps filter out noise, potentially enhancing signal clarity.
Market State Detection: Identifies four distinct market states:
Trending
Ranging
Danger (Possible top)
Possible Bottom
Global Liquidity Indicator (GLI) Integration: Leverages GLI values to identify positive liquidity trends.
Volatility Bands: Provides insights into market volatility.
Top and Bottom Detection: Shows possible bottoms with green backgrounds and red backgrounds for possible top detection.
The Market State Detection, GLI, Volatility Bands, and Top and Bottom Detection feature all serve as an expectation management feature.
Additional Features:
Optional Metrics Table: Displays strategy metrics and statistics, providing detailed insights into performance.
Customization Options: The script offers a range of user inputs, allowing for customization of the backtesting starting date, the decision to display the strategy equity curve, among other settings. These inputs cater to diverse trading needs and preferences, offering users control over their strategy implementation.
Operational Parameters:
Customizable Inputs: Users can adjust thresholds to match the coin's volatility, enhancing strategy performance.
Transparency and Logic Insight: While specific calculation details and proprietary indicators are integral to maintaining the uniqueness of Universal Algo, the strategy is grounded on well-established financial analysis techniques. These include momentum analysis, volatility assessments, and adaptive thresholding, among others, to formulate its trade signals. Notably, no single indicator is used in isolation; each indicator is combined with another to enhance signal accuracy and robustness. Some of the indicators include customized versions of the TEMA, Supertrend, Augmented Dickey-Fuller (ADF), and Weekly Positive Directional Movement Index (WPDM), all integrated together to create a cohesive and effective trading strategy.
System Operation:
Universal Algo works by taking the average score of the five core systems used for the signals. Three of these systems have been lengthened out to function as longer-term systems, while the remaining two operate at a slightly faster speed. This combination and averaging of systems help to balance the overall strategy, ensuring it maintains the right amount of speed to remain effective for medium to long-term use with minimal noise. The average score is then compared against customizable thresholds. The strategy will go long if the average score is above the threshold and short if it is below the threshold. This averaging mechanism helps to smooth out individual system anomalies and provides a more robust signal for trading decisions.
Originality and Usefulness:
Universal Algo is an original strategy that combines multiple proprietary and customized indicators to deliver robust trading signals. The strategy integrates various advanced indicators and methodologies, including:
System Indicator: Calculates a cumulative score based on recent price movements, aiding in trend detection.
Median For Loop: Utilizes percentile rank calculations of price data to gauge market direction.
Volatility Stop: A modified volatility-based stop-loss indicator that adjusts based on market conditions.
Supertrend: A customized supertrend indicator that uses percentile ranks and ATR for trend detection.
RSI and DEMA: Combines a modified RSI and DEMA for overbought/oversold conditions.
TEMA: Uses 3 different types of MA for trend detection and standard deviation bands for additional confirmation.
Detailed Explanation of Components and Their Interaction:
RSI (Relative Strength Index): Used to identify overbought and oversold conditions. In Universal Algo, RSI is combined with DEMA (Double Exponential Moving Average) to smooth the price data and provide clearer signals.
ATR (Average True Range): Used to measure market volatility. ATR is incorporated into the Volatility Stop and Supertrend indicators to adjust stop-loss levels and trend detection based on current market conditions.
DEMA (Double Exponential Moving Average): Provides a smoother price trend compared to traditional moving averages, reducing lag and making it easier to identify trend changes.
Modified TEMA (Triple Exponential Moving Average): Similar to DEMA but provides even greater smoothing, reducing lag further and enhancing trend detection accuracy.
Volatility Stop: Utilizes ATR to dynamically set stop-loss levels that adapt to changing market volatility. This helps in protecting profits and minimizing losses.
Customized Supertrend: Uses ATR and percentile ranks to determine trend direction and strength. This indicator helps in capturing major trends while filtering out market noise.
Median For Loop: Calculates percentile ranks of price data over a specified period to assess market direction. This helps in identifying potential reversals and trend continuations.
HMA (Hull Moving Average): A fast-acting moving average that reduces lag while maintaining smoothness. It helps in quickly identifying trend changes.
SMA (Simple Moving Average): A traditional moving average that provides baseline trend information. Combined with HMA and other indicators, it forms a comprehensive trend detection system.
Universal Algo offers a sophisticated blend of advanced indicators and proprietary logic that is not available in free or open-source scripts. Here are some reasons why it is worth paying for:
Customization and Flexibility: The strategy provides a high degree of customization, allowing users to adjust various parameters to suit their trading style and market conditions. This flexibility is often not available in free scripts.
Proprietary Indicators: The use of proprietary and customized indicators such as the TEMA, Supertrend, ADF, and WPDM ensures that the strategy is unique and not replicable by free or open-source scripts.
Integrated Systems: The strategy combines multiple systems and indicators to provide a more comprehensive and reliable trading signal. This integration helps to smooth out anomalies and reduces noise, providing clearer trading opportunities.
Rigorous Testing: Universal Algo has undergone extensive backtesting and forward-testing to ensure its robustness and reliability. The results demonstrate its ability to perform well under various market conditions, offering users confidence in its effectiveness.
Detailed Metrics and Analysis: The optional metrics table provides users with detailed insights into the strategy's performance, including metrics like equity, drawdown, Sharpe ratio, and more. This level of detail helps traders make informed decisions.
Value Addition: By providing a strategy that combines advanced indicators, customization options, and thorough testing, Universal Algo adds significant value to traders looking for a reliable and adaptable trading tool.
Realistic Trading Conditions:
Backtesting and Forward-Testing: Rigorous testing ensures performance and reliability, with a focus on prudent risk management. Default properties include an initial capital of $1000, 0 pyramiding, 20 slippage, 0.05% commission, and using 5% of equity for trades.
The strategy is designed and tested with a focus on achieving a balance between risk and reward, striving for robustness and reliability rather than unrealistic profitability promises. Realistic trading conditions are considered, including appropriate account size, commission, slippage, and sustainable risk levels per trade.
Concluding Thoughts:
Universal Algo By G is offered to the TradingView community as a robust tool for enhancing market analysis and trading strategies. It is designed with a commitment to quality, innovation, and adaptability, aiming to provide valuable insights and decision support across various market conditions. Potential users are encouraged to evaluate Universal Algo within the context of their overall trading approach and objectives.

Momentum Alligator 4h Bitcoin StrategyOverview
The Momentum Alligator 4h Bitcoin Strategy is a trend-following trading system that operates on dual time frames. It utilizes the 1D Williams Alligator indicator to identify the prevailing major price trend and seeks trading opportunities on the 4-hour (4h) time frame when the momentum is turning up. The strategy is designed to close trades if the trend fails to develop or holding position if price continues increasing without any significant correction. Note that this strategy is specifically tailored for the 4-hour time frame.
Unique Features
2-layers market noise filtering system: Trades are only initiated in the direction of the 1D trend, determined by the Williams Alligator indicator. This higher time frame confirmation filters out minor trade signals, focusing on more substantial opportunities. At the same time, strategy has additional filter on 4h time frame with Awesome Oscillator which is showing the current price momentum.
Flexible Risk Management: The strategy exclusively opens long positions, resulting in fewer trades during bear markets. It incorporates a dynamic stop-loss mechanism, which can either follow the jaw line of the 4h Alligator or a user-defined fixed stop-loss. This flexibility helps manage risk and avoid non-trending markets.
Methodology
The strategy initiates a long position when the d-line of Stochastic RSI crosses up it's k-line. It means that there is a high probability that price momentum reversed from down to up. To avoid overtrading in potentially choppy markets, it skips the next two trades following a winning trade, anticipating sideways movement after a significant price surge.
This strategy has two layers trades filtering system: 4h and 1D time frames. The first one is awesome oscillator. It shall be increasing and value has to be higher than it's 5-period SMA. This is an additional confirmation that long trade is opened in the direction of the current momentum. As it was mentioned above, all entry signals are validated against the 1D Williams Alligator indicator. A trade is only opened if the price is above all three lines of the 1D Alligator, ensuring alignment with the major trend.
A trade is closed if the price hits the 4h jaw line of the Alligator or reaches the user-defined stop-loss level.
Risk Management
The strategy employs a combined approach to risk management:
It allows positions to ride the trend as long as the price continues to move favorably, aiming to capture significant price movements. It features a user-defined stop-loss parameter to mitigate risks based on individual risk tolerance. By default, this stop-loss is set to a 2% drop from the entry point, but it can be adjusted according to the trader's preferences.
Justification of Methodology
This strategy leverages Stochastic RSI on 4h time frame to open long trade when momentum started reversing to the upside. On the one hand, Stochastic RSI is one of the most sensitive indicator, which allows to react fast on the potential trend reversal. On the other hand, this indicator can be too sensitive and provide a lot of false trend changing signals. To eliminate this weakness we use two-layers trades filtering system.
The first layer is the 4h Awesome oscillator. This is less sensitive momentum indicator. Usually it starts increasing when price has already passed significant distance from the actual reversal point. The strategy opens long trade only is Awesome oscillator is increasing and above it's 5-period SMA. This approach increases the probability to filter the false signals during the choppy market or if the reversal is false.
The second layer filter is the Williams Alligator indicator on 1D time frame. The 1D Alligator serves as a filter for identifying the primary trend and increases probability to avoid the trades with low potential because trading against major trend usually is more risky. It's much better to catch the trend continuation than local bounce.
Last but not least feature of this strategy is close trades condition. It uses the flexible approach. First of all, user can set up the fixed stop-loss according to his own risk-tolerance, by default this value is 2% of price movement. It restricts the potential loss at the moment when trade has just been opened. Moreover strategy utilizes the 4h Williams Alligator's jaw line to exit the trade. If price fell below it trade is closed. This approach helps to not keep open trade if trend is not developing and hold it if price continues going up.
Backtest Results:
Operating window: Date range of backtests is 2021.01.01 - 2024.05.01. It is chosen to let the strategy to close all opened positions.
Commission and Slippage: Includes a standard Binance commission of 0.1% and accounts for possible slippage over 5 ticks.
Initial capital: 10000 USDT
Percent of capital used in every trade: 50%
Maximum Single Position Loss: -3.04%
Maximum Single Profit: +29.67%
Net Profit: +6228.01 USDT (+62.28%)
Total Trades: 118 (24.58% win rate)
Profit Factor: 1.71
Maximum Accumulated Loss: 1527.69 USDT (-11.52%)
Average Profit per Trade: 52.78 USDT (+0.89%)
Average Trade Duration: 60 hours
These results are obtained with realistic parameters representing trading conditions observed at major exchanges such as Binance and with realistic trading portfolio usage parameters.
How to Use:
Add the script to favorites for easy access.
Apply to the 4h timeframe desired chart (optimal performance observed on the BTC/USDT).
Configure settings using the dropdown choice list in the built-in menu.
Set up alerts to automate strategy positions through web hook with the text: {{strategy.order.alert_message}}
Disclaimer:
Educational and informational tool reflecting Skyrex commitment to informed trading. Past performance does not guarantee future results. Test strategies in a simulated environment before live implementation

IsAlgo - Reverse Band Strategy► Overview:
The Reverse Band Strategy leverages a custom band indicator combined with a candlestick pattern for trade entries. The strategy initiates trades when a candle closes outside the bands, anticipating that the price will revert inside the bands and reach the opposite side.
► Description:
The Reverse Band Strategy is built around a sophisticated custom band indicator designed to identify potential reversal points in the market. The bands are calculated using a proprietary formula that factors in the trend's slope, the highest and lowest points within the trend, the average price movement, and the number of candles that form the trend. This advanced calculation allows for a dynamic and responsive band that adjusts to market conditions.
Once the band edges are identified, the strategy continuously monitors for candles that close outside these bands. When such a candle is detected, it signals a potential reversal, triggering an entry. The expectation is that the price will revert back inside the bands and move towards the opposite band edge.
How it Works:
Band Calculation: The strategy continuously updates the band edges using the aforementioned factors.aforementioned factors.
Signal Detection: It waits for a candle to close outside the bands.
Trade Entry: When an outside-close candle is detected, the strategy enters a trade expecting the price to revert to the opposite band edge.
Customization: Users can define the characteristics of the entry candle, such as its size relative to previous candles, to ensure it meets specific conditions before triggering a trade.
↑ Long Trade Example:
The entry candle closes below the lower band, indicating a potential upward reversal. The strategy enters a long position expecting the price to move towards the upper band.
↓ Short Trade Example:
The entry candle closes above the upper band, signaling a potential downward reversal. The strategy enters a short position anticipating the price to revert towards the lower band.
► Features and Settings:
⚙︎ Band Customization: Adjust band length, smoothness, and minimum distance to fit different market conditions and trading styles.
⚙︎ Entry Candle: Customize criteria such as candle size, body, and relative position to previous candles to ensure precise entry signals.
⚙︎ Trading Session: This feature allows users to define specific trading hours during which the strategy should operate, ensuring trades are executed only during preferred market periods.
⚙︎ Trading Days: Users can specify which days the strategy should be active, offering the flexibility to avoid trading on specific days of the week.
⚙︎ Backtesting: Enables a backtesting period during which the strategy can be tested over a selected start and end date. This feature can be deactivated if not needed.
⚙︎ Trades: Configure trade direction (long, short, or both), position sizing (fixed or percentage-based), maximum number of open trades, and trade limitations per day or based on band.
⚙︎ Trades Exit: Set profit/loss limits, specify trade duration, or exit based on band reversal signals.
⚙︎ Stop Loss: Various stop-loss methods are available, including a fixed number of pips, ATR-based, or using the highest or lowest price points within a specified number of previous candles. Additionally, trades can be closed after a specific number of candles move in the opposite direction of the trade.
⚙︎ Break Even: This feature adjusts the stop loss to a break-even point once certain conditions are met, such as reaching predefined profit levels, to protect gains.
⚙︎ Trailing Stop: The trailing stop feature adjusts the stop loss as the trade moves into profit, securing gains while potentially capturing further upside.
⚙︎ Take Profit: Up to three take-profit levels can be set using various methods, such as a fixed amount of pips, ATR, or risk-to-reward ratios based on the stop loss. Alternatively, users can specify a set number of candles moving in the direction of the trade.
⚙︎ Alerts: The strategy includes a comprehensive alert system that informs the user of all significant actions, such as trade openings and closings. It supports placeholders for dynamic values like take-profit levels and stop-loss prices.
⚙︎ Dashboard: A visual display provides detailed information about ongoing and past trades on the chart, helping users monitor the strategy's performance and make informed decisions.
► Backtesting Details:
Timeframe: 30-minute GBPUSD chart
Initial Balance: $10,000
Order Size: 5000 units
Commission: 0.02%
Slippage: 5 ticks

Double Vegas SuperTrend Enhanced - Strategy [presentTrading]
█ Introduction and How It Is Different
The "Double Vegas SuperTrend Enhanced" strategy is a sophisticated trading system that combines two Vegas SuperTrend Enhanced. Very Powerful!
Let's celebrate the joy of Children's Day on June 1st! Enjoyyy!
BTCUSD LS performance
The strategy aims to pinpoint market trends with greater accuracy and generate trades that align with the overall market direction.
This approach differentiates itself by integrating volatility adjustments and leveraging the Vegas Channel's width to refine the SuperTrend calculations, resulting in a dynamic and responsive trading system.
Additionally, the strategy incorporates customizable take-profit and stop-loss levels, providing traders with a robust framework for risk management.
-> check Vegas SuperTrend Enhanced - Strategy
█ Strategy, How It Works: Detailed Explanation
🔶 Vegas Channel and SuperTrend Calculations
The strategy initiates by calculating the Vegas Channel, which is derived from a simple moving average (SMA) and the standard deviation (STD) of the closing prices over a specified window length. This channel helps in measuring market volatility and forms the basis for adjusting the SuperTrend indicator.
Vegas Channel Calculation:
- vegasMovingAverage = SMA(close, vegasWindow)
- vegasChannelStdDev = STD(close, vegasWindow)
- vegasChannelUpper = vegasMovingAverage + vegasChannelStdDev
- vegasChannelLower = vegasMovingAverage - vegasChannelStdDev
SuperTrend Multiplier Adjustment:
- channelVolatilityWidth = vegasChannelUpper - vegasChannelLower
- adjustedMultiplier = superTrendMultiplierBase + volatilityAdjustmentFactor * (channelVolatilityWidth / vegasMovingAverage)
The adjusted multiplier enhances the SuperTrend's sensitivity to market volatility, making it more adaptable to changing market conditions.
BTCUSD Local picture.
🔶 Average True Range (ATR) and SuperTrend Values
The ATR is computed over a specified period to measure market volatility. Using the ATR and the adjusted multiplier, the SuperTrend upper and lower levels are determined.
ATR Calculation:
- averageTrueRange = ATR(atrPeriod)
**SuperTrend Calculation:**
- superTrendUpper = hlc3 - (adjustedMultiplier * averageTrueRange)
- superTrendLower = hlc3 + (adjustedMultiplier * averageTrueRange)
The SuperTrend levels are continuously updated based on the previous values and the current market trend direction. The market trend is determined by comparing the closing prices with the SuperTrend levels.
Trend Direction:
- If close > superTrendLowerPrev, then marketTrend = 1 (bullish)
- If close < superTrendUpperPrev, then marketTrend = -1 (bearish)
🔶 Trade Entry and Exit Conditions
The strategy generates trade signals based on the alignment of both SuperTrends. Trades are executed only when both SuperTrends indicate the same market direction.
Entry Conditions:
- Long Position: Both SuperTrends must signal a bullish trend.
- Short Position: Both SuperTrends must signal a bearish trend.
Exit Conditions:
- Positions are exited if either SuperTrend reverses its trend direction.
- Additional conditions include holding periods and configurable take-profit and stop-loss levels.
█ Trade Direction
The strategy allows traders to specify the desired trade direction through a customizable input setting. Options include:
- Long: Only enter long positions.
- Short: Only enter short positions.
- Both: Enter both long and short positions based on the market conditions.
█ Usage
To utilize the "Double Vegas SuperTrend Enhanced" strategy, traders need to configure the input settings according to their trading preferences and market conditions. The strategy includes parameters for ATR periods, Vegas Channel window lengths, SuperTrend multipliers, volatility adjustment factors, and risk management settings such as hold days, take-profit, and stop-loss percentages.
█ Default Settings
The strategy comes with default settings that can be adjusted to fit individual trading styles:
- trade Direction: Both (allows trading in both long and short directions for maximum flexibility).
- ATR Periods: 10 for SuperTrend 1 and 5 for SuperTrend 2 (shorter ATR period results in more sensitivity to recent price movements).
- Vegas Window Lengths: 100 for SuperTrend 1 and 200 for SuperTrend 2 (longer window length results in smoother moving averages and less sensitivity to short-term volatility).
- SuperTrend Multipliers: 5 for SuperTrend 1 and 7 for SuperTrend 2 (higher multipliers lead to wider SuperTrend channels, reducing the frequency of trades).
- Volatility Adjustment Factors: 5 for SuperTrend 1 and 7 for SuperTrend 2 (higher adjustment factors increase the responsiveness to changes in market volatility).
- Hold Days: 5 (defines the minimum duration a position is held, ensuring trades are not exited prematurely).
- Take Profit: 30% (sets the target profit level to lock in gains).
- Stop Loss: 20% (sets the maximum acceptable loss level to mitigate risk).

HilalimSB Strategy HilalimSB A Wedding Gift 🌙
What is HilalimSB🌙?
First of all, as mentioned in the title, HilalimSB is a wedding gift.
HilalimSB - Revealing the Secrets of the Trend
HilalimSB is a powerful indicator designed to help investors analyze market trends and optimize trading strategies. Designed to uncover the secrets at the heart of the trend, HilalimSB stands out with its unique features and impressive algorithm.
Hilalim Algorithm and Fixed ATR Value:
HilalimSB is equipped with a special algorithm called "Hilalim" to detect market trends. This algorithm can delve into the depths of price movements to determine the direction of the trend and provide users with the ability to predict future price movements. Additionally, HilalimSB uses its own fixed Average True Range (ATR) value. ATR is an indicator that measures price movement volatility and is often used to determine the strength of a trend. The fixed ATR value of HilalimSB has been tested over long periods and its reliability has been proven. This allows users to interpret the signals provided by the indicator more reliably.
ATR Calculation Steps
1.True Range Calculation:
+ The True Range (TR) is the greatest of the following three values:
1. Current high minus current low
2. Current high minus previous close (absolute value)
3. Current low minus previous close (absolute value)
2.Average True Range (ATR) Calculation:
-The initial ATR value is calculated as the average of the TR values over a specified period
(typically 14 periods).
-For subsequent periods, the ATR is calculated using the following formula:
ATRt=(ATRt−1×(n−1)+TRt)/n
Where:
+ ATRt is the ATR for the current period,
+ ATRt−1 is the ATR for the previous period,
+ TRt is the True Range for the current period,
+ n is the number of periods.
Pine Script to Calculate ATR with User-Defined Length and Multiplier
Here is the Pine Script code for calculating the ATR with user-defined X length and Y multiplier:
//@version=5
indicator("Custom ATR", overlay=false)
// User-defined inputs
X = input.int(14, minval=1, title="ATR Period (X)")
Y = input.float(1.0, title="ATR Multiplier (Y)")
// True Range calculation
TR1 = high - low
TR2 = math.abs(high - close )
TR3 = math.abs(low - close )
TR = math.max(TR1, math.max(TR2, TR3))
// ATR calculation
ATR = ta.rma(TR, X)
// Apply multiplier
customATR = ATR * Y
// Plot the ATR value
plot(customATR, title="Custom ATR", color=color.blue, linewidth=2)
This code can be added as a new Pine Script indicator in TradingView, allowing users to calculate and display the ATR on the chart according to their specified parameters.
HilalimSB's Distinction from Other ATR Indicators
HilalimSB emerges with its unique Average True Range (ATR) value, presenting itself to users. Equipped with a proprietary ATR algorithm, this indicator is released in a non-editable form for users. After meticulous testing across various instruments with predetermined period and multiplier values, it is made available for use.
ATR is acknowledged as a critical calculation tool in the financial sector. The ATR calculation process of HilalimSB is conducted as a result of various research efforts and concrete data-based computations. Therefore, the HilalimSB indicator is published with its proprietary ATR values, unavailable for modification.
The ATR period and multiplier values provided by HilalimSB constitute the fundamental logic of a trading strategy. This unique feature aids investors in making informed decisions.
Visual Aesthetics and Clear Charts:
HilalimSB provides a user-friendly interface with clear and impressive graphics. Trend changes are highlighted with vibrant colors and are visually easy to understand. You can choose colors based on eye comfort, allowing you to personalize your trading screen for a more enjoyable experience. While offering a flexible approach tailored to users' needs, HilalimSB also promises an aesthetic and professional experience.
Strong Signals and Buy/Sell Indicators:
After completing test operations, HilalimSB produces data at various time intervals. However, we would like to emphasize to users that based on our studies, it provides the best signals in 1-hour chart data. HilalimSB produces strong signals to identify trend reversals. Buy or sell points are clearly indicated, allowing users to develop and implement trading strategies based on these signals.
For example, let's imagine you wanted to open a position on BTC on 2023.11.02. You are aware that you need to calculate which of the buying or selling transactions would be more profitable. You need support from various indicators to open a position. Based on the analysis and calculations it has made from the data it contains, HilalimSB would have detected that the graph is more suitable for a selling position, and by producing a sell signal at the most ideal selling point at 08:00 on 2023.11.02 (UTC+3 Istanbul), it would have informed you of the direction the graph would follow, allowing you to benefit positively from a 2.56% decline.
Technology and Innovation:
HilalimSB aims to enhance the trading experience using the latest technology. With its innovative approach, it enables users to discover market opportunities and support their decisions. Thus, investors can make more informed and successful trades. Real-Time Data Analysis: HilalimSB analyzes market data in real-time and identifies updated trends instantly. This allows users to make more informed trading decisions by staying informed of the latest market developments. Continuous Update and Improvement: HilalimSB is constantly updated and improved. New features are added and existing ones are enhanced based on user feedback and market changes. Thus, HilalimSB always aims to provide the latest technology and the best user experience.
Social Order and Intrinsic Motivation:
Negative trends such as widespread illegal gambling and uncontrolled risk-taking can have adverse financial effects on society. The primary goal of HilalimSB is to counteract these negative trends by guiding and encouraging users with data-driven analysis and calculable investment systems. This allows investors to trade more consciously and safely.
What is HilalimSB Strategy🌙?
HilalimSB Strategy is a strategy that is supported by the HilalimSB algorithm created by the creator of HilalimSB and continues transactions with take profit and stop loss levels determined by users who strategically and automatically open transactions as a result of the data it receives and automatically closes transactions under necessary conditions. It is a first in the tradingview world with its unique take profit and stop loss markings. HilalimSB Strategy is open to users' initiatives and is a trading strategy developed on BTC.
What does the HilalimSB Strategy target?
The main purpose of HilalimSB Strategy is to reduce the transaction load of traders and to be integrated into various brokerage firms and operated by automatic trading bots, and it is aimed to serve this purpose. In addition to the strategies currently available in the markets, HilalimSB Strategy offers a useful infrastructure to traders with its useful interface. HilalimSB Strategy, which was decided to be published as a result of various calculations, was offered to the users with its unique visual effects after the completion of the testing procedures under market conditions.
HilalimSB Strategy and Heikin Ashi
HilalimSB Strategy produces data in Heikin Ashi chart types, but since Heikin Ashi chart types have their own calculation method, HilalimSB Strategy has been published in a way that cannot produce data in this chart type due to HilalimSB Strategy's ideology of appealing to all types of users, and any confusion that may arise is prevented in this way.
After the necessary conditions determined by the creator of HilalimSB are met, HilalimSB Heikin Ashi will be shared exclusively with invited users only, upon request, to users who request an invitation.
Differences between HilalimSB Strategy and HilalimSB
HilalimSB Strategy has been shared as a strategy and its features have been explained above. HilalimSB is a trading indicator and this is the main difference between them.We can explain it briefly this way.
Here are the differences between indicators and strategies:
1.Purpose and Use:
Indicators: Analyze market data to provide information about price movements and trends. They typically generate buy and sell signals and give traders clues about when to make trades in the market.
Strategies: These are plans for trading based on specific rules. They use signals from indicators and other market data to execute buy and sell transactions.
2.Features:
Indicators: Operate independently and are based on specific mathematical formulas. Examples include moving averages, RSI, and MACD.
Strategies: Combine one or more indicators and other market analysis tools to create a comprehensive trading plan. This plan determines entry and exit points, risk management, and trade size.
3.Scope:
Indicators: Are single analysis tools focusing on specific time frames or price movements.
Strategies: Are comprehensive trading plans that typically involve multiple trades over a certain period.
4.Decision Making:
Indicators: Provide information to traders and help in the decision-making process.
Strategies: Are direct decision-making mechanisms that execute trades automatically according to predetermined rules.
5.Automation:
Indicators: Are mostly interpreted manually and used based on the trader’s discretion.
Strategies: Can be used in automated trading systems and execute trades automatically according to the set rules.
The shared image is a 1-hour chart of BTCUSDC.P determined by the user as 1 percent take profit and 1 percent stop loss. And transactions were opened on Binance with the commission rate determined as 0.017 for the USDC trading pair.
HilalimSB Strategy, which presents users with completely concrete data, has proven itself in testing processes and is a project of SB that aims to reach all user profiles.🌙

Entry Fragger - Strategy
For basic instructions please visit my other script "Entry Fragger".
The Signal Logic is explained there.
v1.4:
- Added advanced backtesting with fully customizable entries.
- Fully automated Buy Signals (profitable).
- Adjustable timeframes for signal logic. (requested)
Every setting affects the accuracy and profitability greatly now, based on settings applied.
The strategy performs best on high timeframes with larger capital and no leverage.
Useless for Forex, but absolutely smashes stocks and crypto on mid to high timeframes.
Please read through my other scripts description.
Set values as preferred and try your assets.
It does NOT work on low timeframes and forex!
Hint: BTC 4H, Custom Timeframe 1h, Moon Mode and Show Sell Signals enabled, R2R: 2.

Multi-Timeframe Trend Following with 200 EMA Filter - Longs OnlyOverview
This strategy is designed to trade long positions based on multiple timeframe Exponential Moving Averages (EMAs) and a 200 EMA filter. The strategy ensures that trades are only entered in strong uptrends and aims to capitalize on sustained upward movements while minimizing risk with a defined stop-loss and take-profit mechanism.
Key Components
Initial Capital and Position Sizing
Initial Capital: $1000.
Lot Size: 1 unit per trade.
Inputs
Fast EMA Length (fast_length): The period for the fast EMA.
Slow EMA Length (slow_length): The period for the slow EMA.
200 EMA Length (filter_length_200): Set to 200 periods for the primary trend filter.
Stop Loss Percentage (stop_loss_perc): Set to 1% of the entry price.
Take Profit Percentage (take_profit_perc): Set to 3% of the entry price.
Timeframes and EMAs
EMAs are calculated for the following timeframes using the request.security function:
5-minute: Short-term trend detection.
15-minute: Intermediate-term trend detection.
30-minute: Long-term trend detection.
The strategy also calculates a 200-period EMA on the 5-minute timeframe to serve as a primary trend filter.
Trend Calculation
The strategy determines the trend for each timeframe by comparing the fast and slow EMAs:
If the fast EMA is above the slow EMA, the trend is considered positive (1).
If the fast EMA is below the slow EMA, the trend is considered negative (-1).
Combined Trend Signal
The combined trend signal is derived by summing the individual trends from the 5-minute, 15-minute, and 30-minute timeframes.
A combined trend value of 3 indicates a strong uptrend across all timeframes.
Any combined trend value less than 3 indicates a weakening or negative trend.
Entry and Exit Conditions
Entry Condition:
A long position is entered if:
The combined trend signal is 3 (indicating a strong uptrend across all timeframes).
The current close price is above the 200 EMA on the 5-minute timeframe.
Exit Condition:
The long position is exited if:
The combined trend signal is less than 3 (indicating a weakening trend).
The current close price falls below the 200 EMA on the 5-minute timeframe.
Stop Loss and Take Profit
Stop Loss: Set at 1% below the entry price.
Take Profit: Set at 3% above the entry price.
These levels are automatically set when entering a trade using the strategy.entry function with stop and limit parameters.
Plotting
The strategy plots the fast and slow EMAs for the 5-minute timeframe and the 200 EMA for visual reference on the chart:
Fast EMA (5-min): Plotted in blue.
Slow EMA (5-min): Plotted in red.
200 EMA (5-min): Plotted in green.

Dual RSI Differential - Strategy [presentTrading]█ Introduction and How it is Different
The Dual RSI Differential Strategy introduces a nuanced approach to market analysis and trading decisions by utilizing two Relative Strength Index (RSI) indicators calculated over different time periods. Unlike traditional strategies that employ a single RSI and may signal premature or delayed entries, this method leverages the differential between a shorter and a longer RSI. This approach pinpoints more precise entry and exit points, providing a refined tool for traders to exploit market conditions effectively, particularly in overbought and oversold scenarios.
Most important: it is a good eductional code for swing trading.
For beginners, this Pine Script provides a complete function that includes crucial elements such as holding days and the option to configure take profit/stop loss settings:
- Hold Days: This feature ensures that trades are not exited too hastily, helping traders to ride out short-term market volatility. It's particularly valuable for swing trading where maintaining positions slightly longer can lead to capturing significant trends.
- TPSL Condition (None by default): This setting allows traders to focus solely on the strategy's robust entry and exit signals without being constrained by preset profit or loss limits. This flexibility is crucial for learning to adjust strategy settings based on personal risk tolerance and market observations.
BTCUSD 6h LS Performance
█ Strategy, How It Works: Detailed Explanation
🔶 RSI Calculation:
The RSI is a momentum oscillator that measures the speed and change of price movements. It is calculated using the formula:
RSI = 100 - (100 / (1 + RS))
Where RS (Relative Strength) = Average Gain of up periods / Average Loss of down periods.
🔶 Dual RSI Setup:
This strategy involves two RSI indicators:
RSI_Short (RSI_21): Calculated over a short period (21 days).
RSI_Long (RSI_42): Calculated over a longer period (42 days).
Differential Calculation:
The strategy focuses on the differential between these two RSIs:
RSI Differential = RSI_Long - RSI_Short
This differential helps to identify when the shorter-term sentiment diverges from longer-term trends, signaling potential trading opportunities.
BTCUSD Local picuture
🔶 Signal Triggers:
Entry Signal: A buy (long) signal is triggered when the RSI Differential exceeds -5, suggesting strengthening short-term momentum. Conversely, a sell (short) signal occurs when the RSI Differential falls below +5, indicating weakening short-term momentum.
Exit Signal: Trades are generally exited when the RSI Differential reverses past these thresholds, indicating a potential momentum shift.
█ Trade Direction
This strategy accommodates various trading preferences by allowing selections among long, short, or both directions, thus enabling traders to capitalize on diverse market movements and volatility.
█ Usage
The Dual RSI Differential Strategy is particularly suited for:
Traders who prefer a systematic approach to capture market trends.
Those who seek to minimize risks associated with rapid and unexpected market movements.
Traders who value strategies that can be finely tuned to different market conditions.
█ Default Settings
- Trading Direction: Both — allows capturing of upward and downward market movements.
- Short RSI Period: 21 days — balances sensitivity to market movements.
- Long RSI Period: 42 days — smoothens out longer-term fluctuations to provide a clearer market trend.
- RSI Difference Level: 5 — minimizes false signals by setting a moderate threshold for action.
Use Hold Days: True — introduces a temporal element to trading strategy, holding positions to potentially enhance outcomes.
- Hold Days: 5 — ensures that trades are not exited too hastily, helping to ride out short-term volatility.
- TPSL Condition: None — enables traders to focus solely on the strategy's entry and exit signals without preset profit or loss limits.
- Take Profit Percentage: 15% — aims for significant market moves to lock in profits.
- Stop Loss Percentage: 10% — safeguards against large losses, essential for long-term capital preservation.

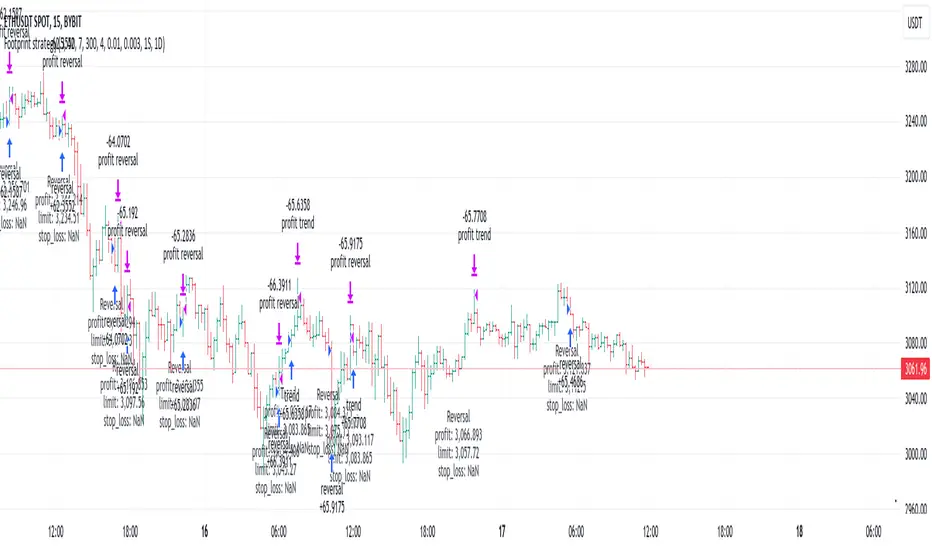
Footprint strategyThis strategy uses imbalance volume data obtained by footprint calculation technology.
There are two signals to enter a trade:
trend - the current buy volume on the bar is greater than the current sell volume and there is at least one imbalance line.
reversal - the current bar is falling, but the general market trend is positive (growing) and the imbalance buy volume exceeds the imbalance sell volume.
When any of the conditions is triggered, two orders are placed: Take Profit and Stop loss (according to the percentage value from the inputs).
A little advice on use:
The strategy performs best on a 15 minute timeframe.
It is necessary to choose acceptable values of Take Profit and Stop loss depending on the order of symbol prices.
Inputs related to the strategy:
Stop loss - percentage size of stop loss to exit the trade.
Enable stop loss - stop loss activation.
Take Profit - percentage size of Take Profit.
Calculation timeframe - this is the timeframe from which the volume will be collected for distribution to buy and sell (if you do not have access to the seconds chart, set here 1 minute, the accuracy will be less, but it will work).
Trend timeframe - this is the timeframe from which the trend will be calculated.
Enable trend - activation of trend calculation.
Inputs related to the calculation of footprints (collection of the volume of purchases and sales):
Count show bars - Number of bars from rt bar to history to calculate.
Display all available bars - Strategy calculation on all available bars (based on the available amount of data with reduced resolution (set in Calculation timeframe)).
Ticks Per Row - Sets the price step, calculated by multiplying the entered value by syminfo.mintick.
Auto - The automatic "Ticks Per Row" calculation is based on the first available bar and applied to subsequent bars.
Max row - sets the acceptable number of rows within a bar.
Imbalance Percent - A percentage coefficient to determine the Imbalance of price levels.
Stacked levels - And minimum number of consecutive Imbalance levels required to draw extended lines.
If you have suggestions for improving the strategy and adding new conditions for entering and exiting the trade, please write).
RSI Strategy with Manual TP and SL 19/03/2024This TradingView script implements a simple RSI (Relative Strength Index) strategy with manual take profit (TP) and stop-loss (SL) levels. Let's break down the script and analyze its components:
RSI Calculation: The script calculates the RSI using the specified length parameter. RSI is a momentum oscillator that measures the speed and change of price movements. It ranges from 0 to 100 and typically values above 70 indicate overbought conditions while values below 30 indicate oversold conditions.
Strategy Parameters:
length: Length of the RSI period.
overSold: Threshold for oversold condition.
overBought: Threshold for overbought condition.
trail_profit_pct: Percentage for trailing profit.
Entry Conditions:
For a long position: RSI crosses above 30 and the daily close is above 70% of the highest close in the last 50 bars.
For a short position: RSI crosses below 70 and the daily close is below 130% of the lowest close in the last 50 bars.
Entry Signals:
Long entry is signaled when both conditions for a long position are met.
Short entry is signaled when both conditions for a short position are met.
Manual TP and SL:
Take profit and stop-loss levels are calculated based on the entry price and the specified percentage.
For long positions, the take profit level is set above the entry price and the stop-loss level is set below the entry price.
For short positions, the take profit level is set below the entry price and the stop-loss level is set above the entry price.
Strategy Exits:
Exit conditions are defined for both long and short positions using the calculated take profit and stop-loss levels.
Chart Analysis:
This strategy aims to capitalize on short-term momentum shifts indicated by RSI crossings combined with daily price movements.
It utilizes manual TP and SL levels, providing traders with flexibility in managing their positions.
The strategy may perform well in ranging or oscillating markets where RSI signals are more reliable.
However, it may encounter challenges in trending markets where RSI can remain overbought or oversold for extended periods.
Traders should backtest this strategy thoroughly on historical data and consider optimizing parameters to suit different market conditions.
Risk management is crucial, so traders should carefully adjust TP and SL percentages based on their risk tolerance and market volatility.
Overall, this strategy provides a structured approach to trading based on RSI signals while allowing traders to customize their risk management. However, like any trading strategy, it should be used judiciously and in conjunction with other forms of analysis and risk management techniques.

Strategy / Connectable [Azullian]The connectable strategy serves as a foundational component in our indicator system on TradingView, designed for intuitive testing, visualization, and construction of trading strategies. In concert with the connectable signal filter , it forms a cohesive unit that allows for efficient signal processing and strategy implementation. This integration enables the strategy to receive and act on weighted signals from various connectable indicators, making it a versatile tool for both novice and experienced traders.
Let's review the separate parts of this indicator.
█ STRATEGY INPUTS
We've provided an input to connect a signal filter or indicators or chains (→) which is set to 'Close' by default.
An input has several controls:
• Input: Connect indicators or signal filter here, choose indicators with a compatible : Signal connector.
• SM - Signal Mode: Choose a trading direction compatible with the settings in your signal filter
█ POSITION INVESTMENT
Determine the percentage of your trading budget you would like to use in each position based on the strategy's profit or loss.
• LINVB - Loss Investment Base: Choose which base to use to determine the investment percentage when the strategy is in a loss.
○ Equity: Use the equity as the base for percentage calculation.
○ Initial capital: Use the initial capital as the base for percentage calculation.
• LINV% - Loss Investment Percentage: Set a percentage of the chosen investment base as the investment for a new position.
○ For example, when 10% in loss, and a initial capital of $100, and the investment base is set to equity with a percentage of 50%, your investment will be 50% of $90, $45.
• PINVB - Profit Investment Base: Choose which base to use to determine the investment percentage when the strategy is in profit.
○ Equity: Use the equity as the base for percentage calculation.
○ Initial capital: Use the initial capital as the base for percentage calculation.
• PINV% - Profit Investment Percentage: Set a percentage of the chosen investment base as the investment for a new position.
○ For example, when 10% in profit, and an initial capital of $100, and the investment base is set to equity with a percentage of 100%, your investment will be 100% of $110, $110.
• RISK% - Risk Percentage:
○ Determine how much of the calculated position investment is at risk when the stop-loss is hit.
- For example, 1% of $45 represents a maximum loss of $0.45.
○ Risk percentage works together with the stop loss and the max leverage.
• MXLVG - Maximum Leverage:
○ Investigate the trading rules for your trading pair and use the maximum allowed amount of leverage.
○ To determine the number of contracts to be bought or sold, considering the stop loss and the specified risk percentage, the maximum leverage available will constrain the amount of leverage utilized to ensure that the maximum risk threshold is not exceeded. For instance, suppose the stop loss is set at 1%, and the risk percentage is defined as 10%. Initially, the calculated leverage to be used would be 10. However, if there is a maximum leverage cap set at 5, it would constrain the calculated leverage of 10 to adhere to the maximum limit of 5.
█ EXIT STOP LOSS
Determine the Stop Loss price based on your selected configuration.
As the stop loss is an integral part of the ordered contracts calculation used in conjunction with the Risk and Max leverage, you'll always need to provide a stop loss price.
• SLB - Stop Loss Base: Choose a stop loss mode for calculating stop loss prices.
○ Risk: Determines the price using the Risk parameter (RISK%) and maximum leverage (MXLVG). In this case, SLB% will not have any impact.
○ Price Entry + Offset: Calculates the stop loss price based on a offset percentage (SLB%) from the entry price of the position.
• SLB% - Stop Loss Base Percentage: Define an offset percentage that will be applied in the price entry + offset stop loss mode.
• SLT - Stop Loss Trailing:
○ Fixed: The initial stop loss will be kept and no trailing stop loss will be applied.
○ Trail Price: Computes the trailing stop loss price based on an offset percentage (SLT%) from the closing price of the current candle.
- If a better stop loss price is calculated, it will be set as the new stop loss price.
○ Trail Incr: Adapts the trailing stop loss price based on the offset percentage (SLT%).
- Each price change in favor of your position will incrementally adapt the trailing stop loss with SLT%.
• SLT% - Stop Loss Trailing Percentage: This percentage serves as an offset or increment depending on your chosen trailing mode.
█ EXIT TAKE PROFIT
Determine the Take Profit price based on your selected configuration.
• TPB - Take Profit Base: Choose a take profit mode for calculating take profit prices.
○ Reward: Determines the take profit price using the Risk parameter (RISK%) and the calculated Stop Loss price and the set reward percentage (TPB%).
- For example: Risk 1%, Calculated Stop loss price: $90, Entry price: $100, Reward (TPB%): 2%, will result in a take profit price on $120.
○ Price Entry + Offset: Calculates the take profit price based on a offset percentage (TPB%) from the entry price of the position.
- For example: Entry price: $100, Offset (TPB%): 2%, will result in a take profit price on $102.
• TPB% - Take Profit Base Percentage: Define an offset percentage that will be applied in the price entry + offset take profit mode.
• TPT - Take Profit Trailing:
○ Fixed: The initial take profit will be kept and no trailing take profit will be applied.
○ Trail Price: Computes the trailing take profit price based on an offset percentage (TPT%) from the closing price of the current candle.
- If an applicable take profit price is calculated, it will be set as the new take profit price.
○ Trail Incr: Adapts the trailing take profit price based on the offset percentage (TPT%). Each price change against your position will incrementally adapt the trailing take profit with TPT%.
• TPT% - Take Profit Trailing Percentage: This percentage serves as an offset or increment depending on your chosen trailing mode.
█ STRATEGY CONDITIONS
Specify when the strategy is permitted to execute trades.
• DATE: Enable the Date Range filter to restrict entries to a specific date range.
○ START: Set a start date and hour to commence trading.
○ END: Set an end date and hour to conclude trading within the defined range.
■ VISUALS
• LINE: Activate a colored dashed diagonal line to visually connect the entry and exit points of positions.
• SLTP: Enable visualization of stop loss, take profit, and break-even levels.
• PNL: Enable Break-Even and Close Lines along with a colored area in between to visualize profit and loss.
• ☼: Brightness % : Adjust the opacity of the plotted trading visuals.
• P - Profit Color : Choose the color for profit-related elements.
• L - Loss Color: Choose the color for loss-related elements.
• B - Breakeven Color : Select the color for break-even points.
• EL - Long Color: Specify the color for long positions.
• ES - Short Color: Specify the color for short positions.
• TRADE LABELING: For better analysis we've labeled all entries and exits conform with the type of order your strategy has executed, some examples:
○ XL-TP-150: Exit Long - Take Profit - Position 150
○ XS-TP-154: Exit Short - Take Profit - Position 154
○ XL-SL-160: Exit Long - Stop Loss - Position 160
○ XS-SL-164: Exit Short - Stop Loss - Position 164
█ USAGE OF CONNECTABLE INDICATORS
■ Connectable chaining mechanism
Connectable indicators can be connected directly to the signal monitor, signal filter or strategy , or they can be daisy chained to each other while the last indicator in the chain connects to the signal monitor, signal filter or strategy. When using a signal filter you can chain the filter to the strategy input to make your chain complete.
• Direct chaining: Connect an indicator directly to the signal monitor, signal filter or strategy through the provided inputs (→).
• Daisy chaining: Connect indicators using the indicator input (→). The first in a daisy chain should have a flow (⌥) set to 'Indicator only'. Subsequent indicators use 'Both' to pass the previous weight. The final indicator connects to the signal monitor, signal filter, or strategy.
■ Set up the strategy with a signal filter and an RSI indicator
Let's connect the Strategy to a connectable signal filter and a connectable RSI indicator :
1. Load all relevant indicators
• Load RSI / Connectable
• Load Signal filter / Connectable
• Load Strategy / Connectable
2. Signal Filter: Connect the RSI to the Signal Filter
• Open the signal filter settings
• Choose one of the three input dropdowns (1→, 2→, 3→) and choose : RSI / Connectable: Signal Connector
• Toggle the enable box before the connected input to enable the incoming signal
3. Signal Filter: Update the filter signals settings if needed
• The default settings of the filter enable EL (Enter Long), XL (Exit Long), ES (Enter Short) and XS (Exit Short).
4. Signal Filter: Update the weight threshold settings if needed
• All connectable indicators load by default with a score of 6 for each direction (EL, XL, ES, XS)
• By default, weight threshold (TH) is set at 5. This allows each occurrence to score, as the default score in each connectable indicator is 1 point above the threshold. Adjust to your liking.
5. Strategy: Connect the strategy to the signal filter in the strategy settings
• Select the strategy input → and select the Signal filter: Signal connector
6. Strategy: Enable filter compatible directions
• Set the signal mode of the strategy to a compatible direction with the signal filter.
Now that everything is connected, you'll notice green spikes in the signal filter representing long signals, and red spikes indicating short signals. Trades will also appear on the chart, complemented by a performance overview. Your journey is just beginning: delve into different scoring mechanisms, merge diverse connectable indicators, and craft unique chains. Instantly test your results and discover the potential of your configurations. Dive deep and enjoy the process!
█ BENEFITS
• Adaptable Modular Design: Arrange indicators in diverse structures via direct or daisy chaining, allowing tailored configurations to align with your analysis approach.
• Streamlined Backtesting: Simplify the iterative process of testing and adjusting combinations, facilitating a smoother exploration of potential setups.
• Intuitive Interface: Navigate TradingView with added ease. Integrate desired indicators, adjust settings, and establish alerts without delving into complex code.
• Signal Weight Precision: Leverage granular weight allocation among signals, offering a deeper layer of customization in strategy formulation.
• Advanced Signal Filtering: Define entry and exit conditions with more clarity, granting an added layer of strategy precision.
• Clear Visual Feedback: Distinct visual signals and cues enhance the readability of charts, promoting informed decision-making.
• Standardized Defaults: Indicators are equipped with universally recognized preset settings, ensuring consistency in initial setups across different types like momentum or volatility.
• Reliability: Our indicators are meticulously developed to prevent repainting. We strictly adhere to TradingView's coding conventions, ensuring our code is both performant and clean.
█ COMPATIBLE INDICATORS
Each indicator that incorporates our open-source 'azLibConnector' library and adheres to our conventions can be effortlessly integrated and used as detailed above.
For clarity and recognition within the TradingView platform, we append the suffix ' / Connectable' to every compatible indicator.
█ COMMON MISTAKES AND CLARIFICATIONS
• Removing an indicator from a chain: Deleting a linked indicator and confirming the "remove study tree" alert will also remove all underlying indicators in the object tree. Before removing one, disconnect the adjacent indicators and move it to the object stack's bottom.
• Point systems: The azLibConnector provides 500 points for each direction (EL: Enter long, XL: Exit long, ES: Enter short, XS: Exit short) Remember this cap when devising a point structure.
• Flow misconfiguration: In daisy chains the first indicator should always have a flow (⌥) setting of 'indicator only' while other indicator should have a flow (⌥) setting of 'both'.
• Recalculate: While this strategy has undergone extensive testing, enabling recalculation options like 'After order is filled' or 'On every tick' may lead to unexpected behavior.
• Fill orders: The strategy is thoroughly tested, yet enabling fill order options such as 'Using bar magnifier', 'On bar close', or 'Using standard OHLC' might result in unexpected outcomes.
• Layout and abbreviations: To maintain a consistent structure, we use abbreviations for each input. While this may initially seem complex, you'll quickly become familiar with them. Each abbreviation is also explained in the inline tooltips.
• Optimized for crypto trading: While many principles are common across markets, this strategy is specifically optimized and tested for crypto trading.
• Inputs: Connecting a connectable indicator directly to the strategy delivers the raw signal without a weight threshold, meaning every signal will trigger a trade.
█ A NOTE OF GRATITUDE
Through years of exploring TradingView and Pine Script, we've drawn immense inspiration from the community's knowledge and innovation. Thank you for being a constant source of motivation and insight.
█ RISK DISCLAIMER
Azullian's content, tools, scripts, articles, and educational offerings are presented purely for educational and informational uses. Please be aware that past performance should not be considered a predictor of future results.

BigBeluga - BacktestingThe Backtesting System (SMC) is a strategy builder designed around concepts of Smart Money.
What makes this indicator unique is that users can build a wide variety of strategies thanks to the external source conditions and the built-in one that are coded around concepts of smart money.
🔶 FEATURES
🔹 Step Algorithm
Crafting Your Strategy:
You can add multiple steps to your strategy, using both internal and external (custom) conditions.
Evaluating Your Conditions:
The system evaluates your conditions sequentially.
Only after the previous step becomes true will the next one be evaluated.
This ensures your strategy only triggers when all specified conditions are met.
Executing Your Strategy:
Once all steps in your strategy are true, the backtester automatically opens a market order.
You can also configure exit conditions within the strategy builder to manage your positions effectively.
🔹 External and Internal build-in conditions
Users can choose to use external or internal conditions or just one of the two categories.
Build-in conditions:
CHoCH or BOS
CHoCH or BOS Sweep
CHoCH
BOS
CHoCH Sweep
BOS Sweep
OB Mitigated
Price Inside OB
FVG Mitigated
Raid Found
Price Inside FVG
SFP Created
Liquidity Print
Sweep Area
Breakdown of each of the options:
CHoCH: Change of Character (not Charter) is a change from bullish to bearish market or vice versa.
BOS: Break of Structure is a continuation of the current trend.
CHoCH or BOS Sweep: Liquidity taken out from the market within the structure.
OB Mitigated: An order block mitigated.
FVG Mitigated: An imbalance mitigated.
Raid Found: Liquidity taken out from an imbalance.
SFP Created: A Swing Failure Pattern detected.
Liquidity Print: A huge chunk of liquidity taken out from the market.
Sweep Area: A level regained from the structure.
Price inside OB/FVG: Price inside an order block or an imbalance.
External inputs can be anything that is plotted on the chart that has valid entry points, such as an RSI or a simple Supertrend.
Equal
Greather Than
Less Than
Crossing Over
Crossing Under
Crossing
🔹 Direction
Users can change the direction of each condition to either Bullish or Bearish. This can be useful if users want to long the market on a bearish condition or vice versa.
🔹 Build-in Stop-Loss and Take-Profit features
Tailoring Your Exits:
Similar to entry creation, the backtesting system allows you to build multi-step exit strategies.
Each step can utilize internal and external (custom) conditions.
This flexibility allows you to personalize your exit strategy based on your risk tolerance and trading goals.
Stop-Loss and Take-Profit Options:
The backtesting system offers various options for setting stop-loss and take-profit levels.
You can choose from:
Dynamic levels: These levels automatically adjust based on market movements, helping you manage risk and secure profits.
Specific price levels: You can set fixed stop-loss and take-profit levels based on your comfort level and analysis.
Price - Set x point to a specific price
Currency - Set x point away from tot Currency points
Ticks - Set x point away from tot ticks
Percent - Set x point away from a fixed %
ATR - Set x point away using the Averge True Range (200 bars)
Trailing Stop (Only for stop-loss order)
🔶 USAGE
Users can create a variety of strategies using this script, limited only by their imagination.
Long entry : Bullish CHoCH after price is inside a bullish order block
Short entry : Bearish CHoCH after price is inside a bearish order block
Stop-Loss : Trailing Stop set away from price by 0.2%
Example below using external conditions
Long entry : Bullish Liquidity Prints after bullish CHoCH
Short entry : Bearish Liquidity Prints after Bearish CHoCH
Long Exit : RSI Crossing over 70 line
Short Exit : RSI Crossing over 30 line
Stop-Loss : Trailing Stop set away from price by 0.3%
🔶 PROPERTIES
Users will need to adjust the property tabs according to their individual balance to achieve realistic results.
An important aspect to note is that past performance does not guarantee future results. This principle should always be kept in mind.
🔶 HOW TO ACCESS
You can see the Author Instructions to get access.
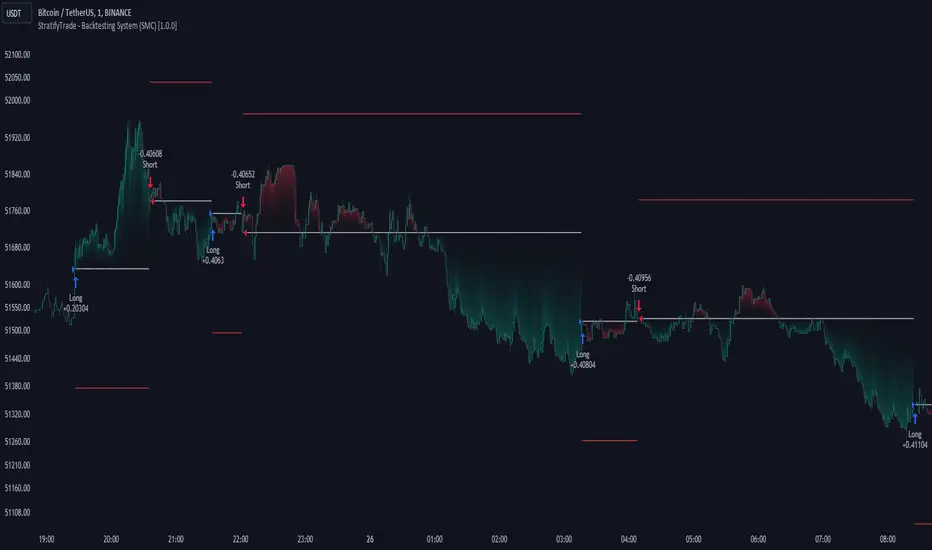
arpit bollinger bandStrategy Overview:
This strategy utilizes Bollinger Bands based on a 20-period Exponential Moving Average (EMA) with a standard deviation multiplier of 1.5. It is designed to generate early trading signals based on the relationship between the price action and the Bollinger Bands.
Bollinger Bands Calculation:
The upper Bollinger Band is calculated as the 20-period EMA of the closing prices plus 1.5 times the standard deviation of the same period.
The lower Bollinger Band is calculated as the 20-period EMA of the closing prices minus 1.5 times the standard deviation.
Entry Criteria:
Buy Signal: A buy signal is generated when the current candle's high exceeds the high of the candle two periods ago, which had closed below the lower Bollinger Band. This condition implies an anticipation of a bullish reversal.
Sell Signal: A sell signal is generated when the current candle's low falls below the low of the candle two periods ago, which had closed above the upper Bollinger Band. This condition suggests an anticipated bearish reversal.
Stop Loss and Take Profit:
The stop loss for a buy order is set slightly below the low of the current candle, and for a sell order, it is set slightly above the high of the current candle.
The take profit level is determined based on a predefined risk-reward ratio of 1:3. This means the take profit target is set at a distance three times greater than the distance between the entry price and the stop loss.
Risk Management:
The strategy includes an input option to adjust the risk-reward ratio, allowing for flexibility in managing the trade's potential risk versus reward.
Trade Execution:
The strategy automatically plots the buy and sell signals on the chart and executes the trades according to the defined conditions. It also visually indicates the stop loss levels for each trade.
Usage Notes:
This strategy is designed for use in the TradingView platform using Pine Script version 5.
It is important to backtest and paper trade the strategy before using it in live trading to understand its performance characteristics and risk profile.
The strategy should be used as part of a comprehensive trading plan, considering market conditions, trader risk tolerance, and personal trading goals.

Octopus Nest Strategy Hello Fellas,
Hereby, I come up with a popular strategy from YouTube called Octopus Nest Strategy. It is a no repaint, lower timeframe scalping strategy utilizing PSAR, EMA and TTM Squeeze.
The strategy considers these market factors:
PSAR -> Trend
EMA -> Trend
TTM Squeeze -> Momentum and Volatility by incorporating Bollinger Bands and Keltner Channels
Note: As you can see there is a potential improvement by incorporating volume.
What's Different Compared To The Original Strategy?
I added an option which allows users to use the Adaptive PSAR of @loxx, which will hopefully improve results sometimes.
Signals
Enter Long -> source above EMA 100, source crosses above PSAR and TTM Squeeze crosses above 0
Enter Short -> source below EMA 100, source crosses below PSAR and TTM Squeeze crosses below 0
Exit Long and Exit Short are triggered from the risk management. Thus, it will just exit on SL or TP.
Risk Management
"High Low Stop Loss" and "Automatic High Low Take Profit" are used here.
High Low Stop Loss: Utilizes the last high for short and the last low for long to calculate the stop loss level. The last high or low gets multiplied by the user-defined multiplicator and if no recent high or low was found it uses the backup multiplier.
Automatic High Low Take Profit: Utilizes the current stop loss level of "High Low Stop Loss" and gets calculated by the user-defined risk ratio.
Now, follows the bunch of knowledge for the more inexperienced readers.
PSAR: Parabolic Stop And Reverse; Developed by J. Welles Wilders and a classic trend reversal indicator.
The indicator works most effectively in trending markets where large price moves allow traders to capture significant gains. When a security’s price is range-bound, the indicator will constantly be reversing, resulting in multiple low-profit or losing trades.
TTM Squeeze: TTM Squeeze is a volatility and momentum indicator introduced by John Carter of Trade the Markets (now Simpler Trading), which capitalizes on the tendency for price to break out strongly after consolidating in a tight trading range.
The volatility component of the TTM Squeeze indicator measures price compression using Bollinger Bands and Keltner Channels. If the Bollinger Bands are completely enclosed within the Keltner Channels, that indicates a period of very low volatility. This state is known as the squeeze. When the Bollinger Bands expand and move back outside of the Keltner Channel, the squeeze is said to have “fired”: volatility increases and prices are likely to break out of that tight trading range in one direction or the other. The on/off state of the squeeze is shown with small dots on the zero line of the indicator: red dots indicate the squeeze is on, and green dots indicate the squeeze is off.
EMA: Exponential Moving Average; Like a simple moving average, but with exponential weighting of the input data.
Don't forget to check out the settings and keep it up.
Best regards,
simwai
---
Credits to:
@loxx
@Bjorgum
@Greeny

Single Swing Strategy (SSS)Introduction
The Single Swing Strategy (SSS) is a trading strategy designed for assets that trend. It utilises a single technical indicator to identify potential buying opportunities in upward-trending markets. The strategy focuses on moments when the price of an asset breaks out to a new high, suggesting a strong upward momentum.
Components
1. Exponential Moving Averages (EMAs): SSS uses two EMAs to evaluate the overall asset trend. SSS describes an uptrend as identified, when the fast EMA crosses above the slow EMA and vice versa for a downtrend.
2. Breakout: The strategy validates the trend identified by the EMAs through breakouts in the price action of the asset over a specified lookback period. No indicator is required for this step.
3. Average Directional Index (ADX): The ADX is used to measure the strength of a trend. It does not indicate the trend's direction but rather its strength, whether it's an uptrend or downtrend. A high ADX value (typically above 25) suggests a strong trend, either up or down while a low ADX value (typically below 20) indicates a weak or non-trending market. The ADX itself is a moving average of the expanding range between the +DI and -DI.
4. Positive Directional Indicator (DI+): DI+ helps identify the presence and strength of uptrends. It is calculated based on the upward price movement between current and previous highs. A rising DI+ alongside a rising ADX suggests a strengthening uptrend. When DI+ crosses above DI-, it's often interpreted as a bullish signal.
5. Negative Directional Indicator (DI-): DI- is used to detect the presence and strength of downtrends.It is derived from the downward price movement between current and previous lows. An increasing DI- along with a rising ADX indicates a strengthening downtrend while a crossover of DI- above DI+ is typically seen as a bearish signal.
How it works
1. Regime filter with ADX, DI+, and DI-: The first step in taking a trade is to determine the direction of the trend using the +DI. If in an uptrend, the strategy checks if the ADX is above 25 to confirm a strong uptrend. -DI is not used since the strategy is long only. If in an uptrend and the trend is strong, trades can be opened.
2. Trend Identification with EMAs: Initially, the strategy uses two Exponential Moving Averages (fast and slow) to determine the asset trend. A fast EMA crossing above the slow EMA signifies an uptrend, and vice versa for a downtrend. This is the Entry signal to open a long position.
3. Trend Confirmation with Breakout: The strategy confirms the EMA-indicated trend through price breakouts over a specified lookback period. An EMA crossover without a price action breakout does not lead to an entry signal
4. Trade Management: After entering a trade, the strategy uses predefined levels for taking profit and setting stop losses. Trades are closed either when the price reaches the take-profit level or falls to the stop-loss level. Hence, risk management is built in.
Results
The backtest results can be found below. Initial capital of 10000 was used, this is a convenient amount for most retail traders, commission of $3 per order, position size of 3% of initial capital and slippage of 3 ticks. These are all representative of real world retail trading conditions.
Originality
The Single Swing Strategy (SSS)'s originality is in its blending of classical technical analysis; Trend Analysis through EMAs and Price Action through Breakout, into an innovative trading logic.
1. The Essence of Trend and Breakout in SSS
(i) Trend Recognition: At the heart of SSS is the Exponential Moving Averages (EMAs). While the use of EMAs is common, SSS employs them for trend analysis so an entry decision can be made. The strategy's core algorithm assesses the inception of an upward trend by observing a specific crossing pattern of the EMAs, a moment where the asset's momentum shifts, offering a strategic advantage.
(ii) Breakout Significance: The strategy's reliance on price breakouts isn't just about identifying a new high; it's about understanding market psychology. A breakout beyond a previous high signals not only momentum but also a collective market sentiment that favors upward movement. SSS attempts to capture this momentum, translating it into a tangible trading opportunity.
(iii)Strength of trend: The ADX and +DI double checks the trend is in the right direction and checks to see if the trend is strong enough hence, it prevents trading when the trend is not supportive.
2. Simplicity as a Cornerstone
(i) Clarity and Efficiency: In the realm of algorithmic trading, complexity isn't always synonymous with effectiveness. SSS' simplicity ensures its logic is transparent and its execution, efficient. This simplicity is a strategic choice, designed to reduce overfitting to past data and improve adaptability to real-market conditions.
(ii) Ease of Use and Decision Making: The straightforward nature of SSS may empower traders to make informed decisions without being overwhelmed by convoluted indicators. This is particularly useful because of the embedding of risk management using defined exit points after entry through a Take Profit and Stop Loss. This hardcodes a 3:1 risk reward ratio into every trade.
3. Positive Expectancy
(i) Performance Metrics: The SSS strategy shows its edge in its backtesting results. A 62% win rate, a profit factor of 1.7, profit ratio of 1.05 and an average trade gain of 4.7% are not just numbers; they show the mathematical edge over the backtest period, especially considering the high commissions and slippage factored into its design.
Trading
The SSS strategy has been backtested on the 1D timeframe of BTCUSD but users are encouraged to try it on other assets such as SPXL (5min), AAPL (5min) and others but the appropriate timeframe and trading costs may vary.
NOTE
Like any trading strategy, SSS does not guarantee profits. It's a tool to assist in decision-making, not a foolproof solution. Trading involves risks, particularly in volatile markets. Users should trade responsibly, considering their risk tolerance and financial situation. While SSS automates some aspects of trading, it requires continuous monitoring and does not replace the need for sound judgement and decision-making by the trader.

BitBell - EMA PullBack RSI EXO
🔵 Introduction
Version 1.1
This is a Pine 5 trend following strategy. It has a four strategy with several alerts and signals. The design intent is to produce a commercial grade signal generator that can be adapted to any symbol in cryptocurrency and only 1H Chart. Ideally, the script is reliable enough to be the basis of an automated trading system web-hooked to a server with API access to crypto brokerages. The strategy can be run in three different modes: long, short and bidirectional.
As a trend following strategy, the behavior of the script is to buy on strength and sell on weakness. As such the trade orders maintain its directional bias according to price pressure. What you will see on the chart is long positions on the left side of the mountain and short on the right. Long and short positions are not intermingled as long as there exists a detectable trend. This is extremely beneficial feature in long running bull or bear markets. The script uses multiple setups to avoid the situation where you got in on the trend, took a small profit but couldn’t get back in because the logic is waiting for a pullback or some other intricate condition.
Deep draw-downs are a characteristic of trend following systems and this system is no different. However, this script makes use of the TradingView pyramid feature with three NPUs to find better place and even you can change drop percentage in settings for another trigger, accessible from the properties tab.
When trend market break it will stop the trade and usually it takes 2-4 percent loss but don't worry it has prefect money management and you can use it for Futures market and even Spot market.
🔵 Design
This script uses twelve indicators on two time frames. The chart (primary) interval and one higher time frame which is based on the primary. The higher time frame identifies the trend for which the primary will trade. I’ve tried to keep the higher time frame around five times greater than the primary. The original trading algorithms are a port from a much larger program on another trading platform. I’ve converted some of the statistical functions to use standard indicators available on TradingView. The setups make heavy use of the Hull Moving Average in conjunction with EMAs that form the Bill Williams Alligator as described in his book “New Trading Dimensions” Chapter 3. Lag between the Hull and the EMAs form the basis of the entry and exit points. The alligator itself is used to identify the trend main body.
The entire script is around 740 lines of Pine code which is the maximum incidental size given the TradingView limits: local scopes, run-time duration and compile time. I’ve been working on this script for over a year and have tested it on various instruments stock crypto. It performs well on higher liquidity markets that have at least a year of historical data. Though it can be configured to work on any interval between 15 minutes and 4 hour, trend trading is generally a longer term paradigm. For day trading the 10 to 15 minute interval will allow you to catch momentum breakouts. For intraweek trades 30 minutes to 1 hour should give you a trade every other a day.
Inputs to the script use cone centric measurements in effort to avoid exposing adjustments to the various internal indicators. The goal was to keep the inputs relevant to the actual trade entry and exit locations as opposed to a series of MA input values and the like. As a result the strategy exposes over 12 inputs grouped into long or short sections. Inputs are available for the usual minimum profit and stop-loss as well as trade, modes, presets, reports and lots of calibrations. The inputs are numerous, I’m aware. Unfortunately, at this time, TradingView does not offer any other method to get data in the script. The usual initialization files such as cnf, cfg, ini, json and xml files are currently unsupported.
Example configurations for various instruments along with a detailed PDF user manual is available.
it has no repaint i guaranty this, and you can have 10 days free with comment and check it by yourself
One issue that comes up when comparing the strategy with the study is that the strategy trades show on the chart one bar later than the study. This problem is due to the fact that “strategy.entry()” and “strategy_close()” do not execute on the same bar called. The study, on the other hand, has no such limitation since there are no position routines. However, alerts that are subsequently fired off when triggered in the study are dispatched from the TradingView servers one bar later from the study plot. Therefore the alert you actually receive on your cell phone matches the strategy plot but is one bar later than the study plot.
Please be aware that the data source matters. Cryptocurrency has no central tick repository so each exchange supplies TradingView its feed. Even though it is the same symbol the quality of the data and subsequently the bars that are supplied to the chart varies with the exchange. This script will absolutely produce different results on different data feeds of the same symbol. Be sure to backtest this script on the same data you intend to receive alerts for. Any example settings I share with you will always have the exchange name used to generate the test results.
🟡 Usage
It sends long and short signals with pyramid orders of up to 3, meaning that the strategy can trigger up to 3 orders in the same direction. Good risk and money management.
It's important to note that the strategy combines 2 systems working together (Long and LongX). Let’s describe the specific features of this strategy.
🔵 If Findes Supports And Ressitances And Trend Lines As Best As It Can, And You Can See:
🟢 Frist Simple Long Condition = It Look At The Trend Wait For RSI Cross 30 Number Then Ckeck Risk To Reward, check something else such as divergence:
🟢 Another Long Example:
🔴 Frist Simple Short Condition = It Look At The Trend Wait For RSI Cross 70 Number Then Ckeck Risk To Reward, check something else such as divergence:
🔴 Another Short Example:
The following steps provide a very brief set of instructions that will get you started but will most certainly not produce the best backtest. A trading system that you are willing to risk your hard earned capital will require a well crafted configuration that involves time, expertise and clearly defined goals. As previously mentioned, I have several example configs that I use for my own trading that I can share with you along with a PDF which describes each input in detail. To get hands on experience in setting up your own symbol from scratch please follow the steps below.
The input dialog box contains over 12 inputs, There are four options must to be configured: Choose Target, side, Choose Settings, Money Management,and settings that apply to both. The following steps address these four main options only.
Money Management System For Leverage 10:
Bot Finds Last Lower Low And Calculate Distance From Entry Price, Then Cross It To Initial Capitan And Cross Leverage =>
Position_Size = (((1.64) * (initial Capital)) * (leverage))
And Check Dominances Too For Getting Best Money Management Result
🔵 Settings
* Side, You Can Set Long Or Short Or Both.
* Choose Target, You Can Set One Target Or All Targets.
* Money Management, You Can ON Or OFF It, With OFF You Can USE It For SPOT Trades.
* Choose Settings, In This Field You Can Set Mathematical Optimization, Ddepends On Which Pair You USE.
* Clear With Daily PullBack?, With This Check Box You Can Clear Signals With Daily PullBack.
* Long X, You Can Set Long Leverage.
* Short X, You Can Set Short Leverage.
* Second Order X, You Can Set Pyramiding Leverage.
* Target Long, You Can Set Percent For Long Target.
* Target Short, You Can Set Percent For Short Target.
* Short Martin Percent, You Can Set Short Martingale Percent.
* Long Martin Percent, You Can Set Long Martingale Percent.
🟡 Pyraming 3
🟡 Commission Is 0.065 %
🟡 Slippage Is 10 ticks
🔴Only Use For 1 Hour Chart
🔴 CONCLUSION
We believe that success lies in the association of the user with the indicator, opposed to many traders who have the perspective that the indicator itself can make them become profitable. The reality is much more complicated than that.
The aim is to provide an indicator comprehensive, customizable, and intuitive enough that any trader can be led to understand this truth and develop an actionable perspective of technical indicators as support tools for decision making.
🔴 RISK DISCLAIMER
Trading is risky & most day traders lose money. All content, tools, scripts, articles, & education provided by BitBell are purely for informational & educational purposes only. Past performance does not guarantee future results.

FreedX Backtest█ Our strategy template empowers TradingView users to effortlessly backtest any indicator, enhancing their trading strategy's effectiveness. In addition, users can create automated webhook alerts from the template. This document details our template's features and how to utilize them effectively.
█ TRADE DATE SETTINGS
The Trading Date Settings feature in our TradingView script allows you to refine their backtesting parameters by specifying trading dates and hours. This feature enhances the accuracy of the backtest by aligning it with specific time frames and days, ensuring that the strategy is tested under relevant market conditions.
Features:
⚙️ Enable Trading Between Specific Dates:
🎯 Purpose:
→ Allows you to limit the backtesting of their strategy to a specific date range.
💡 How to Use:
→ Input the Start Date and End Date for the backtest period.
→ The script will execute the strategy only within this specified date range.
⚙️ Enable Trading Between Specific Hours:
🎯 Purpose:
→ Allows you to limit the backtesting of their strategy to a specific hour range.
💡 How to Use:
→ Input the start and end hour for in Trading Session section.
→ The script will execute the strategy only within this specified hour range.
⚙️ Enable Trading on Specified Days of the Week:
🎯 Purpose:
→ Gives you the option to conduct backtesting on selected days of the week, tailoring the strategy to particular market behaviours that may occur on these days.
💡 How to Use:
→ Select the days of the week for the backtest.
→ The script will activate the trading strategy only on these chosen days.
█ BUY/SELL TRIGGER SETTINGS
The Buy/Sell Trigger Settings feature is designed to provide users with flexibility in defining the conditions for 'LONG' and 'SHORT' signals based on various indicator types. This customization is crucial for tailoring strategies to different trading styles and market conditions.
Features:
⚙️ Single-Line Plotted Indicators :
🎯 Purpose:
→ Enables you to select a single-line plotted indicator as a source for backtesting. You can define specific levels to trigger 'LONG' or 'SHORT' signals.
💡 How to Use:
→ Choose a Single-Line Plotted indicator as the source.
→ Set the top and bottom levels for the indicator.
→ The script triggers 'LONG' signals at the bottom level and 'SHORT' signals at the top level.
⚙️ Two-Line Plotted Indicators :
🎯 Purpose:
→ Allows backtesting with two-line cross plot sources. Signals are generated based on the crossover of these lines.
💡 How to Use:
→ Select two lines as 'Source 1' and 'Source 2' for the indicator.
→ The script triggers a 'LONG' signal when 'Source 1' crosses above 'Source 2'.
→ Conversely, a 'SHORT' signal is triggered when 'Source 2' crosses above 'Source 1'.
⚙️ Custom Signals :
🎯 Purpose:
→ This setting enables users to define their own criteria for LONG, SHORT, and CLOSE signals based on custom indicator outputs.
💡 How to Use:
→ Select the custom source for your signals.
→ Define the output values that correspond to each signal type (e.g., “1” for 'LONG', “-1” for SHORT, and “0” for CLOSE).
→ The script will trigger signals according to these custom-defined values.
█ TP/SL SETTINGS
The TP/SL (Take Profit/Stop Loss) Settings feature is designed to give users control over their profit securing and risk mitigation strategies. This feature allows for setting custom TP and SL levels, which can be critical in managing trades effectively.
Features:
Custom TP/SL Levels for Long/Short Signals:
🎯 Purpose:
→ Enables users to set specific percentage levels for Take Profit and Stop Loss on long and short signals.
💡 How to Use:
→ In the TP/SL Settings, input the desired percentage for Take Profit (TP) and Stop Loss (SL).
→ For example, to secure a profit at a 10% price increase on LONG signals, set the “Long TP Percentage” to “10”.
█ STRATEGY SETTINGS
Strategy Settings provide a range of options to customize the trading strategy. These settings include leverage, drawdown limits, position direction changes, and more, allowing users to tailor their strategy to their risk tolerance and market view.
Features:
⚙️ Enable Leverage :
🎯 Purpose:
→ Allows users to apply leverage to their trades.
☢️ Caution:
→ High leverage can significantly increase the risk of liquidation.
→ High leverage and a high stop-loss price may override your fixed stoploss percentage, adjusting the stop-loss to the liquidation price.
💡 How to Use:
→ Set the desired leverage ratio in the Strategy Settings.
⚙️ Enable Drawdown Limit:
🎯 Purpose:
→ Sets a maximum drawdown limit, automatically halting the strategy if this limit is reached, thereby controlling risk.
💡 How to Use:
→ Input the maximum drawdown limit (default: 100, min: 0, max: 100).
⚙️ Enable Reverse Position:
🎯 Purpose:
→ Automatically closes a current position and opens a new one in the opposite direction upon detecting a signal for a market trend change.
🎯 Example:
→ If a LONG signal is received while in a SHORT position, the script will close the SHORT position and open a LONG position.
💡 How to Use:
→ Activate this feature in the Strategy Settings.
⚙️ Enable Spot Mode:
🎯 Purpose:
→ Disables short orders, using short signals only for closing long positions.
💡 How to Use:
→ Select the 'Spot Mode' option in the Strategy Settings.
⚙️ Enable Invert Signals:
🎯 Purpose:
→ Inverts all indicator signals, changing LONG signals to SHORT and vice versa.
💡 How to Use:
→ Opt for the 'Invert Signals' feature in the Strategy Settings.
⚙️ Enable Trailing Stop:
🎯 Purpose:
→ Triggers a trailing stop order on the exchange instead of a standard stop market order.
☢️ Caution:
→ The backtesting of this feature on TradingView may not accurately reflect actual strategy performance due to discrepancies between TradingView and exchange mechanisms.
💡 How to Use:
→ Select 'Trailing Stop' in the Strategy Settings.
█ ADVANCED STRATEGY SETTINGS
Advanced Strategy Settings offer sophisticated methods for managing Stop Loss (SL) and Take Profit (TP) using the Average True Range (ATR). These settings are ideal for traders who want to incorporate volatility into their exit strategies.
Features:
⚙️ Enable ATR Stop Loss:
🎯 Purpose:
→ Automatically sets the Stop Loss price using the Average True Range at the time of entry.
💡 How to Use:
→ Activate 'ATR Stop Loss' to have the SL price calculated based on the current ATR.
⚙️ Enable ATR Take Profit:
🎯 Purpose:
→ Sets the Take Profit price based on the Average True Range at the time of entry.
💡 How to Use:
→ Choose 'ATR Take Profit' for TP price determination using ATR.
⚙️ Enable ATR Trailing Stop:
🎯 Purpose:
→ Dynamically updates the Stop Loss price with each new bar, according to the Average True Range.
💡 How to Use:
→ Activate 'ATR Trailing Stop'.
→ Set the ATR Period to define the number of bars for ATR calculation.
→ Adjust the ATR SL Multiplier to determine the stop loss distance.
→ Modify the ATR TP Multiplier for setting the take profit distance.
█ TREND FILTERING SETTINGS
Trend Filtering Settings are designed to align trading strategies with the prevailing market trend, enhancing the precision of trade entries and exits. These settings utilize moving averages for trend analysis and decision-making.
Features:
⚙️ Enable Trend Filtering:
🎯 Purpose:
→ Limits trades based on moving average trends, blocking short trades in an uptrend and vice versa.
💡 How to Use:
→ Enable 'Trend Filtering'.
→ Set Fast and Slow MA Lengths for trend analysis.
→ Select the Timeframe for moving averages.
→ Choose the Moving Average Type for trend filtering.
🎯 Note:
→ Be cautious with timeframe selections; lower timeframes than the base may cause inconsistencies.
⚙️ Enable Exit on Trend Reversal:
🎯 Purpose:
→ Automatically closes a position when a market trend reversal is detected.
💡 How to Use:
→ Turn on 'Exit on Trend Reversal' in the settings.
⚙️ Enable Trend Drawing On Chart:
🎯 Purpose:
→ Visually represents the trend filter directly on the chart for easy reference.
💡 How to Use:
→ Activate 'Trend Drawing On Chart' to see the trend filter overlaid on the trading chart.
█ AUTOMATED ALERT SETTINGS
Automated Alert Settings are designed to integrate your TradingView script with webhook alerts. These settings allow for enhanced strategy execution and management.
Features:
Enable Webhook Alerts:
🎯 Purpose:
→ Trigger BUY, SELL, CHANGE_DIRECTION or MOVE_STOP_LOSS .
💡 How to Use:
→ Enable 'Webhook Alerts' in the settings.
→ Enter your Strategy ID.
→ Optionally, activate 'Override Allocation Percentage' to bypass the preset allocation percentage.
☢️ Caution:
→ Overriding the allocation percentage may result in trade entry errors due to misalignment between entry cost and available balance.
█ DEBUGGING SETTINGS
Debugging Settings are crucial for users who want to analyze and optimize their strategies. These settings provide tools for visualizing alerts on charts and accessing detailed data outputs.
Features:
⚙️ Enable Alert Plotting:
🎯 Purpose:
→ Allows users to visualize trading alerts directly on the chart, aiding in strategy analysis and refinement.
💡 How to Use:
→ Activate 'Alert Plotting' to draw alerts on the chart.
☢️ Caution:
→ It is recommended to disable this feature when creating actual trading alerts, as it can cause latency in signal processing.
⚙️ Enable Debugger Mode:
🎯 Purpose:
→ Facilitates strategy debugging by providing detailed data output in the TradingView Data Window.
💡 How to Use:
→ Turn on 'Debugger Mode' to access real-time data and metrics relevant to your strategy.
█ ADDITIONAL SETTINGS
⚙️ Enable Bar Magnifier
⚙️ Enable Using standard OHLC

IchiBot - [SigmaStreet]
The IchiBot Indicator has been used to develop automated trading systems. It leverages the open-source Ichimoku framework provided by Trading View, to enable users to creatively generate over 1 trillion different combinations of trading conditions with the use of multiple timeframes to create unique “signal labels” that can be used to create custom strategies or provide in depth market analysis. At the end of this description, I have provided an example of input settings for a simple scalping strategy that I have back tested on US30 on the 5 minute timeframe.
Overview of the Settings:
The visuals section includes an option to show or hide certain parts of the indicator and change the size of the signal labels plotted on the chart.
Next to the “Signal color on baseline/candles” section, you can choose if you want to see additional signals generations from the most previous plotted label on a color changing baseline, or color changing candles. A color change from gray to blue/red indicate that the conditions from the most previously plotted signal label have been met again.
The next 5 sections are all related to the strategy portion of the indicator, used to aid in the back testing process. These sections are titled “Stop loss”, “Take Profit”, “Trail Stop”, “Trade Settings” and “Trade Schedule”.
The Stop Loss section includes an option to choose between value of “pts”, “atr” (average true range) or “None”. The stop loss value in “pts” is simply a specified number of points or pips from the current entry price of a trade that are input in the “SL” section. If the stop loss type is “atr” the “SL” section is not used and the value is calculated and displaced from the current entry price of a trade based on the atr period multiplied by the atr multiplier.
The take profit section is based on the same logic as the stop loss.
The Trail Stop section includes an option to choose between values “pts” or “None”. If the Trail Stop value is “pts”, a trailing stop loss is activated if a trade moves a point value into profit that exceeds the value of the “Trail Activation”. If the Trail Offset type is “pts”, the trailing stop loss is placed a point value away from the current price that is equal to the “Trail Offset” value.
The trade settings section has two options to either prevent or allow trade reversals and prevent or allow only 1 trade per signal label.
If the “Don’t allow trade reversals” is on, then a currently active trade can not be cancelled by an opposite trade signal. It can only be cancelled by the exit logic selected in the above sections. If the “One trade per signal” is selected, the strategy will only enter a trade if the most recent signal label is different from the last signal label where a trade was entered, or if the most recent signal label is in the opposite direction of the most recent signal label where a trade was entered.
The trade schedule section includes an option to only generate signal labels during the specified time. You can choose between 24/7 which will generate signals without any time restriction, or you can choose a custom time which is based on the America / New York time zone.
The timeframe settings section includes an option to choose “single” or “multiple” timeframes, as well as an option to show every signal label combination (“all”), or only the signal labels with the highest numerical value (“absolute”).
If you select “single” next to “timeframe”, the indicator will show you labels based on trade conditions met from only 1 selected timeframe. If you select “multiple” next to “timeframe”, the indicator is designed to return signal labels based on trade conditions that have been met on at least 2 different timeframes.
If you select “multiple” and “use current timeframe”, the indicator will include labels that always include a minimum of 2 timeframes where 1 timeframe is always the current timeframe. If you unselect the “use current timeframe”, the indicator will include labels with a minimum of 2 timeframes.
If you select “multiple” next to “timeframe” and “all” next to “Show all/absolute labels”, the indicator will show you every possible combination of labels that vary from trade conditions met on a minimum of 2 timeframes, to the maximum number of timeframes selected.
If you select “multiple” next to “timeframe” and “absolute” next to “Show all/absolute labels”, the indicator will only show you labels where the numerical value is equivalent to the maximum number of timeframes selected.
Each signal label provides a number which refers to the number of timeframes used to generate the label, offering insights briefly. Hover over a label to reveal detailed tooltip information that details the exact timeframes used to generate each label.
You can choose all from “Show all/absolute labels” to see every possible combination of trade signals or “absolute” to only see labels that have the highest possible numerical value. Absolute means that every condition selected from every timeframe was calculated to be true at the same time on the same candle.
The next 8 sections are “Current timeframe trade conditions”, “1-minute timeframe trade conditions”, “5-minute timeframe trade conditions”, “15-minute timeframe trade conditions”, “30-minute timeframe trade conditions”, “1-hour timeframe trade conditions”, “4-hour timeframe trade conditions”, “Daily timeframe trade conditions”.
These sections include the same 10 trade conditions, that can be used independently, or in combination with each other. This brings the total number of trade conditions to 70.
The final section includes a standard option to adjust the current Ichimoku values.
Understanding the Calculations:
The term “future” refers to a value that is calculated 26 candles to the right of the most recent closing price.
The term “current” refers to a value that is calculated on the most recent closing price.
The term “past” refers to a value that is calculated 26 candles to the left of the most recent closing price.
Bullish is referred to as “blue” and bearish is referred to as “red”.
Buy Signals:
1. The current closing price is greater than the current cloud value.
2. The future cloud is blue.
3. The current closing price is greater than the current conversion line.
4. The current conversion line is greater than the current baseline.
5. The lagging span is greater than the closing price of the last 25 candles.
6. The lagging span is greater than the past cloud.
7. The lagging span is greater than the past conversion line and the past baseline.
8. The current conversion line is greater than the current cloud.
9. The current baseline is greater than the current cloud.
10. The value of the current cloud to the future cloud is completely blue.
Sell Signals:
1. The current closing price is less than the current cloud value.
2. The future cloud is red.
3. The current closing price is less than the current conversion line.
4. The current conversion line is less than the current baseline.
5. The lagging span is less than the closing price of the last 25 candles.
6. The lagging span is less than the past cloud.
7. The lagging span is less than the past conversion line and the past baseline.
8. The current conversion line is less than the current cloud.
9. The current baseline is less than the current cloud.
10. The value of the current cloud to the future cloud is completely red.
The script enables users to access the value of these 10 trade conditions across the 7 major time frames (1-minute, 5-minute, 15-minute, 30-minute, 1-hour, 4-hour, Daily, and the current charts time frame) by using the official non repainting request security function provided by Trading View:
f_secSecurity(_src, _res, _exp) =>
request.security(_src, _res, _exp )
This indicator provides up to 70 variables (10 variables X 7 timeframes) that can be used separately, or in combination to generate signal labels.
Enhance your visual analysis with a color-changing baseline and candle colors that adapt to signal shifts, offering an immediate understanding of market trends. The base line will change from gray to blue/red which will reference the most previously plotted signal label. This change in color indicate that the conditions from the most recently plotted signal label have been met once again. Please refer to the example below.
Adjustments to the Ichimoku Indicator:
The script uses a slightly refined version of the Ichimoku indicator to calculate 10 different “trade conditions”. Each trade condition can create 1 bullish signal label and 1 bearish signal label. The calculations are primarily based on “greater than and less than logic” which is standard for signal generation.
In the original Ichimoku calculations, the “Lagging Span” has a default value of 26 periods. In the actual calculations, this input with the title “Lagging Span” is referred to as the “displacement”. When the lagging span is plotted on the chart, it is plotted with an offset value of offset = -displacement + 1 which technically plots the lagging span 25 candles to the left the most recent candle (if you count the most recent closing price as 0 and not 1). The clouds are plotted with an offset of offset = displacement -1 which technically plots the clouds 25 candles to the right of the most recent candle.
I have adjusted the logic of the Ichimoku indicator so the lagging span is still plotted 25 candles to the left of the most recently confirmed candle close, but the cloud is plotted 26 candles to the right of the most recent confirmed candle close.
This seemingly small adjustment of one candle cannot simply be adjusted in the settings of the original Ichimoku indicator since the calculations of the cloud and lagging span displacements are directly affected by the same value (displacement = 26, also known as the “lagging span”). My script is adjusted to make calculations where the lagging span is 25 candles to the left of the most recent candle, and the cloud is displaced 26 candles to the right of the most recent candle.
For example, my scripts logic to detect if the current closing price is over the current cloud is (close > leadLead1 and close > leadLine2 and leadLine1 > leadLine2 . By using a lookback of , the logic assumes that the displaced value is 26 bars to the right of the most recent candle. My script also reflects this logic in the plotted values of the cloud where the offset values are offset = displacement. This adjustment is made without affecting any other part of the Ichimoku indicators calculations, only the displacement of the cloud which directly affects the logic of trade conditioins. This change is a deliberate and necessary function of this script’s logic to generate trade conditions and signal labels.
I’ve removed the conversion line and the lagging span and introduced a 26-period pivot high/low to provide a less cluttered chart. The pivot high/low looks 26 periods to the left and only 1 period to the right. The lagging span and conversion line logic is still built into the framework of the trading signals. If you choose to enable the lagging span, or conversion line.
trading approach, and always test your strategies thoroughly.
The function to generate the "Signal Labels" calculates every single possible combination of the 7 different timeframes which is a total of 127 combinations for bullish signal labels, and 127 combinations for bearish signal labels. This function also provides the necessary criteria for the strategy entry conditions, based on the dynamically calculated values derived from the signal labels themselves. For example: "buy signal on 1 minute and 5 minute timeframe" is considered 1 combination, and "Buy signal on current, 5 minute, 15 minute, 30 minute, 1 hour, 4 hour and daily timeframe" is also considered 1 combination. There are a total of 254 combinations between buy and sell signal labels along with 254 individual variables with their own unique tool tip description. The signal label function alone spans over 1340 lines of code (minus spaces and comments) to specifically account for every possible variable combination. This unique and original function also calculates the signal label "value" which is the number you see on the signal label. This function adjusts the amount of labels plotted, the value and description of all labels based on the timeframe settings "single"/"multiple", the use of "use current timeframe" setting, and the "trade schedule". This signal label function has been a landmark piece of code for me in my endeavor to create and optimize my strategies based on its ability to provide an in depth analysis of the timeframes used when generating signal labels. This function is main reason that this script has been published closed source.
Back tested results.
The current results are from US30 (Dow Jones Industrial Average CFD) on the 5-minute timeframe using regular candles. The inputs are as follows:
Stop loss = 5000 pts
No take profit.
Trail activation = 100 pts
Trail offset = 100 pts
Don’t allow trade reversals
Trade 24/7
Timeframe = multiple
Show absolute signals
Use current timeframe, lag span over/under candles
Use 30m timeframe, all cloud is bull/bear
Initial capital = $10,000 USD, 1 contract, $0.07 per contract, slippage = 3 ticks, use bar magnifier = on
Timeframe = June 1st, 2023 – November 10th, 2023, risk = 5% (greatest loosing trade = $500.44)
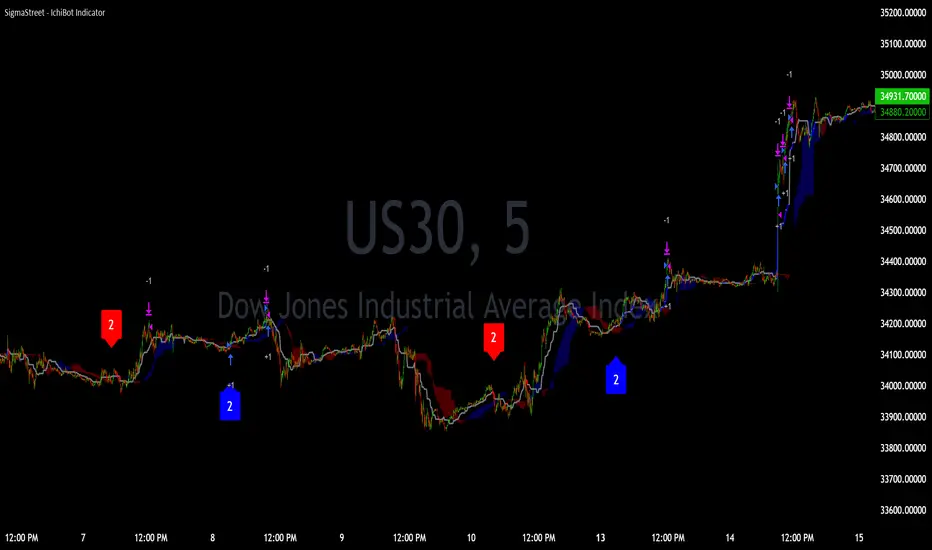
Pineconnector Strategy Template (Connect Any Indicator)Hello traders,
If you're tired of manual trading and looking for a solid strategy template to pair with your indicators, look no further.
This Pine Script v5 strategy template is engineered for maximum customization and risk management.
Best part?
It’s optimized for Pineconnector, allowing seamless integration with MetaTrader 4 and 5.
This powerful tool gives a lot of power to those who don't know how to code in Pinescript and are looking to automate their indicators' signals on Metatrader 4/5.
IMPORTANT NOTES
Pineconnector is a trading bot software that forwards TradingView alerts to your Metatrader 4/5 for automating trading.
Many traders don't know how to dynamically create Pineconnector-compatible alerts using the data from their TradingView scripts.
Traders using trading bots want their alerts to reflect the stop-loss/take-profit/trailing-stop/stop-loss to break options from your script and then create the orders accordingly.
This script showcases how to create Pineconnector alerts dynamically.
Pineconnector doesn't support alerts with multiple Take Profits.
As a workaround, for 2 TPs, I had to open two trades.
It's not optimal, as we end up paying more spreads for that extra trade - however, depending on your trading strategy, it may not be a big deal.
TRADINGVIEW ALERTS
1) You'll have to create one alert per asset X timeframe = 1 chart.
Example: 1 alert for EUR/USD on the 5 minutes chart, 1 alert for EUR/USD on the 15-minute chart (assuming you want your bot to trade the EUR/USD on the 5 and 15-minute timeframes)
2) Select the Order fills and alert() function calls condition
3) For each alert, the alert message is pre-configured with the text below
{{strategy.order.alert_message}}
Please leave it as it is.
It's a TradingView native variable that will fetch the alert text messages built by the script.
4) Don't forget to set the Pineconnector webhook URL in the Notifications tab of the TradingView alerts UI.
You’ll find the URL on the Pineconnector documentation website.
EA CONFIGURATION
1) The Pyramiding in the EA on Metatrader must be set to 2 if you want to trade with 2 TPs => as it's opening 2 trades.
If you only want 1 TP, set the EA Pyramiding to 1.
Regarding the other EA settings, please refer to the Pineconnector documentation on their website.
2) In the EA, you can set a risk (= position size type) in %/lots/USD, as in the TradingView backtest settings.
KEY FEATURES
I) Modular Indicator Connection
* plug in your existing indicator into the template.
* Only two lines of code are needed for full compatibility.
Step 1: Create your connector
Adapt your indicator with only 2 lines of code and then connect it to this strategy template.
To do so:
1) Find in your indicator where the conditions print the long/buy and short/sell signals.
2) Create an additional plot as below
I'm giving an example with a Two moving averages cross.
Please replicate the same methodology for your indicator, whether it's a MACD , ZigZag , Pivots , higher-highs, lower-lows, or whatever indicator with clear buy and sell conditions.
//@version=5
indicator("Supertrend", overlay = true, timeframe = "", timeframe_gaps = true)
atrPeriod = input.int(10, "ATR Length", minval = 1)
factor = input.float(3.0, "Factor", minval = 0.01, step = 0.01)
= ta.supertrend(factor, atrPeriod)
supertrend := barstate.isfirst ? na : supertrend
bodyMiddle = plot(barstate.isfirst ? na : (open + close) / 2, display = display.none)
upTrend = plot(direction < 0 ? supertrend : na, "Up Trend", color = color.green, style = plot.style_linebr)
downTrend = plot(direction < 0 ? na : supertrend, "Down Trend", color = color.red, style = plot.style_linebr)
fill(bodyMiddle, upTrend, color.new(color.green, 90), fillgaps = false)
fill(bodyMiddle, downTrend, color.new(color.red, 90), fillgaps = false)
buy = ta.crossunder(direction, 0)
sell = ta.crossunder(direction, 0)
//////// CONNECTOR SECTION ////////
Signal = buy ? 1 : sell ? -1 : 0
plot(Signal, title = "Signal", display = display.data_window)
//////// CONNECTOR SECTION ////////
Important Notes
🔥 The Strategy Template expects the value to be exactly 1 for the bullish signal and -1 for the bearish signal
Now, you can connect your indicator to the Strategy Template using the method below or that one.
Step 2: Connect the connector
1) Add your updated indicator to a TradingView chart
2) Add the Strategy Template as well to the SAME chart
3) Open the Strategy Template settings, and in the Data Source field, select your 🔌Connector🔌 (which comes from your indicator)
Note it doesn’t have to be named 🔌Connector🔌 - you can name it as you want - however, I recommend an explicit name you can easily remember.
From then, you should start seeing the signals and plenty of other stuff on your chart.
🔥 Note that whenever you update your indicator values, the strategy statistics and visuals on your chart will update in real-time
II) Customizable Risk Management
- Choose between percentage or USD modes for maximum drawdown.
- Set max consecutive losing days and max losing streak length.
- I used the code from my friend @JosKodify for the maximum losing streak. :)
Will halt the EA and backtest orders fill whenever either of the safeguards above are “broken”
III) Intraday Risk Management
- Limit the maximum intraday losses both in percentage or USD.
- Option to set a maximum number of intraday trades.
- If your EA gets halted on an intraday chart, auto-restart it the next day.
IV) Spread and Account Filters
- Trade only if the spread is below a certain pip value.
- Set requirements based on account balance or equity.
V) Order Types and Position Sizing
- Choose between market, limit, or stop orders.
- Set your position size directly in the template.
Please use the position size from the “Inputs” and not the “Properties” tab.
Reason : The template sends the order on the same candle as the entry signals - at those entry signals candles, the position size isn’t computed yet, and the template can’t then send it to Pineconnector.
However, you can use the position size type (USD, contracts, %) from the “Properties” tab for backtesting.
In the EA, you can define the position size type for your orders in USD or lots or %.
VI) Advanced Take-Profit and Stop-Loss Options
- Choose to set your SL/TP in either pips or percentages.
- Option for multiple take-profit levels and trailing stop losses.
- Move your stop loss to break even +/- offset in pips for “risk-free” trades.
VII) Logger
The Pineconnector commands are logged in the TradingView logger.
You'll find more information about it in this TradingView blog post .
WHY YOU MIGHT NEED THIS TEMPLATE
1) Transform your indicator into a Pineconnector trading bot more easily than before
Connect your indicator to the template
Create your alerts
Set your EA settings
2) Save Time
Auto-generated alert messages for Pineconnector.
I tested them all, and I checked with the support team what could/can’t be done
3) Be in Control
Manage your trading risks with advanced features.
4) Customizable
Fits various trading styles and asset classes.
REQUIREMENTS
* Make sure you have your Pineconnector license ID.
* Create your alerts with the Pineconnector webhook URL
* If there is any issue with the template, ask me in the comments section - I’ll answer quickly.
BACKTEST RESULTS FROM THIS POST
1) I connected this strategy template to a dummy Supertrend script.
I could have selected any other indicator or concept for this script post.
I wanted to share an example of how you can quickly upgrade your strategy, making it compatible with Pineconnector.
2) The backtest results aren't relevant for this educational script publication.
I used realistic backtesting data but didn't look too much into optimizing the results, as this isn't the point of why I'm publishing this script.
This strategy is a template to be connected to any indicator - the sky is the limit. :)
3) This template is made to take 1 trade per direction at any given time.
Pyramiding is set to 1 on TradingView.
The strategy default settings are:
* Initial Capital: 100000 USD
* Position Size: 1 contract
* Commission Percent: 0.075%
* Slippage: 1 tick
* No margin/leverage used
WHAT’S COMING NEXT FOR YOU GUYS?
I’ll make the same template for ProfitView, then for AutoView, and then for Alertatron.
All of those are free and open-source.
I have no affiliations with any of those companies - I'm publishing those templates as they will be useful to many of you.
Dave
