VWAP + EMA Analysis [Joshlo]Overview and Use Case
VWAP Analysis gives the possibility to combine multiple time frames of VWAP along with a triplet of exponential moving averages. This can provide insight into potential scalp, swing and longer term trades, depending on your time frame. The use of this indicator with it's setup is based off the the Scalp Setup Alerts provided by Roensch Capital.
The primary use for this script is to help with intraday scalp set ups. Using the Daily VWAP, turned on by default, we can look for price to respect and bounce from one of the VWAP lines (support or resistance) back toward equilibrium, we can also look for price to bounce off of equilibrium and move back toward VWAP support or resistance.
The chart attached shows AMD bouncing off of the Daily time frame VWAP Resistance level multiple times (see yellow boxes), often with confirmation given by an increase in volume which is often far higher than the average volume. In many of these cases a short position could've been opened or put option could have been placed with a profitable outcome.
Every line projected onto the chart via this indicator has the potential to create support or resistance as well as causing 'hang ups', meaning price loses it's momentum, slows down and hangs out in the particular area. This is shown on the chart within the green box.
Chart walkthrough - See attached chart
After a rejection off of the Daily VWAP Resistance line (depicted by the white circle), price starts to move back toward Daily VWAP Equilibrium. In order to reach this line, price needs to move through the 20EMA (white) and 50EMA (purple), the Weekly VWAP Resistance (red circles) and the 200EMA (orange). All of these lines are a part of this single indicator.
The 20EMA seems to offer little resistance but follows the price on it's move, offering some resistance to a volatile move upward. Initially upon contact with the 50EMA, price hangs up and bounces above and below the line whilst finding support on the Weekly VWAP Resistance at the same time. This causes a 'hang up' or sideways movement for around 20 minutes of trading. A potential trade may have entered at the white circle with a VWAP Resistance rejection and exited upon contact with the 50EMA in anticipation of multiple EMAs and support / resistance lines converging which is known to cause price movement to slow.
Eventually with an increase in volume, price breaks below the 20EMA (white), 50EMA (purple) and the Weekly VWAP Resistance level (red circles). Price then finds support on the 200EMA (orange), although there was potential for the price to fall to the Daily VWAP Equilibrium (solid blue). As the Red VWAP lines tend to act more often as resistance as opposed to support (price is rarely above these lines for extended periods), the trade from earlier may have profited more by awaiting contact with the 200EMA before exiting, taking the assumption that the Weekly VWAP Resistance was more likely to act as resistance than support.
A period of consolidation in the green box, around the Weekly VWAP Resistance, 20EMA, 50EMA and with support from the 200EMA eventually resulted in another break out where the price came back up to the Daily VWAP Resistance. Prior to the end of this trading day, there were two more opportunities for scalp setups based off of the price showing consistent rejections off the Daily VWAP Resistance back down to the 50EMA.
In the final example, price breaks above the Daily VWAP Resistance but quickly rejects off of the Monthly VWAP Resistance. For examples where the VWAP Resistance or Support or broken, it can help to look at an indicator such as the RSI to look for bullish divergence or bearish divergence.
Just as this example shows bounces and rejection off of VWAP Resistance, the same applies around the Equilibrium and Support VWAP lines.
The perfect scenario would be to find a ticker where there has already been two or three bounces off of one of these levels, with the goal of taking the trade on the next bounce and either using a percentage price target or technical price target based off of the EMAs or VWAP lines. If there are EMAs close in the direction you want to take the trade, there is a higher chance of hang ups and reversals, so a clear run is the more desired trade set up.
You can also look for these indicator lines to stack up in order to form a stronger support and resistance. For example the 200EMA and Daily VWAP Equilibrium being close to each other may suggest it would take more of an effort to break both of these levels, but one by itself may break more easily.
Indicator Setup
In the settings for the indicator, almost everything you might want to change can be done from the Input tab.
The three options for VWAP (daily, weekly and monthly) allow for analysis on multiple time frames. Daily is turned on as standard.
Standard Deviation Multiplier is set to 2 as standard, this effects the distance of the VWAP support and resistance from the equilibrium line. This seems to be a level that works well with finding support and resistance lines, however if there is excessively high or low volume, occasionally the lines can be thrown off. You can adjust this level if required to find a 'sweet spot' where price likes to reject or find support.
The colors for all VWAPs can be adjusted via the Inputs tab, however if you'd like to change the type of line these are depicted as, this can be done from the Styles tab.
The 3 EMAs (20, 50 and 200) can be toggled on or off and also have their color changed. The style of the lines can be adjusted from with the Styles tab if required.
"profit" için komut dosyalarını ara

RSI+PA+PrTPHi everybody,
This strategy is a RSI, Price Averaging, Pyramiding Strategy based on the earlier RSI+PA+DCA strategy. See below.
For this slightly different strategy I left the DCA option out and instead focused on the Take Profit calculation. In the previous strategy the Take Profit was directly connected to the Average Price level with a specified take profit %. When the price reached the Take Profit all positions where exited. The strategy opened multiple position based on the PA price levels. The separate positions can close when they reach separately specified Take Profit Limit. Each time the prices crosses the PA layer again the position can be re-opened. This causes the average price to drop each time a separate position is opened and closed.
I thought it was an interesting way to minimize losses and in general it works fine. Only when the market goes bearish it can cause significant losses
For the lack of a better word, I dubbed it Progressive Take Profit. The PrTP works different and is less risky. It doesn't directly follow the average price development and is calculated for a part based on the estimated profits of the separate closed positions. Every time a separate position is closed, the profit of that position is deducted of the Take Profit Limit. This causes the Take Profit Limit to drop les drastically then the average price and the whole position will only be closed when the separately opened and closed positions made up for the biggest losses.
There are still some aspects in the puzzle that are not fully worked out yet and I am still working on it, but I wanted to share this idea already and maybe you have some thoughts about it.
The next step is to re-implement a better worked out DCA function.
To be continued.
MilleMachineHello traders,
I hereby present to you the second stage of my journey to finding a reliable, profitable trading strategy.
The "Millemachine" is based on the "Millebot", my previous published strategy. This means the backbone of the strategy is still the same: a trend following system. Instead of using a fixed TP and SL, a trailing stoploss is now used. To limit the losses when the trend weakens, the trailing stoploss automatically gets smaller, as it is based on the ATR.
A new utility is you can now easily switch between indicators on which the decision making is based. This allows the user to discover which indicators work best for entry, long/short switching and stoploss configuration.
The strategy has been proven to be very profitable in trending markets, but can suffer losses during ranging market. To make the system more robust, the strategy cannot solely rely on a trending system. Other systems must be added.
I believe that a good trading bot must consist of more than 4 different strategies, based on different systems. This is what I am currently working on.
My goal for publishing this strategy is to help other traders build their own. In my journey I found it difficult to find a good strategy that employs a decent risk management, which is truly essential for having good, consistent results. Also, a realistic commission needs to be defined to have a realistic performance prediction. This weighs on the profitability and therefore is often set at 0 by authors of other strategies, which I find misleading.
If you have found this strategy informative or useful, please leave a comment.
Greetings Michael

TICK strategy for SPY optionsImportant notes:
1. This strategy is designed for same day SPY option scalping. All profit shown in back testing report is based on Profit/Loss (P/L) estimates from trading options with approximately 6 months of data. By default, it is set to 10 option contracts. By default the initial capital is set to $5000. Pyramiding is set to 3.
2. This strategy works better with non-extended market data.
3. This strategy is mainly developed for SPY trading on 5 min chart, it probably will not be very profitable with other tickers or time frame without tweaking all the parameters first.
4. This strategy will work with QQQ as well, but please adjust the profit multiplier to match the P/L of QQQ options.
How it works:
When trading the indices, many rely on the TICK for market directions. This strategy is a trend following strategy that uses a combination of conditions using the following indicators:
- TICK
- RSI
- VIX volatility index
- EMA
For entries, the conditions are:
1. TICK moving average crossover with a delayed signal line
2. Bullish or bearish RSI signal, RSI > 50 for bullish, < 50 for bearish
3. VIX must be above a certain threshold to take advantage of high market volatility
4. Price must be on top of EMA line for long, and below for short
For exits, there are 3 scenarios:
1. Stop loss set by a percentage of the daily ATR value
2. Trend changes on the TICK and the RSI
3. Bearish or bullish divergence on price with TICK
This strategy automatically signal to close all trades at 3:50 pm EST at the end of the day.
Extras:
- There is an option to show P/L for reinvesting profits
Enjoy~!!! Let's all make $$$

Up/Down Strategy - ContrarianThis is a consecutive bar up/down strategy for going long when the short condition is met or going short when the long condition is met. This is known in trading as taking contrarian signals and is helpful when an asset can provide only losses with a given strategy. In theory taking the opposing trade should produce a profit. With this strategy you can specify how many bars down to enter long and how many bars up to enter short. It also has code to check and make sure the condition is still true when launching the official alert, which helps back testing and live results line up, however be sure to enter commission and slippage into the properties to accurately reflect profits. I added back testing date ranges to this so you can easily pull up and see back tested results for a certain date range. I also added a buy and sell messages, close messages and take profit/stop loss message fields in the properties so you can launch alerts that will work with automated trading services. Simply enter your messages into those fields in the properties and then when you create an alert enter {{strategy.order.alert_message}} into the alert body and it will dynamically pull in your buy and sell messages when it fires alerts. I also added time restriction so you can enter trades only during the time frame specified. You can change it to any time frame, such at 0930-1600. Set the time restriction field to empty by default since otherwise the strategy won't take all trades like normal. So to enable time restriction enter a time frame in the format 0000-0000. I also added the ability to check off a box that will close the open trade at the end of the time restriction. So if you set the time frame to 0930-1600 and check off to enable close trade at end of time frame then it will look to exit the trade at the close of the next bar.

MacD Short and/or Long with Bi-Directional TP and SL This tool allows you to test any variable value for MacD and Signal for going Long or Short with each market direction having customizable values for stop loss and take profit.
For example, sometimes the MacD and Signal values are better with different lengths between Short and Long. You can use this tool to see them overlaid and determine the best settings for going one direction or the other.
This script was preset for use with XBTUSD on the 4 hour time frame. Another example with this in mind, is take profits and stop losses might not work in the Long market direction but going Short does! Without this tool that would be hard to see since typically stop loss and take profit is applied to both directions. I found with this tool that a 20% take profit seems to be a good sweet spot for going short with this strategy.
You can customize which MacD histogram you see by going to the style section and turning off the Short or Long parameters so you can see only 1 histogram at a time if you wish.
If you have any questions, please PM me.
Risk Management Tool [LuxAlgo]Good money management is one of the fundamental pillars of successful trading. With this indicator, we propose a simple way to manage trading positions. This tool shows Profit & Loss (P&L), suggests position size given a certain risk, sets stop losses and take profit levels using fixed price value/percentage/ATR/Range, and can also determine entries from crosses with technical indicators which is particularly handy if you don't want to set an entry manually.
1. Settings
Position Type: Determines if the position should be a "Long" or "Short".
Account Size: Determines the total capital of the trading account.
Risk: The maximum risk amount for a trade. Can be set as a percentage of the account size or as a fixed amount.
Entry Price: Determines the entry price of the position.
Entry From Cross: When enabled, allows to set the entry price where a cross with an external source was produced.
1.1 Stop Loss/Take Profit
Take Profit: Determines the take profit level, which can be determined by a value or percentage.
Stop Loss: Determines the stop loss level, which can be determined by a value or percentage.
2. Usage
One of the main usages of position management tools is to determine the position size to allocate given a specific risk amount and stop-loss. 2% of your capital is often recommended as a risk amount.
Our tool allows setting stop losses and take profits with different methods.
The ATR method sets the stop loss/take profit one ATR away from the entry price, with the ATR period being determined in the drop-down menu next to the selected methods. The range method works similarly but instead of using the ATR, we use a rolling range with a period determined in the drop-down menu next to the selected methods as well.
Unlike the available position management tool on TradingView, the entry can be determined from a cross between the price an an external source. The image above shows entries from the Volatility Stop indicator. This is particularly useful if you set positions based on trailing stops.

MarketGod for Tradingview(strategy)Fully Open Source Tv Market God Strategy. Good Luck
Strategy Description
MarketGod can be applied to any market, with any time-frame associated to it. The signals relay the alert at the close of the period, and the painted alert is then available to users to see on the chart or even set notifications for via tradingview's alert system. We recommend that users implement marketgod on their preferred time frames for trading, which for us is the 1h, 4h, 6h, 1D and above TFs.
MarketGod Versioning
The versions included with this release are the following
MarketGod v1
MarketGod v2
MarketGod v3
MarketGod v4
MarketGod v5
MarketGod v6
MarketGod v7
MarketGod v8
MarketGodx²
Ichimoku God
Suggested Uses
• MarketGod will inevitably produce false positives. We've taken steps to reduce this but we highly suggest you add this as a component of your strategy, not an end all be all
• That said, please do not feel the need to fire a trade based solely on a marketgod signal, or to every signal it fires.
• MarketGod users should backtest their strategy using OHLC candles for best results
• Heikin Ashi candles were recomended in the past, and we have eliminated the need for them, meaning that traditional candlestick inputs will yield the highest results.
• MarketGod will always give stronger alerts on higher TF's. If the 1-Day has fired a given signal and the 30 min or similar fire the opposite signal, know that the overall trend is still likely downward. Same concept applies to all timeframes on this tool.
Adjusting the Filter Settings
This tool has a noise filter for users to adjust.
The filter is a percentage based calculation, between significant points in time. The filter ranges between .5 and 25, with .5 increments
• For lower TFs ( IE Intraday), keep the filter set between .5-5
• Mid-TFs (4H,6H,12H,1D), the recommended range is between 5.5-10
• Higher TFs (3D and Higher), look for approx 11-20 range
Customizations
Customize the indicator by adjusting the colors in the style pane. Additionally, users can change the plots into labels with the price of close added to them, or a few other label text options, listed in the 'inputs' panel, below the filter adjustments. Users can also opt to turn the strategy orders as well, as this version will have them printed.
Strategy Performance Interpretation
Its important to understand the only metric that should be relevant is not the win %, as many may initially think. Alternatively, the only metric that matters in the end is your take home profit... meaning the profit one fees and taxes are accounted for. In our example here, the % brought back since the beginning of our window of 2018 is around 47% for $10,000 initial capital and 10% traded per position. Many are ignorant to the take home profit aspect as they focus solely on the winning %, which is ultimately incorrect approach to trading as a whole. as long as we maintain +30% (our goal minimum), the outcome being in the green, is our goal.

Optimized Keltner Channels SL/TP Strategy for BTCThis strategy is optimized for Bitcoin with the Keltner Channel Strategy, which is TradingView's built-in strategy. In the original Keltner Channel Strategy, it was difficult to predict the timing of entry because the Buy and Sell signals floated in the middle of the candle in real time. This strategy is convenient because if the bitcoin price hits the top or bottom of the Keltner Channel and closes the closing price, you can enter Buy or Sell at the next candle start price. In addition, this strategy provides Stop Loss and Take Profit functions to maximize profit.
_________________________________
Recommended settings are below.
- length: 9
- multiplier: 1
- source: close
- (v) Use EMA
- Bands Style: Average True Range
- ATR Length: 19
- Stop Loss (%): 20
- Take Profit (%) : 20
_________________________________
- length: 9
- multiplier: 1
- source: close
- (v) Use EMA
- Bands Style: Average True Range
- ATR Length: 18
- Stop Loss (%): 20
- Take Profit (%) : 5
_________________________________
▶ Usefulness and Originality
- Stop Loss and Take Profit functions are available
- Convenient Buy and Sell entry compared to the original Keltner Channel Strategy
- Optimized for BTCUSD market (maximizing profits)
___________________________________________
이 전략은 TradingView의 Built-in 전략인 Keltner Channel Strategy를 비트코인에 맞게 최적화되었습니다. 기존의 Keltner Channel Strategy는 Buy, Sell 신호가 캔들 중간에 실시간으로 떠서 진입 시점을 예측하기 어려운 불편함이 있었지만 이 전략은 비트코인 가격이 Keltner Channel 상단 혹은 하단을 찍고 종가를 마감하면 그 다음 캔들 시작가에서 Buy 혹은 Sell 진입이 가능하여 편리합니다. 또한, 이 전략은 Keltner Channel을 만나서 캔들을 마감한 가격 (bprice, sprice)을 시각적으로 plot을 제공하여 타점 및 차트를 보기에 편리하며 손절가 및 목표가를 지정한 백테스팅이 가능합니다.

MCDX PlusMCDX Plus is an indicator to show the relative level of Profitable Chips, Floating Chips and Locked Chips for Stocks market.
Red Bars being Profitable Chips, Yellow Bars being Floating Chips and Green Bars being Locked Chips.
Profitable Chips represents investments, typically by bankers, accumulating shares when stock price is relatively low over a period of time, either during down trend or ranging. When price is moving up, the shares accumulated will start to make profit.
Locked chips being those bought at at a higher price, failed or unwillingly to cut loss and still holding them.
Floating chips being free flow tradable shares in the market, typically hold by intraday or short term traders.
The relative profitable level is calculated based on current market price versus the highest and lowest price over a look back period.
Typically, 100 days look back, which is sufficient to cover uptrend or downtrend.
In this indicator, I added in options for 34 days (Fibo numbe), 50 days, 100 days and user-input DIY look back period.
When Red Bar height is increasing, profitable level is increasing, stocks price is increasing with main funding is increasing.
Typically higher is better. More than 50% is preferred.
During a retrace or downtrend, the locked chips will lead to higher values of green bar.
Typically lower is better, 0 is preferred.
A simulated fund line (based on KDJ) and fund bull bear line are added to simulate the inflow and outflow of fund.
When fund line cross up bull bear line, it means the in flow of funding.
User can click to show in the setting.
A potential bottom catch alert based on volume and oversold situation are also added as reference.
A table with indicator name and values of profitable chips, floating chips and locked chips is added.
User can click to show or mute.
MCDX Plus is shown on DPIH (KLCI).
The Price chart shows the highest, lowest, average of 100day look back period, blue line being MA20.
MCDX's red bar is slightly over 50%, cross over the 10day Moving Average of profitable chips. Locked chips is 0.
We can also see fund cross over fund bull bear line briefly.
It is a positive movement.
User is recommend to do further technical analysis such as support and resistance, etc, to better understand trend.
Ideas to improve the scripts are welcome. Hope this help.

TradePro's Trading Idea Cipher Divergence EMA Pb StrategyHere I present you on of Trade Pro's Trading Idea: Cipher B+ Divergence EMA Pullback Strategy.
Optimized the crypto pairBTC/USDT in the 30 minute chart.
There is the possibility to switch between short and long positions.
You can choose between 2 different take profit/stop loss types: The Lowest Low/ Highest High Stop Loss/ Take Profit and the ATR Take Profit/ Stop Loss.
-----------------------------------------------------------------------------------
How does the strategy work?
ENTRY
Long
The price must be above the 200 EMA .
The price needs to make a pullback into the 50 EMA .
Right after that, the Cipher B indicator must give a buy signal, it must be below the zero line and the Money Flow cloud must be green.
Short
Contrary to the premise of long positions.
EXIT
Lowest Low/ Highest High Exit
The Lowest Low (long) / highest high (short) serves as the stop loss. The TP is formed on the basis of a factor.
(Long for example: *Lowest Low* multiplied by *Profitfactor* = TP).
ATR Exit
The value of ATR at the time of buying is multiplied by the value entered in "Profit factor ATR" and "Stop factor ATR". As soon as the price reaches this value, it is closed.
Important
The script must be optimized for each coin or currency pair. However, only the values for the profit factor, the stop loss and Lowest Low / Highest High are relevant.
Also, by changing the Chanel Length and the Chanel Average, you can create strong profit changes.
The results of the strategy are without commissions and leverage.
If you have any questions or feedback, please let me know in the comments.
If you need more information about the strategy and want to know exactly how to apply it, check out my profile. There I have created a tutorial for the function of the script.

RSI+PA+DCA StrategyDear Tradingview community,
This RSI based trading strategy is created as a training exercise. I am not a professional trader, but a committed hobbyist. This not a finished trading strategy meant for trading, but more a combination of different trading ideas I liked to explore deeper. The aim with this exercise was to gain more knowledge and understanding about price averaging and dollar cost averaging strategies. Aside that I wanted to learn how to program a pyramiding strategy, how to plot different order entry layers and how to open positions on a specific time interval.
In this script I adapted code from a couple of strategy examples by Coinrule . Who wrote simple and powerful examples of RSI based strategies and pyramiding strategies.
Also the HOWTO scripts shared by vitvlkv were very helpful for this exercise. In the script description you can find all the sources to the code.
A PA strategy could be a helpful addition to ease the 'stress-management to buy when price drops and resolution in selling when the price is rising' (Coinrule).
The idea behind the strategy is fairly simple and is based on an RSI strategy of buying low. A position is entered when the RSI and moving average conditions are met. The position is closed when it reaches a specified take profit percentage. As soon as the first the position is openend multiple PA (price average) layers are setup based on a specified percentage of price drop. When the price crosses the layer another position with somewhat the same amount of assets is entered. This causes the average cost price (the red plot line) to decrease. If the price drops more, another similar amount of assets is bought with another price average decrease as result. When the price starts rising again the different positions are separately closed when each reaches its specified take profit. The positions can be re-openend when the price drops again. And so on. When the price rises more and crosses over the average price and reached the specified take profit on top of it, it closes all the positions at once and cancels all orders. From that moment on it waits for another price dip before it opens a new position.
Another option is to activate a DCA function that opens a position based on a fixed specified amount. It enters a position at the start of every week and only when there are already other positions openend and if the current price is below the average price of the position. Like this buying on a time interval can help lowering the average price in case the market is down.
I read in some articles that price averaging is also called dollar cost averaging as the result is somewhat the same. Although DCA is really based on buying on fixed time intervals. These strategies are both considered long term investment strategies that can be profitable in the long run and are not suitable for short term investment schemes. The downturn is that the postion size increases when the general market trend is going down and that you have to patiently wait until the market start rising again.
Another notable aspect is that the logic in this strategy works the way it does because the entries are exited based on the FIFO (first in first out) close entry rule. This means that the first exit is applied to the first entry position that is openend. In other words that when the third entry reaches its take profit level and exits, it actually exits the first entry. If you take a close look in the 'List of Trades' of your Strategy Tester panel, you can see that some 'Long1' entries are closed by an 'Exit 3' and not by an 'Exit 1'. This means that your trade partly loses, but causes a decrease in average price that is later balanced out by lower or repeated entering and closing other positions. You can change this logic to a real sequential way of closing your entries, but this changes the averaging logic considerably. In case you want to test this you need to change, in this line in the strategy call 'close_entries_rule = "FIFO"', the word FIFO to ANY.
In the settings you can specify the percentage of portfolio to use for each trade to spread the risk and for each order a trading fee of 0.075% is calculated.

TSI HMA CCIHi!
This strategy has TSI and CCI indicators with the CCI being based on a HMA instead of the Price.
There is a number of conditions that must combine to create buy or sell signals, but it is basically a couple of MA crossovers.
The strategy opens new orders on each candle if the conditions are met, Either direction, so it is hedging.
It wont open new orders if there is a floating loss, and so is constantly attempting to hold a floating profit (drawup instead of drawdown)
But It has a StopLoss (set by user) for closing of losing orders, and it closes all orders in basket style when account is in profit to users set amount target profit.
Low commission set to simulate swap but Forex pairs generally dont have commission like the crypto exchanges do. So if you use this on cryptos, remember to increase the commission to your brokers amount.
Crypto users will likely find that because this opens so many orders the commission could erase its profits.
So i recommend this for Forex only, and perhaps, only NZDUSD 4H chart. other pairs, change settings for.
The strategy has settings for testing on target time spans, so you could test it on just Jan-Feb 2020 for example, if you want, or from Jan 2020 to present day.
Have Fun! Open Script for copy/paste/edit/publish your own version :)

CUT MY LOSSESS - Levereged Stop loss + R / R ratio checker Hello traders!
We have heard many times that keep your losses small and allow your profits to grow. But what happens is that we often make the mistake of doing high-margin trades that we cannot afford to lose. The main reason for this problem, in my opinion, is the rush to open a position and not paying attention to how much acceptable loss in each trade is for us? Is our stop loss point compatible with the loss we are willing to accept?
Many of the losses we incur are not due to our erroneous analysis but to the wrong trading strategy, miscalculation of Stop Loss and failure to calculate the Risk/Reward for each trade. At least for most novice traders, these mistakes happen .
This script does not have complicated logic and is designed only as a help for those who are not interested in working with calculators !! I hope that sometimes that we are very excited to buy, looking at this script can give us a serious flip to avoid risk .
This is a basic script that helps us to intuitively check our stop loss in according to our leverage and to guess the approximate risk/reward of our trade. This script assumes that you always trade with half of your total capital. It is also assumed that you routinely use up to ten percent of your capital for each trade. Therefore, the first variable in this script is the amount of tolerable loss in each trade for you, which is set to 25% by default. So if you follow the previous assumptions, each trade will endanger 2.5% of your capital.
Since not all analyzes are ever accurate, we need to enter into positions that have good Risk/Reward ratio, so that even if half of our analysis fails, we will profitable. Therefore, the second variable in this script is the acceptable Risk/Reward ratio for us, which is set to 1:4 by default.
Also, to check the efficiency of the stop-loss with different trading leverage, I add five leverage by default from 1 to 5 as lines on the side of your stop-loss point.
LeV A (Lowest Leverage-WHITE): 1 by default
LeV B (AQUA): 2 by default
LeV C (YELLOW): 3 by default
LeV D (ORANGE): 4 by default
LeV E (Highest Leverage-RED):5 by default
You can change all these leverages and Acceptable margin loss and R/R ratio according to your needs.
You can also hide the leverage lines you are not dealing with through the script settings .
You will also see lines on the side of your target point to check your risk/reward ,so you can approximate your target according to your trading leverage and the risk/reward you accept. you can also hide these R/R lines from the setting.
Important Note: This script is not designed to give you a stop loss point or take profit point.
To find these points, you must use technical analysis methods , and then use this script to check the coordination of these points with your trading strategy.
Using the script is simple, but I will try to explain it with a few examples.

EMA Crossover StrategyMoving average crossover systems measure drift in the market. They are great strategies for time-limited people.
So, why don't more people use them?
I think it's due to poor choice in choosing EMA lengths: Market Wizard Ed Seykota has a guideline for moving average crossovers: the slow line should be at least 3x the fast line. This removes a lot of the whipsaws inherent in moving average systems, which means greater profitability. His other piece of advice: long-only strategies are best in stock markets where there's a lot more upside potential.
Using these simple rules, we can reduce a lot of the whipsaws and low profitability trades! This strategy was made so you can see for yourself before trading.
=== HOW TO USE THIS INDICATOR ===
1) Choose your market and timeframe.
2) Choose the length.
3) Choose the multiplier.
4) Choose if the strategy is long-only or bidirectional.
Don't overthink the above! We don't know the best answers, that's why this strategy exists! We're going to test and find out.
After you find a good combination, set up an alert system with the default Exponential Moving Average indicators provided by TradingView.
=== TIPS ===
Increase the multiplier to reduce whipsaws (back and forth trades).
Increase the length to take fewer trades, decrease the length to take more trades.
Try a Long-Only strategy to see if that performs better.

MA+ADX+DMICOINBASE:BTCUSD
BINANCE:BTCUSDT
Use long and short moving average to look for a potential price in/out. (default as 14 and 7, bases on the history experience)
ADX and DMI to prevent the small volatility and tangling MA.
Test it in 4HR, "BINANCE:BTCUSDT"
From 12/1/2017- 11/1/2020 (Mixed Bull/Bear market)
Overall Profit: 560.89%
From 1/1/2018 - 1/1/2019 (Bear market)
Overall Profit: -2.19%
From 4/1/2020 - 11/1/2020 (Bull Market)
Overall Profit: 274.74%
Any suggestion is welcome to discuss.

Zignaly TutorialThis strategy serves as a beginner's guide to connect TradingView signals to Zignaly Crypto Trading Platform.
It was originally tested at BTCUSDT pair and 1D timeframe.
Before using this documentation it's recommended that you:
Use default TradingView strategy script or another script and setup its associated alert manually. Just make the alert pop-up in the screen.
Create a 'Copy-Trader provider' (or Signal Provider) in Zignaly and send signals to it either thanks to your browser or with some basic programming.
SETTINGS
__ SETTINGS - Capital
(CAPITAL) Capital quote invested per order in USDT units {100.0}. This setting is only used when '(ZIG) Provider type' is set to 'Signal Provider'.
(CAPITAL) Capital percentage invested per order (%) {25.0}. This setting is only used when '(ZIG) Provider type' is set to 'Copy Trader Provider'.
__ SETTINGS - Misc
(ZIG) Enable Alert message {True}: Whether to enable alert message or not.
(DEBUG) Enable debug on order comments {True}: Whether to show alerts on order comments or not.
Number of decimal digits for Prices {2}.
(DECIMAL) Maximum number of decimal for contracts {3}.
__ SETTINGS - Zignaly
(ZIG) Integration type {TradingView only}: Hybrid : Both TradingView and Zignaly handle take profit, trailing stops and stop losses. Useful if you are scared about TradingView not firing an alert. It might arise problems if TradingView and Zignaly get out of sync. TradingView only : TradingView sends entry and exit orders to Zignaly so that Zignaly only buys or sells. Zignaly won't handle stop loss or other settings on its own.
(ZIG) Zignaly Alert Type {WebHook}: 'Email' or 'WebHook'.
(ZIG) Provider type {Copy Trader Provider}: 'Copy Trader Provider' or 'Signal Provider'. 'Copy Trader Provider' sends a percentage to manage. 'Signal Provider' sends a quote to manage.
(ZIG) Exchange: 'Binance' or 'Kucoin'.
(ZIG) Exchange Type {Spot}: 'Spot' or 'Futures'.
(ZIG) Leverage {1}. Set it to '1' when '(ZIG) Exchange Type' is set to 'Spot'.
__ SETTINGS - Strategy
(STRAT) Strategy Type: 'Long and Short', 'Long Only' or 'Short Only'.
(STOPTAKE) Take Profit? {false}: Whether to enable Take Profit.
(STOPTAKE) Stop Loss? {True}: Whether to enable Stop Loss.
(TRAILING) Enable Trailing Take Profit (%) {True}: Whether to enable Trailing Take Profit.
(STOPTAKE) Take Profit % {3.0}: Take profit percentage. This setting is only used when '(STOPTAKE) Take Profit?' setting is set to true.
(STOPTAKE) Stop Loss % {2.0}: Stop loss percentage. This setting is only used when '(STOPTAKE) Stop Loss?' setting is set to true.
(TRAILING) Trailing Take Profit Trigger (%) {2.5}: Trailing Stop Trigger Percentage. This setting is only used when '(TRAILING) Enable Trailing Take Profit (%)' setting is set to true.
(TRAILING) Trailing Take Profit as a percentage of Trailing Take Profit Trigger (%) {25.0}: Trailing Stop Distance Percentage. This setting is only used when '(TRAILING) Enable Trailing Take Profit (%)' setting is set to true.
(RECENT) Number of minutes to wait to open a new order after the previous one has been opened {6}.
DEFAULT SETTINGS
By default this strategy has been setup with these beginner settings:
'(ZIG) Integration type' : TradingView only
'(ZIG) Provider type' : 'Copy Trader Provider'
'(ZIG) Exchange' : 'Binance'
'(ZIG) Exchange Type' : 'Spot'
'(STRAT) Strategy Type' : 'Long Only'
'(ZIG) Leverage' : '1' (Or no leverage)
but you can change those settings if needed.
FIRST STEP
For both future of spot markets you should make sure to change '(ZIG) Zignaly Alert Type' to match either WebHook or Email. If you have a non paid account in TradingView as in October 2020 you would have to use Email which it's free to use.
RECOMMENDED SETTINGS
__ RECOMMENDED SETTINGS - Spot markets
'(ZIG) Exchange Type' setting should be set to 'Spot'
'(STRAT) Strategy Type' setting should be set to 'Long Only'
'(ZIG) Leverage' setting should be set to '1'
__ RECOMMENDED SETTINGS - Future markets
'(ZIG) Exchange Type' setting should be set to 'Futures'
'(STRAT) Strategy Type' setting should be set to 'Long and Short'
'(ZIG) Leverage' setting might be changed if desired.
__ RECOMMENDED SETTINGS - Signal Providers
'(ZIG) Provider type' setting should be set to 'Signal Provider'
'(CAPITAL) Capital quote invested per order in USDT units' setting might be changed if desired.
__ RECOMMENDED SETTINGS - Copy Trader Providers
'(ZIG) Provider type' setting should be set to 'Copy Trader Provider'
'(CAPITAL) Capital percentage invested per order (%)' setting might be changed if desired.
Strategy Properties setting: 'Initial Capital' might be changed if desired.
INTEGRATION TYPE EXPLANATION
'Hybrid': Both TradingView and Zignaly handle take profit, trailing stops and stop losses. Useful if you are scared about TradingView not firing an alert. It might arise problems if TradingView and Zignaly get out of sync.
'TradingView only': TradingView sends entry and exit orders to Zignaly so that Zignaly only buys or sells. Zignaly won't handle stop loss or other settings on its own.
HOW TO USE THIS STRATEGY
Beginner: Copy and paste the strategy and change it to your needs. Turn off '(DEBUG) Enable debug on order comments' setting.
Medium: Reuse functions and inputs from this strategy into your own as if it was a library.
Advanced: Check Strategy Tester. List of trades. Copy and paste the different suggested 'alert_message' variable contents to your script.
Expert: I needed a way to pass data from TradingView script to the alert. Now I know it's the 'alert_message' variable. I can do this own my own.
ALERTS SETUP
This is the important piece of information that allows you to connect TradingView to Zignaly in a semi-automatic manner.
__ ALERTS SETUP - WebHook
Webhook URL: https : // zignaly . com / api / signals.php?key=MYSECRETKEY
Message: { {{strategy.order.alert_message}} , "key" : "MYSECRETKEY" }
__ ALERTS SETUP - Email
Setup a new Hotmail account
Add it as an 'SMS email' in TradingView Profile settings page.
Confirm your own the email address
Create a rule in your Hotmail account that 'Redirects' (not forwards) emails to 'signals @ zignaly . email' when (1): 'Subject' includes 'Alert', (2): 'Email body' contains string 'MYZIGNALYREDIRECTTRIGGER' and (3): 'From' contains 'noreply @ tradingview . com'.
In 'More Actions' check: Send Email-to-SMS
Message: ||{{strategy.order.alert_message}}||key=MYSECRETKEY||
MYZIGNALYREDIRECTTRIGGER
'(DEBUG) Enable debug on order comments' is turned on by default so that you can see in the Strategy Tester. List of Trades. The different orders alert_message that would have been sent to your alert. You might want to turn it off it some many letters in the screen is problem.
STRATEGY ADVICE
If you turn on 'Take Profit' then turn off 'Trailing Take Profit'.
ZIGNALY SIDE ADVICE
If you are a 'Signal Provider' make sure that 'Allow reusing the same signalId if there isn't any open position using it?' setting in the profile tab is set to true.
You can find your 'MYSECRETKEY' in your 'Copy Trader/Signal' provider Edit tab at 'Signal URL'.
ADDITIONAL ZIGNALY DOCUMENTATION
docs . zignaly . com / signals / how-to -- How to send signals to Zignaly
3 Ways to send signals to Zignaly
SIGNALS
FINAL REMARKS
This strategy tries to match the Pine Script Coding Conventions as best as possible.

Ruckard TradingLatinoThis strategy tries to mimic TradingLatino strategy.
The current implementation is beta.
Si hablas castellano o espanyol por favor consulta MENSAJE EN CASTELLANO más abajo.
It's aimed at BTCUSDT pair and 4h timeframe.
STRATEGY DEFAULT SETTINGS EXPLANATION
max_bars_back=5000 : This is a random number of bars so that the strategy test lasts for one or two years
calc_on_order_fills=false : To wait for the 4h closing is too much. Try to check if it's worth entering a position after closing one. I finally decided not to recheck if it's worth entering after an order is closed. So it is false.
calc_on_every_tick=false
pyramiding=0 : We only want one entry allowed in the same direction. And we don't want the order to scale by error.
initial_capital=1000 : These are 1000 USDT. By using 1% maximum loss per trade and 7% as a default stop loss by using 1000 USDT at 12000 USDT per BTC price you would entry with around 142 USDT which are converted into: 0.010 BTC . The maximum number of decimal for contracts on this BTCUSDT market is 3 decimals. E.g. the minimum might be: 0.001 BTC . So, this minimal 1000 amount ensures us not to entry with less than 0.001 entries which might have happened when using 100 USDT as an initial capital.
slippage=1 : Binance BTCUSDT mintick is: 0.01. Binance slippage: 0.1 % (Let's assume). TV has an integer slippage. It does not have a percentage based slippage. If we assume a 1000 initial capital, the recommended equity is 142 which at 11996 USDT per BTC price means: 0.011 BTC. The 0.1% slippage of: 0.011 BTC would be: 0.000011 . This is way smaller than the mintick. So our slippage is going to be 1. E.g. 1 (slippage) * 0.01 (mintick)
commission_type=strategy.commission.percent and commission_value=0.1 : According to: binance . com / en / fee / schedule in VIP 0 level both maker and taker fees are: 0.1 %.
BACKGROUND
Jaime Merino is a well known Youtuber focused on crypto trading
His channel TradingLatino
features monday to friday videos where he explains his strategy.
JAIME MERINO STANCE ON BOTS
Jaime Merino stance on bots (taken from memory out of a 2020 June video from him):
'~
You know. They can program you a bot and it might work.
But, there are some special situations that the bot would not be able to handle.
And, I, as a human, I would handle it. And the bot wouldn't do it.
~'
My long term target with this strategy script is add as many
special situations as I can to the script
so that it can match Jaime Merino behaviour even in non normal circumstances.
My alternate target is learn Pine script
and enjoy programming with it.
WARNING
This script might be bigger than other TradingView scripts.
However, please, do not be confused because the current status is beta.
This script has not been tested with real money.
This is NOT an official strategy from Jaime Merino.
This is NOT an official strategy from TradingLatino . net .
HOW IT WORKS
It basically uses ADX slope and LazyBear's Squeeze Momentum Indicator
to make its buy and sell decisions.
Fast paced EMA being bigger than slow paced EMA
(on higher timeframe) advices going long.
Fast paced EMA being smaller than slow paced EMA
(on higher timeframe) advices going short.
It finally add many substrats that TradingLatino uses.
SETTINGS
__ SETTINGS - Basics
____ SETTINGS - Basics - ADX
(ADX) Smoothing {14}
(ADX) DI Length {14}
(ADX) key level {23}
____ SETTINGS - Basics - LazyBear Squeeze Momentum
(SQZMOM) BB Length {20}
(SQZMOM) BB MultFactor {2.0}
(SQZMOM) KC Length {20}
(SQZMOM) KC MultFactor {1.5}
(SQZMOM) Use TrueRange (KC) {True}
____ SETTINGS - Basics - EMAs
(EMAS) EMA10 - Length {10}
(EMAS) EMA10 - Source {close}
(EMAS) EMA55 - Length {55}
(EMAS) EMA55 - Source {close}
____ SETTINGS - Volume Profile
Lowest and highest VPoC from last three days
is used to know if an entry has a support
VPVR of last 100 4h bars
is also taken into account
(VP) Use number of bars (not VP timeframe): Uses 'Number of bars {100}' setting instead of 'Volume Profile timeframe' setting for calculating session VPoC
(VP) Show tick difference from current price {False}: BETA . Might be useful for actions some day.
(VP) Number of bars {100}: If 'Use number of bars (not VP timeframe)' is turned on this setting is used to calculate session VPoC.
(VP) Volume Profile timeframe {1 day}: If 'Use number of bars (not VP timeframe)' is turned off this setting is used to calculate session VPoC.
(VP) Row width multiplier {0.6}: Adjust how the extra Volume Profile bars are shown in the chart.
(VP) Resistances prices number of decimal digits : Round Volume Profile bars label numbers so that they don't have so many decimals.
(VP) Number of bars for bottom VPOC {18}: 18 bars equals 3 days in suggested timeframe of 4 hours. It's used to calculate lowest session VPoC from previous three days. It's also used as a top VPOC for sells.
(VP) Ignore VPOC bottom advice on long {False}: If turned on it ignores bottom VPOC (or top VPOC on sells) when evaluating if a buy entry is worth it.
(VP) Number of bars for VPVR VPOC {100}: Number of bars to calculate the VPVR VPoC. We use 100 as Jaime once used. When the price bounces back to the EMA55 it might just bounce to this VPVR VPoC if its price it's lower than the EMA55 (Sells have inverse algorithm).
____ SETTINGS - ADX Slope
ADX Slope
help us to understand if ADX
has a positive slope, negative slope
or it is rather still.
(ADXSLOPE) ADX cut {23}: If ADX value is greater than this cut (23) then ADX has strength
(ADXSLOPE) ADX minimum steepness entry {45}: ADX slope needs to be 45 degrees to be considered as a positive one.
(ADXSLOPE) ADX minimum steepness exit {45}: ADX slope needs to be -45 degrees to be considered as a negative one.
(ADXSLOPE) ADX steepness periods {3}: In order to avoid false detection the slope is calculated along 3 periods.
____ SETTINGS - Next to EMA55
(NEXTEMA55) EMA10 to EMA55 bounce back percentage {80}: EMA10 might bounce back to EMA55 or maybe to 80% of its complete way to EMA55
(NEXTEMA55) Next to EMA55 percentage {15}: How much next to the EMA55 you need to be to consider it's going to bounce back upwards again.
____ SETTINGS - Stop Loss and Take Profit
You can set a default stop loss or a default take profit.
(STOPTAKE) Stop Loss % {7.0}
(STOPTAKE) Take Profit % {2.0}
____ SETTINGS - Trailing Take Profit
You can customize the default trailing take profit values
(TRAILING) Trailing Take Profit (%) {1.0}: Trailing take profit offset in percentage
(TRAILING) Trailing Take Profit Trigger (%) {2.0}: When 2.0% of benefit is reached then activate the trailing take profit.
____ SETTINGS - MAIN TURN ON/OFF OPTIONS
(EMAS) Ignore advice based on emas {false}.
(EMAS) Ignore advice based on emas (On closing long signal) {False}: Ignore advice based on emas but only when deciding to close a buy entry.
(SQZMOM) Ignore advice based on SQZMOM {false}: Ignores advice based on SQZMOM indicator.
(ADXSLOPE) Ignore advice based on ADX positive slope {false}
(ADXSLOPE) Ignore advice based on ADX cut (23) {true}
(STOPTAKE) Take Profit? {false}: Enables simple Take Profit.
(STOPTAKE) Stop Loss? {True}: Enables simple Stop Loss.
(TRAILING) Enable Trailing Take Profit (%) {True}: Enables Trailing Take Profit.
____ SETTINGS - Strategy mode
(STRAT) Type Strategy: 'Long and Short', 'Long Only' or 'Short Only'. Default: 'Long and Short'.
____ SETTINGS - Risk Management
(RISKM) Risk Management Type: 'Safe', 'Somewhat safe compound' or 'Unsafe compound'. ' Safe ': Calculations are always done with the initial capital (1000) in mind. The maximum losses per trade/day/week/month are taken into account. ' Somewhat safe compound ': Calculations are done with initial capital (1000) or a higher capital if it increases. The maximum losses per trade/day/week/month are taken into account. ' Unsafe compound ': In each order all the current capital is gambled and only the default stop loss per order is taken into account. That means that the maximum losses per trade/day/week/month are not taken into account. Default : 'Somewhat safe compound'.
(RISKM) Maximum loss per trade % {1.0}.
(RISKM) Maximum loss per day % {6.0}.
(RISKM) Maximum loss per week % {8.0}.
(RISKM) Maximum loss per month % {10.0}.
____ SETTINGS - Decimals
(DECIMAL) Maximum number of decimal for contracts {3}: How small (3 decimals means 0.001) an entry position might be in your exchange.
EXTRA 1 - PRICE IS IN RANGE indicator
(PRANGE) Print price is in range {False}: Enable a bottom label that indicates if the price is in range or not.
(PRANGE) Price range periods {5}: How many previous periods are used to calculate the medians
(PRANGE) Price range maximum desviation (%) {0.6} ( > 0 ): Maximum positive desviation for range detection
(PRANGE) Price range minimum desviation (%) {0.6} ( > 0 ): Mininum negative desviation for range detection
EXTRA 2 - SQUEEZE MOMENTUM Desviation indicator
(SQZDIVER) Show degrees {False}: Show degrees of each Squeeze Momentum Divergence lines to the x-axis.
(SQZDIVER) Show desviation labels {False}: Whether to show or not desviation labels for the Squeeze Momentum Divergences.
(SQZDIVER) Show desviation lines {False}: Whether to show or not desviation lines for the Squeeze Momentum Divergences.
EXTRA 3 - VOLUME PROFILE indicator
WARNING: This indicator works not on current bar but on previous bar. So in the worst case it might be VP from 4 hours ago. Don't worry, inside the strategy calculus the correct values are used. It's just that I cannot show the most recent one in the chart.
(VP) Print recent profile {False}: Show Volume Profile indicator
(VP) Avoid label price overlaps {False}: Avoid label prices to overlap on the chart.
EXTRA 4 - ZIGNALY SUPPORT
(ZIG) Zignaly Alert Type {Email}: 'Email', 'Webhook'. ' Email ': Prepare alert_message variable content to be compatible with zignaly expected email content format. ' Webhook ': Prepare alert_message variable content to be compatible with zignaly expected json content format.
EXTRA 5 - DEBUG
(DEBUG) Enable debug on order comments {False}: If set to true it prepares the order message to match the alert_message variable. It makes easier to debug what would have been sent by email or webhook on each of the times an order is triggered.
HOW TO USE THIS STRATEGY
BOT MODE: This is the default setting.
PROPER VOLUME PROFILE VIEWING: Click on this strategy settings. Properties tab. Make sure Recalculate 'each time the order was run' is turned off.
NEWBIE USER: (Check PROPER VOLUME PROFILE VIEWING above!) You might want to turn on the 'Print recent profile {False}' setting. Alternatively you can use my alternate realtime study: 'Resistances and supports based on simplified Volume Profile' but, be aware, it might consume one indicator.
ADVANCED USER 1: Turn on the 'Print price is in range {False}' setting and help us to debug this subindicator. Also help us to figure out how to include this value in the strategy.
ADVANCED USER 2: Turn on the all the (SQZDIVER) settings and help us to figure out how to include this value in the strategy.
ADVANCED USER 3: (Check PROPER VOLUME PROFILE VIEWING above!) Turn on the 'Print recent profile {False}' setting and report any problem with it.
JAIME MERINO: Just use the indicator as it comes by default. It should only show BUY signals, SELL signals and their associated closing signals. From time to time you might want to check 'ADVANCED USER 2' instructions to check that there's actually a divergence. Check also 'ADVANCED USER 1' instructions for your amusement.
EXTRA ADVICE
It's advised that you use this strategy in addition to these two other indicators:
* Squeeze Momentum Indicator
* ADX
so that your chart matches as close as possible to TradingLatino chart.
ZIGNALY INTEGRATION
This strategy supports Zignaly email integration by default. It also supports Zignaly Webhook integration.
ZIGNALY INTEGRATION - Email integration example
What you would write in your alert message:
||{{strategy.order.alert_message}}||key=MYSECRETKEY||
ZIGNALY INTEGRATION - Webhook integration example
What you would write in your alert message:
{ {{strategy.order.alert_message}} , "key" : "MYSECRETKEY" }
CREDITS
I have reused and adapted some code from
'Directional Movement Index + ADX & Keylevel Support' study
which it's from TradingView console user.
I have reused and adapted some code from
'3ema' study
which it's from TradingView hunganhnguyen1193 user.
I have reused and adapted some code from
'Squeeze Momentum Indicator ' study
which it's from TradingView LazyBear user.
I have reused and adapted some code from
'Strategy Tester EMA-SMA-RSI-MACD' study
which it's from TradingView fikira user.
I have reused and adapted some code from
'Support Resistance MTF' study
which it's from TradingView LonesomeTheBlue user.
I have reused and adapted some code from
'TF Segmented Linear Regression' study
which it's from TradingView alexgrover user.
I have reused and adapted some code from
"Poor man's volume profile" study
which it's from TradingView IldarAkhmetgaleev user.
FEEDBACK
Please check the strategy source code for more detailed information
where, among others, I explain all of the substrats
and if they are implemented or not.
Q1. Did I understand wrong any of the Jaime substrats (which I have implemented)?
Q2. The strategy yields quite profit when we should long (EMA10 from 1d timeframe is higher than EMA55 from 1d timeframe.
Why the strategy yields much less profit when we should short (EMA10 from 1d timeframe is lower than EMA55 from 1d timeframe)?
Any idea if you need to do something else rather than just reverse what Jaime does when longing?
FREQUENTLY ASKED QUESTIONS
FAQ1. Why are you giving this strategy for free?
TradingLatino and his fellow enthusiasts taught me this strategy. Now I'm giving back to them.
FAQ2. Seriously! Why are you giving this strategy for free?
I'm confident his strategy might be improved a lot. By keeping it to myself I would avoid other people contributions to improve it.
Now that everyone can contribute this is a win-win.
FAQ3. How can I connect this strategy to my Exchange account?
It seems that you can attach alerts to strategies.
You might want to combine it with a paying account which enable Webhook URLs to work.
I don't know how all of this works right now so I cannot give you advice on it.
You will have to do your own research on this subject. But, be careful. Automating trades, if not done properly,
might end on you automating losses.
FAQ4. I have just found that this strategy by default gives more than 3.97% of 'maximum series of losses'. That's unacceptable according to my risk management policy.
You might want to reduce default stop loss setting from 7% to something like 5% till you are ok with the 'maximum series of losses'.
FAQ5. Where can I learn more about your work on this strategy?
Check the source code. You might find unused strategies. Either because there's not a substantial increases on earnings. Or maybe because they have not been implemented yet.
FAQ6. How much leverage is applied in this strategy?
No leverage.
FAQ7. Any difference with original Jaime Merino strategy?
Most of the times Jaime defines an stop loss at the price entry. That's not the case here. The default stop loss is 7% (but, don't be confused it only means losing 1% of your investment thanks to risk management). There's also a trailing take profit that triggers at 2% profit with a 1% trailing.
FAQ8. Why this strategy return is so small?
The strategy should be improved a lot. And, well, backtesting in this platform is not guaranteed to return theoric results comparable to real-life returns. That's why I'm personally forward testing this strategy to verify it.
MENSAJE EN CASTELLANO
En primer lugar se agradece feedback para mejorar la estrategia.
Si eres un usuario avanzado y quieres colaborar en mejorar el script no dudes en comentar abajo.
Ten en cuenta que aunque toda esta descripción tenga que estar en inglés no es obligatorio que el comentario esté en inglés.
CHISTE - CASTELLANO
¡Pero Jaime!
¡400.000!
¡Tu da mun!

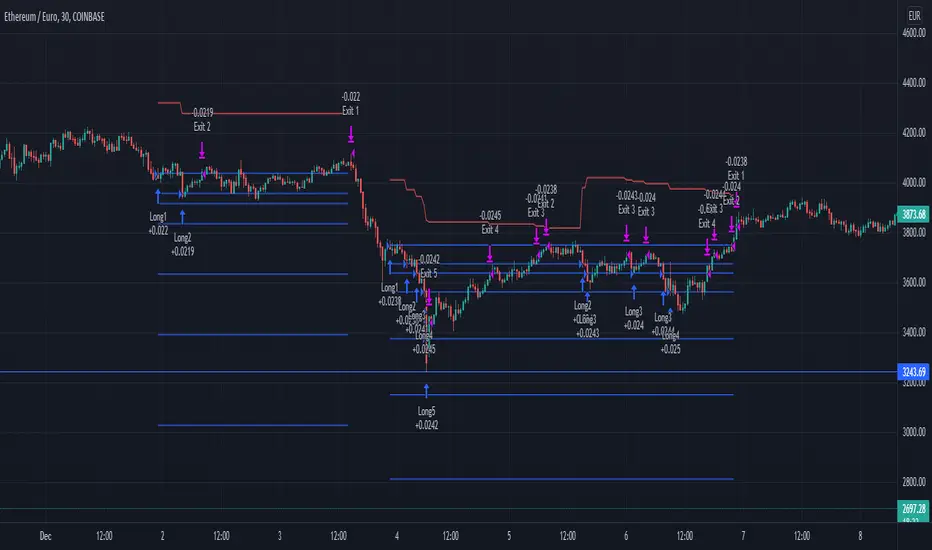
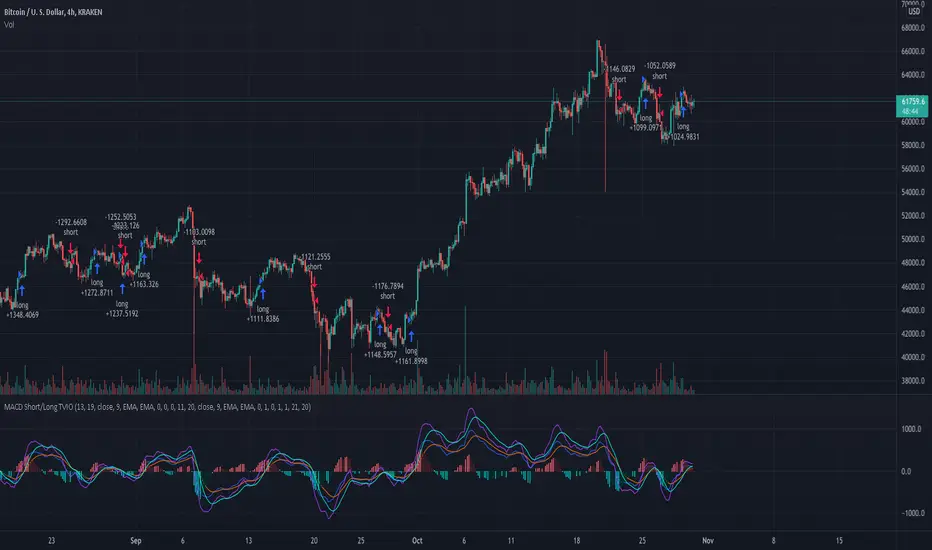
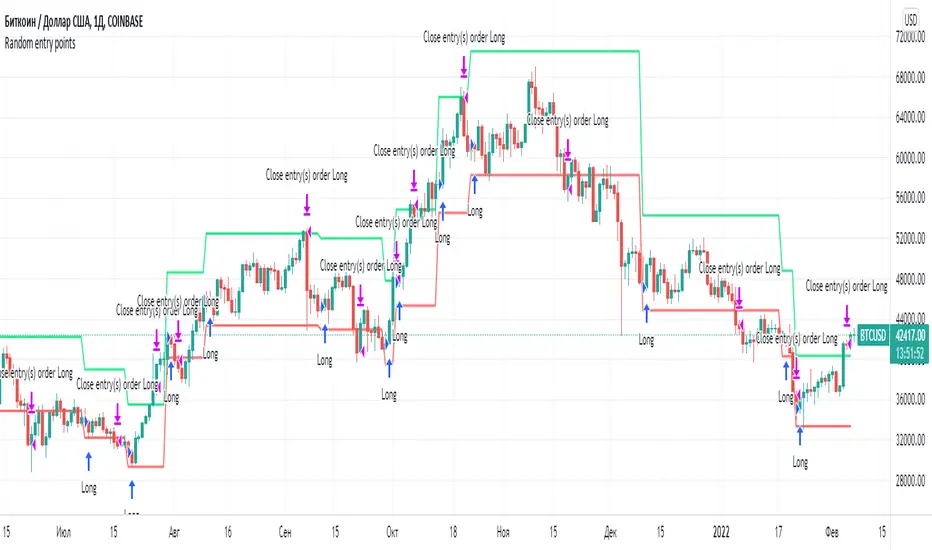
Random entry pointsIt is profitable strategy with random entry points.
A simple strategy involving random opening of trades. But such a strategy on large samples will demonstrate profit. Because the strategy adheres to the golden rule of trading: "Let profits rise and quickly stop losses."
Remember, exit points are very important. Many traders make the mistake of focusing all their attention on entry points.
BV's MACD SIGNAL TESTERHello ladies and gentlemen,
Today, as you may have seen in the title, I have coded a strategy to determine once and for all if MACD could make you money in 2020.
So, at the end of this video, you will know which MACD strategy will bring you the most money.
Spoiler alert: we've hit the 90% WinRAte mark on the Euro New Zealand Dollar chart.
I've seen a lot of videos of people testing different MACD signals, some up to 100 times.
But In my opinion, all traders must rely on statistics to put all the odds on their side and good statistics require a lot more data.
The algorithm I'm showing you tests each signal one by one over a 3 year period and on 28 different graphs.
That way we are sure that we have encountered all possible market behavior.
From phases of congestion to major trends or even the effects of COVID-19
I use the ATR to determine my Stop Loss and Take Profits. The Stop Loss is placed at 1.5 times the ATR, the Take Profit is placed at 1 time the ATR.
If my Take Profit is hit, I take 50% of the profits and let the position run by moving my Stop Loss to Zero.
This way, the position can no longer be a losing position.
If you are not familiar with this practice, I invite you to study the "Scaling out" video from the NoNonsenseForex channel.
BV's Trading Journal.

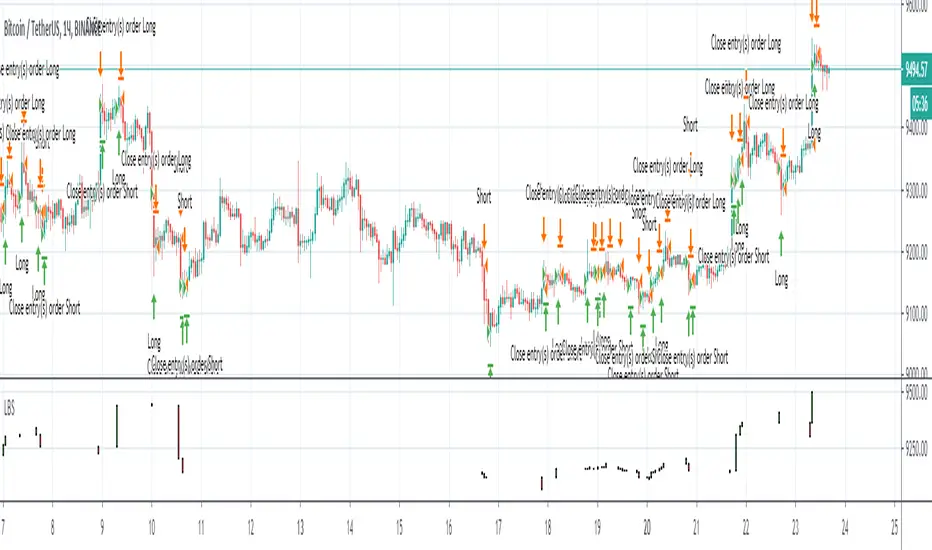
Best strategy for TradingView (fake)Hello everyone! I want to show you this strategy so you don't fall for the tricks of scammers. On TradingView, you can write an algorithm (probably more than one) that will show any profit you want: from 1% to 100,000% in one year (maybe more)! This can be done, for example, using the built-in linebreak () function and several conditions for opening long and short.
I am sure that sometimes scammers show up on TradingView showing their incredible strategies. Will a smart person sell a profitable quick strategy? When a lot of people start using the quick strategy, it stops working. Therefore, no smart person would sell you a quick strategy. It is acceptable to sell slow strategies: several transactions per month - this does not greatly affect the market.
So, don't fall for the tricks of scammers, write quick strategies yourself.
About this strategy, I can say that the linebreak () function does not work correctly in it. Accordingly, the lines are not drawn correctly on the chart. They are drawn in such a way as to show the maximum profit. I watched this algorithm on a 1m timeframe - no lines are drawn in real time. This is a fake!
Buy The Dips - MA200 OptimisedThe strategy combines a contrarian approach (buying the dips) with a trend-following logic (only when the price is above the MA200)
The strategy seeks to find the best times when buying the dips on the asset should result to be more profitable.
The price above a long-term moving average indicates momentum that increases the possibility of profiting from buying the asset on short-term weakness.

Price Action and 3 EMAs Momentum plus Sessions FilterThis indicator plots on the chart the parameters and signals of the Price Action and 3 EMAs Momentum plus Sessions Filter Algorithmic Strategy. The strategy trades based on time-series (absolute) and relative momentum of price close, highs, lows and 3 EMAs.
I am still learning PS and therefore I have only been able to write the indicator up to the Signal generation. I plan to expand the indicator to Entry Signals as well as the full Strategy.
The strategy works best on EURUSD in the 15 minutes TF during London and New York sessions with 1 to 1 TP and SL of 30 pips with lots resulting in 3% risk of the account per trade. I have already written the full strategy in another language and platform and back tested it for ten years and it was profitable for 7 of the 10 years with average profit of 15% p.a which can be easily increased by increasing risk per trade. I have been trading it live in that platform for over two years and it is profitable.
Contributions from experienced PS coders in completing the Indicator as well as writing the Strategy and back testing it on Trading View will be appreciated.
STRATEGY AND INDICATOR PARAMETERS
Three periods of 12, 48 and 96 in the 15 min TF which are equivalent to 3, 12 and 24 hours i.e (15 min * period / 60 min) are the foundational inputs for all the parameters of the PA & 3 EMAs Momentum + SF Algo Strategy and its Indicator.
3 EMAs momentum parameters and conditions
• FastEMA = ema of 12 periods
• MedEMA = ema of 48 periods
• SlowEMA = ema of 96 periods
• All the EMAs analyse price close for up to 96 (15 min periods) equivalent to 24 hours
• There’s Upward EMA momentum if price close > FastEMA and FastEMA > MedEMA and MedEMA > SlowEMA
• There’s Downward EMA momentum if price close < FastEMA and FastEMA < MedEMA and MedEMA < SlowEMA
PA momentum parameters and conditions
• HH = Highest High of 48 periods from 1st closed bar before current bar
• LL = Lowest Low of 48 periods from 1st closed bar from current bar
• Previous HH = Highest High of 84 periods from 12th closed bar before current bar
• Previous LL = Lowest Low of 84 periods from 12th closed bar before current bar
• All the HH & LL and prevHH & prevLL are within the 96 periods from the 1st closed bar before current bar and therefore indicative of momentum during the past 24 hours
• There’s Upward PA momentum if price close > HH and HH > prevHH and LL > prevLL
• There’s Downward PA momentum if price close < LL and LL < prevLL and HH < prevHH
Signal conditions and Status (BuySignal, SellSignal or Neutral)
• The strategy generates Buy or Sell Signals if both 3 EMAs and PA momentum conditions are met for each direction and these occur during the London and New York sessions
• BuySignal if price close > FastEMA and FastEMA > MedEMA and MedEMA > SlowEMA and price close > HH and HH > prevHH and LL > prevLL and timeinrange (LDN&NY) else Neutral
• SellSignal if price close < FastEMA and FastEMA < MedEMA and MedEMA < SlowEMA and price close < LL and LL < prevLL and HH < prevHH and timeinrange (LDN&NY) else Neutral
Entry conditions and Status (EnterBuy, EnterSell or Neutral)(NOT CODED YET)
• ENTRY IS NOT AT THE SIGNAL BAR but at the current bar tick price retracement to FastEMA after the signal
• EnterBuy if current bar tick price <= FastEMA and current bar tick price > prevHH at the time of the Buy Signal
• EnterSell if current bar tick price >= FastEMA and current bar tick price > prevLL at the time of the Sell Signal
