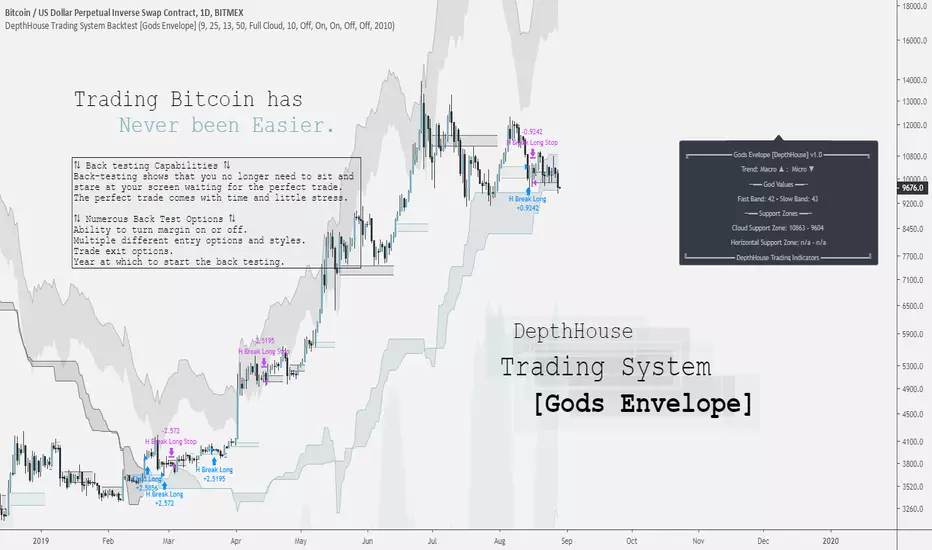
DepthHouse Trading System [Gods Envelope] Backtest StrategyCreated for Bitcoin!
*All testing has been done on the 1 Day time frame of BTC USD pairs.
Use at your own risk.
DepthHouse Trading System Basics
The Cloud:
The cloud is used in a very similar manner as the ichimoku cloud. A complete cross above or below the represents a macro trend change. The cloud then could be used as dynamic support and resistance zones.
By default there is no smoothing to the full cloud. If you wish to add smoothing, you can change the ‘Trend Base On’ option to ‘Modded Cloud Average’ to add price action and smoothing into the cloud’s calculations. The Modded Cloud can then be used in the same manner as the Full Cloud. Generally, the Full Cloud is more forgiving and has less Macro Trend changes. By default, this option is turned off. The support or resistance zone created will be shown on the info panel on the right.
Horizontal Levels:
A Horizonal zone is generated each time there is a micro level trend change. For example, as soon as a positive micro trend change occurs a green horizontal level will be plotted.
These levels then can be used as temporary support and resistance zones. The Horizontal Break Trading Strategy is entirely based on these levels. These levels are also shown on the info panel on the right.
The Envelope Itself: (by default this is off)
By selecting the Overbought and Oversold Ranges option, a cloud envelope will appear around the price action. This envelope represents the overbought and oversold ranges. If the price action should go into these zones, the info panel on the right will show ‘CAUTION’ beside the God Values as this signals that the pair is either overbought or oversold.
The God Values:
The God values are listed on the info panel on the right. These are the values created by the Godmode indicator. Generally, below 20 or above 80 it signals for caution as the price action has overextended itself.
The Back-Test Strategy Options:
⇅ - Child Fomo Positioning:
Child Fomo Positioning strategy is entirely based on the macro trend change with the center cloud. As soon as there is a complete candle close above or below the cloud and a trend change takes place. The back-test places a market order as soon as the next candle opens. By default, it then will not close this position until the price action fully crosses the cloud once again.
⇅ - Horizontal Break Trading:
Horizontal Break Trading Strategy is entirely based on the horizontal levels generated and the macro trend direction. For example, say the Macro Trend is up, and a green, positive horizontal level is formed. As soon as a complete candle closes above the upper level of the positive zone, a limit order is placed in hope that the price action comes back down and retests, filling the order. This long will not close then until a negative level is formed. As soon as a negative level is formed a stop/loss order is placed on the lower level of the horizontal support zone. It will then do the opposite in a bearish trend, and margin trading is turned on.
⇅ - Parent Positions :
Parent Positioning Strategy is based on the overall trend and the center cloud levels. This strategy has limit orders waiting on the level of the cloud that is closest to the price action. Therefore, using this strategy alone, the back-test system waits for the trend to be confirmed, and then follows the price action with limit orders waiting on the cloud to be retested. By default this order does not close until a Marco trend change occurs.
⇅ - Take 50% Partial Profits:
This options allows the back-test to take 50% profit or loss when one of the two options occur.
Horizontal Break: This would close 50% of the position in the same manner it would close a trade using the horizontal break trading system.
God Values: Once the price action enters the oversold or overbought clouds, it would then place a close order as soon as the price action exits the cloud.
⟲ - Backtest Year Start Date :
Start year of the back-testing. If set to ex. 2017, the back-test will not calculate any trades that took place before Jan. 1 of 2017.
⚖ - Margin Trading :
By default, margin trading is turned off. Simply switch this option to on the enable ‘Short Trading’ into the strategy back-test.
Notes: If you are back testing multiple strategies at the same time, you must increase the pyramiding to correspond to the number or strategies.
My Favorite Settings:
Margin = Off
Pyramiding = 2 [Settings → Properties → Pyramiding → 2 orders
Child Fomo Positioning = On
Horizontal Break Trading = On
Everything else off 😊
DISCLAIMER: Past performance does not guarantee future results.
Use at your own risk.
"profit" için komut dosyalarını ara
QuantCat 1H Momentum Strategy [Crypto]**NOTE: IF YOU DO NOT OWN TRADINGVIEW PRO YOUR STRATEGIES WILL TAKE DATA FROM A SMALLER SAMPLE SIZE, AND THUS GIVE LESS ACCURATE BACKTESTING RESULTS TO THE ONES WE SHOW (LINKS WITH STEP 3) AND OPTIMISED OUR STRATEGIES WITH**
QuantCat 15M Crypto Trend Strategy
This strategy will allow you to absolutely smash the Crypto/BTC pairs with a high hit rate and incredible risk/reward. We have optimised this strategy to work best for the x/BTC pairs on the 1H minute time frame. There are 7 pairs that we optimised the strategy to work for. There are a few main steps are as follows to use the strategy in it's most efficient manner-
1. Recommended % of equity per trade = 10-50%.
2. 1H Minute time frame needs to be applied (obvious, we know).
3. Pairs we used to optimise and backtest the strategy should ideally be used when using the strategy-
ETH/BTC - prntscr.com
XRP/BTC - prntscr.com
LTC/BTC - prntscr.com
BNB/BTC - prntscr.com
ADA/BTC - prntscr.com
NEO/BTC - prntscr.com
EOS/BTC - prntscr.com
We have a list of Visual and Technical features that are implemented into our strategy to make sure it is easy to use, consistent and giving it the highest chance of being profitable.
Visual Features
Colored Candles- aesthetics to notify you of an alert.
Stop Loss Horizontal Line- a red line to show you where the stop-loss has been placed.
Take Profit Line- horizontal line to show your where you take profits
Technical Features
Trend filtering- Our algorithm prevents signals being created in sideways periods to mitigate the chance of fake outs and larger run ups.
Momentum confirmation- Every time a position is entered; strict conditions have been met to maximize the chance of predicting the right move.
If you have discord alerts access, be sure to watch out in the discord for entries!

CS Buy/Sell Strategy (read the description)Get Buy/Sell signals and check their profitability in the Strategy Tester.
This script has been tested for the crypto space (Bitcoin, Ethereum, etc.) but works for other assets, as well.
I recommend to apply strategy tests on different time-frames (usually daily and 4hr work best) and go with the most profitable ones.
In the settings you have the ability to test the strategy using from - to dates to narrow down best profitable trade periods.
In order to add this strategy to your chart, click on "Add to favorite scripts" and in then, in your chart, go to Indicator and add it from your favorites.
If you have questions, please send me a message.
There is also a Long/Short focused script available with the ability to set alerts (requires an invite). If you want to add it. Just send me a message to get an invite:

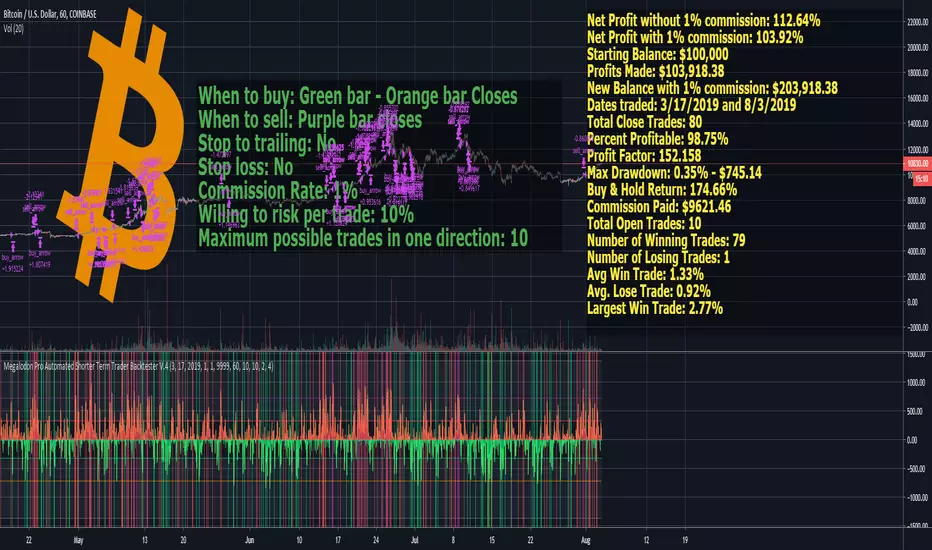
Megalodon Pro Automated Shorter Term Trader BacktesterSTRATEGY
When to buy: Green bar - Orange bar Closes
When to sell: Purple bar closes
Stop to trailing: No
Stop loss: No
Commission Rate: 1%
Willing to risk per trade: 10%
Maximum possible trades in one direction: 10
RESULTS
Net Profit without 1% commission: 112.64%
Net Profit with 1% commission: 103.92%
Starting Balance: $100,000
Profits Made: $103,918.38
New Balance with 1% commission: $203,918.38
Dates traded: 3/17/2019 and 8/3/2019
Total Close Trades: 80
Percent Profitable: 98.75%
Profit Factor: 152.158
Max Drawdown: 0.35% - $745.14
Buy & Hold Return: 174.66%
Commission Paid: $9621.46
Total Open Trades: 10
Number of Winning Trades: 79
Number of Losing Trades: 1
Avg Win Trade: 1.33%
Avg. Lose Trade: 0.92%
Largest Win Trade: 2.77%
Let me know what you guys think about the results?
Due to the tradingview's limitations on providing the shorter time frame price data, we had to provide a 60 minute time frame backtesting results.
The shorter time frames including 1 minute and 15 minutes backtesting results are way more accurate and precise than 60 minutes time frame results.
Megalodon Trading
Enlightening the Modern Investors
[astropark - Premium] Long-Short V3-FOREX [Strategy]This indicator is not holy grail , but it is an amazing trend finder and works nicely between 3m and 1W timeframes on FOREX :)))
With this indicator you can enjoy its trading signal and backtest the strategy.
In order to check how much you could have been profitable with this script if you started trading from a specific timestamp, please use this nice website to get the integer number representing in seconds the date-time you want to start from: www.unixtimestamp.com
If you want to set alerts on both buy, sell, take profit and stop-loss signals you must use the following not-strategy indicator version:
HOW TO USE THIS INDICATOR
Buy/Long when you see a green "B" label on the chart at best price you can, you have time till next candle's open price , trying to buy as low as possible near the green cloud or below it. Green cloud acts like a moving support for price, so use it for more buys/longs. The bigger the cloud, the stronger the bull-trend and so the support.
Sell/Short when you see a red "S" label on the chart at best price you can, you have time till next candle's open price , trying to sell as high as possible near the red cloud or over it. Red cloud acts like a moving resistance for price, so use it for more sells/shorts. The bigger the cloud, the stronger the bear-trend and so the resistance.
This indicator suggests some TP (Take Profit) for both longs (in green color) and shorts (in red color): you can start (at least partially!) closing the current trade (eventually you start new longs/shorts at cloud touch if you are a bold trader!).
Keep in mind that the lower the timeframe you work on, the easier is the trend to change rapidly, so always set a -2% / -5% stop-loss on trades and follow the trend with a nice trailing stop strategy.
Of course, as said at the beginning, this indicator suggests some TPs (Take Profits) for both longs (in green color) and shorts (in red color) operations: when you see a TP, you can start (at least partially!) taking profits over the current trade and move stop-loss higher (at least at break-even).
This is a premium indicator , so send me a private message in order to get access to this script.
Do you like my free scripts? Offer me a coffee, a beer, a pizza or whatever :)
BTC jar: 1K5kuYQPEqoNo6GRmJbHWMPmqwKM5S3oRR
ETH jar: 0x091b541a6dd6fe08c4e7bd909baafb2fce9b975e
LTC jar: LSVoAChsZrVsvbNyUfdpxtFpDAUSaUTUig
XRP jar: (XRP deposit tag) 103997763 (XRP deposit address) rEb8TK3gBgk5auZkwc6sHnwrGVJH8DuaLh
PS: Do you need a customization or do you need a dev who implements your strategy? send me a private message ;-)

[astropark - Premium] Long-Short Strategy V3This indicator is not holy grail , but it is an amazing trend finder and works nicely between 3m and 1W timeframes :)))
With this indicator you can enjoy its trading signal and backtest the strategy.
In order to check how much you could have been profitable with this script if you started trading from a specific timestamp, please use this nice website to get the integer number representing in seconds the date-time you want to start from: www.unixtimestamp.com
If you want to set alerts on both buy, sell, take profit and stop-loss signals you must use this not-strategy indicator version
HOW TO USE THIS INDICATOR
Buy/Long when you see a green "B" label on the chart at best price you can, you have time till next candle's open price , trying to buy as low as possible near the green cloud or below it. Green cloud acts like a moving support for price, so use it for more buys/longs. The bigger the cloud, the stronger the bull-trend and so the support.
Sell/Short when you see a red "S" label on the chart at best price you can, you have time till next candle's open price , trying to sell as high as possible near the red cloud or over it. Red cloud acts like a moving resistance for price, so use it for more sells/shorts. The bigger the cloud, the stronger the bear-trend and so the resistance.
This indicator suggests some TP (Take Profit) for both longs (in green color) and shorts (in red color): you can start (at least partially!) closing the current trade (eventually you start new longs/shorts at cloud touch if you are a bold trader!).
Keep in mind that the lower the timeframe you work on, the easier is the trend to change rapidly, so always set a -2% / -5% stop-loss on trades and follow the trend with a nice trailing stop strategy.
Of course, as said at the beginning, this indicator suggests some TPs (Take Profits) for both longs (in green color) and shorts (in red color) operations: when you see a TP, you can start (at least partially!) taking profits over the current trade and move stop-loss higher (at least at break-even).
This is a premium indicator , so send me a private message in order to get access to this script.
Do you like my free scripts? Offer me a coffee, a beer, a pizza or whatever :)
BTC jar: 1K5kuYQPEqoNo6GRmJbHWMPmqwKM5S3oRR
ETH jar: 0x091b541a6dd6fe08c4e7bd909baafb2fce9b975e
LTC jar: LSVoAChsZrVsvbNyUfdpxtFpDAUSaUTUig
XRP jar: (XRP deposit tag) 103997763 (XRP deposit address) rEb8TK3gBgk5auZkwc6sHnwrGVJH8DuaLh
PS: Do you need a customization or do you need a dev who implements your strategy? send me a private message ;-)

Buy The Dip - Does It Work?Buying the dip has become a meme in crypto, but does it actually work?
Using this script you can find out.
The dip is defined here as the average true range multiplied by a number of your choosing (dipness input) and subtracted from the low.
When price crosses under the dip level, a long is initiated. The long is then closed using a timestop (default value 20 bars), no fancy exits here.
A general rule for buying the dip should be to be more passive in a bull market and aggressive in a bear market.
Same goes for all counter trend trading.
Heres a few other examples of dip buying statistics using the H4 timeframe:
50% profitable, 1.692 Profit Factor
BINANCE:PIVXBTC
56.52% profitable, 1.254 Profit Factor
BINANCE:KMDBTC
27.27% Profitable, 0.257 Profit Factor... yikes!
BINANCE:BTSBTC
73.33% Profitable, 13.627 Profit Factor... o.O
BINANCE:MANABTC

-- Ultimate Crypto Trading Strategy -- Backtesting version** This is the backtesting (strategy) version of the ~ Ultimate Crypto Trading Strategy ~ script in TradingView. **
~ Ultimate Crypto Trading Strategy ~
֎ Trading system script on @tradingview that brings the easiest approach to trading with a high profitability rate
֎ Optimized for crypto markets, to catch trend movements as soon as possible and maximize profitability
֎ Sell & Buy alerts, Safeguard mode, Take Profits alerts, auto resistance-support and always adding new features!
֎ Customizable settings.
֎ Users Discord community for learning, sharing and direct support
֎ Ultimate Crypto Trading Strategy Tutorial Video: www.youtube.com www.youtube.com
֎ Safeguard feature (match multiple timeframes signals) explained: youtu.be youtu.be
If you’d like to test the trading script in TradingView, I can give you access to a 10 days trial.
Please send me a message in tradingview and I’ll activate it right away.
Thank you!

Megalodon Pro Automated Trader BackTester
Why Megalodon?
We believe that enlightening others is an incredible way to make this world a better place. That's why we created the tools you need to stop worrying about your investments and focus on what really matters in your life.
What is Megalodon?
Megalodon uses Artificial Intelligence that combines 574 back-tested indicators and 2674 back-tested setups, simultaneously.
Megalodon works with any kind of asset , market state and time frame .
What is the win rate?
Megalodon is extremely accurate and offers insane profits as long as the fundamental analysis is done right .
Backtesting results can be found on our social media or down below .
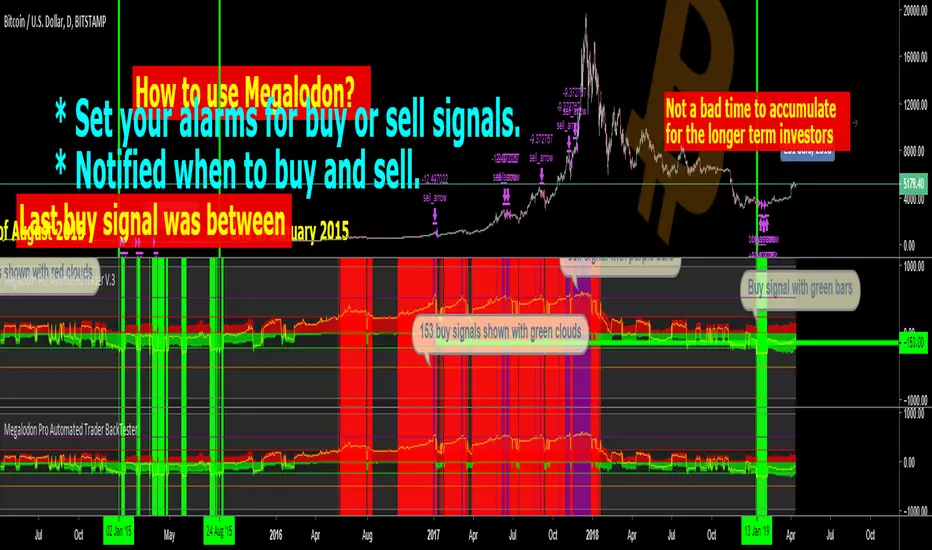
How to use Megalodon Pro Automated Trader?
Simply, orange rectangles are buy signals and purple rectangles are sell signals .
Green clouds show buy signals and red clouds show sell signals.
Yellow line shows the difference between buy and sell counts.
How to set alarms on Megalodon Pro Automated Trader?
Click on Alert, select Megalodon Pro Automated Trader and click on Buy-Signal or Sell-Signal. More details can be found on our social media.
You may also watch our Megalodon Investing Tutorials on Youtube for more information.
How to purchase?
Megalodon is totally FREE .
You may upgrade to Megalodon Pro for the most important features , including automizing your trading on any asset profitably, setting up alarms to get notified , joining to our VIP telegram channel to get daily updates and our VIP telegram group to interact with the community. Simply go to our website on our TradingView page for learning more and joining us for free.
Some of the backtesting results are:
BTC/USD for longer time frame trading in the bear market for the last year.
APPLE for longer time frame trading in the bull market for the last 10 years.
EURO/USD for day trading in the neutral market for the last month.
BTC/USD for day trading in the bull market for the last 15 days.
APPLE for day trading in the neutral market for the last 2 days and 6 hours.
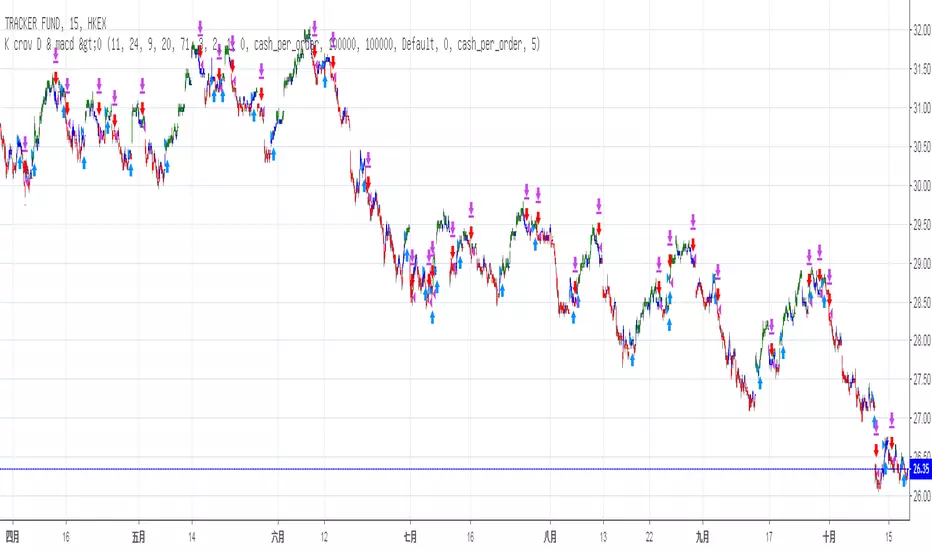
Stochastic & MACD Strategy Ver 1.0This strategy is inspired by ChartArt and jasonluk28.
The following input changes from the initial ChartArt version to achieve higher stability and profit:
Fast MA Len:11
Slow MA len: 24
Stoch Len: 20
No difference is found in minor changes (+-10) lv. of overbought/oversold
It works above 40% winning rate in Heng Heng Index, Shanghai Composite, Dow Jones Industrial Averge, S&P 500 NASDAQ, VT (World Total Market) and in 15 mins chart
Profit: above ~10 to 30% in less than 1year backtest for most major indice of China and US and ~62% in Heng Seng Index (Hong Kong) & 40.5% in SZSE Composite (Shen Zhen)
P.S. Profit: 700 (Tencent) +150.5%, 939 (CCB) +66.5%, 1299 (AIA) +45%, 2628 (CLIC) +41%, 1 (CK Hutchison) +31%
NFLX +82.5%, BABA +55.5%, AMZN +44%, GOOG +38%, MCD +24.5%
However, Loss in FB -19% , AMD -38.5%
Not suitable for stocks with great influences in News or Events ???
TEMA Strategy 1 (Updated)This is just a test strategy using TEMA ( Triple Exponential Moving Average ).
Test Detail
Symbol: BTCUSD
Interval: 1H
Initial Capital: $1000
Investment: 100% Equity
Results (on BTCUSD -2.31% - Bitfinex)
I had to chunk the months because of the order limit (1000)
(all months start at 1st, 00:00 AND finish at last date, 23:59 )
Timeframe: 2017 August - 2017 Nov
Profit: 21.9%
Max Drawdown: 83.94%
Timeframe: 2017 Dec - 2018 Feb
Profit: 446.32%
Max Drawdown: 46.54%
Timeframe: 2018 Mar - 2018 Jul
Profit: 288.87%
Max Drawdown: 51.49%
To fix:
Too many orders, potentially reduce order counts by increasing max loss (100~200 orders/month) \u2028
High Max Drawdown, need to fix that
Looks like orders are created and terminated very quickly, need to look into that
Still figuring things out

PPSignal MTFSystem Algorithm Ppsignal Versin MTF. based on historical price probabilities . We recommend use financial stock, bond, crypts, indices, futures and Forex market ( GBPUSD -0.09% , EURUSD -0.02% , USDJPY 0.28% , USDCAD 0.09% , AUDUSD -0.02% , USOIL -0.05% , XAUUSD -0.06% , SOYUSD -1.22% , DXY 0.07% , SPY 0.12% , SP1! 0.40% , bitcoin -0.02% ) with defined trends above 50 or 100 and 200 simple moving averages idem if you want trade downtrend financial assets.
Use projections and retracements Fibonacci, MACD and RSI or Stoch oscillator and figures charters Head and shoulder, triangles and double bottom , double top , etc.
This system will notify you of the probability of success. The profit will be defined for yourself and according to your investor profile.
There are stocks and other assets with high returns but the system does not know exactly. Check in the Strategy tester section and then net profit.
We have other tools that support to PPsignal system, we will publish them shortly.
Define system parameters
As it is a system that is based on past data we recommend using the most historical data weekly (W) but you an use day historical data or 3 o 2 hs.
Candle color: you can choose if you want a trend color for candles or not, in the chart propieties menu detach the border option.
PPsignal it's a very simple system with which you will have a great support when it is a good time for enter in the marker and out.
we await your comments.
With this new version you can change the period and time and find a better percent profitable.
Eng. Oscar Alejandro Peruchena
Quants Mathematical and Market Analyst

RSI Buy/sell signal with TP_SL_TL_15min by rajistaRSI Buy/sell signal with TakeProfit_Stop loss_Trailing_SL script -can be used on any altcoin/btc pair on the 15min chart .
This script can be used for backtesting pupose and also to give buy/sell signals based on the settings provided by you.
Benefits of the script:
1> Fully customizable script according to your trade setups.
2> The script incorporates Take-profit, Stop-loss & Trailing SL.
3> Cuts your losses significantly, in comparision to a script without TP, SL & TL strategies.
4> Based on RSI Overbought/Oversold levels, which can also be customizable.
5> Doesn't take too many trades in a day, thereby decreasing commission paid to exchanges & hence enhances the overall profit.
Here's how, you can fully customize the script, according to your strategy, once you have been provided access:
( To gain access to the script just hit the like/comment in the #tradingview published article & i'll grant access based on your tradingview userid )
You can add this script to your charts in 15min timeframe, like adding any other simple indicator.
Once you have added the script, just hit the settings button to fully customize the script according to your strategy and plan, that you have, for your trade setup.
Take profit, Stop loss, Trailing Stop loss values can be entered in satoshis from the setting panel.
RSI Overbought & Oversold values can also be entered according to your trading setup.
Like in below example , i have put the following values as default
Test date is set as 1 May 2018
Take profit=1000, stop loss=5, Trailing SL=40
RSI Overbought=70, Oversold=20
" Above mentioned values are default values and may not be profitable in every condition, you have to backtest the strategy by changing these values and then see the results of given values under the Strategy tester tab- located at bottom of your #tradingview chart. "
Lets see how the scipt is able to make these awesome gains:
Suppose your script enters a trade(buys Verge) when #Verge is at 800sats
Then the bot will close the trade(sell Verge) when either of these things happen:
a> Verge surges to 1800 sats, then the script will close trade by Taking profit
b>Verge increases to 850 only, but the RSI value in 15min chart has gone above 70 (Overbought-default value) then scipt will close trade.
c>Verge decreases to 995 sats, then script will close trade by Stop loss hit.
d>Verge surges to 840 but then again drops slightly to 835, script will again close trade by Trailing SL hit.
Initial capital is set to 10 btc
Make sure to check the performance summary tab below and overview of the script running on #XVGBTC since 1 May 2018-Till date
Profit -11.6% while running script
Where Buy and hold return for verge in the same period is:
- to get an instant notification, once i publish a script or a trading analysis/trade-setup , which will always be available for free for everyone!!!

Can you cheat a back test? Things to look out for...I have seen a lot of people selling strategies for large amounts of money. But please be careful. In this I am going to show a strategy that says it makes 9 trillion % profit and is 100% of the time profitable.
If someone was trying to sell you this, alarm bells should be ringing. I have managed to get very good results without cheating, as you can see in all our other strategies where the figures you see are real.
How to cheat a back test
You can not really cheat it, but if you play around with the figures you can drastically improve the results.
First you need to get a good strategy with over 95% time profitable and a good net profit (this is the hard part)
Then simply click on the gear icon of that strategy, go to the property tab, set initial capital to 1000 and increase the order size to 10000000000000000.
Its that simple
Most strategies work on either 1000 or 10,000 initial capital. Its the order size that should be 1 to get more realistic results.
All our other strategies use 1000 for initial capital and 1 for order size.
Please note when back testing you should always enter the commission of that exchange, I like to use 0.3%.
Hope this helps, please let me know your thoughts.
If you would like to be kept up to date please FOLLOW us and try our indicators and strategies here: uk.tradingview.com
If you like it please click the LIKE button.

XPloRR MA-Buy ATR-Trailing-Stop Long Term Strategy Beating B&HXPloRR MA-Buy ATR-MA-Trailing-Stop Strategy
Long term MA Trailing Stop strategy to beat Buy&Hold strategy
None of the strategies that I tested can beat the long term Buy&Hold strategy. That's the reason why I wrote this strategy.
Purpose: beat Buy&Hold strategy with around 10 trades. 100% capitalize sold trade into new trade.
My buy strategy is triggered by the EMA(blue) crossing over the SMA curve(orange).
My sell strategy is triggered by another EMA(lime) of the close value crossing the trailing stop(green) value.
The trailing stop value(green) is set to a multiple of the ATR(15) value.
ATR(15) is the SMA(15) value of the difference between high and low values.
Every stock has it's own "DNA", so first thing to do is find the right parameters to get the best strategy values voor EMA, SMA and Trailing Stop.
Then keep using these parameter for future buy/sell signals only for that particular stock.
Do the same for other stocks.
Here are the parameters:
Exponential MA: buy trigger when crossing over the SMA value (use values between 11-50)
Simple MA: buy trigger when EMA crosses over the SMA value (use values between 20 and 200)
Stop EMA: sell trigger when Stop EMA of close value crosses under the trailing stop value (use values between 8 and 16)
Trailing Stop #ATR: defines the trailing stop value as a multiple of the ATR(15) value
Example parameters for different stocks (Start capital: 1000, Order=100% of equity, Period 1/1/2005 to now):
BAR(Barco): EMA=11, SMA=82, StopEMA=12, Stop#ATR=9
Buy&HoldProfit: 45.82%, NetProfit: 294.7%, #Trades:8, %Profit:62.5%, ProfitFactor: 12.539
AAPL(Apple): EMA=12, SMA=45, StopEMA=12, Stop#ATR=6
Buy&HoldProfit: 2925.86%, NetProfit: 4035.92%, #Trades:10, %Profit:60%, ProfitFactor: 6.36
BEKB(Bekaert): EMA=12, SMA=42, StopEMA=12, Stop#ATR=7
Buy&HoldProfit: 81.11%, NetProfit: 521.37%, #Trades:10, %Profit:60%, ProfitFactor: 2.617
SOLB(Solvay): EMA=12, SMA=63, StopEMA=11, Stop#ATR=8
Buy&HoldProfit: 43.61%, NetProfit: 151.4%, #Trades:8, %Profit:75%, ProfitFactor: 3.794
PHIA(Philips): EMA=11, SMA=80, StopEMA=8, Stop#ATR=10
Buy&HoldProfit: 56.79%, NetProfit: 198.46%, #Trades:6, %Profit:83.33%, ProfitFactor: 23.07
I am very curious to see the parameters for your stocks and please make suggestions to improve this strategy.

Aurum15 - http://tvautotrader.comAurum15 - tvautotrader.com
Initial version of strategy, basing on market condition and price movement according to MA's, closing on RSI overbought value.
Exit position are configurable by RSI (default rsi(open,29) > 70), designed for 15 minutes charts
It creates very long trades (above 300 bars per trade) but is very profitable.
Tested at:
USOIL - 66% profitable, 15 trades since 2017-09-04
LTCUSD - 75% profitable, 20 trades since 2017-10-02
XRPUSD - 87.5% profitable, 8 trades since 2017-10-02
IOTUSD - 77% profitable, 9 trades since 2017-10-02
This strat is not for sale yet, I need to make futher tests in more sideways market.

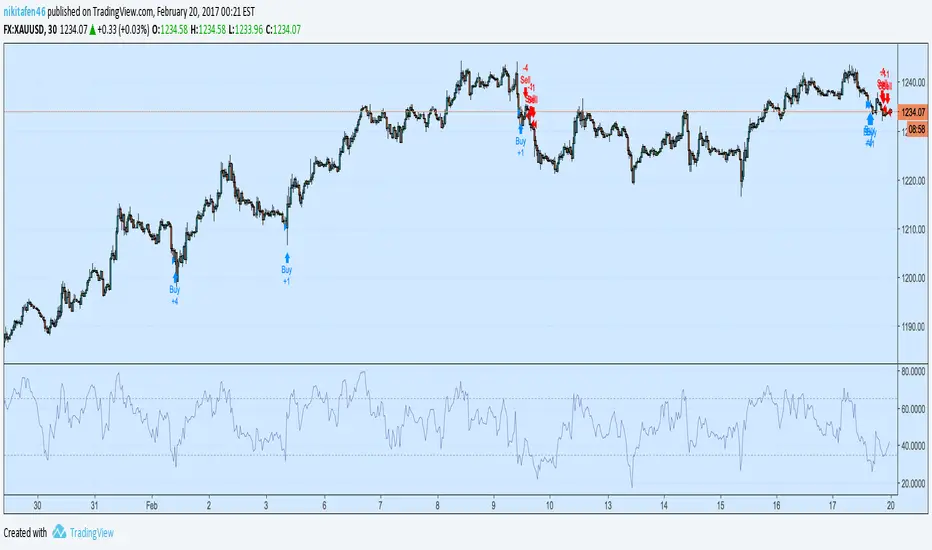
Upgraded XAUUSD 30m only Strategy V2.0So i've been fiddling around with this once more
The result is increased net profit, same time frame as previous strategy, more drawdown, but that comes with the net profit.
1 pip = 1$
Pyramiding of 3 orders.
Commission included.
More trades
Profitability rate is about the same.
Gold/Silver 30m Only Strategy Buy/Sell SignalsIn my free time I felt like coding this strategy, and after backtesting it, it appears that the 30m time frame is the most profitable.
I only have been working on it for gold, but it should work similarly for silver as well.
This includes no pyramiding, and with pyramiding orders of 5, this strategy is upwards of 100% profitable.
Buy order - when price is above the 162 day EMA and RSI is less than 35
Sell order - when price is below the 162 day EMA and RSI is greater than 65
I will probably be adjusting it to increase the profitability and %success rate.

MACDouble + RSI (rec. 15min-2hr intrv) Uses two sets of MACD plus an RSI to either long or short. All three indicators trigger buy/sell as one (ie it's not 'IF MACD1 OR MACD2 OR RSI > 1 = buy", its more like "IF 1 AND 2 AND RSI=buy", all 3 match required for trigger)
The MACD inputs should be tweaked depending on timeframe and what you are trading. If you are doing 1, 3, 5 min or real frequent trading then 21/44/20 and 32/66/29 or other high value MACDs should be considered. If you are doing longer intervals like 2, 3, 4hr then consider 9/19/9 and 21/44/20 for MACDs (experiment! I picked these example #s randomly).
Ideal usage for the MACD sets is to have MACD2 inputs at around 1.5x, 2x, or 3x MACD1's inputs.
Other settings to consider: try having fastlength1=macdlength1 and then (fastlength2 = macdlength2 - 2). Like 10/26/10 and 23/48/20. This seems to increase net profit since it is more likely to trigger before major price moves, but may decrease profitable trade %. Conversely, consider FL1=MCDL1 and FL2 = MCDL2 + (FL2 * 0.5). Example: 10/26/10 and 22/48/30 this can increase profitable trade %, though may cost some net profit.
Feel free to message me with suggestions or questions.

MACD, backtest 2015+ only, cut in half and doubledThis is only a slight modification to the existing "MACD Strategy" strategy plugin!
found the default MACD strategy to be lacking, although impressive for its simplicity. I added "year>2014" to the IF buy/sell conditions so it will only backtest from 2015 and beyond ** .
I also had a problem with the standard MACD trading late, per se. To that end I modified the inputs for fast/slow/signal to double. Example: my defaults are 10, 21, 10 so I put 20, 42, 20 in. This has the effect of making a 30min interval the same as 1 hour at 10,21,10. So if you want to backtest at 4hr, you would set your time interval to 2hr on the main chart. This is a handy way to make shorter time periods more useful even regardless of strategy/testing, since you can view 15min with alot less noise but a better response.
Used on BTCCNY OKcoin, with the chart set at 45 min (so really 90min in the strategy) this gave me a percent profitable of 42% and a profit factor of 1.998 on 189 trades.
Personally, I like to set the length/signals to 30,63,30. Meaning you need to triple the time, it allows for much better use of shorter time periods and the backtests are remarkably profitable. (i.e. 15min chart view = 45min on script, 30min= 1.5hr on script)
** If you want more specific time periods you need to try plugging in different bar values: replace "year" with "n" and "2014" with "5500". The bars are based on unix time I believe so you will need to play around with the number for n, with n being the numbers of bars.

Outsidebar vs Insidebar, Illusion Strategy (by ChartArt)WARNING: This strategy does not work! Please don't trade with this strategy
I'm sharing this strategy for the following three educational reasons:
1. You can easily find 100% strategies, but if they only seem to work 100% on one asset, they actually don't work at all. Therefore never backtest your strategy only on one asset, especially forward testing is useless, because it tends to repeat the old patterns. Your strategy has to work on as many different assets as possible.
2. The pyramiding of orders can have an impact on the strategy. In this case if you manually change the strategy settings by increasing it from 1 to 100 pyramiding orders changes the percent profitable on "UKOIL" monthly from 100% to 90% profitable. On other assets you can see very different results. Allowing much more pyramiding orders in this case results in opening orders where the background color highlights appear.
3. The Tradingview backtest beta version currently does not close the last open trade during the backtest. In this case going long on "UKOIL" near the top in 2011 as this strategy did would result in a big loss in 2015. But since the trade is still open and not canceled out by a new short order it still appears as if this strategy works 100% profitable. Which it doesn't.

ISM Indicator As a Strategy Here's a very easy code, plotting the ISM against the SPX. In this exercise, i wanted to see if one could use the ISM indicator only to generate buy/sell signal, and what would be the performance.
What is the ISM
The ISM Manufacturing Index monitors employment, production inventories, new orders and supplier deliveries.By monitoring the ISM Manufacturing Index, investors are able to better understand national economic conditions. When this index is increasing, investors can assume that the stock markets should increase because of higher corporate profits. The opposite can be thought of the bond markets, which may decrease as the ISM Manufacturing Index increases because of sensitivity to potential inflation.
Buy/Sell Signal
ISM above 50 usually good economic condition and vice versa when below 50 . For this code I used 48.50 as my buy/sell signal line.
Results
To test this on a longer time period, I use the SPX index instead of SPY. The results are surprisingly good. 76.92% profitability with 3.03 profit factor.
Conclusion
Investors could use the ISM with other indicators to determine better entry and exit point. I will see if combining the ISM with other custom indicators , could generate better result. Feel free to share your results here.
Cheers
Algo.

MACD + SMA 200 Strategy (by ChartArt)Here is a combination of the classic MACD (moving average convergence divergence indicator) with the classic slow moving average SMA with period 200 together as a strategy.
This strategy goes long if the MACD histogram and the MACD momentum are both above zero and the fast MACD moving average is above the slow MACD moving average. As additional long filter the recent price has to be above the SMA 200. If the inverse logic is true, the strategy goes short. For the worst case there is a max intraday equity loss of 50% filter.
Save another $999 bucks with my free strategy.
This strategy works in the backtest on the daily chart of Bitcoin, as well as on the S&P 500 and the Dow Jones Industrial Average daily charts. Current performance as of November 30, 2015 on the SPX500 CFD daily is percent profitable: 68% since the year 1970 with a profit factor of 6.4. Current performance as of November 30, 2015 on the DOWI index daily is percent profitable: 51% since the year 1915 with a profit factor of 10.8.
All trading involves high risk; past performance is not necessarily indicative of future results. Hypothetical or simulated performance results have certain inherent limitations. Unlike an actual performance record, simulated results do not represent actual trading. Also, since the trades have not actually been executed, the results may have under- or over-compensated for the impact, if any, of certain market factors, such as lack of liquidity. Simulated trading programs in general are also subject to the fact that they are designed with the benefit of hindsight. No representation is being made that any account will or is likely to achieve profits or losses similar to those shown.
