AI x Meme Impulse Tracker [QuantraSystems]AI x Meme Impulse Tracker
Quantra Systems guarantees that the information created and published within this document and on the Tradingview platform is fully compliant with applicable regulations, does not constitute investment advice, and is not exclusively intended for qualified investors.
Important Note!
The system equity curve presented here has been generated as part of the process of testing and verifying the methodology behind this script.
Crucially, it was developed after the system was conceptualized, designed, and created, which helps to mitigate the risk of overfitting to historical data. In other words, the system was built for robustness, not for simply optimizing past performance.
This ensures that the system is less likely to degrade in performance over time, compared to hyper-optimized systems that are tailored to past data. No tweaks or optimizations were made to this system post-backtest.
Even More Important Note!!
The nature of markets is that they change quickly and unpredictably. Past performance does not guarantee future results - this is a fundamental rule in trading and investing.
While this system is designed with broad, flexible conditions to adapt quickly to a range of market environments, it is essential to understand that no assumptions should be made about future returns based on historical data. Markets are inherently uncertain, and this system - like all trading systems - cannot predict future outcomes.
Introduction
The AI x Meme Impulse Tracker is a cutting-edge, fast-acting rotational algorithm designed to capitalize on the strength of assets within pre-selected categories. Using a custom function built on top of the RSI Pulsar, the system measures momentum through impulses rather than traditional trend following methods. This allows for swifter reallocations based on short bursts of strength.
This system focuses on precision and agility - making it highly adaptable in volatile markets. The strategy is built around three independent asset categories - with allocations only made to the strongest asset in each - ensuring that capital movement (in particular between blockchains) is kept to a minimum for efficiency purposes while maintaining exposure to the highest performing tokens.
Legend
Token Inputs:
The Impulse Tracker is designed with dynamic asset selection - allowing traders to customize the inputs for each category. This feature enables flexible system management, as the number of active tokens within each category can be adjusted at any time. Whether the user chooses the default of 13 tokens per category, or fewer, the system will automatically recalibrate. This ensures that all calculations, from relative strength to individual performance assessments, adjust as required. Disabled tokens are treated by the system as if they don’t exist - seamlessly updating performance metrics and the Impulse Tracker’s allocation behavior to maintain the highest level of efficiency and accuracy.
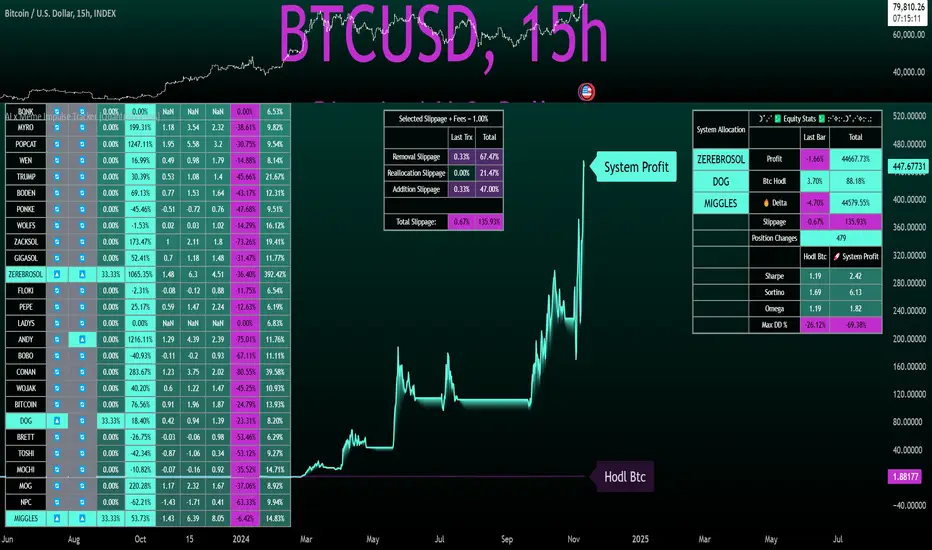
System Equity Curve:
The Impulse Tracker plots both the rotational system’s equity and the Buy-and-Hold (or ‘HODL’) benchmark of Bitcoin for comparison. While the HODL approach allocates the entire portfolio to Bitcoin and functions as an index to compare to, the Impulse Tracker dynamically allocates based on strength impulses within the chosen tokens and categories. The system equity curve is representative of adding an equal capital split between the strongest assets of each category. The relative strength system does handle ‘ties’ of strength - in this situation multiple tokens from a single category can be included in the final equity curve, with the allocated weight to that category split between the tied assets.
TABLES:
Equity Stats:
This table is held in Quantra System's typical UI design language. It offers a comprehensive snapshot of the system’s performance, with key metrics organized to help traders quickly assess both short-term and cumulative results. The left side provides details on individual asset performance, while the right side presents a comparison of the system’s risk-adjusted metrics against a simple BTC Hodl strategy.
The leftmost column of the Equity Stats table showcases performance indicators for the system’s current allocations. This provides quick identification of the current strongest tokens, based on confirmed and non-repainting data as soon as the current opens and the last bar closes.
The right-hand side compares the performance differences between the system and Hodl profits, both on a cumulative basis and analyzing only the previous bar. The total number of position changes is also tracked in this table - an important metric when calculating total slippage and should be used to determine how ‘hands-on’ the strategy will be on the current timeframe.
The lower part of the table highlights a direct comparison of the AI x Memes Impulse strategy with buy-and-hold Bitcoin. The risk adjusted performance ratios, Sharpe, Sortino and Omega, are shown side by side, as well as the maximum drawdown experienced by both strategies within the set testing window.
Screener Table:
This table provides a detailed breakdown of the performance for each asset that has been the strongest in its category at some point and thus received an allocation. The table tracks several key metrics for each asset - including returns, volatility, Sharpe ratio, Sortino ratio, Omega ratio, and maximum drawdown. It also displays the signals for both current and previous periods, as well as the assets weight in the theoretical portfolio. Assets that have never received a signal are also included, giving traders an overview of which assets have contributed to the portfolio's performance and which have not played a role so far.
The position changes cell also offers important insights, as it shows the frequency of not just total position changes, but also rebalancing events.
Detailed Slippage Table:
The Detailed Slippage Table provides a comprehensive breakdown of the calculated slippage and fees incurred throughout the strategy’s operations. It contains several key metrics that give traders a granular view of the costs associated with executing the system:
Selected Slippage - Displays the current slippage rate, as defined in the input menu.
Removal Slippage - This accounts for any slippage or fees incurred when removing an allocation from a token.
Reallocation Slippage - Tracks the slippage or fees when reallocating capital to existing positions.
Addition Slippage - Measures the slippage or fees incurred when allocating capital to new tokens.
Final Slippage - Is the sum of all the individual slippage points and provides a quick view of the total slippage accounted for by the system.
The table is also divided into two columns:
Last Transaction Slippage + Fees - Displays any slippage or fees incurred based on position changes within the current bar.
Total Slippage + Fees - Shows the cumulative slippage and fees incurred since the portfolio’s selected start date.
Visual Customization:
Several customizable features are included within the input menu to enhance user experience. These include custom color palettes, both preloaded and user-selectable. This allows traders to personalize the visual appearance of the tables, ensuring clarity and consistency with their preferred interface themes and background coloring.
Additionally, users can adjust both the position and sizes of all the tables - enabling complete tailoring to the trader’s layout and specific viewing preferences and screen configurations. This level of customization ensures a more intuitive and flexible interaction with the system’s data.
Core Features and Methodologies
Advanced Risk Management - A Unique Filtering Approach:
The Equity Curve Activation Filter introduces an innovative way to dynamically manage capital allocation, aligning with periods of market trend strength. This filter is rooted in the understanding that markets move cyclically - altering between periods trending and mean-reverting periods. This cycle is especially pronounced in the crypto markets, where strong uptrends are often followed by prolonged periods of sideways movements or corrections as participants take profits and momentum fades.
The Cyclical Nature of Markets and Trend Following:
Financial markets do not trend indefinitely. Each uptrend or downtrend, whether over high and low timeframes, tends to culminate in a phase where momentum exhausts - leading to the sideways or corrective phases. This cycle results from the natural dynamics of market participants: during extended trends, more participants jump in, riding the momentum until profit taking causes the trend to slow down or reverse. This cyclical behavior occurs across all timeframes and in all markets - making it essential to adapt trading strategies in attempt to minimize losses during less favorable conditions.
In a trend following system, profitability often mirrors this cyclical pattern. Trend following strategies thrive when markets are moving directionally, capturing gains as price moves with strength in a single direction. However in phases where the market chops sideways, trend following strategies will usually experience drawdowns and reduced returns due to the impersistent nature of any trends. This fluctuation in trend following profitability can actually serve as one of the best coincident indicators of broader market regime change - when profitability begins to fade, it often signals a transition to drawn out unfavorable trend trading conditions.
The Equity Curve as a Market Signal
Within the Impulse Tracker, a continuous equity curve is calculated based upon the system's allocation to the strongest tokens. This equity curve effectively tracks the system’s performance under all market conditions. However, instead of solely relying on the direct performance of the selected tokens, the system applies additional filters to analyze the trend strength of this equity curve itself.
In the same way you only want to purchase an asset that is moving up in price, you only want to allocate capital to a strategy whose equity curve is trending upwards!
The Equity Curve Activation Filter consistently monitors the trend of this equity curve through various filter indicators, such as the “Wave Pendulum Trend”, the “Quasar QSM” and the “MAQSM” (an aggregate of multiple types of averages). These filters help determine whether the equity curve is trending upwards, signaling a favorable period for trend following. When the equity curve is in a positive trend, capital is allocated to the system as normal - allowing it to capture gains during favorable market conditions, Conversely, when the trend weakens and the equity curves begins to stagnate or decline, the activation filter shifts the system into a “cash” positions - temporarily halting allocations in order to prevent market exposure during choppy or mean reverting phases.
Timing Allocation With Market Conditions
This unique filtering approach ensures that the system is primarily active during periods when market trends are most supportive. By aligning capital allocations with the uptrend in trend following profitability, the system is designed to enter during periods of strong momentum and move to cash when momentum with the equity curve wanes. This approach reduces the risk of overtrading in less favorable conditions and preserves capital for the next favorable trend.
In essence the Equity Curve Allocation Filter serves as a dynamic risk management layer that leverages the cyclicality of trend following profitability in order to navigate shifting market phases.
Sensitivity and Signal Responsiveness:
The Quasar Sensitivity Setting allows users to fine-tune the system’s responsiveness to asset signals. High sensitivity settings lead to quicker position changes, making the system highly reactive to short term strength impulses. This is especially useful in fast moving markets where token strength can shift rapidly. The Sensitive setting might be more applicable to higher volatility or lower market cap assets - as the increased volatility increases the necessity of faster position cutting in order to front run the crowd. Of course - a balanced approach is ideal, as if the signals are too fast there will be too many whips and false signals. (And extra fees + slippage!)
The benefit of this script is because of the advanced slippage calculations, false signals are sufficiently punished (unlike systems without fees or slippage) - so it will become immediately apparent if the false signals have a significantly detrimental impact on the system’s equity curve.
Asset specific signals within each category are re-evaluated after the close of each bar to ensure that capital is always allocated to the highest performing asset. If a token’s momentum begins to fade the system swiftly reallocates to the next strongest asset within that category.
Category Filter - Allocates only to the Strongest Asset per group
One of the core innovations of the AI x Meme Impulse Tracker is the customizable Category Filter, which ensures that only the strongest-performing asset within each predefined group receives capital allocation. This approach not only increases the precision of asset selection but also allows traders to tailor the system to specific token narratives or categories. Sectors can include trending themes such as high-attention meme tokens, AI-driven tokens, or even categorize assets by blockchain ecosystems like Ethereum, Solana, or Base chain. This flexibility enables users to align their strategies with the latest market narratives or to optimize for specific groups, focusing on high-beta tokens within well defined sectors for a more targeted exposure. By keeping the focus on category leaders, the system avoids diluting its impact across underperforming assets, thereby maximizing capital efficiency and reducing unnecessary trading costs.
Dynamic Asset Reallocation:
Dynamic reallocation ensures that the system remains nimble and adapts to changing market conditions. Unlike slower systems, the Quasar method continually monitors for changes in asset strength and reallocates capital accordingly - ensuring that the system is always positioned in the highest performing assets within each category.
Position Changes and Slippage:
The Impulse Tracker places a strong emphasis on realistic simulation, prioritizing accuracy over inflated backtest results. This approach ensures that slippage is accounted for in a more aggressive manner than what may be experienced in real-world execution.
Each position change within the system - whether it’s buying, selling, reallocating, or rebalancing between assets - incurs slippage. Slippage is applied to both ends of every transaction: when a position is entered and exited, and when reallocating capital from one token to another. This dynamic behavior is further enhanced by a customizable slippage/fees input, allowing users to simulate realistic transaction costs based on their own market conditions and execution behaviors.
The slippage model works by applying a weighted slippage to the equity curve, taking into account the actual amount of capital being moved. Slippage is not applied in a blanket manner but rather in proportion to the allocation changes. For example, if the system reallocates from a single 100% position to two 50% allocations, slippage will be applied to the 50% removed from the first asset and the 50% added to the new asset, resulting in a 1x slippage multiplier.
This process becomes more granular when multiple assets are involved. For instance, if reallocating from two 50% positions to three 33% positions, slippage will be incurred on each of the changes, but at a reduced rate (⅔ x slippage), reflecting the smaller percentage of portfolio equity being moved. The slippage model accounts for all types of allocation shifts, whether increasing or decreasing the number of tokens held, providing a realistic assessment of system costs.
Here are some detailed examples to illustrate how slippage is calculated based on different scenarios:
100% → 50% / 50%: 1x slippage applied to both position changes (2 allocation changes).
50% / 50% → 33% / 33% / 33%: ⅔ x slippage multiplier applied across 3 allocation changes.
33% / 33% / 33% → 100%: 4/3 x slippage multiplier applied across 3 allocation changes.
In practice, not every position change will be rebalanced perfectly, leading to a lower number of transactions and lower costs in practice. Additionally, with the use of limit orders, a trader can easily reduce the costs of entering a position, as well as ensuring a competitive entry price.
By simulating slippage in this granular manner, the system captures the absolute maximum level of fees and slippage, in order to ensure that backtest results lean towards an underrepresentation - opposed to inflated results compared with practical execution.
A Special Note on Slippage
In the image above, the system has been applied to four different timeframes - 20h, 15h, 10h, and 5h - using identical settings and a selected slippage amount of 2%. By isolating a recent trend leg, we can illustrate an important concept: while the 15h timeframe is more profitable than the 20h timeframe, this difference stems from a core trading principle. Lower timeframes typically provide more data points and allow for quicker entries and exits in a robust system. This often results in reduced downside and compounding of gains.
However, slippage, fees, and execution constraints are limiting factors, especially in volatile, low-cap cryptocurrencies. Although lower timeframes can improve performance by increasing trade frequency, each trade incurs heavy slippage costs that accumulate - impacting the portfolio’s capital at a compounding rate. In this example, the chosen slippage rate of 2% per trade is designed to reflect the realistic trading costs, emphasizing how lower timeframe trading comes at the cost of increased slippage and fees
Finding the optimal balance between timeframe and slippage impact requires careful consideration of factors such as portfolio size, liquidity of selected tokens, execution speed, and the fee rate of the exchange you execute trades on.
Equity Curve and Performance Calculations
To provide a benchmark, the script also generates a Buy-and-Hold (or "HODL") equity curve that represents a complete allocation to Bitcoin. This allows users to easily compare the performance of the dynamic rotation system with that more traditional benchmark strategy.
The script tracks key performance metrics for both the dynamic portfolio and the HODL strategy, including:
Sharpe Ratio
The Sharpe Ratio is a key metric that evaluates a portfolio’s risk-adjusted return by comparing its ‘excess’ return to its volatility. Traditionally, the Sharpe Ratio measures returns relative to a risk-free rate. However, in our system’s calculation, we omit the risk-free rate and instead measure returns above a benchmark of 0%. This adjustment provides a more universal comparison, especially in the context of highly volatile assets like cryptocurrencies, where a traditional risk-free benchmark, such as the usual 3-month T-bills, is often irrelevant or too distant from the realities of the crypto market.
By using 0% as the baseline, we focus purely on the strategy's ability to generate raw returns in the face of market risk, which makes it easier to compare performance across different strategies or asset classes. In an environment like cryptocurrency, where volatility can be extreme, the importance of relative return against a highly volatile backdrop outweighs comparisons to a risk-free rate that bears little resemblance to the risk profile of digital assets.
Sortino Ratio
The Sortino Ratio improves upon the Sharpe Ratio by specifically targeting downside risk and leaves the upside potential untouched. In contrast to the Sharpe Ratio (which penalizes both upside and downside volatility), the Sortino Ratio focuses only on negative return deviations. This makes it a more suitable metric for evaluating strategies like the AI x Meme Impulse Tracker - that aim to minimize drawdowns without restricting upside capture. By measuring returns relative to a 0% baseline, the Sortino ratio provides a clearer assessment of how well the system generates gains while avoiding substantial losses in highly volatile markets like crypto.
Omega Ratio
The Omega Ratio is calculated as the ratio of gains to losses across all return thresholds, providing a more complete view of how the system balances upside and downside risk even compared to the Sortino Ratio. While it achieves a similar outcome to the Sortino Ratio by emphasizing the system's ability to capture gains while limiting losses, it is technically a mathematically superior method. However, we include both the Omega and Sortino ratios in our metric table, as the Sortino Ratio remains more widely recognized and commonly understood by traders and investors of all levels.
Usage Summary:
While the backtests in this description are generated as if a trader held a portfolio of just the strongest tokens, this was mainly designed as a method of logical verification and not a recommended investment strategy. In practice, this system can be used in multiple ways.
It can be used as above, or as a factor in forming part of a broader asset selection system, or even a method of filtering tokens by strength in order to inform a day trader which tokens might be optimal to look for long-only trading setups on an intrabar timeframe.
Final Summary:
The AI x Meme Impulse Tracker is a powerful algorithm that leverages a unique strength and impulse based approach to asset allocation within high beta token categories. Built with a robust risk management framework, the system’s Equity Curve Activation Filter dynamically manages capital exposure based on the cyclical nature of market trends, minimizing exposure during weaker phases.
With highly customizable settings, the Impulse Tracker enables precise capital allocation to only the strongest assets, informed by real-time metrics and rigorous slippage modeling in order to provide the best view of historical profitability. This adaptable design, coupled with advanced performance analytics, makes it a versatile tool for traders seeking an edge in fast moving and volatile crypto markets.
"profit" için komut dosyalarını ara
GKD-BT Optimizer SCSC Backtest [Loxx]The Giga Kaleidoscope GKD-BT Optimizer SCSC Backtest (Solo Confirmation Super Complex) is a Backtest module included in AlgxTrading's "Giga Kaleidoscope Modularized Trading System." (see the section Giga Kaleidoscope (GKD) Modularized Trading System below for an explanation of the GKD trading system)
**the backtest data rendered to the chart above and all screenshots below use $5 commission per trade and 10% equity per trade with $1 million initial capital**
█ GKD-BT Optimizer SCSC Backtest
The GKD-BT Optimizer SCSC Backtest is a comprehensive backtesting module designed to optimize the combination of key GKD indicators within AlgxTrading's "Giga Kaleidoscope Modularized Trading System." This module facilitates precise strategy refinement by allowing traders to configure and optimize the following critical GKD indicators:
GKD-B Baseline
GKD-V Volatility/Volume
GKD-C Confirmation 1
GKD-C Continuation
Each indicator is equipped with an "Optimizer" mode, enabling dynamic feedback and iterative improvements directly into the backtesting environment. This integrated approach ensures that each component contributes effectively to the overall strategy, providing a robust framework for achieving optimized trading outcomes.
The GKD-BT Optimizer supports granular test configurations including a single take profit and stop loss setting, and allows for targeted testing within specified date ranges to simulate forward testing with historical data. This feature is essential for evaluating the resilience and effectiveness of trading strategies under various market conditions.
Furthermore, the module is designed with user-centric features such as:
Customizable Trading Panel: Displays critical backtest results and trade statistics, which can be shown or hidden as per user preference.
Highlighting Thresholds: Users can set thresholds for Total Percent Wins, Percent Profitable, and Profit Factor, which helps in quickly identifying the most relevant metrics for analysis.
The detailed setup ensures that traders can not only adjust their strategies based on historical performance but also fine-tune their approach to meet specific trading objectives.
🔶 To configure this indicator: ***all GKD indicators listed below are all included in the AlgxTrading trading system package***
1. Add GKD-C Confirmation, GKD-B Baseline, GKD-V Volatility/Volume, and GKD-C Continuation to your chart
2. In the GKD-B Baseline indicator, change "Baseline Type" to "Optimizer"
3. In the GKD-V Volatility/Volume indicator, change "Volatility/Volume Type" to "Optimizer"
4. In the GKD-C Confirmation 1 indicator, change "Confirmation Type" to "Optimizer"
5. In the GKD-C Continuation indicator, change "Confirmation Type" to "Optimizer"
An example of steps 2-5. In the screenshot example below, we change the value "Confirmation Type" in the GKD-C Fisher Transform indicator to "Optimizer"
6. In the GKD-BT Optimizer SCSC Backtest, import the value "Input into NEW GKD-BT Backtest" from the GKD-B Baseline indicator into the field "Import GKD-B Baseline indicator"
7. In the GKD-BT Optimizer SCSC Backtest, import the value "Input into NEW GKD-BT Backtest" from the GKD-V Volatility/Volume indicator into the field "Import GKD-V Volatility/Volume indicator"
8. In the GKD-BT Optimizer SCSC Backtest, import the value "Input into NEW GKD-BT Backtest" from the GKD-C Confirmation 1 indicator into the field "Import GKD-C Confirmation 1 indicator"
9. In the GKD-BT Optimizer SCSC Backtest, import the value "Input into NEW GKD-BT Backtest" from the GKD-C Continuation indicator into the field "Import GKD-C Continuation indicator"
An example of steps 6-9. In the screenshot example below, we import the value "Input into NEW GKD-BT Backtest" from the GKD-C Fisher Transform indicator into the GKD-BT Optimizer SCSC Backtest
10. Decide which of the 5 indicators you wish to optimize in first in the GKD-BT Optimizer SCSC Backtest. Change the value of the import from "Input into NEW GKD-BT Backtest" to "Input into NEW GKD-BT Optimizer Signals"
An example of step 10. In the screenshot example below, we chose to optimize the Confirmation 1 indicator, the GKD-C Fisher Transform. We change the value of the field "Import GKD-C Confirmation 1 indicator" from "Input into NEW GKD-BT Backtest" to "Input into NEW GKD-BT Optimizer Signals"
11. In the GKD-BT Optimizer SCSC Backtest and under the "Optimization Settings", use the dropdown menu "Optimization Indicator" to select the type of indicator you selected from step 12 above: "Baseline", "Volatility/Volume", "Confirmation 1", or "Continuation"
12. In the GKD-BT Optimizer SCSC Backtest and under the "Optimization Settings", import the value "Input into NEW GKD-BT Optimizer Start" from the indicator you selected to optimize in step 12 above into the field "Import Optimization Indicator Start"
13. In the GKD-BT Optimizer SCSC Backtest and under the "Optimization Settings", import the value "Input into NEW GKD-BT Optimizer Skip" from the indicator you selected to optimize in step 12 above into the field "Import Optimization Indicator Skip"
An example of step 11. In the screenshot example below, we select "Confirmation 1" from the "Optimization Indicator" dropdown menu
An example of steps 12 and 13. In the screenshot example below, we import "Import Optimization Indicator Start" and "Import Optimization Indicator Skip" from the GKD-C Fisher Transform indicator into their respective fields
🔶 This backtest includes the following metrics
Net profit: Overall profit or loss achieved.
Total Closed Trades: Total number of closed trades, both winning and losing.
Total Percent Wins: Total wins, whether long or short, for the selected time interval regardless of commissions and other profit-modifying addons.
Percent Profitable: Total wins, whether long or short, that are also profitable, taking commissions into account.
Profit Factor: The ratio of gross profits to gross losses, indicating how much money the strategy made for every unit of money it lost.
Average Profit per Trade: The average gain or loss per trade, calculated by dividing the net profit by the total number of closed trades.
Average Number of Bars in Trade: The average number of bars that elapsed during trades for all closed trades.
🔶 Summary of notable settings not already explained above
🔹 Backtest Properties
These settings define the financial and logistical parameters of the trading simulation, including:
Initial Capital: Specifies the starting balance for the backtest, setting the baseline for measuring profitability and loss.
Order Size: Determines the size of trades, which can be fixed or a percentage of the equity, affecting risk and return.
Order Type: Chooses between fixed contract sizes or a percentage-based order size, allowing for static or dynamic trading volumes.
Commission per Order: Accounts for trading costs, subtracting these from profits to provide a more accurate net performance result.
🔹 Signal Qualifiers
This group of settings establishes criteria related to the strategy's Baseline, and Volatility/Volume indicators in relation to the GKD-C Confirmation 1 indicator, which is crucial for validating trade signals. These include:
Maximum Allowable Post Signal Baseline Cross Bars Back: Sets the maximum number of bars that can elapse after a signal generated by a GKD-C Confirmation 1 indicator triggers. If the GKD-C Confirmation 1 indicator generates a long/short signal that doesn't yet agree with the trend position of the Baseline, then should the Baseline "catch-up" to the long/short trend of the GKD-C Confirmation 1 indicator within the number of bars specified by this setting, then a signal is generated.
Maximum Allowable Post Signal Volatility/Volume Cross Bars Back: Sets the maximum number of bars that can elapse after a signal generated by a GKD-C Confirmation 1 indicator triggers. If the GKD-C Confirmation 1 indicator generates a long/short signal that doesn't yet agree with the position of the Volatility/Volume, then should the Volatility/Volume "catch-up" with the long/short of the GKD-C Confirmation 1 indicator within the number of bars specified by this setting, then a signal is generated.
🔹 Signal Settings
Signal Options: These settings allow users to toggle the visibility of different types of entries based on the strategy criteria, such as standard entries, baseline entries, and continuation entries.
Standard Entry Rules Settings: Detailed criteria for standard entries can be customized here, including conditions on baseline agreement, price within specific zones, and agreement with other confirmation indicators.
1-Candle Rule Standard Entry Rules Settings: Similar to standard entries, but with a focus on conditions that must be met within a one-candle timeframe.
Baseline Entry Rules Settings: Specifies rules for entries based on the baseline, including conditions on confirmation agreement and price zones.
Volatility/Volume Entry Rules Settings: This includes settings for entries based on volatility or volume conditions, with specific rules on confirmation agreement and baseline agreement.
Continuation Entry Rules Settings: This group outlines the conditions for continuation entries, focusing on agreement with baseline and confirmation indicators since the entry signal trigger.
🔹 Volatility Settings
Volatility PnL Settings: Parameters for defining the type of volatility measure to use, its period, and multipliers for profit and stop levels.
Volatility Types Included
Standard Deviation of Logarithmic Returns: Quantifies asset volatility using the standard deviation applied to logarithmic returns, capturing symmetric price movements and financial returns' compound nature.
Exponential Weighted Moving Average (EWMA) for Volatility: Focuses on recent market information by applying exponentially decreasing weights to squared logarithmic returns, offering a dynamic view of market volatility.
Roger-Satchell Volatility Measure: Estimates asset volatility by analyzing the high, low, open, and close prices, providing a nuanced view of intraday volatility and market dynamics.
Close-to-Close Volatility Measure: Calculates volatility based on the closing prices of stocks, offering a streamlined but limited perspective on market behavior.
Parkinson Volatility Measure: Enhances volatility estimation by including high and low prices of the trading day, capturing a more accurate reflection of intraday market movements.
Garman-Klass Volatility Measure: Incorporates open, high, low, and close prices for a comprehensive daily volatility measure, capturing significant price movements and market activity.
Yang-Zhang Volatility Measure: Offers an efficient estimation of stock market volatility by combining overnight and intraday price movements, capturing opening jumps and overall market dynamics.
Garman-Klass-Yang-Zhang Volatility Measure: Merges the benefits of Garman-Klass and Yang-Zhang measures, providing a fuller picture of market volatility including opening market reactions.
Pseudo GARCH(2,2) Volatility Model: Mimics a GARCH(2,2) process using exponential moving averages of squared returns, highlighting volatility shocks and their future impact.
ER-Adaptive Average True Range (ATR): Adjusts the ATR period length based on market efficiency, offering a volatility measure that adapts to changing market conditions.
Adaptive Deviation: Dynamically adjusts its calculation period to offer a nuanced measure of volatility that responds to the market's intrinsic rhythms.
Median Absolute Deviation (MAD): Provides a robust measure of statistical variability, focusing on deviations from the median price, offering resilience against outliers.
Mean Absolute Deviation (MAD): Measures the average magnitude of deviations from the mean price, facilitating a straightforward understanding of volatility.
ATR (Average True Range): Finds the average of true ranges over a specified period, indicating the expected price movement and market volatility.
True Range Double (TRD): Offers a nuanced view of volatility by considering a broader range of price movements, identifying significant market sentiment shifts.
🔹 Other Settings
Backtest Dates: Users can specify the timeframe for the backtest, including start and end dates, as well as the acceptable entry time window.
Volatility Inputs: Additional settings related to volatility calculations, such as static percent, internal filter period for median absolute deviation, and parameters for specific volatility models.
UI Options: Settings to customize the user interface, including table activation, date panel visibility, and aesthetics like color and text size.
Export Options: Allows users to select the type of data to export from the backtest, focusing on metrics like net profit, total closed trades, and average profit per trade.
█ Giga Kaleidoscope (GKD) Modularized Trading System
The GKD Trading System is a comprehensive, algorithmic trading framework from AlgxTrading, designed to optimize trading strategies across various market conditions. It employs a modular approach, incorporating elements such as volatility assessment, trend identification through a baseline, multiple confirmation strategies for signal accuracy, and volume analysis. Key components also include specialized strategies for entry and exit, enabling precise trade execution. The system allows for extensive backtesting, providing traders with the ability to evaluate the effectiveness of their strategies using historical data. Aimed at reducing setup time, the GKD system empowers traders to focus more on strategy refinement and execution, leveraging a wide array of technical indicators for informed decision-making.
🔶 Core components of a GKD Algorithmic Trading System
Each GKD indicator is denoted with a module identifier of either: GKD-BT, GKD-B, GKD-C, GKD-V, GKD-M, or GKD-E. This allows traders to understand to which module each indicator belongs and where each indicator fits into the GKD system. The GKD algorithm is built on the principles of trend, momentum, and volatility. There are eight core components in the GKD trading algorithm:
🔹 Volatility - In the GKD trading system, volatility is used as a part of the system to help determine the appropriate stop loss and take profit levels for a trade. There are 17+ different types of volatility available in the GKD system including Average True Range (ATR), True Range Double (TRD), Close-to-Close, Garman-Klass, and more.
🔹 Baseline (GKD-B) - The baseline is essentially a moving average and is used to determine the overall direction of the market. The baseline in the GKD trading system is used to filter out trades that are not in line with the long-term trend of the market. The baseline is plotted on the chart along with other GKD indicators.
Trades are only taken when the price is in the same direction as the baseline. For example, if the baseline is sloping upwards or price is above the baseline, then only long trades are taken, and if the baseline is sloping downwards or price is below the baseline, then only short trades are taken. This approach helps to ensure that trades are in line with the overall trend of the market, and reduces the risk of entering trades that are likely to fail.
🔹 Confirmation 1, Confirmation 2, Continuation (GKD-C) - The GKD trading system incorporates technical confirmation indicators for the generation of its primary long and short signals, essential for its operation.
The GKD trading system distinguishes three specific categories. The first category, Confirmation 1 , encompasses technical indicators designed to identify trends and generate explicit trading signals. The second category, Confirmation 2 , a technical indicator used to identify trends; this type of indicator is primarily used to filter the Confirmation 1 indicator signals; however, this type of confirmation indicator also generates signals*. Lastly, the Continuation category includes technical indicators used in conjunction with Confirmation 1 and Confirmation 2 to generate a special type of trading signal called a "Continuation"
In a full GKD trading system all three categories generate signals. (see the section “GKD Trading System Signals” below)
🔹 Volatility/Volume (GKD-V) - Volatility/Volume indicators are used to measure the amount of buying and selling activity in a market. They are based on the trading Volatility/Volume of the market, and can provide information about the strength of the trend. In the GKD trading system, Volatility/Volume indicators are used to confirm trading signals generated by the various other GKD indicators. In the GKD trading system, Volatility is a proxy for Volume and vice versa.
Volatility/Volume indicators reduce the risk of false signals and improve the overall profitability of trades. These indicators can provide additional information about the market that is not captured by GKD-C confirmation and GKD-B baseline indicators.
🔹 Exit (GKD-E) - The exit indicator in the GKD system is an indicator that is deemed effective at identifying optimal exit points. The purpose of the exit indicator is to identify when a trend is likely to reverse or when the market conditions have changed, signaling the need to exit a trade. By using an exit indicator, traders can manage their risk and prevent significant losses.
🔹 Backtest (GKD-BT) - The GKD-BT backtest indicators link all other GKD-C, GKD-B, GKD-E, GKD-V, and GKD-M components together to create a GKD trading system. GKD-BT backtests generate signals (see the section “GKD Trading System Signals” below) from the confluence of various GKD indicators that are imported into the GKD-BT backtest. Backtest types include: GKD-BT solo and full GKD backtest strategies used for a single ticker; GKD-BT optimizers used to optimize a single indicator or the full GKD trading system; GKD-BT Multi-ticker used to backtest a single indicator or the full GKD trading system across up to ten tickers; GKD-BT exotic backtests like CC, Baseline, and Giga Stacks used to test confluence between GKD components to then be injected into a core GKD-BT Multi-ticker backtest or single ticker strategy.
🔹 Metamorphosis (GKD-M) ** - The concept of a metamorphosis indicator involves the integration of two or more GKD indicators to generate a compound signal. This is achieved by evaluating the accuracy of each indicator and selecting the signal from the indicator with the highest accuracy. As an illustration, let's consider a scenario where we calculate the accuracy of 10 indicators and choose the signal from the indicator that demonstrates the highest accuracy.
The resulting output from the metamorphosis indicator can then be utilized in a GKD-BT backtest by occupying a slot that aligns with the purpose of the metamorphosis indicator. The slot can be a GKD-B, GKD-C, GKD-E, or GKD-V slot, depending on the specific requirements and objectives of the indicator. This allows for seamless integration and utilization of the compound signal within the GKD-BT framework.
*see the section “GKD Trading System Signals” below
**not a required component of the GKD algorithm
🔶 What does the application of the GKD trading system look like?
Example trading system:
Volatility: Average True Range (ATR) (selectable in all backtests and other related GKD indicators)
GKD-B Baseline: GKD-B Multi-Ticker Baseline using Hull Moving Average
GKD-C Confirmation 1 : GKD-C Advance Trend Pressure
GKD-C Confirmation 2: GKD-C Dorsey Inertia
GKD-C Continuation: GKD-C Stochastic of RSX
GKD-V Volatility/Volume: GKD-V Damiani Volatmeter
GKD-E Exit: GKD-E MFI
GKD-BT Backtest: GKD-BT Multi-Ticker Full GKD Backtest
GKD-M Metamorphosis: GKD-M Baseline Optimizer
**all indicators mentioned above are included in the same AlgxTrading package**
Each module is passed to a GKD-BT backtest module. In the backtest module, all components are combined to formulate trading signals and statistical output. This chaining of indicators requires that each module conform to AlgxTrading's GKD protocol, therefore allowing for the testing of every possible combination of technical indicators that make up the various indictor types in the GKD algorithm.
🔶 GKD Trading System Signals
Standard Entry requires a sequence of conditions including a confirmation signal from GKD-C, baseline agreement, price criteria related to the Goldie Locks Zone, and concurrence from a second confirmation and volatility/volume indicators.
1-Candle Standard Entry introduces a two-phase process where initial conditions must be met, followed by a retraction in price and additional confirmations in the subsequent candle, including baseline, confirmations 1 and 2, and volatility/volume criteria.
Baseline Entry focuses on signals generated by the GKD-B Baseline, requiring agreement from confirmation signals, specific price conditions within the Goldie Locks Zone, and a timing condition related to the confirmation 1 signal.
1-Candle Baseline Entry mirrors the baseline entry but adds a requirement for a price retraction and subsequent confirmations in the following candle, maintaining the focus on the baseline's guidance.
Volatility/Volume Entry is predicated on signals from volatility/volume indicators, requiring support from confirmations, price criteria within the Goldie Locks Zone, baseline agreement, and a timing condition for the confirmation 1 signal.
1-Candle Volatility/Volume Entry adapts the volatility/volume entry to include a phase of initial signal and agreement, followed by a retracement phase that seeks further agreement from the system's components in the subsequent candle.
Confirmation 2 Entry is based on the second confirmation signal, requiring the first confirmation's agreement, specific price criteria, agreement from volatility/volume indicators, and baseline, with a timing condition for the confirmation 1 signal.
1-Candle Confirmation 2 Entry adds a retracement requirement to the confirmation 2 entry, necessitating additional agreements from the system's components in the candle following the signal.
PullBack Entry initiates with a baseline signal and agreement from the first confirmation, with a price condition related to volatility. It then looks for price to return within the Goldie Locks Zone and seeks further agreement from the system's components in the subsequent candle.
Continuation Entry allows for the continuation of an active position, based on a previously triggered entry strategy. It requires that the baseline hasn't crossed since the initial trigger, alongside ongoing agreements from confirmations and the baseline.
█ Conclusion
The GKD-BT Optimizer SCSC Backtest is a critical tool within the Giga Kaleidoscope Modularized Trading System, designed for precise strategy refinement and evaluation within the GKD framework. It enables the optimization and testing of various trading indicators and strategies under different market conditions. The module's design facilitates detailed analysis of individual trading components' performance, allowing for the optimization of indicators like Baseline, Volatility/Volume, Confirmation, and Continuation. This optimization process aids traders in identifying the most effective configurations, thereby enhancing trading outcomes and strategy efficiency within the GKD ecosystem.
█ How to Access
You can see the Author's Instructions below to learn how to get access.

GKD-BT Optimizer Full GKD Backtest [Loxx]The Giga Kaleidoscope GKD-BT Optimizer Full GKD Backtest is a Backtest module included in AlgxTrading's "Giga Kaleidoscope Modularized Trading System." (see the section Giga Kaleidoscope (GKD) Modularized Trading System below for an explanation of the GKD trading system)
**the backtest data rendered to the chart above and all screenshots below use $5 commission per trade and 10% equity per trade with $1 million initial capital**
█ GKD-BT Optimizer Full GKD Backtest
The GKD-BT Optimizer Full GKD Backtest is a comprehensive backtesting module designed to optimize the combination of key GKD indicators within AlgxTrading's "Giga Kaleidoscope Modularized Trading System." This module facilitates precise strategy refinement by allowing traders to configure and optimize the following critical GKD indicators:
GKD-B Baseline
GKD-V Volatility/Volume
GKD-C Confirmation 1
GKD-C Confirmation 2
GKD-C Continuation
Each indicator is equipped with an "Optimizer" mode, enabling dynamic feedback and iterative improvements directly into the backtesting environment. This integrated approach ensures that each component contributes effectively to the overall strategy, providing a robust framework for achieving optimized trading outcomes.
The GKD-BT Optimizer supports granular test configurations including a single take profit and stop loss setting, and allows for targeted testing within specified date ranges to simulate forward testing with historical data. This feature is essential for evaluating the resilience and effectiveness of trading strategies under various market conditions.
Furthermore, the module is designed with user-centric features such as:
Customizable Trading Panel: Displays critical backtest results and trade statistics, which can be shown or hidden as per user preference.
Highlighting Thresholds: Users can set thresholds for Total Percent Wins, Percent Profitable, and Profit Factor, which helps in quickly identifying the most relevant metrics for analysis.
The detailed setup ensures that traders can not only adjust their strategies based on historical performance but also fine-tune their approach to meet specific trading objectives.
🔶 To configure this indicator: ***all GKD indicators listed below are all included in the AlgxTrading trading system package***
1. Add GKD-C Confirmation, GKD-B Baseline, GKD-V Volatility/Volume, GKD-C Confirmation 2, and GKD-C Continuation to your chart
2. In the GKD-B Baseline indicator, change "Baseline Type" to "Optimizer"
3. In the GKD-V Volatility/Volume indicator, change "Volatility/Volume Type" to "Optimizer"
4. In the GKD-C Confirmation 1 indicator, change "Confirmation Type" to "Optimizer"
5. In the GKD-C Confirmation 2 indicator, change "Confirmation Type" to "Optimizer"
6. In the GKD-C Continuation indicator, change "Confirmation Type" to "Optimizer"
An example of steps 2-6. In the screenshot example below, we change the value "Confirmation Type" in the GKD-C Fisher Transform indicator to "Optimizer"
7. In the GKD-BT Optimizer Full GKD Backtest, import the value "Input into NEW GKD-BT Backtest" from the GKD-B Baseline indicator into the field "Import GKD-B Baseline indicator"
8. In the GKD-BT Optimizer Full GKD Backtest, import the value "Input into NEW GKD-BT Backtest" from the GKD-V Volatility/Volume indicator into the field "Import GKD-V Volatility/Volume indicator"
9. In the GKD-BT Optimizer Full GKD Backtest, import the value "Input into NEW GKD-BT Backtest" from the GKD-C Confirmation 1 indicator into the field "Import GKD-C Confirmation 1 indicator"
10. In the GKD-BT Optimizer Full GKD Backtest, import the value "Input into NEW GKD-BT Backtest" from the GKD-C Confirmation 2 indicator into the field "Import GKD-C Confirmation 2 indicator"
11. In the GKD-BT Optimizer Full GKD Backtest, import the value "Input into NEW GKD-BT Backtest" from the GKD-C Continuation indicator into the field "Import GKD-C Continuation indicator"
An example of steps 7-11. In the screenshot example below, we import the value "Input into NEW GKD-BT Backtest" from the GKD-C Coppock Curve indicator into the GKD-BT Optimizer Full GKD Backtest
12. Decide which of the 5 indicators you wish to optimize in first in the GKD-BT Optimizer Full GKD Backtest. Change the value of the import from "Input into NEW GKD-BT Backtest" to "Input into NEW GKD-BT Optimizer Signals"
An example of step 12. In the screenshot example below, we chose to optimize the Confirmation 1 indicator, the GKD-C Fisher Transform. We change the value of the field "Import GKD-C Confirmation 1 indicator" from "Input into NEW GKD-BT Backtest" to "Input into NEW GKD-BT Optimizer Signals"
13. In the GKD-BT Optimizer Full GKD Backtest and under the "Optimization Settings", use the dropdown menu "Optimization Indicator" to select the type of indicator you selected from step 12 above: "Baseline", "Volatility/Volume", "Confirmation 1", "Confirmation 2", or "Continuation"
14. In the GKD-BT Optimizer Full GKD Backtest and under the "Optimization Settings", import the value "Input into NEW GKD-BT Optimizer Start" from the indicator you selected to optimize in step 12 above into the field "Import Optimization Indicator Start"
15. In the GKD-BT Optimizer Full GKD Backtest and under the "Optimization Settings", import the value "Input into NEW GKD-BT Optimizer Skip" from the indicator you selected to optimize in step 12 above into the field "Import Optimization Indicator Skip"
An example of step 13. In the screenshot example below, we select "Confirmation 1" from the "Optimization Indicator" dropdown menu
An example of steps 14 and 15. In the screenshot example below, we import "Import Optimization Indicator Start" and "Import Optimization Indicator Skip" from the GKD-C Fisher Transform indicator into their respective fields
🔶 This backtest includes the following metrics
Net profit: Overall profit or loss achieved.
Total Closed Trades: Total number of closed trades, both winning and losing.
Total Percent Wins: Total wins, whether long or short, for the selected time interval regardless of commissions and other profit-modifying addons.
Percent Profitable: Total wins, whether long or short, that are also profitable, taking commissions into account.
Profit Factor: The ratio of gross profits to gross losses, indicating how much money the strategy made for every unit of money it lost.
Average Profit per Trade: The average gain or loss per trade, calculated by dividing the net profit by the total number of closed trades.
Average Number of Bars in Trade: The average number of bars that elapsed during trades for all closed trades.
🔶 Summary of notable settings not already explained above
🔹 Backtest Properties
These settings define the financial and logistical parameters of the trading simulation, including:
Initial Capital: Specifies the starting balance for the backtest, setting the baseline for measuring profitability and loss.
Order Size: Determines the size of trades, which can be fixed or a percentage of the equity, affecting risk and return.
Order Type: Chooses between fixed contract sizes or a percentage-based order size, allowing for static or dynamic trading volumes.
Commission per Order: Accounts for trading costs, subtracting these from profits to provide a more accurate net performance result.
🔹 Signal Qualifiers
This group of settings establishes criteria related to the strategy's Baseline, Volatility/Volume, and Confirmation 2 indicators in relation to the GKD-C Confirmation 1 indicator, which is crucial for validating trade signals. These include:
Maximum Allowable Post Signal Baseline Cross Bars Back: Sets the maximum number of bars that can elapse after a signal generated by a GKD-C Confirmation 1 indicator triggers. If the GKD-C Confirmation 1 indicator generates a long/short signal that doesn't yet agree with the trend position of the Baseline, then should the Baseline "catch-up" to the long/short trend of the GKD-C Confirmation 1 indicator within the number of bars specified by this setting, then a signal is generated.
Maximum Allowable Post Signal Volatility/Volume Cross Bars Back: Sets the maximum number of bars that can elapse after a signal generated by a GKD-C Confirmation 1 indicator triggers. If the GKD-C Confirmation 1 indicator generates a long/short signal that doesn't yet agree with the position of the Volatility/Volume, then should the Volatility/Volume "catch-up" with the long/short of the GKD-C Confirmation 1 indicator within the number of bars specified by this setting, then a signal is generated.
Maximum Allowable Post Signal Confirmation 2 Cross Bars Back: Sets the maximum number of bars that can elapse after a signal generated by a GKD-C Confirmation 1 indicator triggers. If the GKD-C Confirmation 1 indicator generates a long/short signal that doesn't yet agree with the trend position of the Confirmation 2, then should the Confirmation 2 "catch-up" to the long/short trend of the GKD-C Confirmation 1 indicator within the number of bars specified by this setting, then a signal is generated.
🔹 Signal Settings
Signal Options: These settings allow users to toggle the visibility of different types of entries based on the strategy criteria, such as standard entries, baseline entries, and continuation entries.
Standard Entry Rules Settings: Detailed criteria for standard entries can be customized here, including conditions on baseline agreement, price within specific zones, and agreement with other confirmation indicators.
1-Candle Rule Standard Entry Rules Settings: Similar to standard entries, but with a focus on conditions that must be met within a one-candle timeframe.
Baseline Entry Rules Settings: Specifies rules for entries based on the baseline, including conditions on confirmation agreement and price zones.
Volatility/Volume Entry Rules Settings: This includes settings for entries based on volatility or volume conditions, with specific rules on confirmation agreement and baseline agreement.
Confirmation 2 Entry Rules Settings: Settings here define the rules for entries based on a second confirmation indicator, detailing the required agreements and conditions.
Continuation Entry Rules Settings: This group outlines the conditions for continuation entries, focusing on agreement with baseline and confirmation indicators since the entry signal trigger.
🔹 Volatility Settings
Volatility PnL Settings: Parameters for defining the type of volatility measure to use, its period, and multipliers for profit and stop levels.
Volatility Types Included
Standard Deviation of Logarithmic Returns: Quantifies asset volatility using the standard deviation applied to logarithmic returns, capturing symmetric price movements and financial returns' compound nature.
Exponential Weighted Moving Average (EWMA) for Volatility: Focuses on recent market information by applying exponentially decreasing weights to squared logarithmic returns, offering a dynamic view of market volatility.
Roger-Satchell Volatility Measure: Estimates asset volatility by analyzing the high, low, open, and close prices, providing a nuanced view of intraday volatility and market dynamics.
Close-to-Close Volatility Measure: Calculates volatility based on the closing prices of stocks, offering a streamlined but limited perspective on market behavior.
Parkinson Volatility Measure: Enhances volatility estimation by including high and low prices of the trading day, capturing a more accurate reflection of intraday market movements.
Garman-Klass Volatility Measure: Incorporates open, high, low, and close prices for a comprehensive daily volatility measure, capturing significant price movements and market activity.
Yang-Zhang Volatility Measure: Offers an efficient estimation of stock market volatility by combining overnight and intraday price movements, capturing opening jumps and overall market dynamics.
Garman-Klass-Yang-Zhang Volatility Measure: Merges the benefits of Garman-Klass and Yang-Zhang measures, providing a fuller picture of market volatility including opening market reactions.
Pseudo GARCH(2,2) Volatility Model: Mimics a GARCH(2,2) process using exponential moving averages of squared returns, highlighting volatility shocks and their future impact.
ER-Adaptive Average True Range (ATR): Adjusts the ATR period length based on market efficiency, offering a volatility measure that adapts to changing market conditions.
Adaptive Deviation: Dynamically adjusts its calculation period to offer a nuanced measure of volatility that responds to the market's intrinsic rhythms.
Median Absolute Deviation (MAD): Provides a robust measure of statistical variability, focusing on deviations from the median price, offering resilience against outliers.
Mean Absolute Deviation (MAD): Measures the average magnitude of deviations from the mean price, facilitating a straightforward understanding of volatility.
ATR (Average True Range): Finds the average of true ranges over a specified period, indicating the expected price movement and market volatility.
True Range Double (TRD): Offers a nuanced view of volatility by considering a broader range of price movements, identifying significant market sentiment shifts.
🔹 Other Settings
Backtest Dates: Users can specify the timeframe for the backtest, including start and end dates, as well as the acceptable entry time window.
Volatility Inputs: Additional settings related to volatility calculations, such as static percent, internal filter period for median absolute deviation, and parameters for specific volatility models.
UI Options: Settings to customize the user interface, including table activation, date panel visibility, and aesthetics like color and text size.
Export Options: Allows users to select the type of data to export from the backtest, focusing on metrics like net profit, total closed trades, and average profit per trade.
█ Giga Kaleidoscope (GKD) Modularized Trading System
The GKD Trading System is a comprehensive, algorithmic trading framework from AlgxTrading, designed to optimize trading strategies across various market conditions. It employs a modular approach, incorporating elements such as volatility assessment, trend identification through a baseline, multiple confirmation strategies for signal accuracy, and volume analysis. Key components also include specialized strategies for entry and exit, enabling precise trade execution. The system allows for extensive backtesting, providing traders with the ability to evaluate the effectiveness of their strategies using historical data. Aimed at reducing setup time, the GKD system empowers traders to focus more on strategy refinement and execution, leveraging a wide array of technical indicators for informed decision-making.
🔶 Core components of a GKD Algorithmic Trading System
Each GKD indicator is denoted with a module identifier of either: GKD-BT, GKD-B, GKD-C, GKD-V, GKD-M, or GKD-E. This allows traders to understand to which module each indicator belongs and where each indicator fits into the GKD system. The GKD algorithm is built on the principles of trend, momentum, and volatility. There are eight core components in the GKD trading algorithm:
🔹 Volatility - In the GKD trading system, volatility is used as a part of the system to help determine the appropriate stop loss and take profit levels for a trade. There are 17+ different types of volatility available in the GKD system including Average True Range (ATR), True Range Double (TRD), Close-to-Close, Garman-Klass, and more.
🔹 Baseline (GKD-B) - The baseline is essentially a moving average and is used to determine the overall direction of the market. The baseline in the GKD trading system is used to filter out trades that are not in line with the long-term trend of the market. The baseline is plotted on the chart along with other GKD indicators.
Trades are only taken when the price is in the same direction as the baseline. For example, if the baseline is sloping upwards or price is above the baseline, then only long trades are taken, and if the baseline is sloping downwards or price is below the baseline, then only short trades are taken. This approach helps to ensure that trades are in line with the overall trend of the market, and reduces the risk of entering trades that are likely to fail.
🔹 Confirmation 1, Confirmation 2, Continuation (GKD-C) - The GKD trading system incorporates technical confirmation indicators for the generation of its primary long and short signals, essential for its operation.
The GKD trading system distinguishes three specific categories. The first category, Confirmation 1 , encompasses technical indicators designed to identify trends and generate explicit trading signals. The second category, Confirmation 2 , a technical indicator used to identify trends; this type of indicator is primarily used to filter the Confirmation 1 indicator signals; however, this type of confirmation indicator also generates signals*. Lastly, the Continuation category includes technical indicators used in conjunction with Confirmation 1 and Confirmation 2 to generate a special type of trading signal called a "Continuation"
In a full GKD trading system all three categories generate signals. (see the section “GKD Trading System Signals” below)
🔹 Volatility/Volume (GKD-V) - Volatility/Volume indicators are used to measure the amount of buying and selling activity in a market. They are based on the trading Volatility/Volume of the market, and can provide information about the strength of the trend. In the GKD trading system, Volatility/Volume indicators are used to confirm trading signals generated by the various other GKD indicators. In the GKD trading system, Volatility is a proxy for Volume and vice versa.
Volatility/Volume indicators reduce the risk of false signals and improve the overall profitability of trades. These indicators can provide additional information about the market that is not captured by GKD-C confirmation and GKD-B baseline indicators.
🔹 Exit (GKD-E) - The exit indicator in the GKD system is an indicator that is deemed effective at identifying optimal exit points. The purpose of the exit indicator is to identify when a trend is likely to reverse or when the market conditions have changed, signaling the need to exit a trade. By using an exit indicator, traders can manage their risk and prevent significant losses.
🔹 Backtest (GKD-BT) - The GKD-BT backtest indicators link all other GKD-C, GKD-B, GKD-E, GKD-V, and GKD-M components together to create a GKD trading system. GKD-BT backtests generate signals (see the section “GKD Trading System Signals” below) from the confluence of various GKD indicators that are imported into the GKD-BT backtest. Backtest types include: GKD-BT solo and full GKD backtest strategies used for a single ticker; GKD-BT optimizers used to optimize a single indicator or the full GKD trading system; GKD-BT Multi-ticker used to backtest a single indicator or the full GKD trading system across up to ten tickers; GKD-BT exotic backtests like CC, Baseline, and Giga Stacks used to test confluence between GKD components to then be injected into a core GKD-BT Multi-ticker backtest or single ticker strategy.
🔹 Metamorphosis (GKD-M) ** - The concept of a metamorphosis indicator involves the integration of two or more GKD indicators to generate a compound signal. This is achieved by evaluating the accuracy of each indicator and selecting the signal from the indicator with the highest accuracy. As an illustration, let's consider a scenario where we calculate the accuracy of 10 indicators and choose the signal from the indicator that demonstrates the highest accuracy.
The resulting output from the metamorphosis indicator can then be utilized in a GKD-BT backtest by occupying a slot that aligns with the purpose of the metamorphosis indicator. The slot can be a GKD-B, GKD-C, GKD-E, or GKD-V slot, depending on the specific requirements and objectives of the indicator. This allows for seamless integration and utilization of the compound signal within the GKD-BT framework.
*see the section “GKD Trading System Signals” below
**not a required component of the GKD algorithm
🔶 What does the application of the GKD trading system look like?
Example trading system:
Volatility: Average True Range (ATR) (selectable in all backtests and other related GKD indicators)
GKD-B Baseline: GKD-B Multi-Ticker Baseline using Hull Moving Average
GKD-C Confirmation 1 : GKD-C Advance Trend Pressure
GKD-C Confirmation 2: GKD-C Dorsey Inertia
GKD-C Continuation: GKD-C Stochastic of RSX
GKD-V Volatility/Volume: GKD-V Damiani Volatmeter
GKD-E Exit: GKD-E MFI
GKD-BT Backtest: GKD-BT Multi-Ticker Full GKD Backtest
GKD-M Metamorphosis: GKD-M Baseline Optimizer
**all indicators mentioned above are included in the same AlgxTrading package**
Each module is passed to a GKD-BT backtest module. In the backtest module, all components are combined to formulate trading signals and statistical output. This chaining of indicators requires that each module conform to AlgxTrading's GKD protocol, therefore allowing for the testing of every possible combination of technical indicators that make up the various indictor types in the GKD algorithm.
🔶 GKD Trading System Signals
Standard Entry requires a sequence of conditions including a confirmation signal from GKD-C, baseline agreement, price criteria related to the Goldie Locks Zone, and concurrence from a second confirmation and volatility/volume indicators.
1-Candle Standard Entry introduces a two-phase process where initial conditions must be met, followed by a retraction in price and additional confirmations in the subsequent candle, including baseline, confirmations 1 and 2, and volatility/volume criteria.
Baseline Entry focuses on signals generated by the GKD-B Baseline, requiring agreement from confirmation signals, specific price conditions within the Goldie Locks Zone, and a timing condition related to the confirmation 1 signal.
1-Candle Baseline Entry mirrors the baseline entry but adds a requirement for a price retraction and subsequent confirmations in the following candle, maintaining the focus on the baseline's guidance.
Volatility/Volume Entry is predicated on signals from volatility/volume indicators, requiring support from confirmations, price criteria within the Goldie Locks Zone, baseline agreement, and a timing condition for the confirmation 1 signal.
1-Candle Volatility/Volume Entry adapts the volatility/volume entry to include a phase of initial signal and agreement, followed by a retracement phase that seeks further agreement from the system's components in the subsequent candle.
Confirmation 2 Entry is based on the second confirmation signal, requiring the first confirmation's agreement, specific price criteria, agreement from volatility/volume indicators, and baseline, with a timing condition for the confirmation 1 signal.
1-Candle Confirmation 2 Entry adds a retracement requirement to the confirmation 2 entry, necessitating additional agreements from the system's components in the candle following the signal.
PullBack Entry initiates with a baseline signal and agreement from the first confirmation, with a price condition related to volatility. It then looks for price to return within the Goldie Locks Zone and seeks further agreement from the system's components in the subsequent candle.
Continuation Entry allows for the continuation of an active position, based on a previously triggered entry strategy. It requires that the baseline hasn't crossed since the initial trigger, alongside ongoing agreements from confirmations and the baseline.
█ Conclusion
The GKD-BT Optimizer Full GKD Backtest is a critical tool within the Giga Kaleidoscope Modularized Trading System, designed for precise strategy refinement and evaluation within the GKD framework. It enables the optimization and testing of various trading indicators and strategies under different market conditions. The module's design facilitates detailed analysis of individual trading components' performance, allowing for the optimization of indicators like Baseline, Volatility/Volume, Confirmation, and Continuation. This optimization process aids traders in identifying the most effective configurations, thereby enhancing trading outcomes and strategy efficiency within the GKD ecosystem.
█ How to Access
You can see the Author's Instructions below to learn how to get access.

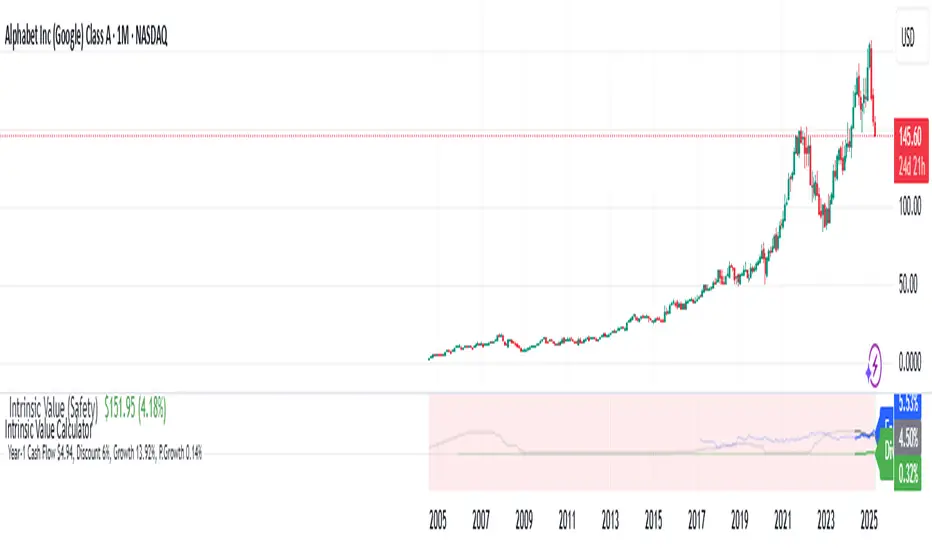
Intrinsic Value Calculator - Earnings/Dividend Yield (%)
This Intrinsic Value Calculator is a stock valuation Calculator that uses proven and science-based valuation methods to automatically estimate the intrinsic value of stocks.
What Is Intrinsic Value?
Intrinsic value is a measure of what a company's stock is worth. Intrinsic value is different from the current market price of a stock. However, comparing it to that current price can give investors an idea of whether the stock is undervalued or overvalued.
How to Calculate Intrinsic Value
To calculate the intrinsic value of a stock, we use two valuation methods: Discounted Cash Flow (DCF) Valuation and Relative Valuation. We take the average of these two methods to estimate the intrinsic value as accurately as possible.
Using Discounted Cash Flow (DCF) analysis, cash flows are estimated based on how a business may perform in the future. Those cash flows are then discounted to today’s value to obtain the company's intrinsic value. The discount rate we used is a risk-free rate of return (Fixed Deposit Interest Rate).
While intrinsic valuation models see to value a business by looking only at the company on its own, relative valuation models seek to value a business by comparing the company to other Low-Risk investment opportunities, Fixed Deposit Return.
Line Graph : Earnings Yield vs Fixed Deposit Interest Rate vs Dividend Yield
Other than automatically estimating the intrinsic value of a stock, this script would plot the Earnings Yield, Fixed Deposit Interest, and Dividend Yield of a stock.
Investors should monitor Earnings Yield, Fixed Deposit Interest, and Dividend Yield of a stock for a few key reasons:
Earnings Yield:
Earnings Yield is a crucial metric that provides insight into a company's profitability. It is calculated by dividing the company's earnings per share (EPS) by the current stock price. A higher Earnings Yield indicates that the company is generating more profit for each dollar invested by shareholders. This metric is particularly useful when comparing a company's profitability against other investment options, such as fixed deposits, bonds, or other stocks.
Fixed Deposit Interest:
The Fixed Deposit Interest Rate, also known as the risk-free rate, is the return an investor can expect from investing in a risk-free asset such as a government bond or a fixed deposit. This rate serves as a benchmark for evaluating the returns offered by other investments, including stocks.
Dividend Yield:
Dividend Yield is a measure of the annual dividend income received by an investor relative to the stock price. It is calculated by dividing the annual dividend per share by the current stock price. Dividend-paying stocks often appeal to income-oriented investors seeking regular cash flow.
Monitoring these metrics can help investors make informed decisions about their investments, assess the relative attractiveness of different investment options, and manage their investment portfolios effectively.
Key Financial Ratio display
Key investment ratios play a crucial role in helping investors make informed investment decisions. By providing valuable insights into a company's financial health, ratios such as the Gross Margin, R&D Ratio, Net Margin, Return on Equity (ROE) Ratio allow investors to quickly assess a company's profitability, liquidity, and financial stability.
Gross margin is the percentage of a company's revenue that it retains after direct expenses, such as labor and materials, have been subtracted. Gross margin is an important profitability measure that looks at a company's gross profit compared to its revenue.
The Research & Development (R&D) to Sales Ratio is a measure to compare the effectiveness of R&D expenditures between companies in the same industry. It is calculated as R&D expenditure divided by Total Sales.
The net profit margin, or simply Net Margin , measures how much net income or profit is generated as a percentage of revenue. It is the ratio of net profits to revenues for a company or business segment.
The Return on Equity (ROE) Ratio is a measure of a company's profitability and efficiency in using its shareholders' investments to generate profits. It's calculated by dividing a company's net income by its shareholder's equity. This ratio is a reflection of how well a company is utilizing its shareholders' capital to generate returns.
The Operating Cash to Debt Ratio measures the percentage of a company's total debt that is covered by its operating cash flow for a given accounting period. If the company’s ratio were higher, it would indicate a strong fiscal position, considering its cash flow from operations is higher than its total debt.
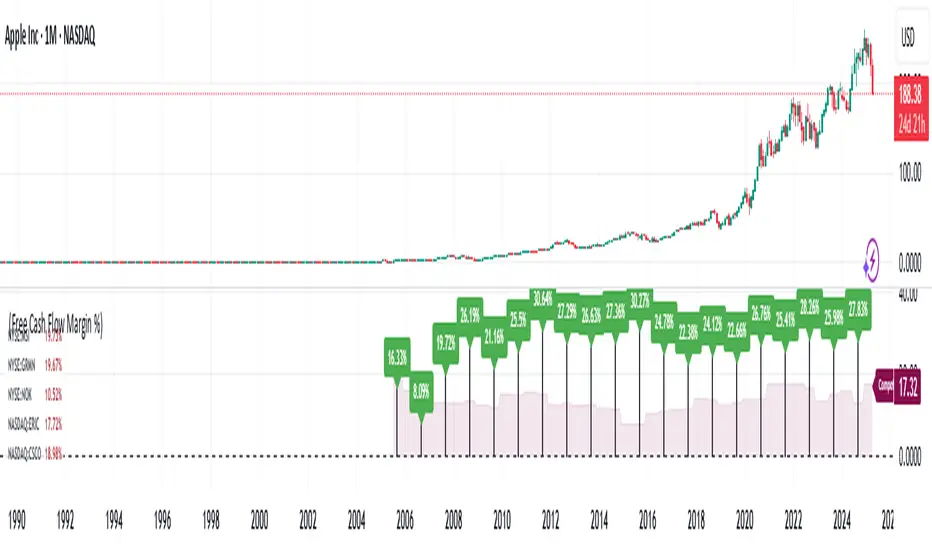
Free Cash Flow Margin is a significant financial metric that measures a company's ability to generate cash from its operations after accounting for capital expenditures. It evaluates the percentage of free cash flow relative to total revenue. A high Free Cash Flow margin suggests that a company is efficient at converting its revenue into cash flow.
GKD-BT Multi-Ticker CC Backtest [Loxx]The Giga Kaleidoscope GKD-BT Multi-Ticker CC Backtest is a backtest module included in Loxx's "Giga Kaleidoscope Modularized Trading System."
█ Giga Kaleidoscope GKD-BT Multi-Ticker CC Backtest
This backtest allows you to test GKD-C Confirmation 1 and GKD-C Confirmation 2 indicators together without the hassle of adding additional confluence indicators. The backtest includes 1 take profit and 1 SL and various types of volatility. The backtest results on the chart are using 10% equity of 1 million total equity and $5 commission per trade.
To use this indicator:
1. Import the value "Input into NEW GKD-BT Backtest" from the GKD-C Confirmation 1 indicator into the GKD-BT Multi-Ticker CC Backtest.
2. Import the value "Input into NEW GKD-BT Backtest" from the GKD-C Confirmation 2 indicator into the GKD-BT Multi-Ticker CC Backtest.
This backtest includes the following metrics:
1. Net profit: Overall profit or loss achieved.
2. Total Closed Trades: Total number of closed trades, both winning and losing.
3. Total Percent Wins: Total wins, whether long or short, for the selected time interval regardless of commissions and other profit-modifying addons.
4. Percent Profitable: Total wins, whether long or short, that are also profitable, taking commissions into account.
5. Profit Factor: The ratio of gross profits to gross losses, indicating how much money the strategy made for every unit of money it lost.
6. Average Profit per Trade: The average gain or loss per trade, calculated by dividing the net profit by the total number of closed trades.
7. Average Number of Bars in Trade: The average number of bars that elapsed during trades for all closed trades.
Summary of notable settings:
Input Tickers separated by commas: Allows the user to input tickers separated by commas, specifying the symbols or tickers of financial instruments used in the backtest. The tickers should follow the format "EXCHANGE:TICKER" (e.g., "NASDAQ:AAPL, NYSE:MSFT").
Import GKD-B Baseline: Imports the "GKD-B Baseline" indicator.
Import GKD-V Volatility/Volume: Imports the "GKD-V Volatility/Volume" indicator.
Import GKD-C Confirmation: Imports the "GKD-C Confirmation" indicator.
Import GKD-C Continuation: Imports the "GKD-C Continuation" indicator.
Initial Capital: Represents the starting account balance for the backtest, denominated in the base currency of the trading account.
Order Size: Determines the quantity of contracts traded in each trade.
Order Type: Specifies the type of order used in the backtest, either "Contracts" or "% Equity."
Commission: Represents the commission per order or transaction cost incurred in each trade.
█ Giga Kaleidoscope Modularized Trading System
Core components of an NNFX algorithmic trading strategy
The NNFX algorithm is built on the principles of trend, momentum, and volatility. There are six core components in the NNFX trading algorithm:
1. Volatility - price volatility; e.g., Average True Range, True Range Double, Close-to-Close, etc.
2. Baseline - a moving average to identify price trend
3. Confirmation 1 - a technical indicator used to identify trends
4. Confirmation 2 - a technical indicator used to identify trends
5. Continuation - a technical indicator used to identify trends
6. Volatility/Volume - a technical indicator used to identify volatility/volume breakouts/breakdown
7. Exit - a technical indicator used to determine when a trend is exhausted
8. Metamorphosis - a technical indicator that produces a compound signal from the combination of other GKD indicators*
*(not part of the NNFX algorithm)
What is Volatility in the NNFX trading system?
In the NNFX (No Nonsense Forex) trading system, ATR (Average True Range) is typically used to measure the volatility of an asset. It is used as a part of the system to help determine the appropriate stop loss and take profit levels for a trade. ATR is calculated by taking the average of the true range values over a specified period.
True range is calculated as the maximum of the following values:
-Current high minus the current low
-Absolute value of the current high minus the previous close
-Absolute value of the current low minus the previous close
ATR is a dynamic indicator that changes with changes in volatility. As volatility increases, the value of ATR increases, and as volatility decreases, the value of ATR decreases. By using ATR in NNFX system, traders can adjust their stop loss and take profit levels according to the volatility of the asset being traded. This helps to ensure that the trade is given enough room to move, while also minimizing potential losses.
Other types of volatility include True Range Double (TRD), Close-to-Close, and Garman-Klass
What is a Baseline indicator?
The baseline is essentially a moving average, and is used to determine the overall direction of the market.
The baseline in the NNFX system is used to filter out trades that are not in line with the long-term trend of the market. The baseline is plotted on the chart along with other indicators, such as the Moving Average (MA), the Relative Strength Index (RSI), and the Average True Range (ATR).
Trades are only taken when the price is in the same direction as the baseline. For example, if the baseline is sloping upwards, only long trades are taken, and if the baseline is sloping downwards, only short trades are taken. This approach helps to ensure that trades are in line with the overall trend of the market, and reduces the risk of entering trades that are likely to fail.
By using a baseline in the NNFX system, traders can have a clear reference point for determining the overall trend of the market, and can make more informed trading decisions. The baseline helps to filter out noise and false signals, and ensures that trades are taken in the direction of the long-term trend.
What is a Confirmation indicator?
Confirmation indicators are technical indicators that are used to confirm the signals generated by primary indicators. Primary indicators are the core indicators used in the NNFX system, such as the Average True Range (ATR), the Moving Average (MA), and the Relative Strength Index (RSI).
The purpose of the confirmation indicators is to reduce false signals and improve the accuracy of the trading system. They are designed to confirm the signals generated by the primary indicators by providing additional information about the strength and direction of the trend.
Some examples of confirmation indicators that may be used in the NNFX system include the Bollinger Bands, the MACD (Moving Average Convergence Divergence), and the MACD Oscillator. These indicators can provide information about the volatility, momentum, and trend strength of the market, and can be used to confirm the signals generated by the primary indicators.
In the NNFX system, confirmation indicators are used in combination with primary indicators and other filters to create a trading system that is robust and reliable. By using multiple indicators to confirm trading signals, the system aims to reduce the risk of false signals and improve the overall profitability of the trades.
What is a Continuation indicator?
In the NNFX (No Nonsense Forex) trading system, a continuation indicator is a technical indicator that is used to confirm a current trend and predict that the trend is likely to continue in the same direction. A continuation indicator is typically used in conjunction with other indicators in the system, such as a baseline indicator, to provide a comprehensive trading strategy.
What is a Volatility/Volume indicator?
Volume indicators, such as the On Balance Volume (OBV), the Chaikin Money Flow (CMF), or the Volume Price Trend (VPT), are used to measure the amount of buying and selling activity in a market. They are based on the trading volume of the market, and can provide information about the strength of the trend. In the NNFX system, volume indicators are used to confirm trading signals generated by the Moving Average and the Relative Strength Index. Volatility indicators include Average Direction Index, Waddah Attar, and Volatility Ratio. In the NNFX trading system, volatility is a proxy for volume and vice versa.
By using volume indicators as confirmation tools, the NNFX trading system aims to reduce the risk of false signals and improve the overall profitability of trades. These indicators can provide additional information about the market that is not captured by the primary indicators, and can help traders to make more informed trading decisions. In addition, volume indicators can be used to identify potential changes in market trends and to confirm the strength of price movements.
What is an Exit indicator?
The exit indicator is used in conjunction with other indicators in the system, such as the Moving Average (MA), the Relative Strength Index (RSI), and the Average True Range (ATR), to provide a comprehensive trading strategy.
The exit indicator in the NNFX system can be any technical indicator that is deemed effective at identifying optimal exit points. Examples of exit indicators that are commonly used include the Parabolic SAR, the Average Directional Index (ADX), and the Chandelier Exit.
The purpose of the exit indicator is to identify when a trend is likely to reverse or when the market conditions have changed, signaling the need to exit a trade. By using an exit indicator, traders can manage their risk and prevent significant losses.
In the NNFX system, the exit indicator is used in conjunction with a stop loss and a take profit order to maximize profits and minimize losses. The stop loss order is used to limit the amount of loss that can be incurred if the trade goes against the trader, while the take profit order is used to lock in profits when the trade is moving in the trader's favor.
Overall, the use of an exit indicator in the NNFX trading system is an important component of a comprehensive trading strategy. It allows traders to manage their risk effectively and improve the profitability of their trades by exiting at the right time.
What is an Metamorphosis indicator?
The concept of a metamorphosis indicator involves the integration of two or more GKD indicators to generate a compound signal. This is achieved by evaluating the accuracy of each indicator and selecting the signal from the indicator with the highest accuracy. As an illustration, let's consider a scenario where we calculate the accuracy of 10 indicators and choose the signal from the indicator that demonstrates the highest accuracy.
The resulting output from the metamorphosis indicator can then be utilized in a GKD-BT backtest by occupying a slot that aligns with the purpose of the metamorphosis indicator. The slot can be a GKD-B, GKD-C, or GKD-E slot, depending on the specific requirements and objectives of the indicator. This allows for seamless integration and utilization of the compound signal within the GKD-BT framework.
How does Loxx's GKD (Giga Kaleidoscope Modularized Trading System) implement the NNFX algorithm outlined above?
Loxx's GKD v2.0 system has five types of modules (indicators/strategies). These modules are:
1. GKD-BT - Backtesting module (Volatility, Number 1 in the NNFX algorithm)
2. GKD-B - Baseline module (Baseline and Volatility/Volume, Numbers 1 and 2 in the NNFX algorithm)
3. GKD-C - Confirmation 1/2 and Continuation module (Confirmation 1/2 and Continuation, Numbers 3, 4, and 5 in the NNFX algorithm)
4. GKD-V - Volatility/Volume module (Confirmation 1/2, Number 6 in the NNFX algorithm)
5. GKD-E - Exit module (Exit, Number 7 in the NNFX algorithm)
6. GKD-M - Metamorphosis module (Metamorphosis, Number 8 in the NNFX algorithm, but not part of the NNFX algorithm)
(additional module types will added in future releases)
Each module interacts with every module by passing data to A backtest module wherein the various components of the GKD system are combined to create a trading signal.
That is, the Baseline indicator passes its data to Volatility/Volume. The Volatility/Volume indicator passes its values to the Confirmation 1 indicator. The Confirmation 1 indicator passes its values to the Confirmation 2 indicator. The Confirmation 2 indicator passes its values to the Continuation indicator. The Continuation indicator passes its values to the Exit indicator, and finally, the Exit indicator passes its values to the Backtest strategy.
This chaining of indicators requires that each module conform to Loxx's GKD protocol, therefore allowing for the testing of every possible combination of technical indicators that make up the six components of the NNFX algorithm.
What does the application of the GKD trading system look like?
Example trading system:
Backtest: Multi-Ticker CC Backtest as shown on the chart above
Baseline: Hull Moving Average
Volatility/Volume: Hurst Exponent
Confirmation 1: Fisher Transform as shown on the chart above
Confirmation 2: uf2018 as shown on the chart above
Continuation: Coppock Curve
Exit: Rex Oscillator
Metamorphosis: Baseline Optimizer
Each GKD indicator is denoted with a module identifier of either: GKD-BT, GKD-B, GKD-C, GKD-V, GKD-M, or GKD-E. This allows traders to understand to which module each indicator belongs and where each indicator fits into the GKD system.
█ Giga Kaleidoscope Modularized Trading System Signals
Standard Entry
1. GKD-C Confirmation gives signal
2. Baseline agrees
3. Price inside Goldie Locks Zone Minimum
4. Price inside Goldie Locks Zone Maximum
5. Confirmation 2 agrees
6. Volatility/Volume agrees
1-Candle Standard Entry
1a. GKD-C Confirmation gives signal
2a. Baseline agrees
3a. Price inside Goldie Locks Zone Minimum
4a. Price inside Goldie Locks Zone Maximum
Next Candle
1b. Price retraced
2b. Baseline agrees
3b. Confirmation 1 agrees
4b. Confirmation 2 agrees
5b. Volatility/Volume agrees
Baseline Entry
1. GKD-B Baseline gives signal
2. Confirmation 1 agrees
3. Price inside Goldie Locks Zone Minimum
4. Price inside Goldie Locks Zone Maximum
5. Confirmation 2 agrees
6. Volatility/Volume agrees
7. Confirmation 1 signal was less than 'Maximum Allowable PSBC Bars Back' prior
1-Candle Baseline Entry
1a. GKD-B Baseline gives signal
2a. Confirmation 1 agrees
3a. Price inside Goldie Locks Zone Minimum
4a. Price inside Goldie Locks Zone Maximum
5a. Confirmation 1 signal was less than 'Maximum Allowable PSBC Bars Back' prior
Next Candle
1b. Price retraced
2b. Baseline agrees
3b. Confirmation 1 agrees
4b. Confirmation 2 agrees
5b. Volatility/Volume agrees
Volatility/Volume Entry
1. GKD-V Volatility/Volume gives signal
2. Confirmation 1 agrees
3. Price inside Goldie Locks Zone Minimum
4. Price inside Goldie Locks Zone Maximum
5. Confirmation 2 agrees
6. Baseline agrees
7. Confirmation 1 signal was less than 7 candles prior
1-Candle Volatility/Volume Entry
1a. GKD-V Volatility/Volume gives signal
2a. Confirmation 1 agrees
3a. Price inside Goldie Locks Zone Minimum
4a. Price inside Goldie Locks Zone Maximum
5a. Confirmation 1 signal was less than 'Maximum Allowable PSVVC Bars Back' prior
Next Candle
1b. Price retraced
2b. Volatility/Volume agrees
3b. Confirmation 1 agrees
4b. Confirmation 2 agrees
5b. Baseline agrees
Confirmation 2 Entry
1. GKD-C Confirmation 2 gives signal
2. Confirmation 1 agrees
3. Price inside Goldie Locks Zone Minimum
4. Price inside Goldie Locks Zone Maximum
5. Volatility/Volume agrees
6. Baseline agrees
7. Confirmation 1 signal was less than 7 candles prior
1-Candle Confirmation 2 Entry
1a. GKD-C Confirmation 2 gives signal
2a. Confirmation 1 agrees
3a. Price inside Goldie Locks Zone Minimum
4a. Price inside Goldie Locks Zone Maximum
5a. Confirmation 1 signal was less than 'Maximum Allowable PSC2C Bars Back' prior
Next Candle
1b. Price retraced
2b. Confirmation 2 agrees
3b. Confirmation 1 agrees
4b. Volatility/Volume agrees
5b. Baseline agrees
PullBack Entry
1a. GKD-B Baseline gives signal
2a. Confirmation 1 agrees
3a. Price is beyond 1.0x Volatility of Baseline
Next Candle
1b. Price inside Goldie Locks Zone Minimum
2b. Price inside Goldie Locks Zone Maximum
3b. Confirmation 1 agrees
4b. Confirmation 2 agrees
5b. Volatility/Volume agrees
Continuation Entry
1. Standard Entry, 1-Candle Standard Entry, Baseline Entry, 1-Candle Baseline Entry, Volatility/Volume Entry, 1-Candle Volatility/Volume Entry, Confirmation 2 Entry, 1-Candle Confirmation 2 Entry, or Pullback entry triggered previously
2. Baseline hasn't crossed since entry signal trigger
4. Confirmation 1 agrees
5. Baseline agrees
6. Confirmation 2 agrees
█ Connecting to Backtests
All GKD indicators are chained indicators meaning you export the value of the indicators to specialized backtest to creat your GKD trading system. Each indicator contains a proprietary signal generation algo that will only work with GKD backtests. You can find these backtests using the links below.
GKD-BT Giga Confirmation Stack Backtest
GKD-BT Giga Stacks Backtest
GKD-BT Full Giga Kaleidoscope Backtest
GKD-BT Solo Confirmation Super Complex Backtest
GKD-BT Solo Confirmation Complex Backtest
GKD-BT Solo Confirmation Simple Backtest
GKD-M Baseline Optimizer
GKD-M Accuracy Alchemist
GKD-BT Multi-Ticker SCC Backtest
GKD-BT Multi-Ticker SCS Backtest
GKD-BT Multi-Ticker SCS Backtest
GKD-BT Multi-Ticker Full GKD Backtest
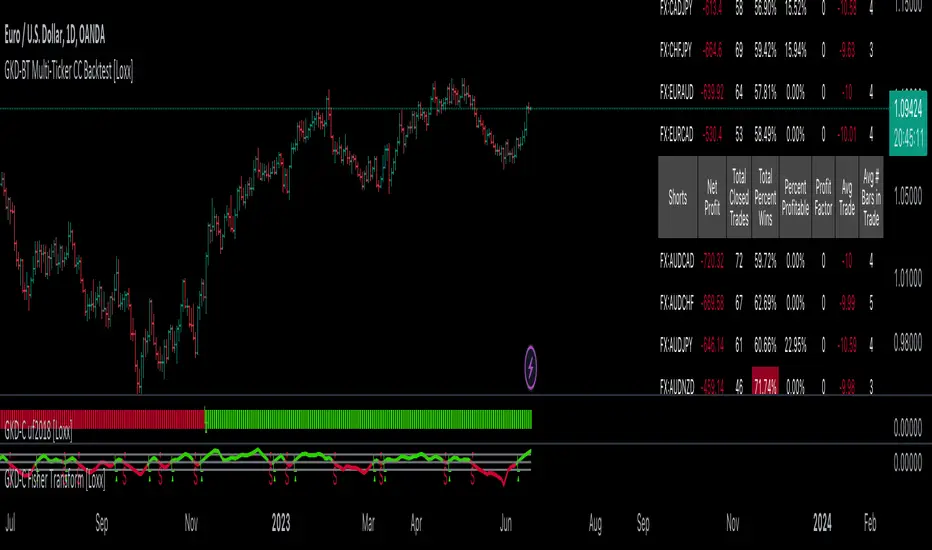
GKD-C Adaptive-Lookback Variety RSI [Loxx]Giga Kaleidoscope GKD-C Adaptive-Lookback Variety RSI is a Confirmation module included in Loxx's "Giga Kaleidoscope Modularized Trading System".
█ GKD-C Adaptive-Lookback Variety RSI
What is the Adaptive Lookback Period?
The adaptive lookback period is a technique used in technical analysis to adjust the period of an indicator based on changes in market conditions. This technique is particularly useful in volatile or rapidly changing markets where a fixed period may not be optimal for detecting trends or signals.
The concept of the adaptive lookback period is relatively simple. By adjusting the lookback period based on changes in market conditions, traders can more accurately identify trends and signals. This can help traders to enter and exit trades at the right time and improve the profitability of their trading strategies.
The adaptive lookback period works by identifying potential swing points in the market. Once these points are identified, the lookback period is calculated based on the number of swings and a speed parameter. The swing count parameter determines the number of swings that must occur before the lookback period is adjusted. The speed parameter controls the rate at which the lookback period is adjusted, with higher values indicating a more rapid adjustment.
The adaptive lookback period can be applied to a wide range of technical indicators, including moving averages, oscillators, and trendlines. By adjusting the period of these indicators based on changes in market conditions, traders can reduce the impact of noise and false signals, leading to more profitable trades.
In summary, the adaptive lookback period is a powerful technique for traders and analysts looking to optimize their technical indicators. By adjusting the period based on changes in market conditions, traders can more accurately identify trends and signals, leading to more profitable trades. While there are various ways to implement the adaptive lookback period, the basic concept remains the same, and traders can adapt and customize the technique to suit their individual needs and trading styles.
This indicator includes 10 types of RSI
1. Regular RSI
2. Slow RSI
3. Ehlers Smoothed RSI
4. Cutler's RSI
5. Rapid RSI
6. Harris' RSI
7. RSI DEMA
8. RSI TEMA
9. RSI T3
10. Jurik RSX
Regular RSI
The Relative Strength Index (RSI) is a widely used technical indicator in the field of financial market analysis. Developed by J. Welles Wilder Jr. in 1978, the RSI is a momentum oscillator that measures the speed and change of price movements. It helps traders identify potential trend reversals, overbought, and oversold conditions in a market.
The RSI is calculated based on the average gains and losses of an asset over a specified period, typically 14 days. The formula for calculating the RSI is as follows:
RSI = 100 - (100 / (1 + RS))
Where:
RS (Relative Strength) = Average gain over the specified period / Average loss over the specified period
The RSI ranges from 0 to 100, with values above 70 generally considered overbought (potentially indicating that the asset is overvalued and may experience a price decline) and values below 30 considered oversold (potentially indicating that the asset is undervalued and may experience a price increase).
Slow RSI
Slow RSI is a modified version of the Relative Strength Index (RSI) indicator that aims to provide a smoother, more consistent signal than the traditional RSI. The Slow RSI is designed to be less sensitive to sudden price movements, which can cause false signals.
To calculate Slow RSI, we first calculate the up and down values, just like in traditional RSI and Ehlers RSI. The up and down values are calculated by comparing the current price to the previous price, and then adding up the positive and negative differences.
Next, we calculate the Slow RSI value using the formula:
SlowRSI = 100 * up / (up + dn)
where "up" and "dn" are the total positive and negative differences, respectively.
This formula is similar to the one used in traditional RSI, but the dynamic lookback period based on the average of the up and down values is used to smooth out the signal.
Finally, we apply smoothing to the Slow RSI value by taking an exponential moving average (EMA) of the Slow RSI values over a specified period. This EMA helps to reduce the impact of sudden price movements and provide a smoother, more consistent signal over time.
Ehler's Smoothed RSI
Ehlers RSI is a modified version of the Relative Strength Index (RSI) indicator created by John Ehlers, a well-known technical analyst and author. The purpose of Ehlers RSI is to reduce lag and improve the responsiveness of the traditional RSI indicator.
To calculate Ehlers RSI, we first smooth the prices by taking a weighted average of the current price and the two previous prices. This smoothing helps to reduce noise in the data and produce a more accurate signal.
Next, we calculate the up and down values differently than in traditional RSI. In traditional RSI, the up and down values are based on the difference between the current price and the previous price. In Ehlers RSI, the up and down values are based on the difference between the current price and the price two bars ago. This approach helps to reduce lag and produce a more responsive indicator.
Finally, we calculate Ehlers RSI using the formula:
EhlersRSI = 50 * (up - down) / (up + down) + 50
The result is a more timely signal that can help traders identify potential trends and reversals in the market. However, as with any technical indicator, Ehlers RSI should be used in conjunction with other analysis tools and should not be relied on as the sole basis for trading decisions.
Cutler's RSI
Cutler's RSI (Relative Strength Index) is a variation of the traditional RSI, a popular technical analysis indicator used to measure the speed and change of price movements. The main difference between Cutler's RSI and the traditional RSI is the calculation method used to smooth the data. While the traditional RSI uses an exponential moving average (EMA) to smooth the data, Cutler's RSI uses a simple moving average (SMA).
Here's the formula for Cutler's RSI:
1. Calculate the price change: Price Change = Current Price - Previous Price
2. Calculate the average gain and average loss over a specified period (usually 14 days):
If Price Change > 0, add it to the total gains.
If Price Change < 0, add the absolute value to the total losses.
3. Calculate the average gain and average loss by dividing the totals by the specified period: Average Gain = Total Gains / Period, Average Loss = Total Losses / Period
4. Calculate the Relative Strength (RS): RS = Average Gain / Average Loss
5. Calculate Cutler's RSI: Cutler's RSI = 100 - (100 / (1 + RS))
Cutler's RSI is not necessarily better than the regular RSI; it's just a different variation of the traditional RSI that uses a simple moving average (SMA) instead of an exponential moving average (EMA) quantifiedstrategies.com. The main advantage of Cutler's RSI is that it is not data length dependent, meaning it returns consistent results regardless of the length of the period, or the starting point within a data file quantifiedstrategies.com.
However, it's worth noting that Cutler's RSI does not necessarily outperform the traditional RSI. In fact, backtests reveal that Cutler's RSI is no improvement compared to Wilder's RSI quantifiedstrategies.com. Additionally, using an SMA instead of an EMA in Cutler's RSI may result in the loss of the "believed" advantage of weighting the most recent price action aaii.com.
Both Cutler's RSI and the traditional RSI can be used to identify overbought/oversold levels, support and resistance, spot divergences for possible reversals, and confirm the signals from other indicators investopedia.com. Ultimately, the choice between Cutler's RSI and the traditional RSI depends on personal preference and the specific trading strategy being employed.
Rapid RSI
Rapid RSI is a technical analysis indicator that is a modified version of the Relative Strength Index (RSI). It was developed by Andrew Cardwell and was first introduced in the October 2006 issue of Technical Analysis of Stocks & Commodities magazine.
The Rapid RSI improves upon the regular RSI by modifying the way the average gains and losses are calculated. Here's a general breakdown of the Rapid RSI calculation:
1. Calculate the upward change (when the price has increased) and the downward change (when the price has decreased) for each period.
2. Calculate the simple moving average (SMA) of the upward changes and the SMA of the downward changes over the specified period.
3. Divide the SMA of the upward changes by the SMA of the downward changes to get the relative strength (RS).
4. Calculate the Rapid RSI by transforming the relative strength (RS) into a value ranging from 0 to 100.
By using the simple moving average (SMA) instead of the slow exponential moving average (RMA) as in the regular RSI, the Rapid RSI tends to be more responsive to recent price changes. This can help traders identify overbought and oversold conditions more quickly, potentially leading to earlier entry and exit points. However, it is important to note that a faster indicator may also produce more false signals.
Harris' RSI
Harris RSI (Relative Strength Index) is a technical indicator used in financial analysis to measure the strength or weakness of a security over time. It was developed by Larry Harris in 1986 as an alternative to the traditional RSI, which measures the price change of a security over a given period.
The Harris RSI uses a slightly different formula from the traditional RSI, but it is based on the same principles. It calculates the ratio of the average gain to the average loss over a specified period, typically 14 days. The result is then plotted on a scale of 0 to 100, with high values indicating overbought conditions and low values indicating oversold conditions.
The Harris RSI is believed to be more responsive to short-term price movements than the traditional RSI, making it useful for traders who are looking for quick trading opportunities. However, like any technical indicator, it should be used in conjunction with other forms of analysis to make informed trading decisions.
The calculation of the Harris RSI involves several steps:
1. Calculate the price change over the specified period (usually 14 days) using the following formula:
Price Change = Close Price - Prior Close Price
2. Calculate the average gain and average loss over the same period, using separate formulas for each:
Average Gain = (Sum of Gains over the Period) / Period
Average Loss = (Sum of Losses over the Period) / Period
Gains are calculated as the sum of all positive price changes over the period, while losses are calculated as the sum of all negative price changes over the period.
3. Calculate the Relative Strength (RS) as the ratio of the Average Gain to the Average Loss:
RS = Average Gain / Average Loss
4. Calculate the Harris RSI using the following formula:
Harris RSI = 100 - (100 / (1 + RS))
The resulting Harris RSI value is a number between 0 and 100, which is plotted on a chart to identify overbought or oversold conditions in the security. A value above 70 is generally considered overbought, while a value below 30 is generally considered oversold.
DEMA RSI
DEMA RSI is a variation of the Relative Strength Index (RSI) technical indicator that incorporates the Double Exponential Moving Average (DEMA) for smoothing. Like the regular RSI, the DEMA RSI is a momentum oscillator used to measure the speed and change of price movements, and it ranges from 0 to 100. Readings below 30 typically indicate oversold conditions, while readings above 70 indicate overbought conditions.
The DEMA RSI aims to improve upon the regular RSI by addressing its limitations, such as lag and false signals. By using the DEMA, a more responsive and faster RSI can be achieved. Here's a general breakdown of the DEMA RSI calculation:
1. Calculate the price change for each period, as well as the absolute value of the change.
2. Apply the DEMA smoothing technique to both the price change and its absolute value, separately. This involves calculating two sets of exponential moving averages and combining them to create a double-weighted moving average with reduced lag.
3. Divide the smoothed price change by the smoothed absolute value of the price change.
4. Transform the result into a value ranging from 0 to 100 to obtain the DEMA RSI.
The DEMA RSI is considered an improvement over the regular RSI because it provides faster and more responsive signals. This can help traders identify overbought and oversold conditions more accurately and potentially avoid false signals.
In summary, the main advantages of these RSI variations over the regular RSI are their ability to reduce noise, provide smoother lines, and be more responsive to price changes. This can lead to more accurate signals and fewer false positives in different market conditions.
TEMA RSI
TEMA RSI is a variation of the Relative Strength Index (RSI) technical indicator that incorporates the Triple Exponential Moving Average (TEMA) for smoothing. Like the regular RSI, the TEMA RSI is a momentum oscillator used to measure the speed and change of price movements, and it ranges from 0 to 100. Readings below 30 typically indicate oversold conditions, while readings above 70 indicate overbought conditions.
The TEMA RSI aims to improve upon the regular RSI by addressing its limitations, such as lag and false signals. By using the TEMA, a more responsive and faster RSI can be achieved. Here's a general breakdown of the TEMA RSI calculation:
1. Calculate the price change for each period, as well as the absolute value of the change.
2. Apply the TEMA smoothing technique to both the price change and its absolute value, separately. This involves calculating two sets of exponential moving averages and combining them to create a double-weighted moving average with reduced lag.
3. Divide the smoothed price change by the smoothed absolute value of the price change.
4. Transform the result into a value ranging from 0 to 100 to obtain the TEMA RSI.
The TEMA RSI is considered an improvement over the regular RSI because it provides faster and more responsive signals. This can help traders identify overbought and oversold conditions more accurately and potentially avoid false signals.
T3 RSI
T3 RSI is a variation of the Relative Strength Index (RSI) technical indicator that incorporates the Tilson T3 for smoothing. Like the regular RSI, the T3 RSI is a momentum oscillator used to measure the speed and change of price movements, and it ranges from 0 to 100. Readings below 30 typically indicate oversold conditions, while readings above 70 indicate overbought conditions.
The T3 RSI aims to improve upon the regular RSI by addressing its limitations, such as lag and false signals. By using the T3, a more responsive and faster RSI can be achieved. Here's a general breakdown of the T3 RSI calculation:
1. Calculate the price change for each period, as well as the absolute value of the change.
2. Apply the T3 smoothing technique to both the price change and its absolute value, separately. This involves calculating two sets of exponential moving averages and combining them to create a double-weighted moving average with reduced lag.
3. Divide the smoothed price change by the smoothed absolute value of the price change.
4. Transform the result into a value ranging from 0 to 100 to obtain the T3 RSI.
The T3 RSI is considered an improvement over the regular RSI because it provides faster and more responsive signals. This can help traders identify overbought and oversold conditions more accurately and potentially avoid false signals.
Jurik RSX
The Jurik RSX is a technical indicator developed by Mark Jurik to measure the momentum and strength of price movements in financial markets, such as stocks, commodities, and currencies. It is an advanced version of the traditional Relative Strength Index (RSI), designed to offer smoother and less lagging signals compared to the standard RSI.
The main advantage of the Jurik RSX is that it provides more accurate and timely signals for traders and analysts, thanks to its improved calculation methods that reduce noise and lag in the indicator's output. This enables better decision-making when analyzing market trends and potential trading opportunities.
What is Adaptive-Lookback Variety RSI
This indicator allows the user to select from 9 different RSI types and 33 source types. The various RSI types is enhanced by injecting an adaptive lookback period into the caculation making the RSI able to adaptive to differing market conditions.
Additional Features
This indicator allows you to select from 33 source types. They are as follows:
Close
Open
High
Low
Median
Typical
Weighted
Average
Average Median Body
Trend Biased
Trend Biased (Extreme)
HA Close
HA Open
HA High
HA Low
HA Median
HA Typical
HA Weighted
HA Average
HA Average Median Body
HA Trend Biased
HA Trend Biased (Extreme)
HAB Close
HAB Open
HAB High
HAB Low
HAB Median
HAB Typical
HAB Weighted
HAB Average
HAB Average Median Body
HAB Trend Biased
HAB Trend Biased (Extreme)
What are Heiken Ashi "better" candles?
Heiken Ashi "better" candles are a modified version of the standard Heiken Ashi candles, which are a popular charting technique used in technical analysis. Heiken Ashi candles help traders identify trends and potential reversal points by smoothing out price data and reducing market noise. The "better formula" was proposed by Sebastian Schmidt in an article published by BNP Paribas in Warrants & Zertifikate, a German magazine, in August 2004. The aim of this formula is to further improve the smoothing of the Heiken Ashi chart and enhance its effectiveness in identifying trends and reversals.
Standard Heiken Ashi candles are calculated using the following formulas:
Heiken Ashi Close = (Open + High + Low + Close) / 4
Heiken Ashi Open = (Previous Heiken Ashi Open + Previous Heiken Ashi Close) / 2
Heiken Ashi High = Max (High, Heiken Ashi Open, Heiken Ashi Close)
Heiken Ashi Low = Min (Low, Heiken Ashi Open, Heiken Ashi Close)
The "better formula" modifies the standard Heiken Ashi calculation by incorporating additional smoothing, which can help reduce noise and make it easier to identify trends and reversals. The modified formulas for Heiken Ashi "better" candles are as follows:
Better Heiken Ashi Close = (Open + High + Low + Close) / 4
Better Heiken Ashi Open = (Previous Better Heiken Ashi Open + Previous Better Heiken Ashi Close) / 2
Better Heiken Ashi High = Max (High, Better Heiken Ashi Open, Better Heiken Ashi Close)
Better Heiken Ashi Low = Min (Low, Better Heiken Ashi Open, Better Heiken Ashi Close)
Smoothing Factor = 2 / (N + 1), where N is the chosen period for smoothing
Smoothed Better Heiken Ashi Open = (Better Heiken Ashi Open * Smoothing Factor) + (Previous Smoothed Better Heiken Ashi Open * (1 - Smoothing Factor))
Smoothed Better Heiken Ashi Close = (Better Heiken Ashi Close * Smoothing Factor) + (Previous Smoothed Better Heiken Ashi Close * (1 - Smoothing Factor))
The smoothed Better Heiken Ashi Open and Close values are then used to calculate the smoothed Better Heiken Ashi High and Low values, resulting in "better" candles that provide a clearer representation of the market trend and potential reversal points.
It's important to note that, like any other technical analysis tool, Heiken Ashi "better" candles are not foolproof and should be used in conjunction with other indicators and analysis techniques to make well-informed trading decisions.
Heiken Ashi "better" candles, as mentioned previously, provide a clearer representation of market trends and potential reversal points by reducing noise and smoothing out price data. When using these candles in conjunction with other technical analysis tools and indicators, traders can gain valuable insights into market behavior and make more informed decisions.
To effectively use Heiken Ashi "better" candles in your trading strategy, consider the following tips:
Trend Identification: Heiken Ashi "better" candles can help you identify the prevailing trend in the market. When the majority of the candles are green (or another color, depending on your chart settings) and there are no or few lower wicks, it may indicate a strong uptrend. Conversely, when the majority of the candles are red (or another color) and there are no or few upper wicks, it may signal a strong downtrend.
Trend Reversals: Look for potential trend reversals when a change in the color of the candles occurs, especially when accompanied by longer wicks. For example, if a green candle with a long lower wick is followed by a red candle, it could indicate a bearish reversal. Similarly, a red candle with a long upper wick followed by a green candle may suggest a bullish reversal.
Support and Resistance: You can use Heiken Ashi "better" candles to identify potential support and resistance levels. When the candles are consistently moving in one direction and then suddenly change color with longer wicks, it could indicate the presence of a support or resistance level.
Stop-Loss and Take-Profit: Using Heiken Ashi "better" candles can help you manage risk by determining optimal stop-loss and take-profit levels. For instance, you can place your stop-loss below the low of the most recent green candle in an uptrend or above the high of the most recent red candle in a downtrend.
Confirming Signals: Heiken Ashi "better" candles should be used in conjunction with other technical indicators, such as moving averages, oscillators, or chart patterns, to confirm signals and improve the accuracy of your analysis.
In this implementation, you have the choice of AMA, KAMA, or T3 smoothing. These are as follows:
Kaufman Adaptive Moving Average (KAMA)
The Kaufman Adaptive Moving Average (KAMA) is a type of adaptive moving average used in technical analysis to smooth out price fluctuations and identify trends. The KAMA adjusts its smoothing factor based on the market's volatility, making it more responsive in volatile markets and smoother in calm markets. The KAMA is calculated using three different efficiency ratios that determine the appropriate smoothing factor for the current market conditions. These ratios are based on the noise level of the market, the speed at which the market is moving, and the length of the moving average. The KAMA is a popular choice among traders who prefer to use adaptive indicators to identify trends and potential reversals.
Adaptive Moving Average
The Adaptive Moving Average (AMA) is a type of moving average that adjusts its sensitivity to price movements based on market conditions. It uses a ratio between the current price and the highest and lowest prices over a certain lookback period to determine its level of smoothing. The AMA can help reduce lag and increase responsiveness to changes in trend direction, making it useful for traders who want to follow trends while avoiding false signals. The AMA is calculated by multiplying a smoothing constant with the difference between the current price and the previous AMA value, then adding the result to the previous AMA value.
T3
The T3 moving average is a type of technical indicator used in financial analysis to identify trends in price movements. It is similar to the Exponential Moving Average (EMA) and the Double Exponential Moving Average (DEMA), but uses a different smoothing algorithm.
The T3 moving average is calculated using a series of exponential moving averages that are designed to filter out noise and smooth the data. The resulting smoothed data is then weighted with a non-linear function to produce a final output that is more responsive to changes in trend direction.
The T3 moving average can be customized by adjusting the length of the moving average, as well as the weighting function used to smooth the data. It is commonly used in conjunction with other technical indicators as part of a larger trading strategy.
█ Giga Kaleidoscope Modularized Trading System
Core components of an NNFX algorithmic trading strategy
The NNFX algorithm is built on the principles of trend, momentum, and volatility. There are six core components in the NNFX trading algorithm:
1. Volatility - price volatility; e.g., Average True Range, True Range Double, Close-to-Close, etc.
2. Baseline - a moving average to identify price trend
3. Confirmation 1 - a technical indicator used to identify trends
4. Confirmation 2 - a technical indicator used to identify trends
5. Continuation - a technical indicator used to identify trends
6. Volatility/Volume - a technical indicator used to identify volatility/volume breakouts/breakdown
7. Exit - a technical indicator used to determine when a trend is exhausted
What is Volatility in the NNFX trading system?
In the NNFX (No Nonsense Forex) trading system, ATR (Average True Range) is typically used to measure the volatility of an asset. It is used as a part of the system to help determine the appropriate stop loss and take profit levels for a trade. ATR is calculated by taking the average of the true range values over a specified period.
True range is calculated as the maximum of the following values:
-Current high minus the current low
-Absolute value of the current high minus the previous close
-Absolute value of the current low minus the previous close
ATR is a dynamic indicator that changes with changes in volatility. As volatility increases, the value of ATR increases, and as volatility decreases, the value of ATR decreases. By using ATR in NNFX system, traders can adjust their stop loss and take profit levels according to the volatility of the asset being traded. This helps to ensure that the trade is given enough room to move, while also minimizing potential losses.
Other types of volatility include True Range Double (TRD), Close-to-Close, and Garman-Klass
What is a Baseline indicator?
The baseline is essentially a moving average, and is used to determine the overall direction of the market.
The baseline in the NNFX system is used to filter out trades that are not in line with the long-term trend of the market. The baseline is plotted on the chart along with other indicators, such as the Moving Average (MA), the Relative Strength Index (RSI), and the Average True Range (ATR).
Trades are only taken when the price is in the same direction as the baseline. For example, if the baseline is sloping upwards, only long trades are taken, and if the baseline is sloping downwards, only short trades are taken. This approach helps to ensure that trades are in line with the overall trend of the market, and reduces the risk of entering trades that are likely to fail.
By using a baseline in the NNFX system, traders can have a clear reference point for determining the overall trend of the market, and can make more informed trading decisions. The baseline helps to filter out noise and false signals, and ensures that trades are taken in the direction of the long-term trend.
What is a Confirmation indicator?
Confirmation indicators are technical indicators that are used to confirm the signals generated by primary indicators. Primary indicators are the core indicators used in the NNFX system, such as the Average True Range (ATR), the Moving Average (MA), and the Relative Strength Index (RSI).
The purpose of the confirmation indicators is to reduce false signals and improve the accuracy of the trading system. They are designed to confirm the signals generated by the primary indicators by providing additional information about the strength and direction of the trend.
Some examples of confirmation indicators that may be used in the NNFX system include the Bollinger Bands, the MACD (Moving Average Convergence Divergence), and the MACD Oscillator. These indicators can provide information about the volatility, momentum, and trend strength of the market, and can be used to confirm the signals generated by the primary indicators.
In the NNFX system, confirmation indicators are used in combination with primary indicators and other filters to create a trading system that is robust and reliable. By using multiple indicators to confirm trading signals, the system aims to reduce the risk of false signals and improve the overall profitability of the trades.
What is a Continuation indicator?
In the NNFX (No Nonsense Forex) trading system, a continuation indicator is a technical indicator that is used to confirm a current trend and predict that the trend is likely to continue in the same direction. A continuation indicator is typically used in conjunction with other indicators in the system, such as a baseline indicator, to provide a comprehensive trading strategy.
What is a Volatility/Volume indicator?
Volume indicators, such as the On Balance Volume (OBV), the Chaikin Money Flow (CMF), or the Volume Price Trend (VPT), are used to measure the amount of buying and selling activity in a market. They are based on the trading volume of the market, and can provide information about the strength of the trend. In the NNFX system, volume indicators are used to confirm trading signals generated by the Moving Average and the Relative Strength Index. Volatility indicators include Average Direction Index, Waddah Attar, and Volatility Ratio. In the NNFX trading system, volatility is a proxy for volume and vice versa.
By using volume indicators as confirmation tools, the NNFX trading system aims to reduce the risk of false signals and improve the overall profitability of trades. These indicators can provide additional information about the market that is not captured by the primary indicators, and can help traders to make more informed trading decisions. In addition, volume indicators can be used to identify potential changes in market trends and to confirm the strength of price movements.
What is an Exit indicator?
The exit indicator is used in conjunction with other indicators in the system, such as the Moving Average (MA), the Relative Strength Index (RSI), and the Average True Range (ATR), to provide a comprehensive trading strategy.
The exit indicator in the NNFX system can be any technical indicator that is deemed effective at identifying optimal exit points. Examples of exit indicators that are commonly used include the Parabolic SAR, the Average Directional Index (ADX), and the Chandelier Exit.
The purpose of the exit indicator is to identify when a trend is likely to reverse or when the market conditions have changed, signaling the need to exit a trade. By using an exit indicator, traders can manage their risk and prevent significant losses.
In the NNFX system, the exit indicator is used in conjunction with a stop loss and a take profit order to maximize profits and minimize losses. The stop loss order is used to limit the amount of loss that can be incurred if the trade goes against the trader, while the take profit order is used to lock in profits when the trade is moving in the trader's favor.
Overall, the use of an exit indicator in the NNFX trading system is an important component of a comprehensive trading strategy. It allows traders to manage their risk effectively and improve the profitability of their trades by exiting at the right time.
How does Loxx's GKD (Giga Kaleidoscope Modularized Trading System) implement the NNFX algorithm outlined above?
Loxx's GKD v1.0 system has five types of modules (indicators/strategies). These modules are:
1. GKD-BT - Backtesting module (Volatility, Number 1 in the NNFX algorithm)
2. GKD-B - Baseline module (Baseline and Volatility/Volume, Numbers 1 and 2 in the NNFX algorithm)
3. GKD-C - Confirmation 1/2 and Continuation module (Confirmation 1/2 and Continuation, Numbers 3, 4, and 5 in the NNFX algorithm)
4. GKD-V - Volatility/Volume module (Confirmation 1/2, Number 6 in the NNFX algorithm)
5. GKD-E - Exit module (Exit, Number 7 in the NNFX algorithm)
(additional module types will added in future releases)
Each module interacts with every module by passing data between modules. Data is passed between each module as described below:
GKD-B => GKD-V => GKD-C(1) => GKD-C(2) => GKD-C(Continuation) => GKD-E => GKD-BT
That is, the Baseline indicator passes its data to Volatility/Volume. The Volatility/Volume indicator passes its values to the Confirmation 1 indicator. The Confirmation 1 indicator passes its values to the Confirmation 2 indicator. The Confirmation 2 indicator passes its values to the Continuation indicator. The Continuation indicator passes its values to the Exit indicator, and finally, the Exit indicator passes its values to the Backtest strategy.
This chaining of indicators requires that each module conform to Loxx's GKD protocol, therefore allowing for the testing of every possible combination of technical indicators that make up the six components of the NNFX algorithm.
What does the application of the GKD trading system look like?
Example trading system:
Backtest: Strategy with 1-3 take profits, trailing stop loss, multiple types of PnL volatility, and 2 backtesting styles
Baseline: Hull Moving Average
Volatility/Volume: Hurst Exponent
Confirmation 1: Adaptive-Lookback Variety RSI as shown on the chart above
Confirmation 2: Williams Percent Range
Continuation: Adaptive-Lookback Variety RSI
Exit: Rex Oscillator
Each GKD indicator is denoted with a module identifier of either: GKD-BT, GKD-B, GKD-C, GKD-V, or GKD-E. This allows traders to understand to which module each indicator belongs and where each indicator fits into the GKD protocol chain.
Giga Kaleidoscope Modularized Trading System Signals (based on the NNFX algorithm)
Standard Entry
1. GKD-C Confirmation 1 Signal
2. GKD-B Baseline agrees
3. Price is within a range of 0.2x Volatility and 1.0x Volatility of the Goldie Locks Mean
4. GKD-C Confirmation 2 agrees
5. GKD-V Volatility/Volume agrees
Baseline Entry
1. GKD-B Baseline signal
2. GKD-C Confirmation 1 agrees
3. Price is within a range of 0.2x Volatility and 1.0x Volatility of the Goldie Locks Mean
4. GKD-C Confirmation 2 agrees
5. GKD-V Volatility/Volume agrees
6. GKD-C Confirmation 1 signal was less than 7 candles prior
Volatility/Volume Entry
1. GKD-V Volatility/Volume signal
2. GKD-C Confirmation 1 agrees
3. Price is within a range of 0.2x Volatility and 1.0x Volatility of the Goldie Locks Mean
4. GKD-C Confirmation 2 agrees
5. GKD-B Baseline agrees
6. GKD-C Confirmation 1 signal was less than 7 candles prior
Continuation Entry
1. Standard Entry, Baseline Entry, or Pullback; entry triggered previously
2. GKD-B Baseline hasn't crossed since entry signal trigger
3. GKD-C Confirmation Continuation Indicator signals
4. GKD-C Confirmation 1 agrees
5. GKD-B Baseline agrees
6. GKD-C Confirmation 2 agrees
1-Candle Rule Standard Entry
1. GKD-C Confirmation 1 signal
2. GKD-B Baseline agrees
3. Price is within a range of 0.2x Volatility and 1.0x Volatility of the Goldie Locks Mean
Next Candle:
1. Price retraced (Long: close < close or Short: close > close )
2. GKD-B Baseline agrees
3. GKD-C Confirmation 1 agrees
4. GKD-C Confirmation 2 agrees
5. GKD-V Volatility/Volume agrees
1-Candle Rule Baseline Entry
1. GKD-B Baseline signal
2. GKD-C Confirmation 1 agrees
3. Price is within a range of 0.2x Volatility and 1.0x Volatility of the Goldie Locks Mean
4. GKD-C Confirmation 1 signal was less than 7 candles prior
Next Candle:
1. Price retraced (Long: close < close or Short: close > close )
2. GKD-B Baseline agrees
3. GKD-C Confirmation 1 agrees
4. GKD-C Confirmation 2 agrees
5. GKD-V Volatility/Volume Agrees
1-Candle Rule Volatility/Volume Entry
1. GKD-V Volatility/Volume signal
2. GKD-C Confirmation 1 agrees
3. Price is within a range of 0.2x Volatility and 1.0x Volatility of the Goldie Locks Mean
4. GKD-C Confirmation 1 signal was less than 7 candles prior
Next Candle:
1. Price retraced (Long: close < close or Short: close > close)
2. GKD-B Volatility/Volume agrees
3. GKD-C Confirmation 1 agrees
4. GKD-C Confirmation 2 agrees
5. GKD-B Baseline agrees
PullBack Entry
1. GKD-B Baseline signal
2. GKD-C Confirmation 1 agrees
3. Price is beyond 1.0x Volatility of Baseline
Next Candle:
1. Price is within a range of 0.2x Volatility and 1.0x Volatility of the Goldie Locks Mean
2. GKD-C Confirmation 1 agrees
3. GKD-C Confirmation 2 agrees
4. GKD-V Volatility/Volume Agrees
]█ Setting up the GKD
The GKD system involves chaining indicators together. These are the steps to set this up.
Use a GKD-C indicator alone on a chart
1. Inside the GKD-C indicator, change the "Confirmation Type" setting to "Solo Confirmation Simple"
Use a GKD-V indicator alone on a chart
**nothing, it's already useable on the chart without any settings changes
Use a GKD-B indicator alone on a chart
**nothing, it's already useable on the chart without any settings changes
Baseline (Baseline, Backtest)
1. Import the GKD-B Baseline into the GKD-BT Backtest: "Input into Volatility/Volume or Backtest (Baseline testing)"
2. Inside the GKD-BT Backtest, change the setting "Backtest Special" to "Baseline"
Volatility/Volume (Volatility/Volume, Backte st)
1. Inside the GKD-V indicator, change the "Testing Type" setting to "Solo"
2. Inside the GKD-V indicator, change the "Signal Type" setting to "Crossing" (neither traditional nor both can be backtested)
3. Import the GKD-V indicator into the GKD-BT Backtest: "Input into C1 or Backtest"
4. Inside the GKD-BT Backtest, change the setting "Backtest Special" to "Volatility/Volume"
5. Inside the GKD-BT Backtest, a) change the setting "Backtest Type" to "Trading" if using a directional GKD-V indicator; or, b) change the setting "Backtest Type" to "Full" if using a directional or non-directional GKD-V indicator (non-directional GKD-V can only test Longs and Shorts separately)
6. If "Backtest Type" is set to "Full": Inside the GKD-BT Backtest, change the setting "Backtest Side" to "Long" or "Short
7. If "Backtest Type" is set to "Full": To allow the system to open multiple orders at one time so you test all Longs or Shorts, open the GKD-BT Backtest, click the tab "Properties" and then insert a value of something like 10 orders into the "Pyramiding" settings. This will allow 10 orders to be opened at one time which should be enough to catch all possible Longs or Shorts.
Solo Confirmation Simple (Confirmation, Backtest)
1. Inside the GKD-C indicator, change the "Confirmation Type" setting to "Solo Confirmation Simple"
1. Import the GKD-C indicator into the GKD-BT Backtest: "Input into Backtest"
2. Inside the GKD-BT Backtest, change the setting "Backtest Special" to "Solo Confirmation Simple"
Solo Confirmation Complex without Exits (Baseline, Volatility/Volume, Confirmation, Backtest)
1. Inside the GKD-V indicator, change the "Testing Type" setting to "Chained"
2. Import the GKD-B Baseline into the GKD-V indicator: "Input into Volatility/Volume or Backtest (Baseline testing)"
3. Inside the GKD-C indicator, change the "Confirmation Type" setting to "Solo Confirmation Complex"
4. Import the GKD-V indicator into the GKD-C indicator: "Input into C1 or Backtest"
5. Inside the GKD-BT Backtest, change the setting "Backtest Special" to "GKD Full wo/ Exits"
6. Import the GKD-C into the GKD-BT Backtest: "Input into Exit or Backtest"
Solo Confirmation Complex with Exits (Baseline, Volatility/Volume, Confirmation, Exit, Backtest)
1. Inside the GKD-V indicator, change the "Testing Type" setting to "Chained"
2. Import the GKD-B Baseline into the GKD-V indicator: "Input into Volatility/Volume or Backtest (Baseline testing)"
3. Inside the GKD-C indicator, change the "Confirmation Type" setting to "Solo Confirmation Complex"
4. Import the GKD-V indicator into the GKD-C indicator: "Input into C1 or Backtest"
5. Import the GKD-C indicator into the GKD-E indicator: "Input into Exit"
6. Inside the GKD-BT Backtest, change the setting "Backtest Special" to "GKD Full w/ Exits"
7. Import the GKD-E into the GKD-BT Backtest: "Input into Backtest"
Full GKD without Exits (Baseline, Volatility/Volume, Confirmation 1, Confirmation 2, Continuation, Backtest)
1. Inside the GKD-V indicator, change the "Testing Type" setting to "Chained"
2. Import the GKD-B Baseline into the GKD-V indicator: "Input into Volatility/Volume or Backtest (Baseline testing)"
3. Inside the GKD-C 1 indicator, change the "Confirmation Type" setting to "Confirmation 1"
4. Import the GKD-V indicator into the GKD-C 1 indicator: "Input into C1 or Backtest"
5. Inside the GKD-C 2 indicator, change the "Confirmation Type" setting to "Confirmation 2"
6. Import the GKD-C 1 indicator into the GKD-C 2 indicator: "Input into C2"
7. Inside the GKD-C Continuation indicator, change the "Confirmation Type" setting to "Continuation"
8. Inside the GKD-BT Backtest, change the setting "Backtest Special" to "GKD Full wo/ Exits"
9. Import the GKD-E into the GKD-BT Backtest: "Input into Exit or Backtest"
Full GKD with Exits (Baseline, Volatility/Volume, Confirmation 1, Confirmation 2, Continuation, Exit, Backtest)
1. Inside the GKD-V indicator, change the "Testing Type" setting to "Chained"
2. Import the GKD-B Baseline into the GKD-V indicator: "Input into Volatility/Volume or Backtest (Baseline testing)"
3. Inside the GKD-C 1 indicator, change the "Confirmation Type" setting to "Confirmation 1"
4. Import the GKD-V indicator into the GKD-C 1 indicator: "Input into C1 or Backtest"
5. Inside the GKD-C 2 indicator, change the "Confirmation Type" setting to "Confirmation 2"
6. Import the GKD-C 1 indicator into the GKD-C 2 indicator: "Input into C2"
7. Inside the GKD-C Continuation indicator, change the "Confirmation Type" setting to "Continuation"
8. Import the GKD-C Continuation indicator into the GKD-E indicator: "Input into Exit"
9. Inside the GKD-BT Backtest, change the setting "Backtest Special" to "GKD Full w/ Exits"
10. Import the GKD-E into the GKD-BT Backtest: "Input into Backtest"
Baseline + Volatility/Volume (Baseline, Volatility/Volume, Backtest)
1. Inside the GKD-V indicator, change the "Testing Type" setting to "Baseline + Volatility/Volume"
2. Inside the GKD-V indicator, make sure the "Signal Type" setting is set to "Traditional"
3. Import the GKD-B Baseline into the GKD-V indicator: "Input into Volatility/Volume or Backtest (Baseline testing)"
4. Inside the GKD-BT Backtest, change the setting "Backtest Special" to "Baseline + Volatility/Volume"
5. Import the GKD-V into the GKD-BT Backtest: "Input into C1 or Backtest"
6. Inside the GKD-BT Backtest, change the setting "Backtest Type" to "Full". For this backtest, you must test Longs and Shorts separately
7. To allow the system to open multiple orders at one time so you can test all Longs or Shorts, open the GKD-BT Backtest, click the tab "Properties" and then insert a value of something like 10 orders into the "Pyramiding" settings. This will allow 10 orders to be opened at one time which should be enough to catch all possible Longs or Shorts.
Requirements
Inputs
Confirmation 1: GKD-V Volatility / Volume indicator
Confirmation 2: GKD-C Confirmation indicator
Continuation: GKD-C Confirmation indicator
Solo Confirmation Simple: GKD-B Baseline
Solo Confirmation Complex: GKD-V Volatility / Volume indicator
Solo Confirmation Super Complex: GKD-V Volatility / Volume indicator
Stacked 1: None
Stacked 2+: GKD-C, GKD-V, or GKD-B Stacked 1
Outputs
Confirmation 1: GKD-C Confirmation 2 indicator
Confirmation 2: GKD-C Continuation indicator
Continuation: GKD-E Exit indicator
Solo Confirmation Simple: GKD-BT Backtest
Solo Confirmation Complex: GKD-BT Backtest or GKD-E Exit indicator
Solo Confirmation Super Complex: GKD-C Continuation indicator
Stacked 1: GKD-C, GKD-V, or GKD-B Stacked 2+
Stacked 2+: GKD-C, GKD-V, or GKD-B Stacked 2+ or GKD-BT Backtest
Additional features will be added in future releases.

GKD-V Cercos Chaos vs Movement [Loxx]Giga Kaleidoscope GKD-V Cercos Chaos vs Movement is a Volatility/Volume module included in Loxx's "Giga Kaleidoscope Modularized Trading System".
█ GKD-V Cercos Chaos vs Movement
The following aims to provide a detailed explanation of Cercos Chaos vs Movement that helps traders determine market volatility by comparing two different measures: Buffer Move and Buffer Chaos. This indicator is non-directional and should be paired with a directional indicator to provide trading signals.
The first step in the process is defining a custom function that implements a variant of the sigmoid function. This function has a parameter that allows the output to be limited to the range of if desired. The sigmoid function will later be used to normalize the Buffer Chaos value.
Next, several input parameters are introduced, which can be adjusted by the user. These parameters include the period, chaos strength, chaos width, and movement strength. These values are essential to customizing the behavior of the indicator and adapting it to different market conditions and trading styles.
The wicks of the candles in the given time series are then calculated by subtracting the absolute difference between the open and close prices from the difference between the high and low prices. This step is crucial in determining the level of volatility in the market.
Subsequently, the highest high and lowest low over the defined period are identified by examining the maximum and minimum values of the open and close prices. This information is essential for calculating the total movement in the market over the period being analyzed.
Once the highest high and lowest low are found, the Buffer Move and Buffer Chaos values are calculated. The Buffer Move is the sum of the differences between the high and low prices for each candle in the period. This measure helps to identify the overall price movement in the market during the period.
On the other hand, the Buffer Chaos represents the sum of the wicks' lengths for each candle in the period. This measure is used to identify the level of uncertainty and disorder in the market during the period.
In the next step, the total movement in the market is calculated by subtracting the lowest low from the highest high. This value is then used to normalize the Buffer Move and Buffer Chaos values, ensuring they are on a comparable scale.
A comparison is made between the normalized Buffer Move and Buffer Chaos values. If the Buffer Move value is greater than the Buffer Chaos value, it indicates that there is enough volatility in the market to trade long or short. In such a case, the indicator suggests that the market conditions are favorable for trading. However, as this indicator is non-directional, a directional indicator should be used in conjunction with it to provide trading signals.
In conclusion, this custom trading indicator provides valuable insights into market volatility by comparing the Buffer Move and Buffer Chaos values. By offering a non-directional perspective, traders can use this indicator to gauge the potential for profitable trades and make informed decisions by pairing it with a directional indicator.
Additional Features
This indicator allows you to select from 33 source types. They are as follows:
Close
Open
High
Low
Median
Typical
Weighted
Average
Average Median Body
Trend Biased
Trend Biased (Extreme)
HA Close
HA Open
HA High
HA Low
HA Median
HA Typical
HA Weighted
HA Average
HA Average Median Body
HA Trend Biased
HA Trend Biased (Extreme)
HAB Close
HAB Open
HAB High
HAB Low
HAB Median
HAB Typical
HAB Weighted
HAB Average
HAB Average Median Body
HAB Trend Biased
HAB Trend Biased (Extreme)
What are Heiken Ashi "better" candles?
Heiken Ashi "better" candles are a modified version of the standard Heiken Ashi candles, which are a popular charting technique used in technical analysis. Heiken Ashi candles help traders identify trends and potential reversal points by smoothing out price data and reducing market noise. The "better formula" was proposed by Sebastian Schmidt in an article published by BNP Paribas in Warrants & Zertifikate, a German magazine, in August 2004. The aim of this formula is to further improve the smoothing of the Heiken Ashi chart and enhance its effectiveness in identifying trends and reversals.
Standard Heiken Ashi candles are calculated using the following formulas:
Heiken Ashi Close = (Open + High + Low + Close) / 4
Heiken Ashi Open = (Previous Heiken Ashi Open + Previous Heiken Ashi Close) / 2
Heiken Ashi High = Max (High, Heiken Ashi Open, Heiken Ashi Close)
Heiken Ashi Low = Min (Low, Heiken Ashi Open, Heiken Ashi Close)
The "better formula" modifies the standard Heiken Ashi calculation by incorporating additional smoothing, which can help reduce noise and make it easier to identify trends and reversals. The modified formulas for Heiken Ashi "better" candles are as follows:
Better Heiken Ashi Close = (Open + High + Low + Close) / 4
Better Heiken Ashi Open = (Previous Better Heiken Ashi Open + Previous Better Heiken Ashi Close) / 2
Better Heiken Ashi High = Max (High, Better Heiken Ashi Open, Better Heiken Ashi Close)
Better Heiken Ashi Low = Min (Low, Better Heiken Ashi Open, Better Heiken Ashi Close)
Smoothing Factor = 2 / (N + 1), where N is the chosen period for smoothing
Smoothed Better Heiken Ashi Open = (Better Heiken Ashi Open * Smoothing Factor) + (Previous Smoothed Better Heiken Ashi Open * (1 - Smoothing Factor))
Smoothed Better Heiken Ashi Close = (Better Heiken Ashi Close * Smoothing Factor) + (Previous Smoothed Better Heiken Ashi Close * (1 - Smoothing Factor))
The smoothed Better Heiken Ashi Open and Close values are then used to calculate the smoothed Better Heiken Ashi High and Low values, resulting in "better" candles that provide a clearer representation of the market trend and potential reversal points.
It's important to note that, like any other technical analysis tool, Heiken Ashi "better" candles are not foolproof and should be used in conjunction with other indicators and analysis techniques to make well-informed trading decisions.
Heiken Ashi "better" candles, as mentioned previously, provide a clearer representation of market trends and potential reversal points by reducing noise and smoothing out price data. When using these candles in conjunction with other technical analysis tools and indicators, traders can gain valuable insights into market behavior and make more informed decisions.
To effectively use Heiken Ashi "better" candles in your trading strategy, consider the following tips:
Trend Identification: Heiken Ashi "better" candles can help you identify the prevailing trend in the market. When the majority of the candles are green (or another color, depending on your chart settings) and there are no or few lower wicks, it may indicate a strong uptrend. Conversely, when the majority of the candles are red (or another color) and there are no or few upper wicks, it may signal a strong downtrend.
Trend Reversals: Look for potential trend reversals when a change in the color of the candles occurs, especially when accompanied by longer wicks. For example, if a green candle with a long lower wick is followed by a red candle, it could indicate a bearish reversal. Similarly, a red candle with a long upper wick followed by a green candle may suggest a bullish reversal.
Support and Resistance: You can use Heiken Ashi "better" candles to identify potential support and resistance levels. When the candles are consistently moving in one direction and then suddenly change color with longer wicks, it could indicate the presence of a support or resistance level.
Stop-Loss and Take-Profit: Using Heiken Ashi "better" candles can help you manage risk by determining optimal stop-loss and take-profit levels. For instance, you can place your stop-loss below the low of the most recent green candle in an uptrend or above the high of the most recent red candle in a downtrend.
Confirming Signals: Heiken Ashi "better" candles should be used in conjunction with other technical indicators, such as moving averages, oscillators, or chart patterns, to confirm signals and improve the accuracy of your analysis.
In this implementation, you have the choice of AMA, KAMA, or T3 smoothing. These are as follows:
Kaufman Adaptive Moving Average (KAMA)
The Kaufman Adaptive Moving Average (KAMA) is a type of adaptive moving average used in technical analysis to smooth out price fluctuations and identify trends. The KAMA adjusts its smoothing factor based on the market's volatility, making it more responsive in volatile markets and smoother in calm markets. The KAMA is calculated using three different efficiency ratios that determine the appropriate smoothing factor for the current market conditions. These ratios are based on the noise level of the market, the speed at which the market is moving, and the length of the moving average. The KAMA is a popular choice among traders who prefer to use adaptive indicators to identify trends and potential reversals.
Adaptive Moving Average
The Adaptive Moving Average (AMA) is a type of moving average that adjusts its sensitivity to price movements based on market conditions. It uses a ratio between the current price and the highest and lowest prices over a certain lookback period to determine its level of smoothing. The AMA can help reduce lag and increase responsiveness to changes in trend direction, making it useful for traders who want to follow trends while avoiding false signals. The AMA is calculated by multiplying a smoothing constant with the difference between the current price and the previous AMA value, then adding the result to the previous AMA value.
T3
The T3 moving average is a type of technical indicator used in financial analysis to identify trends in price movements. It is similar to the Exponential Moving Average (EMA) and the Double Exponential Moving Average (DEMA), but uses a different smoothing algorithm.
The T3 moving average is calculated using a series of exponential moving averages that are designed to filter out noise and smooth the data. The resulting smoothed data is then weighted with a non-linear function to produce a final output that is more responsive to changes in trend direction.
The T3 moving average can be customized by adjusting the length of the moving average, as well as the weighting function used to smooth the data. It is commonly used in conjunction with other technical indicators as part of a larger trading strategy.
█ Giga Kaleidoscope Modularized Trading System
Core components of an NNFX algorithmic trading strategy
The NNFX algorithm is built on the principles of trend, momentum, and volatility. There are six core components in the NNFX trading algorithm:
1. Volatility - price volatility; e.g., Average True Range, True Range Double, Close-to-Close, etc.
2. Baseline - a moving average to identify price trend
3. Confirmation 1 - a technical indicator used to identify trends
4. Confirmation 2 - a technical indicator used to identify trends
5. Continuation - a technical indicator used to identify trends
6. Volatility/Volume - a technical indicator used to identify volatility/volume breakouts/breakdown
7. Exit - a technical indicator used to determine when a trend is exhausted
What is Volatility in the NNFX trading system?
In the NNFX (No Nonsense Forex) trading system, ATR (Average True Range) is typically used to measure the volatility of an asset. It is used as a part of the system to help determine the appropriate stop loss and take profit levels for a trade. ATR is calculated by taking the average of the true range values over a specified period.
True range is calculated as the maximum of the following values:
-Current high minus the current low
-Absolute value of the current high minus the previous close
-Absolute value of the current low minus the previous close
ATR is a dynamic indicator that changes with changes in volatility. As volatility increases, the value of ATR increases, and as volatility decreases, the value of ATR decreases. By using ATR in NNFX system, traders can adjust their stop loss and take profit levels according to the volatility of the asset being traded. This helps to ensure that the trade is given enough room to move, while also minimizing potential losses.
Other types of volatility include True Range Double (TRD), Close-to-Close, and Garman-Klass
What is a Baseline indicator?
The baseline is essentially a moving average, and is used to determine the overall direction of the market.
The baseline in the NNFX system is used to filter out trades that are not in line with the long-term trend of the market. The baseline is plotted on the chart along with other indicators, such as the Moving Average (MA), the Relative Strength Index (RSI), and the Average True Range (ATR).
Trades are only taken when the price is in the same direction as the baseline. For example, if the baseline is sloping upwards, only long trades are taken, and if the baseline is sloping downwards, only short trades are taken. This approach helps to ensure that trades are in line with the overall trend of the market, and reduces the risk of entering trades that are likely to fail.
By using a baseline in the NNFX system, traders can have a clear reference point for determining the overall trend of the market, and can make more informed trading decisions. The baseline helps to filter out noise and false signals, and ensures that trades are taken in the direction of the long-term trend.
What is a Confirmation indicator?
Confirmation indicators are technical indicators that are used to confirm the signals generated by primary indicators. Primary indicators are the core indicators used in the NNFX system, such as the Average True Range (ATR), the Moving Average (MA), and the Relative Strength Index (RSI).
The purpose of the confirmation indicators is to reduce false signals and improve the accuracy of the trading system. They are designed to confirm the signals generated by the primary indicators by providing additional information about the strength and direction of the trend.
Some examples of confirmation indicators that may be used in the NNFX system include the Bollinger Bands, the MACD (Moving Average Convergence Divergence), and the MACD Oscillator. These indicators can provide information about the volatility, momentum, and trend strength of the market, and can be used to confirm the signals generated by the primary indicators.
In the NNFX system, confirmation indicators are used in combination with primary indicators and other filters to create a trading system that is robust and reliable. By using multiple indicators to confirm trading signals, the system aims to reduce the risk of false signals and improve the overall profitability of the trades.
What is a Continuation indicator?
In the NNFX (No Nonsense Forex) trading system, a continuation indicator is a technical indicator that is used to confirm a current trend and predict that the trend is likely to continue in the same direction. A continuation indicator is typically used in conjunction with other indicators in the system, such as a baseline indicator, to provide a comprehensive trading strategy.
What is a Volatility/Volume indicator?
Volume indicators, such as the On Balance Volume (OBV), the Chaikin Money Flow (CMF), or the Volume Price Trend (VPT), are used to measure the amount of buying and selling activity in a market. They are based on the trading volume of the market, and can provide information about the strength of the trend. In the NNFX system, volume indicators are used to confirm trading signals generated by the Moving Average and the Relative Strength Index. Volatility indicators include Average Direction Index, Waddah Attar, and Volatility Ratio. In the NNFX trading system, volatility is a proxy for volume and vice versa.
By using volume indicators as confirmation tools, the NNFX trading system aims to reduce the risk of false signals and improve the overall profitability of trades. These indicators can provide additional information about the market that is not captured by the primary indicators, and can help traders to make more informed trading decisions. In addition, volume indicators can be used to identify potential changes in market trends and to confirm the strength of price movements.
What is an Exit indicator?
The exit indicator is used in conjunction with other indicators in the system, such as the Moving Average (MA), the Relative Strength Index (RSI), and the Average True Range (ATR), to provide a comprehensive trading strategy.
The exit indicator in the NNFX system can be any technical indicator that is deemed effective at identifying optimal exit points. Examples of exit indicators that are commonly used include the Parabolic SAR, the Average Directional Index (ADX), and the Chandelier Exit.
The purpose of the exit indicator is to identify when a trend is likely to reverse or when the market conditions have changed, signaling the need to exit a trade. By using an exit indicator, traders can manage their risk and prevent significant losses.
In the NNFX system, the exit indicator is used in conjunction with a stop loss and a take profit order to maximize profits and minimize losses. The stop loss order is used to limit the amount of loss that can be incurred if the trade goes against the trader, while the take profit order is used to lock in profits when the trade is moving in the trader's favor.
Overall, the use of an exit indicator in the NNFX trading system is an important component of a comprehensive trading strategy. It allows traders to manage their risk effectively and improve the profitability of their trades by exiting at the right time.
How does Loxx's GKD (Giga Kaleidoscope Modularized Trading System) implement the NNFX algorithm outlined above?
Loxx's GKD v1.0 system has five types of modules (indicators/strategies). These modules are:
1. GKD-BT - Backtesting module (Volatility, Number 1 in the NNFX algorithm)
2. GKD-B - Baseline module (Baseline and Volatility/Volume, Numbers 1 and 2 in the NNFX algorithm)
3. GKD-C - Confirmation 1/2 and Continuation module (Confirmation 1/2 and Continuation, Numbers 3, 4, and 5 in the NNFX algorithm)
4. GKD-V - Volatility/Volume module (Confirmation 1/2, Number 6 in the NNFX algorithm)
5. GKD-E - Exit module (Exit, Number 7 in the NNFX algorithm)
(additional module types will added in future releases)
Each module interacts with every module by passing data between modules. Data is passed between each module as described below:
GKD-B => GKD-V => GKD-C(1) => GKD-C(2) => GKD-C(Continuation) => GKD-E => GKD-BT
That is, the Baseline indicator passes its data to Volatility/Volume. The Volatility/Volume indicator passes its values to the Confirmation 1 indicator. The Confirmation 1 indicator passes its values to the Confirmation 2 indicator. The Confirmation 2 indicator passes its values to the Continuation indicator. The Continuation indicator passes its values to the Exit indicator, and finally, the Exit indicator passes its values to the Backtest strategy.
This chaining of indicators requires that each module conform to Loxx's GKD protocol, therefore allowing for the testing of every possible combination of technical indicators that make up the six components of the NNFX algorithm.
What does the application of the GKD trading system look like?
Example trading system:
Backtest: Strategy with 1-3 take profits, trailing stop loss, multiple types of PnL volatility, and 2 backtesting styles
Baseline: Hull Moving Average
Volatility/Volume: Cercos Chaos vs Movement as shown on the chart above
Confirmation 1: Fisher Transform
Confirmation 2: Williams Percent Range
Continuation: Cercos Chaos vs Movement
Exit: Rex Oscillator
Each GKD indicator is denoted with a module identifier of either: GKD-BT, GKD-B, GKD-C, GKD-V, or GKD-E. This allows traders to understand to which module each indicator belongs and where each indicator fits into the GKD protocol chain.
Giga Kaleidoscope Modularized Trading System Signals (based on the NNFX algorithm)
Standard Entry
1. GKD-C Confirmation 1 Signal
2. GKD-B Baseline agrees
3. Price is within a range of 0.2x Volatility and 1.0x Volatility of the Goldie Locks Mean
4. GKD-C Confirmation 2 agrees
5. GKD-V Volatility/Volume agrees
Baseline Entry
1. GKD-B Baseline signal
2. GKD-C Confirmation 1 agrees
3. Price is within a range of 0.2x Volatility and 1.0x Volatility of the Goldie Locks Mean
4. GKD-C Confirmation 2 agrees
5. GKD-V Volatility/Volume agrees
6. GKD-C Confirmation 1 signal was less than 7 candles prior
Volatility/Volume Entry
1. GKD-V Volatility/Volume signal
2. GKD-C Confirmation 1 agrees
3. Price is within a range of 0.2x Volatility and 1.0x Volatility of the Goldie Locks Mean
4. GKD-C Confirmation 2 agrees
5. GKD-B Baseline agrees
6. GKD-C Confirmation 1 signal was less than 7 candles prior
Continuation Entry
1. Standard Entry, Baseline Entry, or Pullback; entry triggered previously
2. GKD-B Baseline hasn't crossed since entry signal trigger
3. GKD-C Confirmation Continuation Indicator signals
4. GKD-C Confirmation 1 agrees
5. GKD-B Baseline agrees
6. GKD-C Confirmation 2 agrees
1-Candle Rule Standard Entry
1. GKD-C Confirmation 1 signal
2. GKD-B Baseline agrees
3. Price is within a range of 0.2x Volatility and 1.0x Volatility of the Goldie Locks Mean
Next Candle:
1. Price retraced (Long: close < close or Short: close > close )
2. GKD-B Baseline agrees
3. GKD-C Confirmation 1 agrees
4. GKD-C Confirmation 2 agrees
5. GKD-V Volatility/Volume agrees
1-Candle Rule Baseline Entry
1. GKD-B Baseline signal
2. GKD-C Confirmation 1 agrees
3. Price is within a range of 0.2x Volatility and 1.0x Volatility of the Goldie Locks Mean
4. GKD-C Confirmation 1 signal was less than 7 candles prior
Next Candle:
1. Price retraced (Long: close < close or Short: close > close )
2. GKD-B Baseline agrees
3. GKD-C Confirmation 1 agrees
4. GKD-C Confirmation 2 agrees
5. GKD-V Volatility/Volume Agrees
1-Candle Rule Volatility/Volume Entry
1. GKD-V Volatility/Volume signal
2. GKD-C Confirmation 1 agrees
3. Price is within a range of 0.2x Volatility and 1.0x Volatility of the Goldie Locks Mean
4. GKD-C Confirmation 1 signal was less than 7 candles prior
Next Candle:
1. Price retraced (Long: close < close or Short: close > close)
2. GKD-B Volatility/Volume agrees
3. GKD-C Confirmation 1 agrees
4. GKD-C Confirmation 2 agrees
5. GKD-B Baseline agrees
PullBack Entry
1. GKD-B Baseline signal
2. GKD-C Confirmation 1 agrees
3. Price is beyond 1.0x Volatility of Baseline
Next Candle:
1. Price is within a range of 0.2x Volatility and 1.0x Volatility of the Goldie Locks Mean
2. GKD-C Confirmation 1 agrees
3. GKD-C Confirmation 2 agrees
4. GKD-V Volatility/Volume Agrees
]█ Setting up the GKD
The GKD system involves chaining indicators together. These are the steps to set this up.
Use a GKD-C indicator alone on a chart
1. Inside the GKD-C indicator, change the "Confirmation Type" setting to "Solo Confirmation Simple"
Use a GKD-V indicator alone on a chart
**nothing, it's already useable on the chart without any settings changes
Use a GKD-B indicator alone on a chart
**nothing, it's already useable on the chart without any settings changes
Baseline (Baseline, Backtest)
1. Import the GKD-B Baseline into the GKD-BT Backtest: "Input into Volatility/Volume or Backtest (Baseline testing)"
2. Inside the GKD-BT Backtest, change the setting "Backtest Special" to "Baseline"
Volatility/Volume (Volatility/Volume, Backte st)
1. Inside the GKD-V indicator, change the "Testing Type" setting to "Solo"
2. Inside the GKD-V indicator, change the "Signal Type" setting to "Crossing" (neither traditional nor both can be backtested)
3. Import the GKD-V indicator into the GKD-BT Backtest: "Input into C1 or Backtest"
4. Inside the GKD-BT Backtest, change the setting "Backtest Special" to "Volatility/Volume"
5. Inside the GKD-BT Backtest, a) change the setting "Backtest Type" to "Trading" if using a directional GKD-V indicator; or, b) change the setting "Backtest Type" to "Full" if using a directional or non-directional GKD-V indicator (non-directional GKD-V can only test Longs and Shorts separately)
6. If "Backtest Type" is set to "Full": Inside the GKD-BT Backtest, change the setting "Backtest Side" to "Long" or "Short
7. If "Backtest Type" is set to "Full": To allow the system to open multiple orders at one time so you test all Longs or Shorts, open the GKD-BT Backtest, click the tab "Properties" and then insert a value of something like 10 orders into the "Pyramiding" settings. This will allow 10 orders to be opened at one time which should be enough to catch all possible Longs or Shorts.
Solo Confirmation Simple (Confirmation, Backtest)
1. Inside the GKD-C indicator, change the "Confirmation Type" setting to "Solo Confirmation Simple"
1. Import the GKD-C indicator into the GKD-BT Backtest: "Input into Backtest"
2. Inside the GKD-BT Backtest, change the setting "Backtest Special" to "Solo Confirmation Simple"
Solo Confirmation Complex without Exits (Baseline, Volatility/Volume, Confirmation, Backtest)
1. Inside the GKD-V indicator, change the "Testing Type" setting to "Chained"
2. Import the GKD-B Baseline into the GKD-V indicator: "Input into Volatility/Volume or Backtest (Baseline testing)"
3. Inside the GKD-C indicator, change the "Confirmation Type" setting to "Solo Confirmation Complex"
4. Import the GKD-V indicator into the GKD-C indicator: "Input into C1 or Backtest"
5. Inside the GKD-BT Backtest, change the setting "Backtest Special" to "GKD Full wo/ Exits"
6. Import the GKD-C into the GKD-BT Backtest: "Input into Exit or Backtest"
Solo Confirmation Complex with Exits (Baseline, Volatility/Volume, Confirmation, Exit, Backtest)
1. Inside the GKD-V indicator, change the "Testing Type" setting to "Chained"
2. Import the GKD-B Baseline into the GKD-V indicator: "Input into Volatility/Volume or Backtest (Baseline testing)"
3. Inside the GKD-C indicator, change the "Confirmation Type" setting to "Solo Confirmation Complex"
4. Import the GKD-V indicator into the GKD-C indicator: "Input into C1 or Backtest"
5. Import the GKD-C indicator into the GKD-E indicator: "Input into Exit"
6. Inside the GKD-BT Backtest, change the setting "Backtest Special" to "GKD Full w/ Exits"
7. Import the GKD-E into the GKD-BT Backtest: "Input into Backtest"
Full GKD without Exits (Baseline, Volatility/Volume, Confirmation 1, Confirmation 2, Continuation, Backtest)
1. Inside the GKD-V indicator, change the "Testing Type" setting to "Chained"
2. Import the GKD-B Baseline into the GKD-V indicator: "Input into Volatility/Volume or Backtest (Baseline testing)"
3. Inside the GKD-C 1 indicator, change the "Confirmation Type" setting to "Confirmation 1"
4. Import the GKD-V indicator into the GKD-C 1 indicator: "Input into C1 or Backtest"
5. Inside the GKD-C 2 indicator, change the "Confirmation Type" setting to "Confirmation 2"
6. Import the GKD-C 1 indicator into the GKD-C 2 indicator: "Input into C2"
7. Inside the GKD-C Continuation indicator, change the "Confirmation Type" setting to "Continuation"
8. Inside the GKD-BT Backtest, change the setting "Backtest Special" to "GKD Full wo/ Exits"
9. Import the GKD-E into the GKD-BT Backtest: "Input into Exit or Backtest"
Full GKD with Exits (Baseline, Volatility/Volume, Confirmation 1, Confirmation 2, Continuation, Exit, Backtest)
1. Inside the GKD-V indicator, change the "Testing Type" setting to "Chained"
2. Import the GKD-B Baseline into the GKD-V indicator: "Input into Volatility/Volume or Backtest (Baseline testing)"
3. Inside the GKD-C 1 indicator, change the "Confirmation Type" setting to "Confirmation 1"
4. Import the GKD-V indicator into the GKD-C 1 indicator: "Input into C1 or Backtest"
5. Inside the GKD-C 2 indicator, change the "Confirmation Type" setting to "Confirmation 2"
6. Import the GKD-C 1 indicator into the GKD-C 2 indicator: "Input into C2"
7. Inside the GKD-C Continuation indicator, change the "Confirmation Type" setting to "Continuation"
8. Import the GKD-C Continuation indicator into the GKD-E indicator: "Input into Exit"
9. Inside the GKD-BT Backtest, change the setting "Backtest Special" to "GKD Full w/ Exits"
10. Import the GKD-E into the GKD-BT Backtest: "Input into Backtest"
Baseline + Volatility/Volume (Baseline, Volatility/Volume, Backtest)
1. Inside the GKD-V indicator, change the "Testing Type" setting to "Baseline + Volatility/Volume"
2. Inside the GKD-V indicator, make sure the "Signal Type" setting is set to "Traditional"
3. Import the GKD-B Baseline into the GKD-V indicator: "Input into Volatility/Volume or Backtest (Baseline testing)"
4. Inside the GKD-BT Backtest, change the setting "Backtest Special" to "Baseline + Volatility/Volume"
5. Import the GKD-V into the GKD-BT Backtest: "Input into C1 or Backtest"
6. Inside the GKD-BT Backtest, change the setting "Backtest Type" to "Full". For this backtest, you must test Longs and Shorts separately
7. To allow the system to open multiple orders at one time so you can test all Longs or Shorts, open the GKD-BT Backtest, click the tab "Properties" and then insert a value of something like 10 orders into the "Pyramiding" settings. This will allow 10 orders to be opened at one time which should be enough to catch all possible Longs or Shorts.
Requirements
Inputs
Chained: GKD-B Baseline
Solo: NA, no inputs
Baseline + Volatility/Volume: GKD-B Baseline
Outputs
Chained: GKD-C indicators Confirmation 1 or Solo Confirmation Complex
Solo: GKD-BT Backtest
Baseline + Volatility/Volume: GKD-BT Backtest
Additional features will be added in future releases.

GKD-C Juirk-Filtered QQE Histogram [Loxx]Giga Kaleidoscope GKD-C Juirk-Filtered QQE Histogram is a Confirmation module included in Loxx's "Giga Kaleidoscope Modularized Trading System".
█ Giga Kaleidoscope Modularized Trading System
What is Loxx's "Giga Kaleidoscope Modularized Trading System"?
The Giga Kaleidoscope Modularized Trading System is a trading system built on the philosophy of the NNFX (No Nonsense Forex) algorithmic trading.
What is the NNFX algorithmic trading strategy?
The NNFX (No-Nonsense Forex) trading system is a comprehensive approach to Forex trading that is designed to simplify the process and remove the confusion and complexity that often surrounds trading. The system was developed by a Forex trader who goes by the pseudonym "VP" and has gained a significant following in the Forex community.
The NNFX trading system is based on a set of rules and guidelines that help traders make objective and informed decisions. These rules cover all aspects of trading, including market analysis, trade entry, stop loss placement, and trade management.
Here are the main components of the NNFX trading system:
1. Trading Philosophy: The NNFX trading system is based on the idea that successful trading requires a comprehensive understanding of the market, objective analysis, and strict risk management. The system aims to remove subjective elements from trading and focuses on objective rules and guidelines.
2. Technical Analysis: The NNFX trading system relies heavily on technical analysis and uses a range of indicators to identify high-probability trading opportunities. The system uses a combination of trend-following and mean-reverting strategies to identify trades.
3. Market Structure: The NNFX trading system emphasizes the importance of understanding the market structure, including price action, support and resistance levels, and market cycles. The system uses a range of tools to identify the market structure, including trend lines, channels, and moving averages.
4. Trade Entry: The NNFX trading system has strict rules for trade entry. The system uses a combination of technical indicators to identify high-probability trades, and traders must meet specific criteria to enter a trade.
5. Stop Loss Placement: The NNFX trading system places a significant emphasis on risk management and requires traders to place a stop loss order on every trade. The system uses a combination of technical analysis and market structure to determine the appropriate stop loss level.
6. Trade Management: The NNFX trading system has specific rules for managing open trades. The system aims to minimize risk and maximize profit by using a combination of trailing stops, take profit levels, and position sizing.
Overall, the NNFX trading system is designed to be a straightforward and easy-to-follow approach to Forex trading that can be applied by traders of all skill levels.
Core components of an NNFX algorithmic trading strategy
The NNFX algorithm is built on the principles of trend, momentum, and volatility. There are six core components in the NNFX trading algorithm:
1. Volatility - price volatility; e.g., Average True Range, True Range Double, Close-to-Close, etc.
2. Baseline - a moving average to identify price trend
3. Confirmation 1 - a technical indicator used to identify trends
4. Confirmation 2 - a technical indicator used to identify trends
5. Continuation - a technical indicator used to identify trends
6. Volatility/Volume - a technical indicator used to identify volatility/volume breakouts/breakdown
7. Exit - a technical indicator used to determine when a trend is exhausted
What is Volatility in the NNFX trading system?
In the NNFX (No Nonsense Forex) trading system, ATR (Average True Range) is typically used to measure the volatility of an asset. It is used as a part of the system to help determine the appropriate stop loss and take profit levels for a trade. ATR is calculated by taking the average of the true range values over a specified period.
True range is calculated as the maximum of the following values:
-Current high minus the current low
-Absolute value of the current high minus the previous close
-Absolute value of the current low minus the previous close
ATR is a dynamic indicator that changes with changes in volatility. As volatility increases, the value of ATR increases, and as volatility decreases, the value of ATR decreases. By using ATR in NNFX system, traders can adjust their stop loss and take profit levels according to the volatility of the asset being traded. This helps to ensure that the trade is given enough room to move, while also minimizing potential losses.
Other types of volatility include True Range Double (TRD), Close-to-Close, and Garman-Klass
What is a Baseline indicator?
The baseline is essentially a moving average, and is used to determine the overall direction of the market.
The baseline in the NNFX system is used to filter out trades that are not in line with the long-term trend of the market. The baseline is plotted on the chart along with other indicators, such as the Moving Average (MA), the Relative Strength Index (RSI), and the Average True Range (ATR).
Trades are only taken when the price is in the same direction as the baseline. For example, if the baseline is sloping upwards, only long trades are taken, and if the baseline is sloping downwards, only short trades are taken. This approach helps to ensure that trades are in line with the overall trend of the market, and reduces the risk of entering trades that are likely to fail.
By using a baseline in the NNFX system, traders can have a clear reference point for determining the overall trend of the market, and can make more informed trading decisions. The baseline helps to filter out noise and false signals, and ensures that trades are taken in the direction of the long-term trend.
What is a Confirmation indicator?
Confirmation indicators are technical indicators that are used to confirm the signals generated by primary indicators. Primary indicators are the core indicators used in the NNFX system, such as the Average True Range (ATR), the Moving Average (MA), and the Relative Strength Index (RSI).
The purpose of the confirmation indicators is to reduce false signals and improve the accuracy of the trading system. They are designed to confirm the signals generated by the primary indicators by providing additional information about the strength and direction of the trend.
Some examples of confirmation indicators that may be used in the NNFX system include the Bollinger Bands, the MACD (Moving Average Convergence Divergence), and the MACD Oscillator. These indicators can provide information about the volatility, momentum, and trend strength of the market, and can be used to confirm the signals generated by the primary indicators.
In the NNFX system, confirmation indicators are used in combination with primary indicators and other filters to create a trading system that is robust and reliable. By using multiple indicators to confirm trading signals, the system aims to reduce the risk of false signals and improve the overall profitability of the trades.
What is a Continuation indicator?
In the NNFX (No Nonsense Forex) trading system, a continuation indicator is a technical indicator that is used to confirm a current trend and predict that the trend is likely to continue in the same direction. A continuation indicator is typically used in conjunction with other indicators in the system, such as a baseline indicator, to provide a comprehensive trading strategy.
What is a Volatility/Volume indicator?
Volume indicators, such as the On Balance Volume (OBV), the Chaikin Money Flow (CMF), or the Volume Price Trend (VPT), are used to measure the amount of buying and selling activity in a market. They are based on the trading volume of the market, and can provide information about the strength of the trend. In the NNFX system, volume indicators are used to confirm trading signals generated by the Moving Average and the Relative Strength Index. Volatility indicators include Average Direction Index, Waddah Attar, and Volatility Ratio. In the NNFX trading system, volatility is a proxy for volume and vice versa.
By using volume indicators as confirmation tools, the NNFX trading system aims to reduce the risk of false signals and improve the overall profitability of trades. These indicators can provide additional information about the market that is not captured by the primary indicators, and can help traders to make more informed trading decisions. In addition, volume indicators can be used to identify potential changes in market trends and to confirm the strength of price movements.
What is an Exit indicator?
The exit indicator is used in conjunction with other indicators in the system, such as the Moving Average (MA), the Relative Strength Index (RSI), and the Average True Range (ATR), to provide a comprehensive trading strategy.
The exit indicator in the NNFX system can be any technical indicator that is deemed effective at identifying optimal exit points. Examples of exit indicators that are commonly used include the Parabolic SAR, the Average Directional Index (ADX), and the Chandelier Exit.
The purpose of the exit indicator is to identify when a trend is likely to reverse or when the market conditions have changed, signaling the need to exit a trade. By using an exit indicator, traders can manage their risk and prevent significant losses.
In the NNFX system, the exit indicator is used in conjunction with a stop loss and a take profit order to maximize profits and minimize losses. The stop loss order is used to limit the amount of loss that can be incurred if the trade goes against the trader, while the take profit order is used to lock in profits when the trade is moving in the trader's favor.
Overall, the use of an exit indicator in the NNFX trading system is an important component of a comprehensive trading strategy. It allows traders to manage their risk effectively and improve the profitability of their trades by exiting at the right time.
How does Loxx's GKD (Giga Kaleidoscope Modularized Trading System) implement the NNFX algorithm outlined above?
Loxx's GKD v1.0 system has five types of modules (indicators/strategies). These modules are:
1. GKD-BT - Backtesting module (Volatility, Number 1 in the NNFX algorithm)
2. GKD-B - Baseline module (Baseline and Volatility/Volume, Numbers 1 and 2 in the NNFX algorithm)
3. GKD-C - Confirmation 1/2 and Continuation module (Confirmation 1/2 and Continuation, Numbers 3, 4, and 5 in the NNFX algorithm)
4. GKD-V - Volatility/Volume module (Confirmation 1/2, Number 6 in the NNFX algorithm)
5. GKD-E - Exit module (Exit, Number 7 in the NNFX algorithm)
(additional module types will added in future releases)
Each module interacts with every module by passing data between modules. Data is passed between each module as described below:
GKD-B => GKD-V => GKD-C(1) => GKD-C(2) => GKD-C(Continuation) => GKD-E => GKD-BT
That is, the Baseline indicator passes its data to Volatility/Volume. The Volatility/Volume indicator passes its values to the Confirmation 1 indicator. The Confirmation 1 indicator passes its values to the Confirmation 2 indicator. The Confirmation 2 indicator passes its values to the Continuation indicator. The Continuation indicator passes its values to the Exit indicator, and finally, the Exit indicator passes its values to the Backtest strategy.
This chaining of indicators requires that each module conform to Loxx's GKD protocol, therefore allowing for the testing of every possible combination of technical indicators that make up the six components of the NNFX algorithm.
What does the application of the GKD trading system look like?
Example trading system:
Backtest: Strategy with 1-3 take profits, trailing stop loss, multiple types of PnL volatility, and 2 backtesting styles
Baseline: Hull Moving Average
Volatility/Volume: Hurst Exponent
Confirmation 1: Juirk-Filtered QQE Histogram as shown on the chart above
Confirmation 2: Williams Percent Range
Continuation: Fisher Transform
Exit: Rex Oscillator
Each GKD indicator is denoted with a module identifier of either: GKD-BT, GKD-B, GKD-C, GKD-V, or GKD-E. This allows traders to understand to which module each indicator belongs and where each indicator fits into the GKD protocol chain.
Giga Kaleidoscope Modularized Trading System Signals (based on the NNFX algorithm)
Standard Entry
1. GKD-C Confirmation 1 Signal
2. GKD-B Baseline agrees
3. Price is within a range of 0.2x Volatility and 1.0x Volatility of the Goldie Locks Mean
4. GKD-C Confirmation 2 agrees
5. GKD-V Volatility/Volume agrees
Baseline Entry
1. GKD-B Baseline signal
2. GKD-C Confirmation 1 agrees
3. Price is within a range of 0.2x Volatility and 1.0x Volatility of the Goldie Locks Mean
4. GKD-C Confirmation 2 agrees
5. GKD-V Volatility/Volume agrees
6. GKD-C Confirmation 1 signal was less than 7 candles prior
Continuation Entry
1. Standard Entry, Baseline Entry, or Pullback; entry triggered previously
2. GKD-B Baseline hasn't crossed since entry signal trigger
3. GKD-C Confirmation Continuation Indicator signals
4. GKD-C Confirmation 1 agrees
5. GKD-B Baseline agrees
6. GKD-C Confirmation 2 agrees
1-Candle Rule Standard Entry
1. GKD-C Confirmation 1 signal
2. GKD-B Baseline agrees
3. Price is within a range of 0.2x Volatility and 1.0x Volatility of the Goldie Locks Mean
Next Candle:
1. Price retraced (Long: close < close or Short: close > close )
2. GKD-B Baseline agrees
3. GKD-C Confirmation 1 agrees
4. GKD-C Confirmation 2 agrees
5. GKD-V Volatility/Volume agrees
1-Candle Rule Baseline Entry
1. GKD-B Baseline signal
2. GKD-C Confirmation 1 agrees
3. Price is within a range of 0.2x Volatility and 1.0x Volatility of the Goldie Locks Mean
4. GKD-C Confirmation 1 signal was less than 7 candles prior
Next Candle:
1. Price retraced (Long: close < close or Short: close > close )
2. GKD-B Baseline agrees
3. GKD-C Confirmation 1 agrees
4. GKD-C Confirmation 2 agrees
5. GKD-V Volatility/Volume Agrees
PullBack Entry
1. GKD-B Baseline signal
2. GKD-C Confirmation 1 agrees
3. Price is beyond 1.0x Volatility of Baseline
Next Candle:
1. Price is within a range of 0.2x Volatility and 1.0x Volatility of the Goldie Locks Mean
3. GKD-C Confirmation 1 agrees
4. GKD-C Confirmation 2 agrees
5. GKD-V Volatility/Volume Agrees
█ GKD-C Juirk-Filtered QQE Histogram
What is Parabolic-Weighted Velocity?
Parabolic-Weighted Velocity (PWV) is a mathematical model used in sports science to estimate the velocity of an athlete during a given movement or exercise. This model uses a parabolic weighting function to give more importance to the velocities achieved in the middle of the movement and less importance to the velocities achieved at the beginning and end of the movement.
PWV takes into account the acceleration and deceleration of an athlete during the movement, and uses this information to calculate an average velocity. The model assumes that the athlete moves at a constant velocity during the middle portion of the movement and that the velocity increases and decreases smoothly at the beginning and end of the movement.
The parabolic weighting function used in PWV is based on the principle of impulse momentum, which states that the change in momentum of an object is equal to the impulse applied to it. The impulse is calculated as the force applied to an object multiplied by the time during which the force is applied. By giving more weight to the velocities achieved during the middle of the movement, PWV takes into account the impulse generated during this period of the movement.
PWV is commonly used in sports science to measure the performance of athletes during activities such as sprinting, jumping, and throwing. It is often used in conjunction with other metrics such as power and force to provide a comprehensive picture of an athlete's performance. Additionally, PWV can be used to compare the performance of different athletes or to track an athlete's progress over time.
Overall, Parabolic-Weighted Velocity is a useful tool in sports science for estimating an athlete's velocity during a movement or exercise, taking into account the acceleration and deceleration of the athlete during the movement.
What is QQE?
Quantitative Qualitative Estimation (QQE) is a technical analysis indicator used to identify trends and trading opportunities in financial markets. It is based on a combination of two popular technical analysis indicators - the Relative Strength Index (RSI) and Moving Averages (MA).
The QQE indicator uses a smoothed RSI to determine the trend direction, and a moving average of the smoothed RSI to identify potential trend changes. The indicator then plots a series of bands above and below the moving average to indicate overbought and oversold conditions in the market.
The QQE indicator is designed to provide traders with a reliable signal that confirms the strength of a trend or indicates a possible trend reversal. It is particularly useful for traders who are looking to trade in markets that are trending strongly, but also want to identify when a trend is losing momentum or reversing.
Traders can use QQE in a number of different ways, including as a confirmation tool for other indicators or as a standalone indicator. For example, when used in conjunction with other technical analysis tools like support and resistance levels, the QQE indicator can help traders identify key entry and exit points for their trades.
One of the main advantages of the QQE indicator is that it is designed to be more reliable than other indicators that can generate false signals. By smoothing out the price action, the QQE indicator can provide traders with more accurate and reliable signals, which can help them make more profitable trading decisions.
In conclusion, QQE is a popular technical analysis indicator that traders use to identify trends and trading opportunities in financial markets. It combines the RSI and moving average indicators and is designed to provide traders with reliable signals that confirm the strength of a trend or indicate a possible trend reversal.
What is the Jurik Filter?
The Jurik Filter is a technical analysis tool that is used to filter out market noise and identify trends in financial markets. It was developed by Mark Jurik in the 1990s and is based on a non-linear smoothing algorithm that provides a more accurate representation of price movements.
Traditional moving averages, such as the Simple Moving Average ( SMA ) or Exponential Moving Average ( EMA ), are linear filters that produce a lag between price and the moving average line. This can cause false signals during periods of market volatility , which can result in losses for traders and investors.
The Jurik Filter is designed to address this issue by incorporating a damping factor into the smoothing algorithm. This damping factor adjusts the filter's responsiveness to the changes in price, allowing it to filter out market noise without overshooting price peaks and valleys.
The Jurik Filter is calculated using a mathematical formula that takes into account the current and past prices of an asset, as well as the volatility of the market. This formula incorporates the damping factor and produces a smoother price curve than traditional moving average filters.
One of the advantages of the Jurik Filter is its ability to adjust to changing market conditions. The damping factor can be adjusted to suit different securities and time frames, making it a versatile tool for traders and investors.
Traders and investors often use the Jurik Filter in conjunction with other technical analysis tools, such as the MACD or RSI , to confirm or complement their trading strategies. By filtering out market noise and identifying trends in the financial markets, the Jurik Filter can help improve the accuracy of trading signals and reduce the risks of false signals during periods of market volatility .
Overall, the Jurik Filter is a powerful technical analysis tool that can help traders and investors make more informed decisions about buying and selling securities. By providing a smoother price curve and reducing false signals, it can help improve trading performance and reduce risk in volatile markets.
This indicator contains 7 different types of RSI:
RSX
Regular
Slow
Rapid
Harris
Cuttler
Ehlers Smoothed
What is RSI?
RSI stands for Relative Strength Index . It is a technical indicator used to measure the strength or weakness of a financial instrument's price action.
The RSI is calculated based on the price movement of an asset over a specified period of time, typically 14 days, and is expressed on a scale of 0 to 100. The RSI is considered overbought when it is above 70 and oversold when it is below 30.
Traders and investors use the RSI to identify potential buy and sell signals. When the RSI indicates that an asset is oversold, it may be considered a buying opportunity, while an overbought RSI may signal that it is time to sell or take profits.
It's important to note that the RSI should not be used in isolation and should be used in conjunction with other technical and fundamental analysis tools to make informed trading decisions.
What is RSX?
Jurik RSX is a technical analysis indicator that is a variation of the Relative Strength Index Smoothed ( RSX ) indicator. It was developed by Mark Jurik and is designed to help traders identify trends and momentum in the market.
The Jurik RSX uses a combination of the RSX indicator and an adaptive moving average (AMA) to smooth out the price data and reduce the number of false signals. The adaptive moving average is designed to adjust the smoothing period based on the current market conditions, which makes the indicator more responsive to changes in price.
The Jurik RSX can be used to identify potential trend reversals and momentum shifts in the market. It oscillates between 0 and 100, with values above 50 indicating a bullish trend and values below 50 indicating a bearish trend . Traders can use these levels to make trading decisions, such as buying when the indicator crosses above 50 and selling when it crosses below 50.
The Jurik RSX is a more advanced version of the RSX indicator, and while it can be useful in identifying potential trade opportunities, it should not be used in isolation. It is best used in conjunction with other technical and fundamental analysis tools to make informed trading decisions.
What is Slow RSI?
Slow RSI is a variation of the traditional Relative Strength Index ( RSI ) indicator. It is a more smoothed version of the RSI and is designed to filter out some of the noise and short-term price fluctuations that can occur with the standard RSI .
The Slow RSI uses a longer period of time than the traditional RSI , typically 21 periods instead of 14. This longer period helps to smooth out the price data and makes the indicator less reactive to short-term price fluctuations.
Like the traditional RSI , the Slow RSI is used to identify potential overbought and oversold conditions in the market. It oscillates between 0 and 100, with values above 70 indicating overbought conditions and values below 30 indicating oversold conditions. Traders often use these levels as potential buy and sell signals.
The Slow RSI is a more conservative version of the RSI and can be useful in identifying longer-term trends in the market. However, it can also be slower to respond to changes in price, which may result in missed trading opportunities. Traders may choose to use a combination of both the Slow RSI and the traditional RSI to make informed trading decisions.
What is Rapid RSI?
Same as regular RSI but with a faster calculation method
What is Harris RSI?
Harris RSI is a technical analysis indicator that is a variation of the Relative Strength Index ( RSI ). It was developed by Larry Harris and is designed to help traders identify potential trend changes and momentum shifts in the market.
The Harris RSI uses a different calculation formula compared to the traditional RSI . It takes into account both the opening and closing prices of a financial instrument, as well as the high and low prices. The Harris RSI is also normalized to a range of 0 to 100, with values above 50 indicating a bullish trend and values below 50 indicating a bearish trend .
Like the traditional RSI , the Harris RSI is used to identify potential overbought and oversold conditions in the market. It oscillates between 0 and 100, with values above 70 indicating overbought conditions and values below 30 indicating oversold conditions. Traders often use these levels as potential buy and sell signals.
The Harris RSI is a more advanced version of the RSI and can be useful in identifying longer-term trends in the market. However, it can also generate more false signals than the standard RSI . Traders may choose to use a combination of both the Harris RSI and the traditional RSI to make informed trading decisions.
What is Cuttler RSI?
Cuttler RSI is a technical analysis indicator that is a variation of the Relative Strength Index ( RSI ). It was developed by Curt Cuttler and is designed to help traders identify potential trend changes and momentum shifts in the market.
The Cuttler RSI uses a different calculation formula compared to the traditional RSI . It takes into account the difference between the closing price of a financial instrument and the average of the high and low prices over a specified period of time. This difference is then normalized to a range of 0 to 100, with values above 50 indicating a bullish trend and values below 50 indicating a bearish trend .
Like the traditional RSI , the Cuttler RSI is used to identify potential overbought and oversold conditions in the market. It oscillates between 0 and 100, with values above 70 indicating overbought conditions and values below 30 indicating oversold conditions. Traders often use these levels as potential buy and sell signals.
The Cuttler RSI is a more advanced version of the RSI and can be useful in identifying longer-term trends in the market. However, it can also generate more false signals than the standard RSI . Traders may choose to use a combination of both the Cuttler RSI and the traditional RSI to make informed trading decisions.
What is Ehlers Smoothed RSI?
Ehlers smoothed RSI is a technical analysis indicator that is a variation of the Relative Strength Index ( RSI ). It was developed by John Ehlers and is designed to help traders identify potential trend changes and momentum shifts in the market.
The Ehlers smoothed RSI uses a different calculation formula compared to the traditional RSI . It uses a smoothing algorithm that is designed to reduce the noise and random fluctuations that can occur with the standard RSI . The smoothing algorithm is based on a concept called "digital signal processing" and is intended to improve the accuracy of the indicator.
Like the traditional RSI , the Ehlers smoothed RSI is used to identify potential overbought and oversold conditions in the market. It oscillates between 0 and 100, with values above 70 indicating overbought conditions and values below 30 indicating oversold conditions. Traders often use these levels as potential buy and sell signals.
The Ehlers smoothed RSI can be useful in identifying longer-term trends and momentum shifts in the market. However, it can also generate more false signals than the standard RSI . Traders may choose to use a combination of both the Ehlers smoothed RSI and the traditional RSI to make informed trading decisions.
What is Juirk-Filtered QQE Histogram ?
This indicator is a complex combiation of Jurik filtering with QQE output.
Requirements
Inputs
Confirmation 1 and Solo Confirmation: GKD-V Volatility / Volume indicator
Confirmation 2: GKD-C Confirmation indicator
Outputs
Confirmation 2 and Solo Confirmation Complex: GKD-E Exit indicator
Confirmation 1: GKD-C Confirmation indicator
Continuation: GKD-E Exit indicator
Solo Confirmation Simple: GKD-BT Backtest strategy
Additional features will be added in future releases.
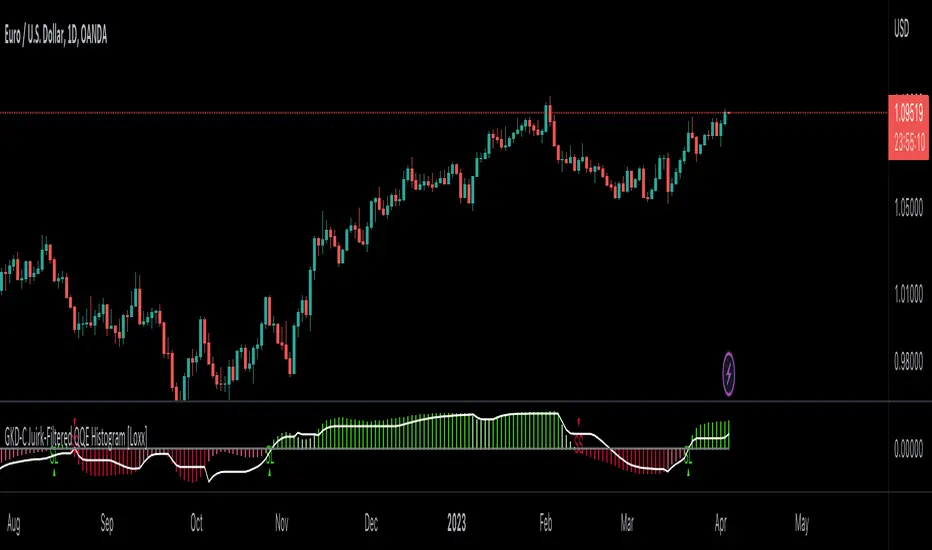
GKD-C RSI of Fast Discrete Cosine Transform [Loxx]Giga Kaleidoscope GKD-C RSI of Fast Discrete Cosine Transform is a Confirmation module included in Loxx's "Giga Kaleidoscope Modularized Trading System".
█ Giga Kaleidoscope Modularized Trading System
What is Loxx's "Giga Kaleidoscope Modularized Trading System"?
The Giga Kaleidoscope Modularized Trading System is a trading system built on the philosophy of the NNFX (No Nonsense Forex) algorithmic trading.
What is the NNFX algorithmic trading strategy?
The NNFX (No-Nonsense Forex) trading system is a comprehensive approach to Forex trading that is designed to simplify the process and remove the confusion and complexity that often surrounds trading. The system was developed by a Forex trader who goes by the pseudonym "VP" and has gained a significant following in the Forex community.
The NNFX trading system is based on a set of rules and guidelines that help traders make objective and informed decisions. These rules cover all aspects of trading, including market analysis, trade entry, stop loss placement, and trade management.
Here are the main components of the NNFX trading system:
1. Trading Philosophy: The NNFX trading system is based on the idea that successful trading requires a comprehensive understanding of the market, objective analysis, and strict risk management. The system aims to remove subjective elements from trading and focuses on objective rules and guidelines.
2. Technical Analysis: The NNFX trading system relies heavily on technical analysis and uses a range of indicators to identify high-probability trading opportunities. The system uses a combination of trend-following and mean-reverting strategies to identify trades.
3. Market Structure: The NNFX trading system emphasizes the importance of understanding the market structure, including price action, support and resistance levels, and market cycles. The system uses a range of tools to identify the market structure, including trend lines, channels, and moving averages.
4. Trade Entry: The NNFX trading system has strict rules for trade entry. The system uses a combination of technical indicators to identify high-probability trades, and traders must meet specific criteria to enter a trade.
5. Stop Loss Placement: The NNFX trading system places a significant emphasis on risk management and requires traders to place a stop loss order on every trade. The system uses a combination of technical analysis and market structure to determine the appropriate stop loss level.
6. Trade Management: The NNFX trading system has specific rules for managing open trades. The system aims to minimize risk and maximize profit by using a combination of trailing stops, take profit levels, and position sizing.
Overall, the NNFX trading system is designed to be a straightforward and easy-to-follow approach to Forex trading that can be applied by traders of all skill levels.
Core components of an NNFX algorithmic trading strategy
The NNFX algorithm is built on the principles of trend, momentum, and volatility. There are six core components in the NNFX trading algorithm:
1. Volatility - price volatility; e.g., Average True Range, True Range Double, Close-to-Close, etc.
2. Baseline - a moving average to identify price trend
3. Confirmation 1 - a technical indicator used to identify trends
4. Confirmation 2 - a technical indicator used to identify trends
5. Continuation - a technical indicator used to identify trends
6. Volatility/Volume - a technical indicator used to identify volatility/volume breakouts/breakdown
7. Exit - a technical indicator used to determine when a trend is exhausted
What is Volatility in the NNFX trading system?
In the NNFX (No Nonsense Forex) trading system, ATR (Average True Range) is typically used to measure the volatility of an asset. It is used as a part of the system to help determine the appropriate stop loss and take profit levels for a trade. ATR is calculated by taking the average of the true range values over a specified period.
True range is calculated as the maximum of the following values:
-Current high minus the current low
-Absolute value of the current high minus the previous close
-Absolute value of the current low minus the previous close
ATR is a dynamic indicator that changes with changes in volatility. As volatility increases, the value of ATR increases, and as volatility decreases, the value of ATR decreases. By using ATR in NNFX system, traders can adjust their stop loss and take profit levels according to the volatility of the asset being traded. This helps to ensure that the trade is given enough room to move, while also minimizing potential losses.
Other types of volatility include True Range Double (TRD), Close-to-Close, and Garman-Klass
What is a Baseline indicator?
The baseline is essentially a moving average, and is used to determine the overall direction of the market.
The baseline in the NNFX system is used to filter out trades that are not in line with the long-term trend of the market. The baseline is plotted on the chart along with other indicators, such as the Moving Average (MA), the Relative Strength Index (RSI), and the Average True Range (ATR).
Trades are only taken when the price is in the same direction as the baseline. For example, if the baseline is sloping upwards, only long trades are taken, and if the baseline is sloping downwards, only short trades are taken. This approach helps to ensure that trades are in line with the overall trend of the market, and reduces the risk of entering trades that are likely to fail.
By using a baseline in the NNFX system, traders can have a clear reference point for determining the overall trend of the market, and can make more informed trading decisions. The baseline helps to filter out noise and false signals, and ensures that trades are taken in the direction of the long-term trend.
What is a Confirmation indicator?
Confirmation indicators are technical indicators that are used to confirm the signals generated by primary indicators. Primary indicators are the core indicators used in the NNFX system, such as the Average True Range (ATR), the Moving Average (MA), and the Relative Strength Index (RSI).
The purpose of the confirmation indicators is to reduce false signals and improve the accuracy of the trading system. They are designed to confirm the signals generated by the primary indicators by providing additional information about the strength and direction of the trend.
Some examples of confirmation indicators that may be used in the NNFX system include the Bollinger Bands, the MACD (Moving Average Convergence Divergence), and the Stochastic Oscillator. These indicators can provide information about the volatility, momentum, and trend strength of the market, and can be used to confirm the signals generated by the primary indicators.
In the NNFX system, confirmation indicators are used in combination with primary indicators and other filters to create a trading system that is robust and reliable. By using multiple indicators to confirm trading signals, the system aims to reduce the risk of false signals and improve the overall profitability of the trades.
What is a Continuation indicator?
In the NNFX (No Nonsense Forex) trading system, a continuation indicator is a technical indicator that is used to confirm a current trend and predict that the trend is likely to continue in the same direction. A continuation indicator is typically used in conjunction with other indicators in the system, such as a baseline indicator, to provide a comprehensive trading strategy.
What is a Volatility/Volume indicator?
Volume indicators, such as the On Balance Volume (OBV), the Chaikin Money Flow (CMF), or the Volume Price Trend (VPT), are used to measure the amount of buying and selling activity in a market. They are based on the trading volume of the market, and can provide information about the strength of the trend. In the NNFX system, volume indicators are used to confirm trading signals generated by the Moving Average and the Relative Strength Index. Volatility indicators include Average Direction Index, Waddah Attar, and Volatility Ratio. In the NNFX trading system, volatility is a proxy for volume and vice versa.
By using volume indicators as confirmation tools, the NNFX trading system aims to reduce the risk of false signals and improve the overall profitability of trades. These indicators can provide additional information about the market that is not captured by the primary indicators, and can help traders to make more informed trading decisions. In addition, volume indicators can be used to identify potential changes in market trends and to confirm the strength of price movements.
What is an Exit indicator?
The exit indicator is used in conjunction with other indicators in the system, such as the Moving Average (MA), the Relative Strength Index (RSI), and the Average True Range (ATR), to provide a comprehensive trading strategy.
The exit indicator in the NNFX system can be any technical indicator that is deemed effective at identifying optimal exit points. Examples of exit indicators that are commonly used include the Parabolic SAR, the Average Directional Index (ADX), and the Chandelier Exit.
The purpose of the exit indicator is to identify when a trend is likely to reverse or when the market conditions have changed, signaling the need to exit a trade. By using an exit indicator, traders can manage their risk and prevent significant losses.
In the NNFX system, the exit indicator is used in conjunction with a stop loss and a take profit order to maximize profits and minimize losses. The stop loss order is used to limit the amount of loss that can be incurred if the trade goes against the trader, while the take profit order is used to lock in profits when the trade is moving in the trader's favor.
Overall, the use of an exit indicator in the NNFX trading system is an important component of a comprehensive trading strategy. It allows traders to manage their risk effectively and improve the profitability of their trades by exiting at the right time.
How does Loxx's GKD (Giga Kaleidoscope Modularized Trading System) implement the NNFX algorithm outlined above?
Loxx's GKD v1.0 system has five types of modules (indicators/strategies). These modules are:
1. GKD-BT - Backtesting module (Volatility, Number 1 in the NNFX algorithm)
2. GKD-B - Baseline module (Baseline and Volatility/Volume, Numbers 1 and 2 in the NNFX algorithm)
3. GKD-C - Confirmation 1/2 and Continuation module (Confirmation 1/2 and Continuation, Numbers 3, 4, and 5 in the NNFX algorithm)
4. GKD-V - Volatility/Volume module (Confirmation 1/2, Number 6 in the NNFX algorithm)
5. GKD-E - Exit module (Exit, Number 7 in the NNFX algorithm)
(additional module types will added in future releases)
Each module interacts with every module by passing data between modules. Data is passed between each module as described below:
GKD-B => GKD-V => GKD-C(1) => GKD-C(2) => GKD-C(Continuation) => GKD-E => GKD-BT
That is, the Baseline indicator passes its data to Volatility/Volume. The Volatility/Volume indicator passes its values to the Confirmation 1 indicator. The Confirmation 1 indicator passes its values to the Confirmation 2 indicator. The Confirmation 2 indicator passes its values to the Continuation indicator. The Continuation indicator passes its values to the Exit indicator, and finally, the Exit indicator passes its values to the Backtest strategy.
This chaining of indicators requires that each module conform to Loxx's GKD protocol, therefore allowing for the testing of every possible combination of technical indicators that make up the six components of the NNFX algorithm.
What does the application of the GKD trading system look like?
Example trading system:
Backtest: Strategy with 1-3 take profits, trailing stop loss, multiple types of PnL volatility, and 2 backtesting styles
Baseline: Hull Moving Average
Volatility/Volume: Hurst Exponent
Confirmation 1: RSI of Fast Discrete Cosine Transform as shown on the chart above
Confirmation 2: Williams Percent Range
Continuation: Fisher Transform
Exit: Rex Oscillator
Each GKD indicator is denoted with a module identifier of either: GKD-BT, GKD-B, GKD-C, GKD-V, or GKD-E. This allows traders to understand to which module each indicator belongs and where each indicator fits into the GKD protocol chain.
Giga Kaleidoscope Modularized Trading System Signals (based on the NNFX algorithm)
Standard Entry
1. GKD-C Confirmation 1 Signal
2. GKD-B Baseline agrees
3. Price is within a range of 0.2x Volatility and 1.0x Volatility of the Goldie Locks Mean
4. GKD-C Confirmation 2 agrees
5. GKD-V Volatility/Volume agrees
Baseline Entry
1. GKD-B Baseline signal
2. GKD-C Confirmation 1 agrees
3. Price is within a range of 0.2x Volatility and 1.0x Volatility of the Goldie Locks Mean
4. GKD-C Confirmation 2 agrees
5. GKD-V Volatility/Volume agrees
6. GKD-C Confirmation 1 signal was less than 7 candles prior
Continuation Entry
1. Standard Entry, Baseline Entry, or Pullback; entry triggered previously
2. GKD-B Baseline hasn't crossed since entry signal trigger
3. GKD-C Confirmation Continuation Indicator signals
4. GKD-C Confirmation 1 agrees
5. GKD-B Baseline agrees
6. GKD-C Confirmation 2 agrees
1-Candle Rule Standard Entry
1. GKD-C Confirmation 1 signal
2. GKD-B Baseline agrees
3. Price is within a range of 0.2x Volatility and 1.0x Volatility of the Goldie Locks Mean
Next Candle:
1. Price retraced (Long: close < close or Short: close > close )
2. GKD-B Baseline agrees
3. GKD-C Confirmation 1 agrees
4. GKD-C Confirmation 2 agrees
5. GKD-V Volatility/Volume agrees
1-Candle Rule Baseline Entry
1. GKD-B Baseline signal
2. GKD-C Confirmation 1 agrees
3. Price is within a range of 0.2x Volatility and 1.0x Volatility of the Goldie Locks Mean
4. GKD-C Confirmation 1 signal was less than 7 candles prior
Next Candle:
1. Price retraced (Long: close < close or Short: close > close )
2. GKD-B Baseline agrees
3. GKD-C Confirmation 1 agrees
4. GKD-C Confirmation 2 agrees
5. GKD-V Volatility/Volume Agrees
PullBack Entry
1. GKD-B Baseline signal
2. GKD-C Confirmation 1 agrees
3. Price is beyond 1.0x Volatility of Baseline
Next Candle:
1. Price is within a range of 0.2x Volatility and 1.0x Volatility of the Goldie Locks Mean
3. GKD-C Confirmation 1 agrees
4. GKD-C Confirmation 2 agrees
5. GKD-V Volatility/Volume Agrees
█ Fast Discrete Cosine Transform
What is the Fast Discrete Cosine Transform?
Algolib is a C++ library for algorithmic trading that provides various algorithms for processing and analyzing financial data. The library includes a Fast Discrete Cosine Transform (FDCT) implementation, which is a fast version of the Discrete Cosine Transform (DCT) algorithm used for signal processing and data compression.
The FDCT implementation in Algolib is based on the FFT (Fast Fourier Transform) algorithm, which is a widely used method for computing the DCT. The implementation is optimized for performance and can handle large datasets efficiently. It uses the standard divide-and-conquer approach to compute the DCT recursively and combines the resulting coefficients to obtain the final DCT of the input signal.
The input to the FDCT algorithm in Algolib is a one-dimensional array of real numbers, which represents a time series or a financial signal. The algorithm then computes the DCT of the input sequence and returns a one-dimensional array of DCT coefficients, which represent the frequency components of the signal.
The implementation of the FDCT algorithm in Algolib uses C++ templates to provide a generic implementation that can work with different data types. It also includes various optimizations, such as loop unrolling, to improve the performance of the algorithm.
The steps involved in the FDCT algorithm in Algolib are:
-Divide the input sequence into even and odd parts.
-Compute the DCT of the even and odd parts recursively.
-Combine the DCT coefficients of the even and odd parts to obtain the final DCT coefficients.
-The implementation of the FDCT algorithm in Algolib uses the FFTW (Fastest Fourier Transform in the West) library to perform the FFT computations, which is a highly optimized library for computing Fourier transforms.
In summary, the Fast Discrete Cosine Transform implementation in Algolib is a fast and efficient implementation of the DCT algorithm, which is used for processing financial signals and time series data. The implementation is optimized for performance and uses the FFT algorithm for fast computation. The implementation is generic and can work with different data types, and includes optimizations such as loop unrolling to improve the performance of the algorithm.
What is the Fast Discrete Cosine Transform in terms of Forex trading?
The Fast Discrete Cosine Transform (FDCT) is an algorithm used for signal processing and data compression that can also be applied in trading forex. The FDCT is used to transform financial data into a set of coefficients that represent the data in terms of cosine functions of different frequencies. These coefficients can be used to analyze the frequency components of financial signals and to develop trading strategies based on these components.
In trading forex, the FDCT can be applied to various financial signals, such as price data, volume data, and technical indicators. By applying the FDCT to these signals, traders can identify the dominant frequency components of the signals and use this information to develop trading strategies.
For example, traders can use the FDCT to identify cycles in the market and use this information to develop trend-following strategies. The FDCT can also be used to identify short-term fluctuations in the market and develop mean-reversion strategies based on these fluctuations.
The FDCT can also be used in combination with other technical analysis tools, such as moving averages, to improve the accuracy of trading signals. For example, traders can apply the FDCT to the moving average of a financial signal to identify the dominant frequency components of the moving average and use this information to develop trading signals.
The FDCT can also be used in conjunction with machine learning algorithms to develop predictive models for financial markets. By applying the FDCT to financial data and using the resulting coefficients as inputs to a machine learning algorithm, traders can develop models that predict future price movements and identify profitable trading opportunities.
In summary, the FDCT can be applied in trading forex to analyze the frequency components of financial signals and develop trading strategies based on these components. The FDCT can be used in conjunction with other technical analysis tools and machine learning algorithms to improve the accuracy of trading signals and develop predictive models for financial markets.
█ Relative Strength Index (RSI)
This indicator contains 7 different types of RSI .
RSX
Regular
Slow
Rapid
Harris
Cuttler
Ehlers Smoothed
What is RSI?
RSI stands for Relative Strength Index . It is a technical indicator used to measure the strength or weakness of a financial instrument's price action.
The RSI is calculated based on the price movement of an asset over a specified period of time, typically 14 days, and is expressed on a scale of 0 to 100. The RSI is considered overbought when it is above 70 and oversold when it is below 30.
Traders and investors use the RSI to identify potential buy and sell signals. When the RSI indicates that an asset is oversold, it may be considered a buying opportunity, while an overbought RSI may signal that it is time to sell or take profits.
It's important to note that the RSI should not be used in isolation and should be used in conjunction with other technical and fundamental analysis tools to make informed trading decisions.
What is RSX?
Jurik RSX is a technical analysis indicator that is a variation of the Relative Strength Index Smoothed ( RSX ) indicator. It was developed by Mark Jurik and is designed to help traders identify trends and momentum in the market.
The Jurik RSX uses a combination of the RSX indicator and an adaptive moving average (AMA) to smooth out the price data and reduce the number of false signals. The adaptive moving average is designed to adjust the smoothing period based on the current market conditions, which makes the indicator more responsive to changes in price.
The Jurik RSX can be used to identify potential trend reversals and momentum shifts in the market. It oscillates between 0 and 100, with values above 50 indicating a bullish trend and values below 50 indicating a bearish trend . Traders can use these levels to make trading decisions, such as buying when the indicator crosses above 50 and selling when it crosses below 50.
The Jurik RSX is a more advanced version of the RSX indicator, and while it can be useful in identifying potential trade opportunities, it should not be used in isolation. It is best used in conjunction with other technical and fundamental analysis tools to make informed trading decisions.
What is Slow RSI?
Slow RSI is a variation of the traditional Relative Strength Index ( RSI ) indicator. It is a more smoothed version of the RSI and is designed to filter out some of the noise and short-term price fluctuations that can occur with the standard RSI .
The Slow RSI uses a longer period of time than the traditional RSI , typically 21 periods instead of 14. This longer period helps to smooth out the price data and makes the indicator less reactive to short-term price fluctuations.
Like the traditional RSI , the Slow RSI is used to identify potential overbought and oversold conditions in the market. It oscillates between 0 and 100, with values above 70 indicating overbought conditions and values below 30 indicating oversold conditions. Traders often use these levels as potential buy and sell signals.
The Slow RSI is a more conservative version of the RSI and can be useful in identifying longer-term trends in the market. However, it can also be slower to respond to changes in price, which may result in missed trading opportunities. Traders may choose to use a combination of both the Slow RSI and the traditional RSI to make informed trading decisions.
What is Rapid RSI?
Same as regular RSI but with a faster calculation method
What is Harris RSI?
Harris RSI is a technical analysis indicator that is a variation of the Relative Strength Index ( RSI ). It was developed by Larry Harris and is designed to help traders identify potential trend changes and momentum shifts in the market.
The Harris RSI uses a different calculation formula compared to the traditional RSI . It takes into account both the opening and closing prices of a financial instrument, as well as the high and low prices. The Harris RSI is also normalized to a range of 0 to 100, with values above 50 indicating a bullish trend and values below 50 indicating a bearish trend .
Like the traditional RSI , the Harris RSI is used to identify potential overbought and oversold conditions in the market. It oscillates between 0 and 100, with values above 70 indicating overbought conditions and values below 30 indicating oversold conditions. Traders often use these levels as potential buy and sell signals.
The Harris RSI is a more advanced version of the RSI and can be useful in identifying longer-term trends in the market. However, it can also generate more false signals than the standard RSI . Traders may choose to use a combination of both the Harris RSI and the traditional RSI to make informed trading decisions.
What is Cuttler RSI?
Cuttler RSI is a technical analysis indicator that is a variation of the Relative Strength Index ( RSI ). It was developed by Curt Cuttler and is designed to help traders identify potential trend changes and momentum shifts in the market.
The Cuttler RSI uses a different calculation formula compared to the traditional RSI . It takes into account the difference between the closing price of a financial instrument and the average of the high and low prices over a specified period of time. This difference is then normalized to a range of 0 to 100, with values above 50 indicating a bullish trend and values below 50 indicating a bearish trend .
Like the traditional RSI , the Cuttler RSI is used to identify potential overbought and oversold conditions in the market. It oscillates between 0 and 100, with values above 70 indicating overbought conditions and values below 30 indicating oversold conditions. Traders often use these levels as potential buy and sell signals.
The Cuttler RSI is a more advanced version of the RSI and can be useful in identifying longer-term trends in the market. However, it can also generate more false signals than the standard RSI . Traders may choose to use a combination of both the Cuttler RSI and the traditional RSI to make informed trading decisions.
What is Ehlers Smoothed RSI?
Ehlers smoothed RSI is a technical analysis indicator that is a variation of the Relative Strength Index ( RSI ). It was developed by John Ehlers and is designed to help traders identify potential trend changes and momentum shifts in the market.
The Ehlers smoothed RSI uses a different calculation formula compared to the traditional RSI . It uses a smoothing algorithm that is designed to reduce the noise and random fluctuations that can occur with the standard RSI . The smoothing algorithm is based on a concept called "digital signal processing" and is intended to improve the accuracy of the indicator.
Like the traditional RSI , the Ehlers smoothed RSI is used to identify potential overbought and oversold conditions in the market. It oscillates between 0 and 100, with values above 70 indicating overbought conditions and values below 30 indicating oversold conditions. Traders often use these levels as potential buy and sell signals.
The Ehlers smoothed RSI can be useful in identifying longer-term trends and momentum shifts in the market. However, it can also generate more false signals than the standard RSI . Traders may choose to use a combination of both the Ehlers smoothed RSI and the traditional RSI to make informed trading decisions.
█ GKD-C RSI of Fast Discrete Cosine Transform
What is the RSI of Fast Discrete Cosine Transform in terms of Forex trading?
The Relative Strength Index (RSI) is a popular technical indicator used in trading forex to measure the strength of a trend and identify potential trend reversals. While the Fast Discrete Cosine Transform (FDCT) is not directly related to the RSI, it can be used to analyze the frequency components of the price data used to calculate the RSI and improve its accuracy.
The RSI is calculated by comparing the average gains and losses of a financial instrument over a given period of time. The RSI value ranges from 0 to 100, with values above 70 indicating an overbought market and values below 30 indicating an oversold market.
One limitation of the RSI is that it only considers the average gains and losses over a fixed period of time, which may not capture the complex patterns and dynamics of financial markets. This is where the FDCT can be useful.
By applying the FDCT to the price data used to calculate the RSI, traders can identify the dominant frequency components of the price data and use this information to adjust the RSI calculation. For example, traders can weight the gains and losses based on the frequency components identified by the FDCT, giving more weight to the dominant frequencies and less weight to the lower frequencies.
This approach can improve the accuracy of the RSI calculation and provide traders with more reliable signals for identifying trends and potential trend reversals. Traders can also use the frequency components identified by the FDCT to develop more advanced trading strategies, such as identifying cycles in the market and using this information to develop trend-following strategies.
In summary, while the FDCT is not directly related to the RSI, it can be used to analyze the frequency components of the price data used to calculate the RSI and improve its accuracy. Traders can use the FDCT to identify dominant frequency components and adjust the RSI calculation accordingly, providing more reliable signals for identifying trends and potential trend reversals.
This indicator has period lengths that are powers of powers of 2. There is also a features to increase the resolution of the FDCT.
Requirements
Inputs
Confirmation 1 and Solo Confirmation: GKD-V Volatility / Volume indicator
Confirmation 2: GKD-C Confirmation indicator
Outputs
Confirmation 2 and Solo Confirmation Complex: GKD-E Exit indicator
Confirmation 1: GKD-C Confirmation indicator
Continuation: GKD-E Exit indicator
Solo Confirmation Simple: GKD-BT Backtest strategy
Additional features will be added in future releases.
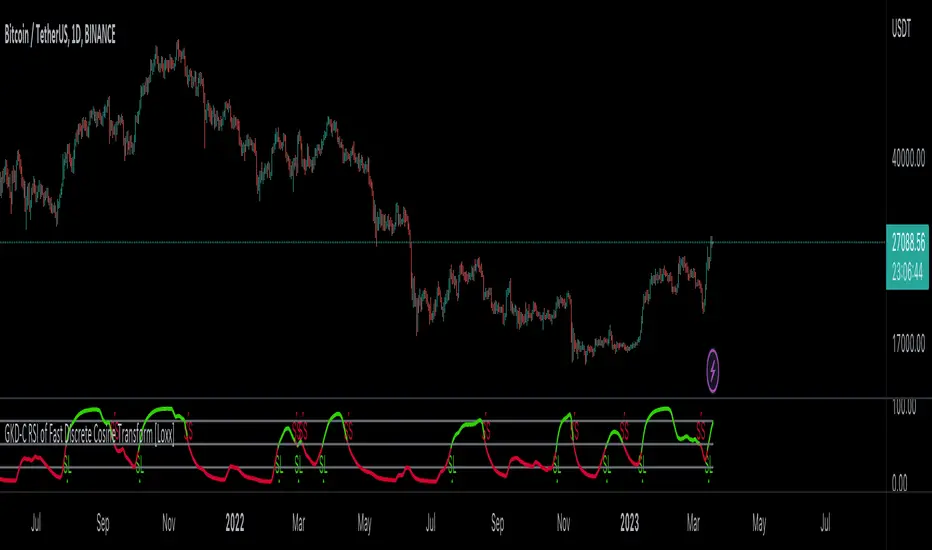
Strategy Developer ToolSolar Strategies: Strategy Developer Tool Complete Guide
This guide provides full explanation of the intended purpose of our script along with individual explanation of each input and the logic behind them coupled with general knowledge which we find useful in using our tool regarding elements of risk and strategy. Use this information wisely and understand we are not providing financial advise, this is a learning tool meant to help advance traders knowledge of the markets and their strategies which are formed as such.
Basics
Before getting into the specifics of how to use our strategy developer tool, it's important to understand a few basic fundamental things about it. The purpose of the tool is to allow the user to optimize a strategy through back testing with our strategy tracker and 50+ user inputs. The way you optimize your strategy depends on a couple things:
The state of the current and recent previous market.
The timeframe you trade on.
The types of trades you prefer. (swings, scalps, etc.)
How much risk you are willing to take on.
Risk Basics:
Going off the last bullet point on the list above, risk plays a huge part in how you optimize your strategy, with that being said here are a few general rules of risk as they relate to trades:
The more trades you take on, the more risk you are opening your strategy up to.
If done correctly, more trades will often result in more profit with slightly lower accuracy, and more risk.
The less trades you take on, the easier it is to have higher accuracy because ideally by rooting out the losing trades, you are left with fewer overall trades but mostly winning trades.
Less trades with higher accuracy often result in less profit but will 100% be less risky than the opposite. (More trades, less accurate, more profit, MORE RISK)
Input Basics:
More trades, less trades, more risk, less risk, what does this all mean as it relates to our tool?
The 50+ user inputs that allow you to optimize and create your strategy all effect when the script takes a trade.
Many of the inputs are essentially conditions. By changing these inputs, what you are doing is changing how specific the conditions need to be in order to take a trade.
This is how the inputs tie into the bullet point list above regarding risk and the number of trades you take on. By raising or lowering certain inputs, you are making the conditions more or less specific on when to trade.
Making conditions more specific will allow for less trades to be taken and will often result in a higher win rate, and less associated risk.
Making conditions less specific will allow for more trades to be taken and depending on the state of the market, could result in more profit being realized, but at the same time opens you up to more risk because you are stating a more general set of conditions in order to take a trade.
How does it work?
Our strategy developer tool is based on two simple factors in order to identify specific areas in the market deemed good for trade. They are as follows:
Directional momentum to identify when a move might happen.
A confirmation of the desired move.
Indicators:
The tool gets its information on these two factors from two custom built indicators which are hard coded into the script. These two indicators and the inputs which affect them can be found labeled with Indicator 1 or Indicator 2 in the tool's settings.
When the conditions are met based on the factors of both indicators, it then decides your stop losses and take profits using pivot points.
Indicator 1 is the momentum indicator.
Indicator 2 looks for confirmation of the move.
Hedges:
Since nothing is ever certain when trading, our tool also aims to minimize potential loss before it can happen by incorporating hedges when a signal prints in the opposite direction of the trade you are currently in.
To identify when to hedge, the candles will appear with the opposite color of your original trade. Candles, while in a long trade, appear as green and candles while in a short trade appear as red. While in a long trade the only time red candles will appear is when a hedge occurs and vice versa for shorts.
Example: If you just took a long trade based on a long signal that the script gave off, but a short signal prints off while you are in the long, you are directed to sell half your long position and enter that half into a short position. Since there is now more uncertainty in the long because of the short signal, minimizing your position size and having a smaller position in the opposite direction allows you to cover your bases if the trade moves against you. If it doesn’t move against you and ends up going long as originally intended, you are not to lose any money, likely a small profit or break even when all is said and done.
In order to give the hedges a greater change of hitting, the take profits are smaller than a normal trade, this way even if your hedge wasn’t necessary and the original trade does not move against you, it's likely that your hedge will still win, and you can just consider it a small scalp to further your profits on the original trade.
Doubles:
Besides minimizing loss, we also aim to maximize the potential gain. When a second signal prints off in the direction of the trade you are currently already in, the tool directs you to double your position size.
The signal for doubling is a label with “2x” written inside.
The logic here is similar to hedging but in the opposite way. Just as a signal in the opposite direction creates uncertainty, a signal in the same direction indicates more certainty hence doubling your position size.
Example: If you are currently in a long position and you get a second long signal, you would then double your existing position since two long signals printing off before the first one has a chance to play out indicates a stronger chance of movement in the intended direction of your trade.
User Inputs
Upon opening the tools settings tab, you will find all the user inputs which can then be modified to fit your desired strategy. In this section of our guides, you will find individual explanations and use cases for each input so you can correctly use them to your best advantage.
Strategy Tracker Table:
By ticking this input on, the strategy tracker table will be visible to the user. (Default is on)
Indicator 1 Greater Than: Long:
By ticking this input on, you are adding a condition the script will then look for in order to take a long. (Default is on)
This condition is that an average of indicator 1, which searches for momentum, must fall above a certain level, which is determined in the next input.
The purpose of this is to ensure that the average momentum is not too low because this would indicate prolonged downwards movement on the timeframe of the market being observed, making a long position riskier.
Indicator 1 Greater Than Input: Long:
This input correlates to the previous input directly above.
If Indicator 1 Greater Than: Long is ticked on, then one of the conditions in order to take a long position will be that the average of indicator 1 must fall above the level which you set in this input.
max level 100, min level 0
Indicator 1 Less Than: Long
By ticking this input on, you are adding a condition the script will then look for in order to take a long position. (Default is on)
This condition is that an average of indicator 1, which searches for momentum, must fall below a certain level, which is determined in the next input.
The purpose of this is to ensure that the average momentum is not too high, because this would indicate a prior significant upwards movement or trend on the timeframe of the market being observed.
Taking a long position while the average momentum is at higher levels exposes the risk of longing as the market has started to pull back from a peak or when the market has just reached a peak.
Indicator 1 Less Than Input: Long
This input correlates to the previous input directly above.
If Indicator 1 Less Than: Long is ticked on, then one of the conditions in order to take a long position will be that the average of indicator 1 must fall below the level which you set in this input.
max level 100, min level 0
Indicator 1 Greater Than: Short
By ticking this input on, you are adding a condition the script will then look for in order to take a short. (Default is on)
This condition is that an average of indicator 1, which searches for momentum, must fall above a certain level, which is determined in the next input.
The purpose of this is to ensure that the average momentum is not too low because this would indicate prolonged downwards movement or trend on the timeframe of the market being observed.
Taking a short position while the average momentum is at lower levels exposes the risk of shorting as the market has started to recover from a bottom or when the market has just reached a bottom.
Indicator 1 Greater Than Input: Short
This input correlates to the previous input directly above.
If Indicator 1 Greater Than: Short is ticked on, then one of the conditions in order to take a short position will be that the average of indicator 1 must fall above the level which you set in this input.
max level 100, min level 0
Indicator 1 Less Than: Short
By ticking this input on, you are adding a condition the script will then look for in order to take a short position. (Default is on)
This condition is that an average of indicator 1, which searches for momentum, must fall below a certain level, which is determined in the next input.
The purpose of this is to ensure that the average momentum is not too high, because this would indicate a prior significant upwards movement or trend on the timeframe of the market being observed.
Taking a short position while the average momentum is at higher levels exposes the risk of shorting as the market is currently in a strong uptrend.
Indicator 1 Less Than: Short
This input correlates to the previous input directly above.
If Indicator 1 Less Than: Short is ticked on, then one of the conditions in order to take a short position will be that the average of indicator 1 must fall below the level which you set in this input.
max level 100, min level 0
Summary of Input Group: Indicator 1 Greater/Less Than Long/Short
This grouping of inputs is best used as a filter of sorts, much like many of the other inputs which are also essentially filters of the market to find areas ripe for trade. Specifically, however, this group of inputs is especially powerful because if used correctly, it can specify a range for the average momentum to fall in when looking for either long or short trades. Think of it like a sweet spot where the average is not too high nor too low. In combination with the numerous other inputs which will shortly be explained, this sweet spot can be a great indication. Keep in mind that once you find a working range, this will not last forever. Conditions in the market are ever changing and as such your inputs, in this case the range the average momentum must fall in, will also need to change with the market conditions.
Bars Since Crossover:
This input simply describes a crossover of the momentum indicator (indicator 1) and its average.
In the category How does it work? Two main factors are discussed, the first being directional momentum to determine when an upwards move might happen. The crossover correlated to this input is the directional momentum as mentioned earlier.
As also mentioned in How does it work? The second factor is a confirmation of the desired upwards move. This confirmation is a crossover of the current price and indicator 2 which will be further addressed later on.
What's important to understand about the two key factors at play in regard to Bars Since Crossover is that this input is determining a condition which looks for a certain number of bars prior to the confirmation of indicator 2 which the crossover of momentum and its average has happened on indicator 1.
Example: Bars Since Crossover input is set to 10. This means that the crossover of momentum and its average from indicator 1 must be within 10 bars prior to the confirmation from indicator 2. If this happens then this condition is met for a long position.
Bars Since Crossunder:
This input simply describes a crossunder of the momentum indicator (indicator 1) and its average.
In the category How does it work? Two main factors are discussed, the first being directional momentum to determine when a downwards move might happen. The crossunder correlated to this input is the directional momentum as mentioned earlier.
As also mentioned in How does it work? The second factor is a confirmation of the desired downwards move. This confirmation is a crossunder of the current price and indicator 2 which will be further addressed later on.
What's important to understand about the two key factors at play in regard to Bars Since Crossunder is that this input is determining a condition which looks for a certain number of bars prior to the confirmation of indicator 2 which the crossunder of momentum and its average has happened on indicator 1.
Example: Bars Since Crossunder input is set to 10. This means that the crossunder of momentum and its average from indicator 1 must be within 10 bars prior to the confirmation from indicator 2. If this happens then this condition is met for a short position.
Summary of Input Group: Bars Since Crossover/Crossunder
These two inputs can have a large effect on the types of trades being taken and the risk which your strategy opens up to. The idea is that in order for the two key factors described in How does it work? to be correlated and therefore indicate a strong directional move, the two events must happen within a somewhat small period of time. If the period of time between the two events taking place is too large, then it's riskier for your strategy due to a delay in directional momentum and the necessary confirmation. It's important to note that this “small period of time” is relative to the security you're trading and the timeframe its being trades on. Small could mean 5 bars in some cases or 20 bars in others, this is why our custom back tester exists. So that the process of optimization on different securities and different timeframes is smooth and only requires adjustments to inputs then your own analysis of the back test results.
Indicator 1 Input Long
Defines how strong the upwards momentum needs to be in order to take a long position.
When optimizing your strategy, this input is likely to have some of the most effect on when the script takes a long position.
The reasoning for this is because the level you set for this input is the level which indicator 1 must close above following the crossover of its average.
Example: Indicator 1 Input Long set to 50, this means that when the momentum crosses over its average from indicator 1, upon the close of this crossover the momentum must be above the level 50 in order for this condition to be met to take a long position.
The higher the level, the stronger the upwards momentum must be, and therefore by using higher levels for this input, the script will search for stronger directional moves leaving less chance for the trade to move against you.
Indicator 1 Input Short
Defines how strong the downwards momentum needs to be in order to take a short position.
When optimizing your strategy, this input is likely to have some of the most effect on when the script takes a short position.
The reasoning for this is because the level you set for this input is the level which indicator 1 must close below following the crossunder of its average.
Example: Indicator 1 Input Short set to 40, this means that when the momentum crosses under its average from indicator 1, upon the close of this crossunder the momentum must be below the level 40 in order for this condition to be met to take a short position.
The lower the level, the stronger the downwards momentum must be, and therefore by using lower levels for this input, the script will search for stronger directional moves leaving less chance for the trade to move against you.
Summary of Input Group: Indicator 1 Input Long/Short
These two inputs are so important to your strategy because at the end of the day no matter how you set it up, it's still a momentum-based strategy. With that being said the level of momentum or the strength needed in order to take trades is of course going to be a key decider in the successfulness of the strategy. When optimizing these two inputs make sure to take into account what the overall market conditions are, meaning if it’s a bull market maybe make the momentum needed to take a long slightly less comparatively to the amount needed to take a short, in other words make long conditions less specific and short conditions more specific. Slight variations of this input can have very big effects, even changing it by 1 or 2 can make a major difference. In might even be good to consider starting optimization with these inputs and then work the rest of the strategy out from there. A lot could be said about these inputs and more docs will be added in order to further explain more strategy approaches revolving around them, for now don’t hesitate to ask any questions.
Indicator 2 Red
This input is used as a sort of chop filter at its base level, however if used correctly it can be a much broader filter for what areas of the market you want to trade in.
Indicator 2 shows as either red or green and is used as a confirmation when price crosses over it following the crossover of momentum and its average from indicator 1 to take a long position.
If ticked on, Indicator 2 Red states a condition in order for the script to take a long position. (Default is on)
The condition is that upon the crossover of the current price and Indicator 2, 10 bars ago indicator 2 must have been red.
The reason for this input is because the current color of indicator 2 upon the crossover must also be red. However, this condition is hard coded in and cannot be changed by any input.
This is because the type of trade being targeted is that of a type of reversal or continuation.
If indicator 2 showed green 10 bars ago and is currently red this would indicate that a top was just reached, and price is reversing downwards making this not a good area to take a long.
Another scenario if indicator 2 showed green 10 bars ago and is currently red is that there is currently a sideways trend going on or otherwise known as chop, also not an ideal area to take a long
However, if 10 bars ago indicator 2 was red and it's currently red this would indicate a more prolonged pullback.
If all conditions are met and we know that price has been pulling back, now we can enter a long with more knowledge pointing to price reversing upwards from a downwards trend, or continuing its upwards trend after a pullback.
Indicator 2 Green
This input is used as a sort of chop filter at its base level, however if used correctly it can be a much broader filter for what areas of the market you want to trade in.
Indicator 2 shows as either red or green and is used as a confirmation when price crosses under it following the crossunder of momentum and its average from indicator 1 to take a short position.
If ticked on, Indicator 2 Green states a condition in order for the script to take a short position. (Default is on)
The condition is that upon the crossunder of the current price and Indicator 2, 10 bars ago indicator 2 must have been green.
The reason for this input is because the current color of indicator 2 upon the crossunder must also be green. However, this condition is hard coded in and cannot be changed by any input.
This is because the type of trade being targeted is that of a type of reversal or continuation.
If indicator 2 showed red 10 bars ago and is currently green this would indicate that a bottom was just reached, and price is reversing upwards making this not a good area to take a short.
Another scenario if indicator 2 showed red 10 bars ago and is currently green is that there is currently a sideways trend going on or otherwise known as chop, also not an ideal area to take a short.
However, if 10 bars ago indicator 2 was green and it's currently green this would indicate a more prolonged upwards movement.
If all conditions are met and we know that price has been moving up, now we can enter a short with more knowledge pointing to price reversing downwards from an upwards trend, or continuing its downwards trend after a bounce up.
Summary of Input Group: Indicator 2 Red/Green
Similar to Indicator 1 Greater/Less Than Long/Short, the goal of these inputs is to try to get a picture of what the previous recent market has been doing. By getting this picture it's easier to find different areas of the market more ideal for trades. Different from Indicator 1 Greater/Less Than Long/Short though, Indicator 2 Red/Green is directly correlated to the price action in the market rather than the momentum. By switching these on or off you are setting more or less specific conditions for taking trades. Some markets require this extra condition to lower your risk in your strategy, however others may not.
Pivot Low
This input is used to define the number of bars the script will look back to grab a pivot low when taking a long position.
This pivot low is then used to set the stop loss when entering a long position.
This input is very important and optimizing it correctly can be extremely crucial to your strategies success.
The Strategy Developer tool uses a 1:1 risk to reward ratio when setting your first take profit point, so when the script looks back to get a pivot low based on the input you set, it will then set your first take profit at an equal ratio to the stop loss found from the pivot low.
The goal in optimizing this input is to give enough lookback to find real pivot points where price has reversed off of, but not to give too much lookback where its grabbing previous pivot points unrelated to the current move of momentum the script is giving a long signal from.
Consider the type of trades you're looking for in your strategy and what timeframe you are trying to trade on.
Longer swing trades which aim to catch bigger moves in the market, possibly on higher time frames, may require a further lookback in order to get your take profits in the correct positioning to catch the desired move, and not exit early before the trade has fully played out.
Shorter scalp trades may aim to catch smaller moves and therefore you don’t want to allow for too much risk by having a large stop loss and large take profits as a result.
Pivot Low 2
Pivot low 2 can be thought of as a backup lookback in order to get the correct pivot low.
In an input which will be discussed shortly called Pivot Low Minimum, you can set a minimum percentage for your pivot low to be, if the pivot low does not meet the minimum then the script will look to Pivot Low 2’s input to use as a bar lookback in order to get the correct pivot low.
This input is used because you might find a Pivot Low input that works well for the majority of the trades in your back tested strategy, however, there will always be outliers and when this Pivot Low input falls short of getting the correct level to put your stop losses at, Pivot Low 2 is used.
Pivot Low 2’s input should always be higher than Pivot Low’s input, that way you can allow the script to look back further in time to find the correct level when the minimum is not met.
Pivot High
This input is used to define the number of bars the script will look back to grab a pivot high when taking a short position.
This pivot high is then used to set the stop loss when entering a short position.
This input is very important and optimizing it correctly can be extremely crucial to your strategies success.
The Strategy Developer tool uses a 1:1 risk to reward ratio when setting your first take profit point, so when the script looks back to get a pivot high based on the input you set, it will then set your first take profit at an equal ratio to the stop loss found from the pivot high.
The goal in optimizing this input is to give enough lookback to find real pivot points where price has reversed off of, but not to give too much lookback where its grabbing previous pivot points unrelated to the current move of momentum the script is giving a short signal from.
Consider the type of trades you're looking for in your strategy and what timeframe you are trying to trade on.
Longer swing trades which aim to catch bigger moves in the market, possibly on higher time frames, may require a further lookback in order to get your take profits in the correct positioning to catch the desired move, and not exit early before the trade has fully played out.
Shorter scalp trades may aim to catch smaller moves and therefore you don’t want to allow for too much risk by having a large stop loss and large take profits as a result.
Pivot High 2
Pivot high 2 can be thought of as a backup lookback in order to get the correct pivot high.
In an input which will be discussed shortly called Pivot High Minimum, you can set a minimum percentage for your pivot high to be, if the pivot high does not meet the minimum then the script will look to Pivot High 2’s input to use as a bar lookback in order to get the correct pivot high.
This input is used because you might find a Pivot High input that works well for the majority of the trades in your back tested strategy, however, there will always be outliers and when this Pivot High input falls short of getting the correct level to put your stop losses at, Pivot High 2 is used.
Pivot High 2’s input should always be higher than Pivot High’s input, that way you can allow the script to look back further in time to find the correct level when the minimum is not met.
Pivot Low Risk Tolerance
This input is very important in managing the risk associated with your strategy.
Pivot Low Risk Tolerance is defining a maximum percentage the pivot low can be away from your entry.
Since the pivot low that’s found is assigned to your stop loss and directly affects the placement of your take profits when taking a long position, making sure the pivot low isn’t too far down is crucial.
Depending on the types of trades you're aiming to take, the timeframe you choose to trade on, and the leverage you use in your strategy, you may want to assign a higher risk tolerance or a lower one.
Example: Pivot Low Risk Tolerance input set to 3, this means that when all other conditions are met in order to take a long position, when searching for the pivot low in order to set a stop loss, if the script finds the pivot low is greater than 3% away from the entry point, it will not take the trade.
Pivot High Risk Tolerance
This input is very important in managing the risk associated with your strategy.
Pivot High Risk Tolerance is defining a maximum percentage the pivot high can be away from your entry.
Since the pivot high that’s found is assigned to your stop loss and directly affects the placement of your take profits when taking a short position, making sure the pivot high isn’t too far up is crucial.
Depending on the types of trades you're aiming to take, the timeframe you choose to trade on, and the leverage you use in your strategy, you may want to assign a higher risk tolerance or a lower one.
Example: Pivot High Risk Tolerance input set to 3, this means that when all other conditions are met in order to take a short position, when searching for the pivot high in order to set a stop loss, if the script finds the pivot high is greater than 3% away from the entry point, it will not take the trade.
Pivot Low Minimum
Sometimes when searching for the pivot low, the script's defined lookback may not be enough to find the proper pivot point.
This can cause improper placement of stop losses and take profits and may cause trades to be exited early before they can fully play out in your favor.
Pivot Low Minimum is an input used to combat this problem, when the script finds a pivot low that does not meet the minimum percentage away from the entry point, it will then turn to Pivot Low 2 input in order to gain a further lookback and grab the correct pivot point to set your stop loss and take profits with.
When reading and setting this input, understand that setting it to 1 means there is no minimum, setting it to 0.9 would mean the minimum is a 10% difference between the pivot low and your entry point.
Think of it in terms of decimals and their equivalent percentage, 0.1 is equal to 10%, 0.01 is equal to 1%.
Whatever percentage you want to set for a minimum, convert it to a decimal, then simply subtract it from 1.
Example: Say you desire a 1.5% minimum pivot low and as a result an equivalent stop loss of 1.5% below your long entry and furthermore a take profit 1.5% above your long entry since the script uses a 1:1 ratio. Converting 1.5% to a decimal would give you 0.015, then subtracting it from 1 would give you 0.985, this would be the input assigned to Pivot Low Minimum.
Pivot High Minimum
Sometimes when searching for the pivot high, the script's defined lookback may not be enough to find the proper pivot point.
This can cause improper placement of stop losses and take profits and may cause trades to be exited early before they can fully play out in your favor.
Pivot High Minimum is an input used to combat this problem, when the script finds a pivot high that does not meet the minimum percentage away from the entry point, it will then turn to Pivot High 2 input in order to gain a further lookback and grab the correct pivot point to set your stop loss and take profits with.
When reading and setting this input, understand that setting it to 1 means there is no minimum, setting it to 0.9 would mean the minimum is a 10% difference between the pivot high and your entry point.
Think of it in terms of decimals and their equivalent percentage, 0.1 is equal to 10%, 0.01 is equal to 1%.
Whatever percentage you want to set for a minimum, convert it to a decimal, then simply subtract it from 1.
Example: Say you desire a 1.5% minimum pivot high and as a result an equivalent stop loss of 1.5% above your short entry and furthermore a take profit 1.5% below your short entry since the script uses a 1:1 ratio. Converting 1.5% to a decimal would give you 0.015, then subtracting it from 1 would give you 0.985, this would be the input assigned to Pivot High Minimum.
Summary of Input Group: Pivot Low/High - Pivot Low/High 2 – Pivot Low/High Risk Tolerance – Pivot Low/High Minimum
The first key takeaway from all these inputs is that your stop losses and take profits will be directly affected through optimizing any of them. The second key takeaway is that these inputs are crucial in managing the risk in your strategy, and while this has been said many times throughout the guide for various inputs, when it comes to stop losses and take profits it is especially true. Having a stop loss which is too high opens up the possibility for much bigger losses, and as a result your take profits will also be too high, minimizing the chance of any of them being hit. Having a stop loss which is too low increases the chance that your trade will get stopped out preemptively, before the trade can mature and move in your favor because remember that trades will not always move immediately in the intended direction, a good amount of patience is often involved in creating consistent successful trades and a successful strategy as such. On the same note, too low of a stop loss could also mean you are missing out on unrealized profit since your take profits are a direct result of the stop loss which is found. When optimizing your pivot low/high risk tolerance, think not about how much you are willing to lose on a single trade, but how much your portfolio can actually afford to lose not just on a single trade but multiple trades, sometimes even in a row. Obviously, the goal in creating a strategy is that you avoid losing trades and especially multiple in a row, however, there are many things that can’t be accounted for. The only way to manage this unaccounted risk is to use proper risk management and not open yourself up to big losses even in the worst most unlikely scenarios. Even if you don’t lose multiple trades in a row, ask yourself, could I afford to lose multiple trades with the risk tolerance I have set if everything were to go to $hit, (hopefully it would not), but in the off chance it did, instead of beating yourself up over what you did wrong, you’ll be patting yourself on the back for what you did right.
TP2-4 Long Placement
The first thing to understand about the take profit placement is that our system of stop losses and take profits uses a 1:1 risk to reward ratio for the first stop loss and first take profit.
This means that if your stop loss falls 2% below your long entry, your first take profit will be 2% above your long entry, hence 1:1.
As for take profits 2-4, they are just extensions of that ratio. This means that if TP2 Long Placement is set to 1.5, the ratio for your second take profit is 1:1.5.
Using the same percentage from the second bullet point being 2%, we can now gather that with a 1:1.5 ratio our second take profit would be at 3% above our long entry.
The same applies for the rest of the take profits, meaning whatever the take profit is set at regardless of which one, apply that number to the second placeholder of the ratio.
Example: First stop loss falls 2% below long entry. TP2 Long Placement input set to 1.5; risk to reward ratio is 1:1.5; corresponding percentage would be a 3% gain. TP3 Long Placement input set to 2; risk to reward ratio is 1:2; corresponding percentage would be a 4% gain. TP4 Long Placement input set to 2.5; risk to reward ratio is 1:2.5; corresponding percentage would be a 5% gain.
The next key thing to understand about the trailing take profits system is the position size being sold at each take profit and therefore how the strategy tracker calculates your strategy's profit.
At the first take profit, 50% of your position is being calculated as sold, locking in good profits off the bat.
At TP2, 20% of your position is being calculated as sold, leaving a remaining 30% open to gain more profit.
At TP3, another 20% of your position is being calculated as sold, leaving 10% to collect any additional possible gains.
At TP4 the remaining 10% of your position is sold and the trade will be fully closed out.
SL2-4 Long Placement
Our system of trailing stop losses is completely similar to that of our trailing take profits.
Just like the trailing take profits, the inputs for stop losses 2-4 are also used as the second placeholders in the risk to reward ratio.
This may be confusing since generally stop losses are associated with a loss on your position, however, the only stop loss which results in a loss on your position is the first one, not stop losses 2-4.
This is because once your first take profit is hit on your long, your stop loss will automatically move up to the price equivalent to the ratio which you set using these inputs that lies in profit.
Example: Since your first take profit will always be at a 1:1 risk to reward ratio with your stop loss, your second take profit could be at a 1:0.8 ratio. So, to clarify, once your first take profit is hit at a 1:1, your original first stop loss will now be moved up in profits to just below your first take profit at a 1:0.8 risk to reward ratio. This only happens AFTER the first take profit is hit.
For stop losses 3 and 4, the same logic is true, once TP2 is hit, your second stop loss will now be moved up to the placement of SL3 which will fall somewhere below TP2. Once TP3 is hit, your third stop loss will now be moved up to the placement of SL4 which will fall somewhere below TP3. If stop loss 4 does not get hit, then the only thing left to happen is for TP4 to hit and the trade will fully close out.
The one major difference between our system of trailing stop losses and take profits is that no matter what stop loss is hit, the entire remainder of your position will be calculated as sold.
So, if your first take profit hits and sells 50% of your long position, but the trade does not continue upwards and moves down to your second stop loss, the remaining 50% of your position will be calculated as sold.
The same applies to SL3 and SL4, so at SL3 the remaining 30% of your position will be calculated as sold, and at SL4 the remaining 10% will be calculated as sold.
Your trailing stop loss placement is dependent on what types of trades you desire. For shorter scalps on smaller timeframes, it's recommended to place each stop loss just below each corresponding take profit for long trades.
This way you leave just enough room for the trade to continue upwards if there is enough momentum, but you don’t open yourself up to losing your unrealized profit if it does not make this continuation.
If you desire longer swing trades on higher timeframes, it might be a good idea to leave more room in between the take profit and corresponding stop loss.
This way you leave more room for the trade to mature and move in your favor since when trading longer moves, often they will not shoot straight up but rather have a series of small pullbacks throughout the more general upwards trend.
Note that when a long trade is first entered the only stop loss and take profit in play are your original stop loss found by the pivot low which would result in a loss, and the first take profit at a 1:1 risk to reward ratio from that pivot low.
TP2-4 Short Placement
The first thing to understand about the take profit placement is that our system of stop losses and take profits uses a 1:1 risk to reward ratio for the first stop loss and first take profit.
This means that if your stop loss falls 2% above your short entry, your first take profit will be 2% below your short entry, hence, 1:1.
As for take profits 2-4, they are just extensions of that ratio. This means that if TP2 Short Placement is set to 1.5, the ratio for your second take profit is 1:1.5.
Using the same percentage from the second bullet point being 2%, we can now gather that with a 1:1.5 ratio our second take profit would be at 3% below our short entry.
The same applies for the rest of the take profits, meaning whatever the take profit is set at regardless of which one, apply that number to the second placeholder of the ratio.
Example: First stop loss falls 2% above short entry. TP2 Short Placement input set to 1.5; risk to reward ratio is 1:1.5; corresponding percentage would be a 3% gain. TP3 Short Placement input set to 2; risk to reward ratio is 1:2; corresponding percentage would be a 4% gain. TP4 Short Placement input set to 2.5; risk to reward ratio is 1:2.5; corresponding percentage would be a 5% gain.
The next key thing to understand about the trailing take profits system is the position size being sold at each take profit and therefore how the strategy tracker calculates your strategy's profit.
At the first take profit, 50% of your position is being calculated as sold, locking in good profits off the bat.
At TP2, 20% of your position is being calculated as sold, leaving a remaining 30% open to gain more profit.
At TP3, another 20% of your position is being calculated as sold, leaving 10% to collect any additional possible gains.
At TP4 the remaining 10% of your position is sold and the trade will be fully closed out.
SL2-4 Short Placement
Our system of trailing stop losses is completely similar to that of our trailing take profits.
Just like the trailing take profits, the inputs for stop losses 2-4 are also used as the second placeholders in the risk to reward ratio.
This may be confusing since generally stop losses are associated with a loss on your position, however, the only stop loss which results in a loss on your position is the first one, not stop losses 2-4.
This is because once your first take profit is hit on your short, your stop loss will automatically move down to the price equivalent to the ratio which you set using these inputs that lies in profit.
Example: Since your first take profit will always be at a 1:1 risk to reward ratio with your stop loss, your second take profit could be at a 1:0.8 ratio. So, to clarify, once your first take profit is hit at a 1:1, your original first stop loss will now be moved down in profits to just below your first take profit at a 1:0.8 risk to reward ratio. This only happens AFTER the first take profit is hit.
For stop losses 3 and 4, the same logic is true, once TP2 is hit, your second stop loss will now be moved down to the placement of SL3 which will fall somewhere above TP2. Once TP3 is hit, your third stop loss will now be moved down to the placement of SL4 which will fall somewhere above TP3. If stop loss 4 does not get hit, then the only thing left to happen is for TP4 to hit and the trade will fully close out.
The one major difference between our system of trailing stop losses and take profits is that no matter what stop loss is hit, the entire remainder of your position will be calculated as sold.
So, if your first take profit hits and sells 50% of your short position, but the trade does not continue downwards and moves up to your second stop loss, the remaining 50% of your position will be calculated as sold.
The same applies to SL3 and SL4, so at SL3 the remaining 30% of your position will be calculated as sold, and at SL4 the remaining 10% will be calculated as sold.
Your trailing stop loss placement is dependent on what types of trades you desire. For shorter scalps on smaller timeframes, it's recommended to place each stop loss just above each corresponding take profit for short trades.
This way you leave just enough room for the trade to continue downwards if there is enough momentum, but you don’t open yourself up to losing your unrealized profit if it does not make this continuation.
If you desire longer swing trades on higher timeframes, it might be a good idea to leave more room in between the take profit and corresponding stop loss.
This way you leave more room for the trade to mature and move in your favor since when trading longer moves, often they will not shoot straight down but rather have a series of small bounces throughout the more general downwards trend.
Note that when a short trade is first entered the only stop loss and take profit in play are your original stop loss found by the pivot high which would result in a loss, and the first take profit at a 1:1 risk to reward ratio from that pivot high.
Summary of Take Profit/Stop Loss Placement:
Correctly placed take profits and stop losses are essential in having a successful strategy and proper risk management. With that being said there are also many ways in which to use this system. Deciding how to set them up is really just a matter of determining the trading style you aim to succeed with. Once this has been determined, the placement of take profits and stop losses should be easier to configure. However, if there is any confusion on either of these topics as the ratios and corresponding TP/SL can get confusing, please do not hesitate to ask further questions in our discord!
Leverage Long
Leverage Long input simply defines the leverage used in your long positions, and is used in calculating the profit in Strategy Tracker
A rundown of risk associated with using leverage will not be given here since it should assume that if you're using leverage, you should already understand the risks.
If you are not using any leverage, then set Leverage Long input to 1.
Long Position Size
This input defines the position size you are using in your long trades.
This input is also used in calculating profit in Strategy Tracker.
Long Hedge Position Size
This input is used to define the position size of long hedge positions.
This input is also used in calculating profit in Strategy Tracker.
Important: Your Long Hedge Position Size should always be half of your Long Position Size for accurate profit calculation.
Double Long Position Size
This input is used to define the position size when in a double long.
This input is also used in calculating profit in Strategy Tracker
Important: Your Double Long Position Size should always be double your Long Position Size for accurate profit calculation.
Short Position Size
This input defines the position size you are using in your short trades.
This input is also used in calculating profit in Strategy Tracker.
Short Hedge Position Size
This input is used to define the position size of short hedge positions.
This input is also used in calculating profit in Strategy Tracker.
Important: Your Short Hedge Position Size should always be half of your Short Position Size for accurate profit calculation.
Double Short Position Size
This input is used to define the position size when in a double short.
This input is also used in calculating profit in Strategy Tracker
Important: Your Double Short Position Size should always be double your Short Position Size for accurate profit calculation.
A Message From the Developer PLEASE READ!!!
If you have made it this far in the guide, I applaud you and thank you for sticking with it as I know there is a lot of information here! This is not an exaggeration when I say there are hundreds of millions of possible variations that could be applied throughout all the inputs which is why I much prefer to call this a tool rather than an algorithm. Algorithm is a loaded word in my opinion as it comes with an implication of guarantee in the trades being made. This is not meant to discourage anybody from taking trades based off the tool which is also why I provided the option for automated alerts which through third party software can turn into automated trades; if you have the confidence in your strategy by all means I encourage you to trade it, automated or not. Just please understand that it's highly recommended to also apply your own knowledge and analysis before taking a trade as historical back testing data has its limitations and cannot always account for current market conditions. The real applicability does not fall in what the back tester window is saying you would have made or how accurate your strategy would have been, it's within the sheer number of markets and scenarios this tool can be used in and the information you can get which a human just can’t comprehend all at once; its literally endless. I urge all of you to be creative and think outside the box about what you can do with such a powerful tool at your fingertips. After all this is the reason why so many inputs were provided. Another main goal of this project was to give users a better understanding of risk management. It can be hard to manage your risk when it’s all kept in your head, but when you can modify your strategy to better manage your risk by simply optimizing a few inputs, it’s a lot easier to comprehend and actually apply when trading. The last thing I want to say is have fun working through the possible learning curve in using this tool, it may be a process but enjoy it because the one thing I can guarantee is that you will come out the other side a better trader than before!

Quantify [Trading Model] | FractalystNote: In this description, "TM" refers to Trading Model (not trademark) and "EM" refers to Entry Model
What’s the indicator’s purpose and functionality?
You know how to identify market bias but always struggle with figuring out the best exit method, or even hesitating to take your trades?
I've been there. That's why I built this solution—once and for all—to help traders who know the market bias but need a systematic and quantitative approach for their entries and trade management.
A model that shows you real-time market probabilities and insights, so you can focus on execution with confidence—not doubt or FOMO.
How does this Quantify differentiate from Quantify ?
Have you managed to code or even found an indicator that identifies the market bias for you, so you don’t have to manually spend time analyzing the market and trend?
Then that’s exactly why you might need the Quantify Trading Model.
With the Trading Model (TM) version, the script automatically uses your given bias identification method to determine the trend (bull vs bear and neutral), detect the bias, and provide instant insight into the trades you could’ve taken.
To avoid complications from consecutive signals, it uses a kNN machine learning algorithm that processes market structure and probabilities to predict the best future patterns.
(You don’t have to deal with any complexity—it’s all taken care of for you.)
Quantify TM uses the k-Nearest Neighbors (kNN) machine learning algorithm to learn from historical market patterns and adapt to changing market structures. This means it can recognize similar market conditions from the past and apply those lessons to current trading decisions.
On the other hand, Quantify EM requires you to manually select your directional bias. It then focuses solely on generating entry signals based on that pre-determined bias.
While the entry model version (EM) uses your manual bias selection to determine the trend, it then provides insights into trades you could’ve taken and should be taking.
Trading Model (TM)
- Uses `input.source()` to incorporate your personal methodology for identifying market bias
- Automates everything—from bias detection to entry and exit decisions
- Adapts to market bias changes through kNN machine learning optimization
- Reduces human intervention in trading decisions, limiting emotional interference
Entry Model (EM)
- Focuses specifically on optimizing entry points within your pre-selected directional bias
- Requires manual input for determining market bias
- Provides entry signals without automating alerts or bias rules
Can the indicator be applied to any market approach/trading strategy?
Yes, if you have clear rules for identifying the market bias, then you can code your bias detection and then use the input.source() user input to retrieve the direction from your own indicator, then the Quantify uses machine-learning identify the best setups for you.
Here's an example:
//@version=6
indicator('Moving Averages Bias', overlay = true)
// Input lengths for moving averages
ma10_length = input.int(10, title = 'MA 10 Length')
ma20_length = input.int(20, title = 'MA 20 Length')
ma50_length = input.int(50, title = 'MA 50 Length')
// Calculate moving averages
ma10 = ta.sma(close, ma10_length)
ma20 = ta.sma(close, ma20_length)
ma50 = ta.sma(close, ma50_length)
// Identify bias
var bias = 0
if close > ma10 and close > ma20 and close > ma50 and ma10 > ma20 and ma20 > ma50
bias := 1 // Bullish
bias
else if close < ma10 and close < ma20 and close < ma50 and ma10 < ma20 and ma20 < ma50
bias := -1 // Bearish
bias
else
bias := 0 // Neutral
bias
// Plot the bias
plot(bias, title = 'Identified Bias', color = color.blue,display = display.none)
Once you've created your custom bias indicator, you can integrate it with Quantify :
- Add your bias indicator to your chart
- Open the Quantify settings
- Set the Bias option to "Auto"
- Select your custom indicator as the bias source
The machine learning algorithms will then analyze historical price action and identify optimal setups based on your defined bias parameters. Performance statistics are displayed in summary tables, allowing you to evaluate effectiveness across different timeframes.
Can the indicator be used for different timeframes or trading styles?
Yes, regardless of the timeframe you’d like to take your entries, the indicator adapts to your trading style.
Whether you’re a swing trader, scalper, or even a position trader, the algorithm dynamically evaluates market conditions across your chosen timeframe.
How Quantify Helps You Trade Profitably?
The Quantify Trading Model offers several powerful features that can significantly improve your trading profitability when used correctly:
Real-Time Edge Assessment
It displays real-time probability of price moving in your favor versus hitting your stoploss
This gives you immediate insight into risk/reward dynamics before entering trades
You can make more informed decisions by knowing the statistical likelihood of success
Historical Edge Validation
Instantly shows whether your trading approach has demonstrated an edge in historical data
Prevents you from trading setups that historically haven't performed well
Gives confidence when entering trades that have proven statistical advantages
Optimized Position Sizing
Analyzes each setup's success rate to determine the adjusted Kelly criterion formula
Customizes position sizing based on your selected maximum drawdown tolerance
Helps prevent account-destroying losses while maximizing growth potential
Advanced Exit Management
Utilizes market structure-based trailing stop-loss mechanisms
Maximizes the average risk-reward ratio profit per winning trade
Helps capture larger moves while protecting gains during market reversals
Emotional Discipline Enforcement
Eliminates emotional bias by adhering to your pre-defined rules for market direction
Prevents impulsive decisions by providing objective entry and exit signals
Creates psychological distance between your emotions and trading decisions
Overtrading Prevention
Highlights only setups that demonstrate positive expectancy
Reduces frequency of low-probability trades
Conserves capital for higher-quality opportunities
Systematic Approach Benefits
By combining machine learning algorithms with your personal bias identification methods, Quantify helps transform discretionary trading approaches into more systematic, probability-based strategies.
What Entry Models are used in Quantify Trading Model version?
The Quantify Trading Model utilizes two primary entry models to identify high-probability trade setups:
Breakout Entry Model
- Identifies potential trade entries when price breaks through significant swing highs and swing lows
- Captures momentum as price moves beyond established trading ranges
- Particularly effective in trending markets when combined with the appropriate bias detection
- Optimized by machine learning to filter false breakouts based on historical performance
Fractals Entry Model
- Utilizes fractal patterns to identify potential reversal or continuation points
- Also uses swing levels to determine optimal entry locations
- Based on the concept that market structure repeats across different timeframes
- Identifies local highs and lows that form natural entry points
- Enhanced by machine learning to recognize the most profitable fractal formations
- These entry models work in conjunction with your custom bias indicator to ensure trades are taken in the direction of the overall market trend. The machine learning component analyzes historical performance of these entry types across different market conditions to optimize entry timing and signal quality.
How Does This Indicator Identify Market Structure?
1. Swing Detection
• The indicator identifies key swing points on the chart. These are local highs or lows where the price reverses direction, forming the foundation of market structure.
2. Structural Break Validation
• A structural break is flagged when a candle closes above a previous swing high (bullish) or below a previous swing low (bearish).
• Break Confirmation Process:
To confirm the break, the indicator applies the following rules:
• Valid Swing Preceding the Break: There must be at least one valid swing point before the break.
3. Numeric Labeling
• Each confirmed structural break is assigned a unique numeric ID starting from 1.
• This helps traders track breaks sequentially and analyze how the market structure evolves over time.
4. Liquidity and Invalidation Zones
• For every confirmed structural break, the indicator highlights two critical zones:
1. Liquidity Zone (LIQ): Represents the structural liquidity level.
2. Invalidation Zone (INV): Acts as Invalidation point if the structure fails to hold.
How does the trailing stop-loss work? what are the underlying calculations?
A trailing stoploss is a dynamic risk management tool that moves with the price as the market trend continues in the trader’s favor. Unlike a fixed take profit, which stays at a set level, the trailing stoploss automatically adjusts itself as the market moves, locking in profits as the price advances.
In Quantify, the trailing stoploss is enhanced by incorporating market structure liquidity levels (explain above). This ensures that the stoploss adjusts intelligently based on key price levels, allowing the trader to stay in the trade as long as the trend remains intact, while also protecting profits if the market reverses.
What is the Kelly Criterion, and how does it work in Quantify?
The Kelly Criterion is a mathematical formula used to determine the optimal position size for each trade, maximizing long-term growth while minimizing the risk of large drawdowns. It calculates the percentage of your portfolio to risk on a trade based on the probability of winning and the expected payoff.
Quantify integrates this with user-defined inputs to dynamically calculate the most effective position size in percentage, aligning with the trader’s risk tolerance and desired exposure.
How does Quantify use the Kelly Criterion in practice?
Quantify uses the Kelly Criterion to optimize position sizing based on the following factors:
1. Confidence Level: The model assesses the confidence level in the trade setup based on historical data and sample size. A higher confidence level increases the suggested position size because the trade has a higher probability of success.
2. Max Allowed Drawdown (User-Defined): Traders can set their preferred maximum allowed drawdown, which dictates how much loss is acceptable before reducing position size or stopping trading. Quantify uses this input to ensure that risk exposure aligns with the trader’s risk tolerance.
3. Probabilities: Quantify calculates the probabilities of success for each trade setup. The higher the probability of a successful trade (based on historical price action and liquidity levels), the larger the position size suggested by the Kelly Criterion.
How can I get started to use the indicator?
1. Set Your Market Bias
• Choose Auto.
• Select the source you want Quantify to use as for bias identification method (explained above)
2. Choose Your Entry Timeframes
• Specify the timeframes you want to focus on for trade entries.
• The indicator will dynamically analyze these timeframes to provide optimal setups.
3. Choose Your Entry Model and BE/TP Levels
• Choose a model that suits your personality
• Choose a level where you'd like the script to take profit or move stop-loss to BE
4. Set and activate the alerts
What tables are used in the Quantify?
• Quarterly
• Monthly
• Weekly
Terms and Conditions | Disclaimer
Our charting tools are provided for informational and educational purposes only and should not be construed as financial, investment, or trading advice. They are not intended to forecast market movements or offer specific recommendations. Users should understand that past performance does not guarantee future results and should not base financial decisions solely on historical data.
Built-in components, features, and functionalities of our charting tools are the intellectual property of @Fractalyst Unauthorized use, reproduction, or distribution of these proprietary elements is prohibited.
- By continuing to use our charting tools, the user acknowledges and accepts the Terms and Conditions outlined in this legal disclaimer and agrees to respect our intellectual property rights and comply with all applicable laws and regulations.
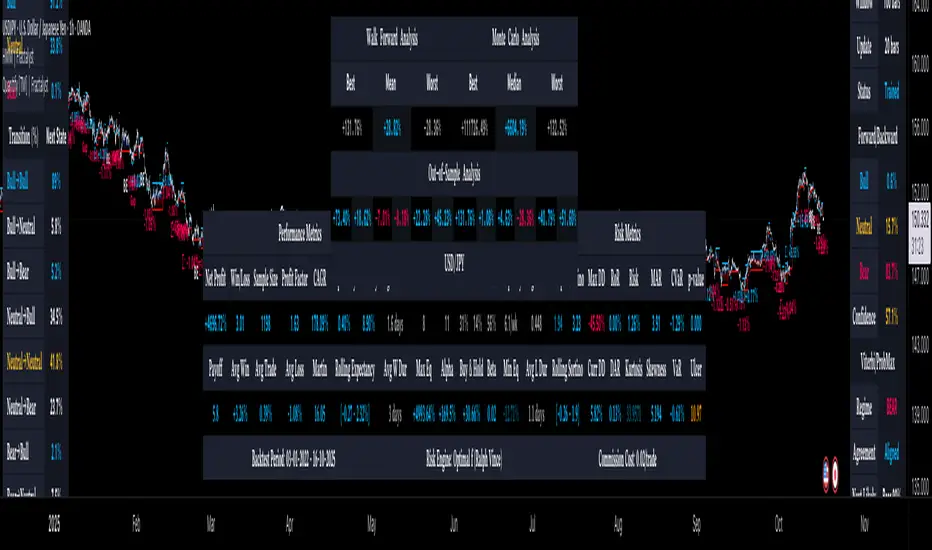
Mxwll OptAlgoIntroducing the Mxwll OptAlgo
Mxwll OptAlgo is a sophisticated algorithmic trading tool designed to identify potential long and short signals. It leverages an optimized combination of the M-Swift average, M-Smooth average, and M-RSI to fine-tune custom lengths and improve signal accuracy. The Mxwll OptAlgo provides long and short signals across various trading assets and timeframes. Additionally, it features optimized Take Profit (TP) and Stop Loss (SL) settings to help traders manage risk.
Key Features
Step-by-Step Complete Optimization: A systematic approach to optimize trading parameters.
Buy/Sell Signals: Clear indicators for long and short positions.
Easy to Use: User-friendly interface for seamless trading.
Predictive counter trend channels
Integrated trend following system and counter trend trading system
3-optimized strategies working cooperatively
Alerts and auto trading capabilities
How It Works
The Mxwll OptAlgo is comprised of three strategies:
Trend following using the OptAlgo
AI Reversal counter trend trading
Market crash shorting
Mxwll OptAlgo can be used for market analysis and trading similarly to any moving average.
The Mxwll OptAlgo MA is composed of two distinct moving averages to be used for trend following strategies.
M-Swift Average: The M-Swift Average accounts for volume and weights current price movement heavier than older price movement - allowing for improved responsiveness to current price movement. Volume is additionally weighted to the average to determine the significance of the price move and the resulting response of the M-Swift average. The M-Swift average consists of an HVWMA with OBV weighting. The HVWMA is used to create a moving average that adapts to volume, attempting to respond to significant price moves with high volume quicker and significant price moves with low volume slower - which might not be indicative of the start of a strong trend. To further reduce the M-Swift average’s responsiveness to weak volume price moves, the average is weighted with a normalized OBV. With this, the M-Swift moving average uses these two indicators to create a responsive moving average to significant price moves with high volume.
M-Smooth Average: The M-Smooth average consists of a McGinley average.
The McGinley Average is designed to address some of the limitations of traditional moving averages, such as the Simple Moving Average (SMA) or Exponential Moving Average (EMA), by reducing their lag and more accurately reflecting the market's true movements, especially during periods of volatility.
The McGinley Dynamic automatically adjusts its smoothing factor based on market speed. This means it responds more quickly to fast-moving markets and slows down during periods of consolidation, reducing the likelihood of false signals.
Unlike traditional moving averages that have a fixed period and can lag significantly behind fast-moving prices, the McGinley Dynamic adjusts dynamically, which helps to reduce lag and keeps the moving average closer to the price action.
The M-Smooth average uses bar low prices as a series during an uptrend - bar high prices as a series during a downtrend. A cross above the M-Smooth average indicates an uptrend, while a cross below the M-Smooth average indicates a downtrend. When this cross event occurs the M-Smooth average will “flip” from calculating on lows to highs, or highs to lows, contingent on the direction of the trend. The expectation is that a cross event of the M-Smooth average requires a substantial price move and, subsequent to this cross, price will continue to trend in the direction of the cross.
OptAlgo: The OptAlgo is simply the average of the M-Swift average and the M-smooth average.
By combining the M-Swift average and the M-Smooth average, the final output results in an average that slows during ranging markets and quickly adjusts to high volume breakouts and high volume reversals that initiate a trend. Due to the combination, the average will keep up quickly with a trend but remain at an appropriate distance from the current price - requiring a significant counter trend price move to change the direction of the OptAlgo average.
How does the OptAlgo follow trends?
The OptAlgo, comprising the two moving averages above, considers a cross event of the OptAlgo as a change in trend indication. The OptAlgo can be thought of as a moving average that significantly deviates from price. For price to cross the OptAlgo, a substantial price move must occur, and this event is treated as a "strong trend" or "new trend" indication.
M-RSI: The M-RSI is a fundamental component of the trend following strategy. Prior to a trend following “long” or “short” signal, the M-RSI must generate a signal in confluence with an OptAlgo cross event. When price crosses over the opt algo its color will change to green, indicating an uptrend. A buy signal will generate should the M-RSI provide a similar indication. The M-RSI portion of the trend following strategy is explained below. When price crosses under the opt algo its color will change to green, indicating a downtrend, and a sell signal becomes eligible. The foundational logic for using the Opt Algo as a trend following strategy is to treat crossovers/crossunders of the Opt Algo as strong trend indications, and trade them.
Steps to generate a trend following long signal:
1: M-RSI extends into oversold territory
2: Price crosses over the OptAlgo
Steps to generate a trend following short signal:
1: M-RSI extends into overbought territory
2: Price crosses under the OptAlgo
Our trend following strategy considers crossovers/crossunders at key market turning points as buy/sell opportunities. This strategy integrates the Mxwll RSI and Mxwll OptAlgo MA to determine entry points in anticipation of trend continuation.
The Mxwll RSI must move below/above the optimized OB/OS level prior to a cross event for a long/short signal to be considered. Entry points for this strategy are marked as "Long" or "Short".
At its core, the OptAlgo trend following strategy tries to enter a trend as close to the origin point as possible. As with any trend following strategy, price may not continue to move in the expected direction following entry, resulting in a losing trade.
AI Reversal Predictions
Our AI reversals strategy uses AI suggested turning points to capitalize on price reversions back towards the OptAlgo. These levels are considered by the AI on the selected days, and entry points at these levels are marked as "LLO" or "SLO".
How AI reversals work
Our AI reversals strategy attempts to trade price reversions back toward the Opt Algo.
These levels are calculated on specific days of the week, but can be traded any day. The internal algorithm determines which HTF highs/lows are most likely to function as tradable support/resistance levels. For instance, if Friday consists of heavy trading activity and high/low prices are tracked/recorded as causing significant support / resistance when tested in the future, the algorithm will consider support and resistance levels created on Friday as future tradable levels.
Additionally, if support/resistance levels created on Wednesday are recorded as weak or unpredictable when traded at in the future, the algorithm will not consider support/resistance levels generated on Thursday as tradable, and will not generate long or shit signals for these levels.
In the background, the AI reversals strategy is tracking success rates at multiple support and resistance levels. The best performers, if there are any, will be considered tradable. A “best performer” is calculated as the raw price move up to a threshold (i.e. 0.5%) that occurs subsequent to a test of the level.
Crash Short
The "Crash Short" strategy prioritizes short positions during retracements of a sell off. A simple yet effective strategy.
How Crash Short Works
The Crash Short strategy uses a customized momentum indicator (similar to ROC, MOM, etc.) to identify strong downside price moves. When our customized momentum indicator gives strong sell indications, the RSI is then referenced to identify an upside retracement. When the RSI exceeds a user-inputted level, a “Crash Short” signal is generated.
What is the customized momentum indicator?
The customized momentum indicator is the RoCR (Rate of Change Ratio). Instead of classic ROC, which is close - close , the RoCR divides the current close by a previous close. This formula creates a ratio that is more normalized than a simple price difference. This ratio is used to determine upside/downside momentum, with values greater than 1 indicating bullish momentum and values less than 1 indicating bearish momentum. The RoCR looks for deviating values to the downside (less than 1) to identify strong selling. From there, once the RSI crosses over an optimized level (such as 35), the indicator will print a sell signal titled "Crash Short".
Predictive Countertrend Channels
Our Predictive Countertrend Channel applies a two-stage recursive filter to smooth data using exponential decay and periodic adjustments for trend extraction. Our counter trend channels aren't directly used for signal processing; however, these channels provide useful visual cues for extended market moves.
Instructions for Optimization
Step 1: Optimize Mxwll OptAlgo
Begin by optimizing the M-Swift and M-Smooth averages for better signal accuracy.
This step simply finds better performing M-Swift and M-Smooth lookbacks. Again, if the strategy is unprofitable you will be notified and from there decide not to use the strategy.
Step 2: Optimize Mxwll RSI
Refine the Mxwll RSI settings to explore potential adjustments in smoothness and signal output. This step aims to evaluate whether these adjustments could improve the accuracy of the signals generated by Mxwll OptAlgo, while being mindful of any potential impacts.
Step 3: Optimize TP/SL
Consider adjusting the Take Profit and Stop Loss settings to potentially manage risk.
Step 4: Optimize Bars Between Trades
Set the number of bars between trades to regulate the frequency of trade executions. This adjustment may help in reducing the risk of overtrading and support a more disciplined trading strategy.
Step 5: Optimize Trade Flip
Adjust the trade flip parameters to potentially improve the management of transitions between long and short positions. This adjustment is intended to help achieve smoother trade executions, though outcomes may vary.
Step 6: Optimize RSI OB/OB Levels
Consider adjusting the overbought (OB) and oversold (OS) RSI levels to explore potential improvements in signal sensitivity. Careful calibration of these levels may help refine the accuracy of trend reversal signals, although results may depend on market conditions.
Finished!
From this point, consider setting alerts to make the most of the Mxwll Opt Algo's potential accuracy.
The effectiveness of the Opt Algo signal output can be evaluated using the "PF" table, which indicates the profit factor score for the strategy. A profit factor (PF) of less than or equal to 1 suggests that the strategy may not be profitable.
Disclaimer
No strategy works on any timeframe on any asset, so, if the Opt Algo underperforms for the asset/timeframe you're analyzing, the Opt Algo PF table lets you know it hasn't been generating accurate signals, in which case you can decide not to use it!
Optimization Disclaimer
Optimization can be tricky. It's helpful to test numerous strategies in aggregate to see if a strategy has potential. Despite this, optimization can cause overfitting. Overfitting occurs when a strategy is too closely fit to the data it's trading. Overfit backtests are deceptively phenomenal. While the historical performance looks great, the future expectancy of the strategy remains unpredictable - an overfit strategy will profit from periods of random price movement which, being random, are irreproducible and cannot be profited from other than their initial occurrence. When a strategy trades random price movement profitably, any and all profit earned can be reduced to chance. Keep this in mind when using the in-built optimization system. Optimization should be kept to a minimum, a tool to point you in the right direction, whether confirming potential or signifying a useless system.

Stock Rating [TrendX_]# OVERVIEW
This Stock Rating indicator provides a thorough evaluation of a company (NON-FINANCIAL ONLY) ranging from 0 to 5. The rating is the average of six core financial metrics: efficiency, profitability, liquidity, solvency, valuation, and technical ratings. Each metric encompasses several financial measurements to ensure a robust and holistic evaluation of the stock.
## EFFICIENCY METRICS
1. Asset-to-Liability Ratio : Measures a company's ability to cover its liabilities with its assets.
2. Equity-to-Liability Ratio : Indicates the proportion of equity used to finance the company relative to liabilities.
3. Net Margin : Shows the percentage of revenue that translates into profit.
4. Operating Expense : Reflects the costs required for normal business operations.
5. Operating Expense Ratio : Compares operating expenses to total revenue.
6. Operating Profit Ratio : Measures operating profit as a percentage of revenue.
7. PE to Industry Relative PE/PB : Compares the company's PE ratio to the industry average.
## PROFITABILITY METRICS
1. ROA : Indicates how efficiently a company uses its assets to generate profit.
2. ROE : Measures profitability relative to shareholders' equity.
3. EBITDA : Reflects a company's operational profitability.
4. Free Cash Flow Margin : Shows the percentage of revenue that remains as free cash flow.
5. Revenue Growth : Measures the percentage increase in revenue over a period.
6. Gross Margin : Reflects the percentage of revenue exceeding the cost of goods sold.
7. Net Margin : Percentage of revenue that is net profit.
8. Operating Margin : Measures the percentage of revenue that is operating profit.
## LIQUIDITY METRICS
1. Current Ratio : Indicates the ability to cover short-term obligations with short-term assets.
2. Interest Coverage Ratio : Measures the ability to pay interest on outstanding debt.
3. Debt-to-EBITDA : Compares total debt to EBITDA.
4. Debt-to-Equity Ratio : Indicates the relative proportion of debt and equity financing.
## SOLVENCY METRICS
1. Altman Z-score : Predicts bankruptcy risk
2. Beneish M-score : Detects earnings manipulation.
3. Fulmer H-factor : Predicts business failure risk.
## VALUATION METRICS
1. Industry Relative PE/PB Comparison : Compares the company's PE and PB ratios to industry averages.
2. Momentum of PE, PB, and EV/EBITDA Multiples : Tracks the trends of PE, PB, and EV/EBITDA ratios over time.
## TECHNICAL METRICS
1. Relative Strength Index (RSI) : Measures the speed and change of price movements.
2. Supertrend : Trend-following indicator that identifies market trends.
3. Moving Average Golden-Cross : Occurs when a short-term MA crosses above mid-term and long-term MA which are determined by half-PI increment in smoothing period.
4. On-Balance Volume Golden-Cross : Measures cumulative buying and selling pressure.
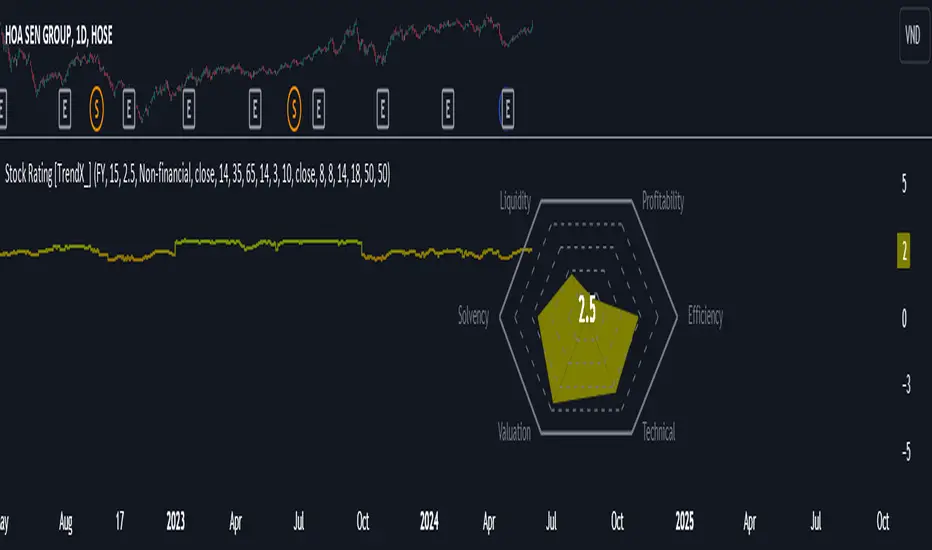
Luxmi AI Ultimate 1 Min Option ScalperThe Luxmi AI Ultimate 1 Min Option Scalper is a specialized trading indicator designed for use in options trading. This tool is particularly focused on providing actionable signals to option buyers within a one-minute timeframe, making it highly suitable for scalping—a trading strategy aimed at profiting from small price changes. Below is an elaboration on how this indicator functions and its significance in trading decisions:
### Key Features of Luxmi AI Ultimate 1 Min Option Scalper
1. **Enter and Don't Signals:**
- **Enter Signals:** These signals indicate the optimal moments to enter a trade, suggesting when to buy an option. They are typically based on sophisticated algorithms that analyze price movements, volume, volatility, and other relevant market data.
- **Don't Signals:** These signals advise traders to refrain from entering a trade. This could be due to market conditions that are not conducive to profitable trading, such as high volatility, low liquidity, or unclear directional trends.
2. **Directional Trading Strategy:**
- The Luxmi AI Ultimate 1 Min Option Scalper focuses on directional trading, which involves making trades based on the expected direction of the market. For option buyers, this means taking positions that profit from upward (call options) or downward (put options) movements in the price of the underlying asset.
3. **Scalping Approach:**
- Scalping is a short-term trading strategy that involves making numerous trades over the course of a trading session, aiming to capitalize on small price changes. The one-minute timeframe is particularly suited for scalping, as it allows traders to quickly enter and exit positions to capture minimal but frequent profits.
### Functionality and Benefits
1. **Real-Time Analysis:**
- The indicator provides real-time analysis and signals, ensuring that traders receive timely information to make quick trading decisions. This is crucial in the fast-paced environment of scalping, where delays can significantly impact profitability.
2. **Automated Decision-Making Support:**
- By automating the signal generation process, the Luxmi AI Ultimate 1 Min Option Scalper helps reduce the cognitive load on traders. This automation can lead to more consistent trading performance, as it mitigates the impact of emotional and psychological factors that often influence human decision-making.
3. **Market Adaptability:**
- The indicator is designed to adapt to changing market conditions, adjusting its signals based on the latest data. This adaptability enhances its effectiveness in various market environments, whether trending, ranging, or highly volatile.
4. **Risk Management:**
- Incorporating "Don't" signals as part of the strategy helps traders avoid entering trades in unfavorable conditions, thereby managing risk more effectively. This feature is particularly valuable in preventing losses and preserving capital.
5. **Educational Value:**
- For less experienced traders, using the Luxmi AI Ultimate 1 Min Option Scalper can provide a learning experience. By observing the signals and their outcomes, traders can develop a better understanding of market dynamics and refine their trading strategies.
### Practical Application
- **Setup:** Traders integrate the Luxmi AI Ultimate 1 Min Option Scalper into their trading platforms. This setup typically involves installing the indicator and configuring it to monitor the specific options and market data relevant to the trader's strategy.
- **Monitoring:** During trading hours, traders monitor the signals provided by the indicator. They prepare to act quickly on "Enter" signals and heed "Don't" signals to avoid unnecessary risks.
- **Execution:** When an "Enter" signal is generated, traders execute the recommended trade, buying the corresponding option. They then manage their positions closely, ready to exit based on their predetermined profit targets or stop-loss levels.
In summary, the Luxmi AI Ultimate 1 Min Option Scalper is a powerful tool for option buyers, providing critical buy and hold signals in a highly time-sensitive manner. Its primary benefits include enhancing decision-making speed, improving trading consistency, and managing risk, all of which are essential for successful scalping in options trading.

GKD-C Variety Filters w/ Dynamic Zones [Loxx]Giga Kaleidoscope GKD-C Variety Filters w/ Dynamic Zones is a Confirmation module included in Loxx's "Giga Kaleidoscope Modularized Trading System".
█ Giga Kaleidoscope Modularized Trading System
What is Loxx's "Giga Kaleidoscope Modularized Trading System"?
The Giga Kaleidoscope Modularized Trading System is a trading system built on the philosophy of the NNFX (No Nonsense Forex) algorithmic trading.
What is the NNFX algorithmic trading strategy?
The NNFX (No-Nonsense Forex) trading system is a comprehensive approach to Forex trading that is designed to simplify the process and remove the confusion and complexity that often surrounds trading. The system was developed by a Forex trader who goes by the pseudonym "VP" and has gained a significant following in the Forex community.
The NNFX trading system is based on a set of rules and guidelines that help traders make objective and informed decisions. These rules cover all aspects of trading, including market analysis, trade entry, stop loss placement, and trade management.
Here are the main components of the NNFX trading system:
1. Trading Philosophy: The NNFX trading system is based on the idea that successful trading requires a comprehensive understanding of the market, objective analysis, and strict risk management. The system aims to remove subjective elements from trading and focuses on objective rules and guidelines.
2. Technical Analysis: The NNFX trading system relies heavily on technical analysis and uses a range of indicators to identify high-probability trading opportunities. The system uses a combination of trend-following and mean-reverting strategies to identify trades.
3. Market Structure: The NNFX trading system emphasizes the importance of understanding the market structure, including price action, support and resistance levels, and market cycles. The system uses a range of tools to identify the market structure, including trend lines, channels, and moving averages.
4. Trade Entry: The NNFX trading system has strict rules for trade entry. The system uses a combination of technical indicators to identify high-probability trades, and traders must meet specific criteria to enter a trade.
5. Stop Loss Placement: The NNFX trading system places a significant emphasis on risk management and requires traders to place a stop loss order on every trade. The system uses a combination of technical analysis and market structure to determine the appropriate stop loss level.
6. Trade Management: The NNFX trading system has specific rules for managing open trades. The system aims to minimize risk and maximize profit by using a combination of trailing stops, take profit levels, and position sizing.
Overall, the NNFX trading system is designed to be a straightforward and easy-to-follow approach to Forex trading that can be applied by traders of all skill levels.
Core components of an NNFX algorithmic trading strategy
The NNFX algorithm is built on the principles of trend, momentum, and volatility. There are six core components in the NNFX trading algorithm:
1. Volatility - price volatility; e.g., Average True Range, True Range Double, Close-to-Close, etc.
2. Baseline - a moving average to identify price trend
3. Confirmation 1 - a technical indicator used to identify trends
4. Confirmation 2 - a technical indicator used to identify trends
5. Continuation - a technical indicator used to identify trends
6. Volatility/Volume - a technical indicator used to identify volatility/volume breakouts/breakdown
7. Exit - a technical indicator used to determine when a trend is exhausted
What is Volatility in the NNFX trading system?
In the NNFX (No Nonsense Forex) trading system, ATR (Average True Range) is typically used to measure the volatility of an asset. It is used as a part of the system to help determine the appropriate stop loss and take profit levels for a trade. ATR is calculated by taking the average of the true range values over a specified period.
True range is calculated as the maximum of the following values:
-Current high minus the current low
-Absolute value of the current high minus the previous close
-Absolute value of the current low minus the previous close
ATR is a dynamic indicator that changes with changes in volatility. As volatility increases, the value of ATR increases, and as volatility decreases, the value of ATR decreases. By using ATR in NNFX system, traders can adjust their stop loss and take profit levels according to the volatility of the asset being traded. This helps to ensure that the trade is given enough room to move, while also minimizing potential losses.
Other types of volatility include True Range Double (TRD), Close-to-Close, and Garman-Klass
What is a Baseline indicator?
The baseline is essentially a moving average, and is used to determine the overall direction of the market.
The baseline in the NNFX system is used to filter out trades that are not in line with the long-term trend of the market. The baseline is plotted on the chart along with other indicators, such as the Moving Average (MA), the Relative Strength Index (RSI), and the Average True Range (ATR).
Trades are only taken when the price is in the same direction as the baseline. For example, if the baseline is sloping upwards, only long trades are taken, and if the baseline is sloping downwards, only short trades are taken. This approach helps to ensure that trades are in line with the overall trend of the market, and reduces the risk of entering trades that are likely to fail.
By using a baseline in the NNFX system, traders can have a clear reference point for determining the overall trend of the market, and can make more informed trading decisions. The baseline helps to filter out noise and false signals, and ensures that trades are taken in the direction of the long-term trend.
What is a Confirmation indicator?
Confirmation indicators are technical indicators that are used to confirm the signals generated by primary indicators. Primary indicators are the core indicators used in the NNFX system, such as the Average True Range (ATR), the Moving Average (MA), and the Relative Strength Index (RSI).
The purpose of the confirmation indicators is to reduce false signals and improve the accuracy of the trading system. They are designed to confirm the signals generated by the primary indicators by providing additional information about the strength and direction of the trend.
Some examples of confirmation indicators that may be used in the NNFX system include the Bollinger Bands, the MACD (Moving Average Convergence Divergence), and the MACD Oscillator. These indicators can provide information about the volatility, momentum, and trend strength of the market, and can be used to confirm the signals generated by the primary indicators.
In the NNFX system, confirmation indicators are used in combination with primary indicators and other filters to create a trading system that is robust and reliable. By using multiple indicators to confirm trading signals, the system aims to reduce the risk of false signals and improve the overall profitability of the trades.
What is a Continuation indicator?
In the NNFX (No Nonsense Forex) trading system, a continuation indicator is a technical indicator that is used to confirm a current trend and predict that the trend is likely to continue in the same direction. A continuation indicator is typically used in conjunction with other indicators in the system, such as a baseline indicator, to provide a comprehensive trading strategy.
What is a Volatility/Volume indicator?
Volume indicators, such as the On Balance Volume (OBV), the Chaikin Money Flow (CMF), or the Volume Price Trend (VPT), are used to measure the amount of buying and selling activity in a market. They are based on the trading volume of the market, and can provide information about the strength of the trend. In the NNFX system, volume indicators are used to confirm trading signals generated by the Moving Average and the Relative Strength Index. Volatility indicators include Average Direction Index, Waddah Attar, and Volatility Ratio. In the NNFX trading system, volatility is a proxy for volume and vice versa.
By using volume indicators as confirmation tools, the NNFX trading system aims to reduce the risk of false signals and improve the overall profitability of trades. These indicators can provide additional information about the market that is not captured by the primary indicators, and can help traders to make more informed trading decisions. In addition, volume indicators can be used to identify potential changes in market trends and to confirm the strength of price movements.
What is an Exit indicator?
The exit indicator is used in conjunction with other indicators in the system, such as the Moving Average (MA), the Relative Strength Index (RSI), and the Average True Range (ATR), to provide a comprehensive trading strategy.
The exit indicator in the NNFX system can be any technical indicator that is deemed effective at identifying optimal exit points. Examples of exit indicators that are commonly used include the Parabolic SAR, the Average Directional Index (ADX), and the Chandelier Exit.
The purpose of the exit indicator is to identify when a trend is likely to reverse or when the market conditions have changed, signaling the need to exit a trade. By using an exit indicator, traders can manage their risk and prevent significant losses.
In the NNFX system, the exit indicator is used in conjunction with a stop loss and a take profit order to maximize profits and minimize losses. The stop loss order is used to limit the amount of loss that can be incurred if the trade goes against the trader, while the take profit order is used to lock in profits when the trade is moving in the trader's favor.
Overall, the use of an exit indicator in the NNFX trading system is an important component of a comprehensive trading strategy. It allows traders to manage their risk effectively and improve the profitability of their trades by exiting at the right time.
How does Loxx's GKD (Giga Kaleidoscope Modularized Trading System) implement the NNFX algorithm outlined above?
Loxx's GKD v1.0 system has five types of modules (indicators/strategies). These modules are:
1. GKD-BT - Backtesting module (Volatility, Number 1 in the NNFX algorithm)
2. GKD-B - Baseline module (Baseline and Volatility/Volume, Numbers 1 and 2 in the NNFX algorithm)
3. GKD-C - Confirmation 1/2 and Continuation module (Confirmation 1/2 and Continuation, Numbers 3, 4, and 5 in the NNFX algorithm)
4. GKD-V - Volatility/Volume module (Confirmation 1/2, Number 6 in the NNFX algorithm)
5. GKD-E - Exit module (Exit, Number 7 in the NNFX algorithm)
(additional module types will added in future releases)
Each module interacts with every module by passing data between modules. Data is passed between each module as described below:
GKD-B => GKD-V => GKD-C(1) => GKD-C(2) => GKD-C(Continuation) => GKD-E => GKD-BT
That is, the Baseline indicator passes its data to Volatility/Volume. The Volatility/Volume indicator passes its values to the Confirmation 1 indicator. The Confirmation 1 indicator passes its values to the Confirmation 2 indicator. The Confirmation 2 indicator passes its values to the Continuation indicator. The Continuation indicator passes its values to the Exit indicator, and finally, the Exit indicator passes its values to the Backtest strategy.
This chaining of indicators requires that each module conform to Loxx's GKD protocol, therefore allowing for the testing of every possible combination of technical indicators that make up the six components of the NNFX algorithm.
What does the application of the GKD trading system look like?
Example trading system:
Backtest: Strategy with 1-3 take profits, trailing stop loss, multiple types of PnL volatility, and 2 backtesting styles
Baseline: Hull Moving Average
Volatility/Volume: Hurst Exponent
Confirmation 1: Variety Filters w/ Dynamic Zones as shown on the chart above
Confirmation 2: Williams Percent Range
Continuation: Fisher Transform
Exit: Rex Oscillator
Each GKD indicator is denoted with a module identifier of either: GKD-BT, GKD-B, GKD-C, GKD-V, or GKD-E. This allows traders to understand to which module each indicator belongs and where each indicator fits into the GKD protocol chain.
Giga Kaleidoscope Modularized Trading System Signals (based on the NNFX algorithm)
Standard Entry
1. GKD-C Confirmation 1 Signal
2. GKD-B Baseline agrees
3. Price is within a range of 0.2x Volatility and 1.0x Volatility of the Goldie Locks Mean
4. GKD-C Confirmation 2 agrees
5. GKD-V Volatility/Volume agrees
Baseline Entry
1. GKD-B Baseline signal
2. GKD-C Confirmation 1 agrees
3. Price is within a range of 0.2x Volatility and 1.0x Volatility of the Goldie Locks Mean
4. GKD-C Confirmation 2 agrees
5. GKD-V Volatility/Volume agrees
6. GKD-C Confirmation 1 signal was less than 7 candles prior
Volatility/Volume Entry
1. GKD-V Volatility/Volume signal
2. GKD-C Confirmation 1 agrees
3. Price is within a range of 0.2x Volatility and 1.0x Volatility of the Goldie Locks Mean
4. GKD-C Confirmation 2 agrees
5. GKD-B Baseline agrees
6. GKD-C Confirmation 1 signal was less than 7 candles prior
Continuation Entry
1. Standard Entry, Baseline Entry, or Pullback; entry triggered previously
2. GKD-B Baseline hasn't crossed since entry signal trigger
3. GKD-C Confirmation Continuation Indicator signals
4. GKD-C Confirmation 1 agrees
5. GKD-B Baseline agrees
6. GKD-C Confirmation 2 agrees
1-Candle Rule Standard Entry
1. GKD-C Confirmation 1 signal
2. GKD-B Baseline agrees
3. Price is within a range of 0.2x Volatility and 1.0x Volatility of the Goldie Locks Mean
Next Candle:
1. Price retraced (Long: close < close or Short: close > close )
2. GKD-B Baseline agrees
3. GKD-C Confirmation 1 agrees
4. GKD-C Confirmation 2 agrees
5. GKD-V Volatility/Volume agrees
1-Candle Rule Baseline Entry
1. GKD-B Baseline signal
2. GKD-C Confirmation 1 agrees
3. Price is within a range of 0.2x Volatility and 1.0x Volatility of the Goldie Locks Mean
4. GKD-C Confirmation 1 signal was less than 7 candles prior
Next Candle:
1. Price retraced (Long: close < close or Short: close > close )
2. GKD-B Baseline agrees
3. GKD-C Confirmation 1 agrees
4. GKD-C Confirmation 2 agrees
5. GKD-V Volatility/Volume Agrees
1-Candle Rule Volatility/Volume Entry
1. GKD-V Volatility/Volume signal
2. GKD-C Confirmation 1 agrees
3. Price is within a range of 0.2x Volatility and 1.0x Volatility of the Goldie Locks Mean
4. GKD-C Confirmation 1 signal was less than 7 candles prior
Next Candle:
1. Price retraced (Long: close < close or Short: close > close)
2. GKD-B Volatility/Volume agrees
3. GKD-C Confirmation 1 agrees
4. GKD-C Confirmation 2 agrees
5. GKD-B Baseline agrees
PullBack Entry
1. GKD-B Baseline signal
2. GKD-C Confirmation 1 agrees
3. Price is beyond 1.0x Volatility of Baseline
Next Candle:
1. Price is within a range of 0.2x Volatility and 1.0x Volatility of the Goldie Locks Mean
2. GKD-C Confirmation 1 agrees
3. GKD-C Confirmation 2 agrees
4. GKD-V Volatility/Volume Agrees
█ GKD-C Variety Filters w/ Dynamic Zones
What are Dynamic Zones?
As explained in "Stocks & Commodities V15:7 (306-310): Dynamic Zones by Leo Zamansky, Ph .D., and David Stendahl"
Most indicators use a fixed zone for buy and sell signals. Here’ s a concept based on zones that are responsive to past levels of the indicator.
One approach to active investing employs the use of oscillators to exploit tradable market trends. This investing style follows a very simple form of logic: Enter the market only when an oscillator has moved far above or below traditional trading levels. However, these oscillator- driven systems lack the ability to evolve with the market because they use fixed buy and sell zones. Traders typically use one set of buy and sell zones for a bull market and substantially different zones for a bear market. And therein lies the problem.
Once traders begin introducing their market opinions into trading equations, by changing the zones, they negate the system’s mechanical nature. The objective is to have a system automatically define its own buy and sell zones and thereby profitably trade in any market — bull or bear. Dynamic zones offer a solution to the problem of fixed buy and sell zones for any oscillator-driven system.
An indicator’s extreme levels can be quantified using statistical methods. These extreme levels are calculated for a certain period and serve as the buy and sell zones for a trading system. The repetition of this statistical process for every value of the indicator creates values that become the dynamic zones. The zones are calculated in such a way that the probability of the indicator value rising above, or falling below, the dynamic zones is equal to a given probability input set by the trader.
To better understand dynamic zones, let's first describe them mathematically and then explain their use. The dynamic zones definition:
Find V such that:
For dynamic zone buy: P{X <= V}=P1
For dynamic zone sell: P{X >= V}=P2
where P1 and P2 are the probabilities set by the trader, X is the value of the indicator for the selected period and V represents the value of the dynamic zone.
The probability input P1 and P2 can be adjusted by the trader to encompass as much or as little data as the trader would like. The smaller the probability, the fewer data values above and below the dynamic zones. This translates into a wider range between the buy and sell zones. If a 10% probability is used for P1 and P2, only those data values that make up the top 10% and bottom 10% for an indicator are used in the construction of the zones. Of the values, 80% will fall between the two extreme levels. Because dynamic zone levels are penetrated so infrequently, when this happens, traders know that the market has truly moved into overbought or oversold territory.
Calculating the Dynamic Zones
The algorithm for the dynamic zones is a series of steps. First, decide the value of the lookback period t. Next, decide the value of the probability Pbuy for buy zone and value of the probability Psell for the sell zone.
For i=1, to the last lookback period, build the distribution f(x) of the price during the lookback period i. Then find the value Vi1 such that the probability of the price less than or equal to Vi1 during the lookback period i is equal to Pbuy. Find the value Vi2 such that the probability of the price greater or equal to Vi2 during the lookback period i is equal to Psell. The sequence of Vi1 for all periods gives the buy zone. The sequence of Vi2 for all periods gives the sell zone.
In the algorithm description, we have: Build the distribution f(x) of the price during the lookback period i. The distribution here is empirical namely, how many times a given value of x appeared during the lookback period. The problem is to find such x that the probability of a price being greater or equal to x will be equal to a probability selected by the user. Probability is the area under the distribution curve. The task is to find such value of x that the area under the distribution curve to the right of x will be equal to the probability selected by the user. That x is the dynamic zone.
What is Variety Filters w/ Dynamic Zones?
This indicator first smooths price with one of 65+ moving averages and then injects that output into the Dynamic Zones algorithm to create levels of significances. These levels are used to generate trading signals.
Requirements
Inputs
Confirmation 1: GKD-V Volatility / Volume indicator
Confirmation 2: GKD-C Confirmation indicator
Continuation: GKD-C Confirmation indicator
Solo Confirmation Simple: GKD-B Baseline
Solo Confirmation Complex: GKD-V Volatility / Volume indicator
Solo Confirmation Super Complex: GKD-V Volatility / Volume indicator
Stacked 1: None
Stacked 2+: GKD-C, GKD-V, or GKD-B Stacked 1
Outputs
Confirmation 1: GKD-C Confirmation 2 indicator
Confirmation 2: GKD-C Continuation indicator
Continuation: GKD-E Exit indicator
Solo Confirmation Simple: GKD-BT Backtest
Solo Confirmation Complex: GKD-BT Backtest or GKD-E Exit indicator
Solo Confirmation Super Complex: GKD-C Continuation indicator
Stacked 1: GKD-C, GKD-V, or GKD-B Stacked 2+
Stacked 2+: GKD-C, GKD-V, or GKD-B Stacked 2+ or GKD-BT Backtest
Additional features will be added in future releases.
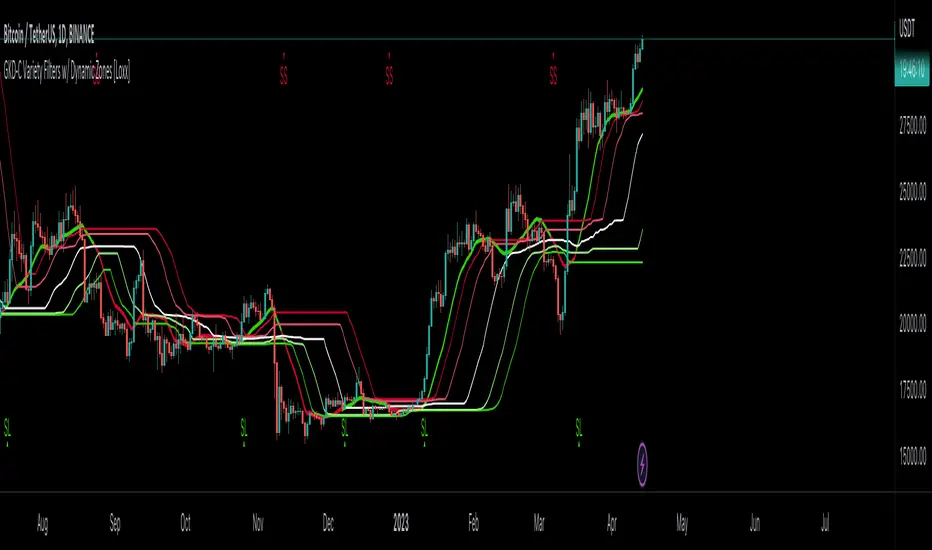
Most Power V5 Most Power V5
The MOST indicator is an indicator used as a Moving Stoploss. The MOST indicator also generates a buy signal in case the prices rise, unlike the traditional indicators that allow you to make stop losses.In the MOST POWER V5 indicator, stoploss generates its signals using moving averages such as 'SMA', 'EMA', 'WMA', 'VWMA', 'HMA', 'SMMA', 'DEMA' rather than just the current price. In this way, it aims to prevent false signals that may be produced by excessive price movements during the day.
MOST POWER Indicator follows the average by preserving the stop loss distance in the movement of the moving average in the same direction.
The second variable that creates the MOST POWER curve is the stop loss distance that gives power to MOST with the moving average used and the shift rate that provides the stop signal. In this version, this distance is prepared with 2 separate inputs for both buy and sell.You can set these values as "percentage for long trend" and "percentage for short trend" in the indicator input properties.
You can also enter your Take Profit-1, Take Profit-2-, Take Profit-3- and Stop Loss levels in the indicator input properties, especially if you are interested in algo trading or to take advantage of the wonderful alarm setup features of tradingview and get the chance to get maximum profit. (If you enter Take Profit-1, Take Profit-2-, Take Profit-3- and Stop Loss levels as 0. Only buy and sell labels will appear on the indicator.)
Also, activate the amplitude filter option from the indicator input settings to get less signal and filter our inputs.
In addition, the entry price, take profit1, take profit2, take profit3 values for the last transaction opened to make things easier are located in the upper right corner of your graph as a table.
Important note: No indicator guarantees investment. That's why the tests you will do before real trades are very important in this indicator. I wish you all successful trades.
i will show how works with examples
Example 1
If you enter Take Profit-1, Take Profit-2-, Take Profit-3- and Stop Loss levels greater than 0
Example 2
If you enter Take Profit-1, Take Profit-2-, Take Profit-3- and Stop Loss levels as 0 (u will see only buy - sell labels)
Example 3
if select Amplitude Filter is on . you will see less signal
how works Amplitude Filter whats logic ?
if Amplitude Filter is active the signal from mostpower will be combined with Amplitude Filter.
for example, if the amplitude value is 2, the highest price and the lowest price of the last 2 bars are calculated. then this amplitude value is calculated for sma with its source high and low. Based on these values, the trend is determined in the amplitude of the price movement.
Important note: No indicator guarantees investment. That's why the tests you will do before real trades are very important in this indicator. I wish you all successful trades.

Trendmaster - Crypto On-Chain Metric BundleWhat it is:
The ‘Trendmaster Crypto On-Chain Metric Bundle’ is truly a one-of-a-kind bundle. It provides a complete insight into the on-chain dynamics of the entire Crypto asset class, with a multitude of different included indicators providing unique information and data points to give users an edge regardless of ticker, timeframe, or trading style.
What it Does:
Allows you to switch between several different metrics in one place and see specific combined metrics and look at the metrics to take contrarian positions
How to Use it:
Use these metrics to see the on-chain actions in cryptocurrency and play the contrarian. For example, when people are flooding into stablecoins as the price goes down you can see that as a potential buy indicator.
All metrics can be viewed with a Dashboard allowing the user to see all of the information in 1 place.
List of On-Chain Metrics:
To begin with, we have the ‘Trendmaster On-Chain Rating’ – which is our all-in-one, complete on-chain overview metric that can give you an instant insight into the fundamental and underlying strength of any given Crypto asset. It collates the key factors provided by all other indicators within the bundle, weighing in and condensing all of that information into a simple -5 to 5 scale; with a -5 indicating a completely bearish outlook on the asset, and a +5 representing truly great upcoming upside potential. As this indicator is taking into account large amounts of data and statistics to provide an on-chain overview, this value is best taken into consideration on higher timeframes such as the 4hour or daily to provide fundamentally strong buy or sell swing trade opportunities. Extreme rating signals on this indicator are rare but always worth taking into serious consideration.
Secondly, we have the ‘Collated Open Interest Oscillator’ – which gives us a peek into the current outlook of the derivatives market across a wide array of Crypto futures on a number of different exchanges. This indicator provides data on a 0-100 scale, with 100 indicating a substantial and sustained increase in open derivative positions in relation to the underlying market volume. A score of 100 can tell us that a huge amount of traders are trying to position themselves with high leverage in anticipation of a big move, and can often be compared to periods of extreme greed from market participants. On the contrary, a value of 0 shows us that the derivative market is decreasing in volume and therefore open interest is decreasing, which can be likened to periods of extreme fear. This data is only provided at daily intervals, but as incredibly high or low values on this indicator can have an almost instant impact, this indicator is best utilized for medium-term trading and investment decisions.
The ‘Social Sentiment Oscillator' analyses bullish and bearish narratives in relation to a number of large Cryptocurrencies and the market in general, across multiple social media platforms. Rather than a traditional 0-100 ‘Fear & Greed’ index that many may be familiar with, this indicator tracks the changing in sentiment across platforms on a -100 to 100 scale. A score of -100 may not necessarily indicate immediate extreme fear in the market, but instead a huge shift from an incredibly bullish narrative to an incredibly bearish one. Similar to a score of 100, this does not necessarily indicate that the current outlook on social media platforms is currently positive, but rather that a substantial amount of people are altering their views and have become more bullish on a short-term basis. This data is only provided at daily intervals, so make sure to keep an eye on price and sentiment divergences for the best swing trade opportunities to play contrarian to the majority.
Following this is the ‘Miner Confidence Metric’, which provides a long-term overview of the current Crypto miner's outlook. This simple -10 to 10 scale gives us an easy-to-follow bearish to the bullish sentiment of miners. This indicator takes into account the current hash rate, looking at both how it historically compares as well as its rate of decrease/increase; as well as on-chain miner movements to verify their stance on either holding onto their Crypto earnings or preferring to move their coins to exchanges to sell and cover their running costs. Generally speaking, miners can face difficulties operating during times of large market drawdowns, and may be forced into offloading and selling physical and virtual resources to remain afloat – this is indicated by a -10 value at the extreme end, and has historically provided outsized returns for long-term investors accumulating at their demise. Contrary to this, a score of 10 can indicate that miners are not only bullish on the future of crypto, but are likely also expanding operations in anticipation of higher prices in the future. This data is only provided at daily intervals, but on longer-term timeframes provide some of the best long-term accumulation opportunities available to market participants.
Next is the ‘Collated On-Chain Volume’ indicator, which simply monitors a variety of Cryptocurrencies and their underlying on-chain transactional usage. When collating these volumetric data it can provide invaluable insight into the current actions taken by market buyers and sellers and often larger players who can have a big influence on price. Typically when we see large spikes in on-chain usage it indicates substantial levels of accumulation or distribution, which can be made more obvious by observing where we currently are in a market cycle. Large spikes after large and extended periods of drawdown can represent coins transferring from retail to larger players who are often referred to as ‘smart money’; and with large on-chain volume following a substantial bull cycle, this may show us larger players distributing coins to retail. Data can only be fetched at daily intervals, but watch for big spikes to try and position yourself alongside the big players.
We also have the ‘Holder in Profit %’ which as it sounds, is just giving us a percentile value of Crypto traders, investors, and holders who are currently in profit on their positions. Historically speaking, when a majority are at a loss – and buying ‘when there is blood in the streets has been a profitable venture. Considering cutting some of your positions when market exuberance is in full effect and a vast majority of participants are reaping in easy profits. As data is only obtained at daily intervals, using this as a longer-term gauge for where we may be in a cycle is where it is most insightful.
The ‘Long/Short Ratio Crossover’ analyses the current disparity between traders who have positioned themselves in a long position on derivatives markets in comparison to those betting on prices going down. This indicator provides another impressive insight into the fallacy of the herd mentality, and how aiming to be on the opposite side of the masses can often be a profitable venture. A value of 100 can show us that an overwhelming majority of traders are predicting a price increase and are trying to position themselves accordingly, whereas a value of -100 indicates almost all derivative traders are trying to bet on a sizeable market downturn. This metric can be useful for both long-term positions and shorter-term scalping methods of trading and investing, updating on a per-candle basis.
Along with this, the ‘Retail Stablecoin Demand’ looks into the current demand for a number of Crypto stablecoins, aiming to mimic an underlying value close to that of traditional fiat currencies like the US Dollar. This is calculated by analyzing the short to mid-term rush to these ‘safer’ assets by retail traders. Traditionally people will exit their positions in favor of stable assets when they are either currently or are expecting to experience losses. Conversely, when users foresee upcoming profits they are likely to transition into a more ‘risk-on’ thesis and exit their stablecoins for more speculative assets. A value of 100 represents a huge demand for stablecoins, whereas a value of -100 shows that there is currently a lack of interest. Another indication providing a chance to profitably play the contrarian, with figures constantly updating to provide the functionality to all regardless of your trading methodology or investment philosophy.
Lastly the ‘Whale Bubbles’, display overlaying circles of varying size and opacity to represent on-chain activity by larger market players who are transferring a portion of their substantial holding, usually to exchanges to sell. These bubbles are placed over price action to clearly see the point at which the transaction occurred. We can also lower the minimum requirement of what is defined as a ‘whale movement’ by increasing the sensitivity within the indicator settings and subsequently increasing signal frequency. When whales begin to sell in numbers, it may be worth considering doing the same yourself!
We hope you can find utility in all of these indicators, and that in unison they can take your trading and investment to the next level. A majority of these indicators within the bundle can be tweaked and optimized within the bundle to further fine-tune and cater to your preferred trading and investing thesis. Check out our other resources and let us know what you’d like to see next!

Period Dollar Cost Average BacktesterHere is a simple script to calculate the profits and other dollar cost average strategy statistics. This strategy was created to avoid asset price volatility, so the pump and dump scheme does not affect the portfolio. By dividing the investment amount into periods, the investor doesn’t need to analyze the market, fundamental analysis, or anything. The goal is to increase the asset holdings and avoid fast and robust price movements.
This indicator has some configurations.
Amount to buy: the amount to buy at each time
Broker fee %: the fee percentage that the broker has for spot trade
Frequency: the frequency of the investments. Example: 1 Day means that every day, it will buy an amount of the asset
Starting Date: when the indicator will start the investment simulation
Ending Date: when the indicator will end the investment simulation
InfoCell With/Height: it relates to the panel for view purposes. Change the values to fit better on your screen.
This indicator has three lines:
Total Invested (green): total amount invested at the end of the period
Total Net Profit (pink): total profit by converting the amount of the asset bought at the latest closing price
Holding Profits (yellow): the amount that would be in the portfolio if the investor had invested all the capital in a signal trade at the beginning of the period.
The statistics panel has some information to help you understand buying the asset in one or more trades. So, besides those three lines that were mentioned above, here are the other statistics:
Entry Price: The price of the asset when the first investment was made
Gross Profit: Total amount of profit, not excluding the losses
Gross Losses: Total amount of losses, not excluding the profits
Profit Factor: The Gross Profit divided by the Gross Loss. A value above 1 means it’s profitable.
Profit/Trades: Net profit per trade. This includes the broker fees.
Recovery Factor: The Net profit divided by the relative drawdown. The higher the recovery factor, the faster the recovery of a loss
Total Asset Bought: The amount of the asset that was bought at the end of the investment plan
Absolute Drawdown: The total amount of losses that made the account balance go below its initial value
Relative Drawdown: The max drawdown that occurred, no matter the account balance amount
Total Trades: number of times the investment was made in the selected period
Total Fee: total Fee that was spent on the total investment
Total Winning Trades: the total amount of winning trades. A trade is considered a winner if the net profit is up compared with the latest investment.
Total Losing Trades: the total amount of losing trades. A trade is considered a loser if the net profit is down compared to the latest investment.
Max consecutive wins: the max amount of consecutive winning trades
Max consecutive losses: the max amount of consecutive losing trades
The chart above uses the default configuration of the indicator. Placed on the BTCUSD market, taking the time range of January 1st, 2018 to January 1st, 2022, 4 years. Buying a BTC amount with 10 USDT every day in that period would generate a more than 500% profit. Compared to the profit amount by just holding the count, which was close to 350% profit, the dollar cost average by period would be much more profitable.

Daily Coin Purchase StrategyThis indicator helps investors track the profitability of their Dollar-Cost Averaging (DCA) strategy when buying crypto assets periodically over time. Users can customize the start date, purchase amount per cycle, and the frequency of purchases based on different timeframes (e.g., 15m, 1H, 4H, 1D).
Features:
✅ Flexible Configuration: Allows users to set the start date, purchase amount per cycle, and select the desired timeframe (15m, 1H, 4H, 1D, etc.).
✅ Automated Profit Calculation: Displays total investment, total coins accumulated, average cost per coin, and profit based on the current market price.
✅ Supports Multiple Timeframes: Users can choose to buy at intervals based on 15m, 1H, 4H, or 1D candlesticks.
✅ Helps Plan Investment Capital: Calculates the total capital needed to follow a DCA strategy over a given period, allowing for better financial planning.
✅ Visualizes Investment Profitability: Provides clear insights into the accumulation process and the overall performance of the strategy.
✅ Intuitive Charts: Displays the accumulation process and investment performance over time.
How to Use:
Set the start date for purchases.
Enter the desired amount to invest per cycle.
Select the timeframe for purchases (15m, 1H, 4H, 1D, etc.).
The indicator will automatically calculate the number of coins accumulated, the average cost per coin, and the overall profit.
🔹 Use Cases:
Monitor the effectiveness of the DCA strategy over time.
Compare profitability across different purchase intervals.
Optimize long-term asset accumulation strategies.
Plan financial resources effectively for long-term investment strategies.
This version keeps all the key details while ensuring clarity and accuracy. Let me know if you need any modifications! 🚀
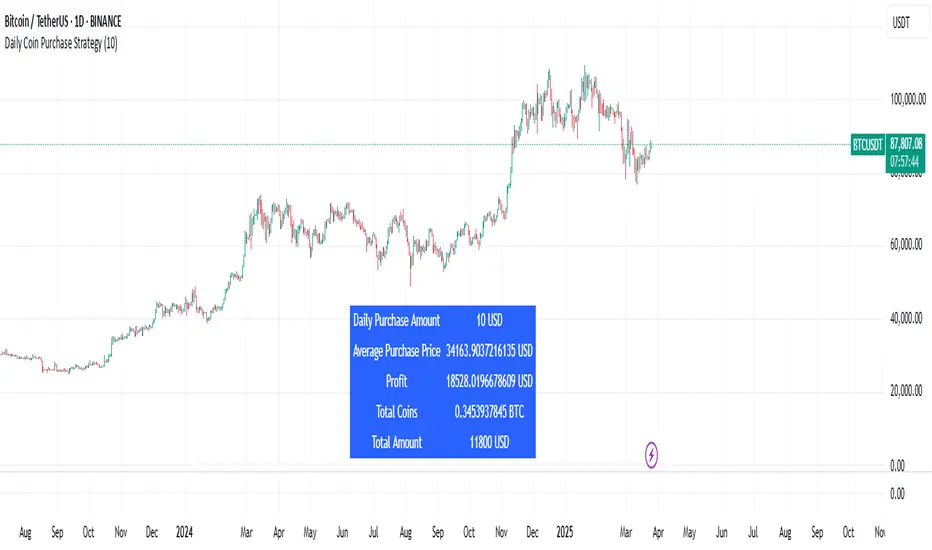
HTC peppermint_07 CCI w signal + s&r RSI
This CCI version enhances the traditional Commodity Channel Index (CCI) by integrating a dynamically calculated Relative Strength Index (RSI) that acts as support and resistance as shown in the screenshot, it can add as a confirmation to the divergence found in the CCI.
Key Features:
Enhanced CCI: The primary plot (black line but customizable) represents the standard CCI, providing insight into price momentum and potential overbought/oversold conditions.
Dynamic RSI Support/Resistance: The upper and lower bands (medium cyan line) are derived from a smoothed RSI, dynamically adjusting to the current market volatility. These bands serve as potential support and resistance levels for the CCI as additional confirmation for the divergence.
Overbought/Oversold Zones: The traditional overbought (+100) and oversold (-100) levels for CCI are marked with horizontal dotted lines.
Benefits:
Improved Entry/Exit Signals: Combining CCI with dynamic RSI support/resistance may offer more precise trading signals compared to using CCI alone.
Dynamic Adaptation: The RSI-based bands adapt to changing market conditions, potentially providing more relevant support and resistance levels.
Divergence Confirmation: dynamic s&r RSI adds confluence to potential trend reversals identified by the CCI.
Potential Usage:
Traders might use this indicator to:
Identify potential overbought/oversold conditions using the CCI and its relationship to the dynamic RSI bands.
Look for breakouts beyond the dynamic support/resistance levels as potential entry points.
Confirm potential trend reversals using RSI divergence (cyan and red label above divergence) signals.
Further Development Considerations:
Customizable Parameters: Allowing users to adjust the CCI length, RSI periods, and smoothing factors would enhance flexibility.
Alert Conditions: Adding alerts for breakouts, overbought/oversold conditions, and divergence signals would improve usability.
Backtesting: Thoroughly backtesting the indicator's performance across different assets and timeframes is essential before using it for live trading.
DISCLAIMER: !!
indicator is a custom technical analysis tool designed for educational and informational purposes only. It should not be construed as financial advice or a recommendation to buy or sell any security. Trading involves substantial risk of loss and may not be suitable for all investors.
Key Points to Consider:
No Guarantee of Profitability: The indicator's past performance is not indicative of future results. No trading strategy can guarantee profits or eliminate the risk of losses. You could lose some or all of your investment.
Use at Your Own Risk: Use of this indicator is solely at your own discretion and risk. You are responsible for your trading decisions. The developers and distributors of this indicator are not liable for any losses incurred as a result of using it.
Not Financial Advice: This indicator does not provide financial advice. Consult with a qualified financial advisor before making any investment decisions.
Backtesting Limitations: Backtested results, if presented, should be viewed with caution. Past performance may not reflect future results due to various factors, including changing market conditions and the limitations of backtesting methodologies.
Indicator Limitations: Technical indicators, including this one, are not perfect. They can generate false signals, and their effectiveness can vary depending on market conditions and the specific parameters used.
Parameter Optimization: Optimizing indicator parameters for past performance can lead to overfitting, which may not translate to future profitability.
No Warranty: The indicator is provided "as is" without any warranty of any kind, either express or implied, including but not limited to warranties of merchantability, fitness for a particular purpose, or non-infringement.
Changes and Updates: The developers may make changes or updates to the indicator without notice.
By using the "HTC peppermint_07 CCI w signal + s&r RSI" indicator, you acknowledge and agree to the terms of this disclaimer. If you do not agree with these terms, do not use the indicator.

Trading IQ - Razor IQIntroducing TradingIQ's first dip buying/shorting all-in-one trading system: Razor IQ.
Razor IQ is an exclusive trading algorithm developed by TradingIQ, designed to trade upside/downside price dips of varying significance in trending markets. By integrating artificial intelligence and IQ Technology, Razor IQ analyzes historical and real-time price data to construct a dynamic trading system adaptable to various asset and timeframe combinations.
Philosophy of Razor IQ
Razor IQ operates on a single premise: Trends must retrace, and these retracements offer traders an opportunity to join in the overarching trend. At some point traders will enter against a trend in aggregate and traders in profitable positions entered during the trend will scale out. When occurring simultaneously, a trend will retrace against itself, offering an opportunity for traders not yet in the trend to join in the move and continue the trend.
Razor IQ is designed to work straight out of the box. In fact, its simplicity requires just a few user settings to manage output, making it incredibly straightforward to manage.
Long Limit Order Stop Loss and Minimum ATR TP/SL are the only settings that manage the performance of Razor IQ!
Traders don’t have to spend hours adjusting settings and trying to find what works best - Razor IQ handles this on its own.
Key Features of Razor IQ
Self-Learning Retracement Detection
Employs AI and IQ Technology to identify notable price dips in real-time.
AI-Generated Trading Signals
Provides retracement trading signals derived from self-learning algorithms.
Comprehensive Trading System
Offers clear entry and exit labels.
Performance Tracking
Records and presents trading performance data, easily accessible for user analysis.
Self-Learning Trading Exits
Razor IQ learns where to exit positions.
Long and Short Trading Capabilities
Supports both long and short positions to trade various market conditions.
How It Works
Razor IQ operates on a straightforward heuristic: go long during the retracement of significant upside price moves and go short during the retracement of significant downside price moves.
IQ Technology, TradingIQ's proprietary AI algorithm, defines what constitutes a “trend” and a “retracement” and what’s considered a tradable dip buying/shorting opportunity. For Razor IQ, this algorithm evaluates all historical trends and retracements, how much trends generally retrace and how long trends generally persist. For instance, the "dip" following an uptrend is measured and learned from, including the significance of the identified trend level (how long it has been active, how much price has increased, etc). By analyzing these patterns, Razor IQ adapts to identify and trade similar future retracements and trends.
In simple terms, Razor IQ clusters previous trend and retracement data in an attempt to trade similar price sequences when they repeat in the future. Using this knowledge, it determines the optimal, current price level where joining in the current trend (during a retracement) has a calculated chance of not stopping out before trend continuation.
For long positions, Razor IQ enters using a market order at the AI-identified long entry price point. If price closes beneath this level a market order will be placed and a long position entered. Of course, this is how the algorithm trades, users can elect to use a stop-limit order amongst other order types for position entry. After the position is entered TP1 is placed (identifiable on the price chart). TP1 has a twofold purpose:
Acts as a legitimate profit target to exit 50% of the position.
Once TP1 is achieved, a stop-loss order is immediately placed at breakeven, and a trailing stop loss controls the remainder of the trade. With this, so long as TP1 is achieved, the position will not endure a loss. So long as price continues to uptrend, Razor IQ will remain in the position.
For short positions, Razor IQ provides an AI-identified short entry level. If price closes above this level a market order will be placed and a short position entered. Again, this is how the algorithm trades, users can elect to use a stop-limit order amongst other order types for position entry. Upon entry Razor IQ implements a TP order and SL order (identifiable on the price chart).
Downtrends, in most markets, usually operate differently than uptrends. With uptrends, price usually increases at a modest pace with consistency over an extended period of time. Downtrends behave in an opposite manner - price decreases rapidly for a much shorter duration.
With this observation, the long dip entry heuristic differs slightly from the short dip entry heuristic.
The long dip entry heuristic specializes in identifying larger, long-term uptrends and entering on retracement of the uptrends. With a dedicated trailing stop loss, so long as the uptrend persists, Razor IQ will remain in the position.
The short dip entry heuristic specializes in identifying sharp, significant downside price moves, and entering short on upside volatility during these moves. A fixed stop loss and profit target are implemented for short positions - no trailing stop is used.
As a trading system, Razor IQ exits all TP orders using a limit order, with all stop losses exited as stop market orders.
What Classifies As a Tradable Dip?
For Razor IQ, tradable price dips are not manually set but are instead learned by the system. What qualifies as an exploitable price dip in one market might not hold the same significance in another. Razor IQ continuously analyzes historical and current trends (if one exists), how far price has moved during the trend, the duration of the trend, the raw-dollar price move of price dips during trends, and more, to determine which future price retracements offer a smart chance to join in any current price trend.
The image above illustrates the Razor Line Long Entry point.
The green line represents the Long Retracement Entry Point.
The blue upper line represents the first profit target for the trade.
The blue lower line represents the trailing stop loss start point for the long position.
The position is entered once price closes below the green line.
The green Razor Lazor long entry point will only appear during uptrends.
The image above shows a long position being entered after the Long Razor Lazor was closed beneath.
Green arrows indicate that the strategy entered a long position at the highlighted price level.
Blue arrows indicate that the strategy exited a position, whether at TP1, the initial stop loss, or at the trailing stop.
Blue lines above the entry price indicate the TP1 level for the current long trade. Blue lines below the current price indicate the initial stop loss price.
If price reaches TP1, a stop loss will be immediately placed at breakeven, and the in-built trailing stop will determine the future exit price.
A blue line (similar to the blue line shown for TP1) will trail price and correspond to the trailing stop price of the trade.
If the trailing stop is above the breakeven stop loss, then the trailing stop will be hit before the breakeven stop loss, which means the remainder of the trade will be exited at a profit.
If the breakeven stop loss is above the trailing stop, then the breakeven stop loss will be hit first. In this case, the remainder of the position will be exited at breakeven.
The image above shows the trailing stop price, represented by a blue line, and the breakeven stop loss price, represented by a pink line, used for the long position!
You can also hover over the trade labels to get more information about the trade—such as the entry price and exit price.
The image above exemplifies Razor IQ's output when a downtrend is active.
When a downtrend is active, Razor IQ will switch to "short mode". In short mode, Razor IQ will display a neon red line. This neon red line indicates the Razor Lazor short entry point. When price closes above the red Razor Lazor line a short position is entered.
The image above shows Razor IQ during an active short position.
The image above shows Razor IQ after completing a short trade.
Red arrows indicate that the strategy entered a short position at the highlighted price level.
Blue arrows indicate that the strategy exited a position, whether at the profit target or the fixed stop loss.
Blue lines indicate the profit target level for the current trade when below price. and blue lines above the current price indicate the stop loss level for the short trade.
Short traders do not utilize a trailing stop - only a fixed profit target and fixed stop loss are used.
You can also hover over the trade labels to get more information about the trade—such as the entry price and exit price.
Minimum Profit Target And Stop Loss
The Minimum ATR Profit Target and Minimum ATR Stop Loss setting control the minimum allowed profit target and stop loss distance. On most timeframes users won’t have to alter these settings; however, on very-low timeframes such as the 1-minute chart, users can increase these values so gross profits exceed commission.
After changing either setting, Razor IQ will retrain on historical data - accounting for the newly defined minimum profit target or stop loss.
AI Direction
The AI Direction setting controls the trade direction Razor IQ is allowed to take.
“Trade Longs” allows for long trades.
“Trade Shorts” allows for short trades.
Verifying Razor IQ’s Effectiveness
Razor IQ automatically tracks its performance and displays the profit factor for the long strategy and the short strategy it uses. This information can be found in the table located in the top-right corner of your chart showing.
This table shows the long strategy profit factor and the short strategy profit factor.
The image above shows the long strategy profit factor and the short strategy profit factor for Razor IQ.
A profit factor greater than 1 indicates a strategy profitably traded historical price data.
A profit factor less than 1 indicates a strategy unprofitably traded historical price data.
A profit factor equal to 1 indicates a strategy did not lose or gain money when trading historical price data.
Using Razor IQ
While Razor IQ is a full-fledged trading system with entries and exits - manual traders can certainly make use of its on chart indications and visualizations.
The hallmark feature of Razor IQ is its ability to signal an acceptable dip entry opportunity - for both uptrends and downtrends. Long entries are often signaled near the bottom of a retracement for an uptrend; short entries are often signaled near the top of a retracement for a downtrend.
Razor IQ will always operate on exact price levels; however, users can certainly take advantage of Razor IQ's trend identification mechanism and retracement identification mechanism to use as confluence with their personally crafted trading strategy.
Of course, every trend will reverse at some point, and a good dip buying/shorting strategy will often trade the reversal in expectation of the prior trend continuing (retracement). It's important not to aggressively filter retracement entries in hopes of avoiding an entry when a trend reversal finally occurs, as this will ultimately filter out good dip buying/shorting opportunities. This is a reality of any dip trading strategy - not just Razor IQ.
Of course, you can set alerts for all Razor IQ entry and exit signals, effectively following along its systematic conquest of price movement.

SL ManagerSTOP LOSS MANAGER
Overview:
The "SL Manager" indicator is designed to assist traders in managing their stop loss (SL) and take profit (TP) levels for both long and short positions. This tool helps you visualize intermediate levels, enhancing your trading decisions by providing crucial information on the chart.
Usage:
This indicator is particularly useful for traders who want to manage their trades more effectively by visualizing potential adjustment points for their stop loss and take profit levels. It helps in making informed decisions to maximize profits and minimize risks by providing clear levels to take partial profits and adjust stop losses.
Features:
Position Input: Select between "long" and "short" positions.
Entry Price: Specify the entry price of your trade.
Take Profit: Define the price level at which you want to take profit.
Stop Loss: Set the stop loss price level to manage your risk.
Intermediate Levels:
For both long and short positions, the indicator calculates and plots the following intermediate levels:
50% Take Profit (TP 50%): Midway between the entry price and the take profit level, where you can take partial profits and move your SL up to the 25% mark.
75% Take Profit (TP 75%): Three-quarters of the way from the entry price to the take profit level, where you can take partial profits and move your SL to breakeven.
Stop Loss Move to 25% (SL Move to 25%): A level where the stop loss can be adjusted to lock in profits.
Visualization:
The indicator plots the calculated levels directly on the chart, provided the data for the current day is available. Different color codes and line styles distinguish between the various levels:
TP 50% and TP 75% are plotted in green.
SL Move to 25% is plotted in red .
Entry/Breakeven is plotted in blue.

Financial Ratio Analysis (with / without Competitors)What Is Financial Ratio Analysis?
Financial Ratio Analysis is a quantitative technique used to assess a company's liquidity, operational efficiency, and profitability by examining its financial statements, including the balance sheet, income statement, and cash flow statement. It provides valuable insights into a company's performance over time and allows for comparisons with other companies within the same industry or sector.
What Are the Uses of Financial Ratio Analysis?
Analysis of financial ratios serves two main purposes:
1. Track company performance
Determining individual financial ratios per period and tracking the change in their values over time is done to spot trends that may be developing in a company.
Current Ratio for Adobe Inc. NASDAQ:ADBE
2. Make comparative judgments regarding company performance
Comparing financial ratios with those of major competitors enables the identification of whether a company is performing better or worse than the industry average. This comparative analysis aids in understanding the company's competitive position and potential areas for improvement.
For comparison, the script would automatically select a maximum of 5 competitors from the US markets based on the ticker's industry. This ensures a relevant comparison with industry peers to evaluate performance and assess competitive positioning.
To compare the Free Cash Flow Margin of Apple Inc. NASDAQ:AAPL with its competitors.
To compare the Free Cash Flow Margin of Apple Inc. NASDAQ:AAPL with its competitors’ average.
Customized competitors list
To customize your own competitors list, you can specify the companies or tickers you want to include in the comparison. This allows for a tailored analysis based on your specific preferences and industry knowledge.
Example:
To compare PayPal NASDAQ:PYPL with NASDAQ:MELI , NASDAQ:DLO , and NYSE:PAY , users can input the following text into the competitors list:
NASDAQ:MELI,NASDAQ:DLO,NASDAQ:PYPL,NYSE:PAY;
This will ensure that the comparison includes these specific companies alongside PayPal.
Financial ratios are grouped into the following categories:
Liquidity ratios
Leverage ratios
Efficiency ratios
Profitability ratios
Market value ratios
Liquidity Ratios
Liquidity ratios are financial ratios that measure a company’s ability to repay both short-term and long-term obligations.
Current Ratio measures a company’s ability to pay off short-term liabilities with current assets:
Current ratio = Total current assets / Total current liabilities
Cash To Debt Ratio measures a company’s ability to pay off short-term liabilities with cash and cash equivalents. A high ratio indicates a company can pay off its debt and remain solvent into the foreseeable future. In addition, it also means that if necessary, the company can take on a larger amount of debt because it has the cash to support that.
Cash to debt ratio = Cash and Short Term Investments / Total debt
Leverage Financial Ratios
Leverage ratios measure the amount of capital that comes from debt. In other words, leverage financial ratios are used to evaluate a company’s debt levels.
Debt To Assets Ratio measures the relative amount of a company’s assets that are provided from debt. This indicator is a measure of assets that are growing at the expense of debt. Because of this, you can see how a company acquired its assets over time. It can be used to assess a company's ability to meet its current debt obligations.
Debt to assets ratio = Total debt / Total assets
Debt To Equity Ratio calculates the weight of total debt and financial liabilities against shareholders’ equity:
Debt to equity ratio = Total liabilities / Shareholder’s equity
Interest Coverage Ratio shows how easily a company can pay its interest expenses:
Interest coverage ratio = Operating income / Interest expense
Efficiency Ratios
Efficiency ratios, also known as activity financial ratios, are used to measure how well a company is utilizing its assets and resources.
Research & Development (R&D) Expense to Revenue Ratio measures the percentage of sales that is allocated to R&D expenditures.
R&D to revenue ratio = Research and development expense / Total revenue * 100%
Asset Turnover Ratio measures a company’s ability to generate sales from assets. The higher it is, the more efficient the company is, since higher ratios mean that the company generates more income per dollar of assets. Conversely, if the company has a low Asset turnover, this indicates that it is inefficiently using its assets.
Asset turnover ratio = Revenue / Average total assets for two periods
Inventory Turnover shows how quickly a company sells its stock. A low turnover can mean weak sales, while a high one can mean good sales or insufficient stock. Inventory turnover is an important indicator of a company's performance.
Inventory turnover = Cost of goods sold / Total inventories
Days Sales Outstanding measures the average number of days it takes for a company to collect cash from credit purchases.
Days sales outstanding = Average Accounts Receivable / Revenue x 365 Days
Days Inventory shows the time in days that is spent turning a company's inventory into sales. This metric is an indicator of a company's inventory management. Low values are preferred for Days Inventory, which means items are selling faster and there is a quick turnaround. Large values indicate that a company has invested too much in stocks and does not have time to sell them.
Days inventory = Average inventories / Cost of goods sold * Days in period
Profitability Ratios
Profitability ratios measure a company’s ability to generate income relative to revenue, balance sheet assets, operating costs, and equity.
Gross Margin compares the gross profit of a company to its net sales to show how much profit a company makes after paying its cost of goods sold:
Gross margin % = Gross income / Total revenue * 100
Operating Margin , sometimes known as the return on sales ratio, compares the operating income of a company to its net sales to determine operating efficiency:
Operating margin = Operating income / Revenue * 100%
Free Cash Flow Margin is a profitability ratio that compares a company's free cash flow to its revenue to understand the proportion of revenue that becomes free cash flow. The higher the percentage, the more cash is available from sales. A company that shows an increasing cash flow margin from year to year is certainly getting stronger with time. This is a good indicator of its probability for long-term success.
Free cash flow margin = Free Cash Flow / Total Revenue
Return On Assets measures how efficiently a company is using its assets to generate profit. A high ROA indicates that a company successfully converts invested money into income.
Return on assets = Net income before discontinued operations / Total average assets
Return On Equity measures how efficiently a company is using its equity to generate profit:
Return on equity = Net income / Shareholder’s equity
Revenue Growth refers to the increase in a company’s total revenue or income over a specific period
Revenue growth = (Current period revenue - previous period revenue) / Previous period revenue * 100%
Earnings Per Share Growth illustrates the growth of earnings per share over time.
Earnings per share growth = ( Current period EPS - previous period EPS ) / Previous period EPS * 100%
Operating Cash Flow Growth is the long term rate of growth of operating cash, the money that is actually coming into the bank from business operations.
Operating cash flow growth = ( Current period operating cash flow - previous period operating cash flow) / Previous period operating cash flow* 100%
Market Value Ratios
Market value ratios are used to evaluate the share price of a company’s stock.
Book Value Per Share calculates the per-share value of a company based on the equity available to shareholders. In case of the company liquidation, the book value per share shows the monetary value remaining for common shareholders after all assets are sold and all debt is paid. If a company’s Book value per share is higher than a market price of its share, then the stock may be considered undervalued.
Book value per share = Total common equity / Total common shares outstanding
Dividend Yield measures the amount of dividends attributed to shareholders relative to the market value per share:
Dividend yield = Dividends TTM for the primary issue excluding special dividends / Price of the primary issue
Diluted Earnings per Share (Diluted EPS)
EPS stands for earnings per share. Investors use EPS to measure how much money a company makes for every outstanding share the company has. Diluted EPS is slightly different in that it measures the earnings per share for a company if all convertible securities (such as preferred stocks, convertible debt instruments, stock options and warrants) were used to calculate the metric.