iCryptoScalperHi everyone!
In this post I would like to present my personal indicator for short-term strategies on cryptocurrencies called iCryptoScalper , but let me first introduce myself:
I am a theoretical physicist with a deep passion for trading and mathematical modelling of the financial markets.
I started trading cryptocurrencies more than 4 years ago and, throughout this period, I got more and more involved in trying to describe the mechanisms governing
the price action at lower timeframes like 1, 5 and 15 minutes.
As a beginner, I started with the usual "buy and hold" strategy, the safest but also boring option. Afterthat, I tried to get more involved on speed trading
and scalping and, as it happens to all the beginners, I went through many mistakes.
At the beginning, trying to find the best scalping strategy, was a very difficult task and I barely managed to perform well, mostly because every trade were overwhelmed
by my emotional approach and the fear of missing the right entry point and/or exit point. However, thanks to these difficulties, I understood that I needed
an algorithmic procedure to improve my performances and overtake the emotional approach, with a more technical approach: a mathematical guide that precisely tells me how to behave in the best way possible to be profitable.
To achieve this goal, I put all my efforts in trying to write a consistent mathematical model able to give me all the statistical informations I needed to reach
the best performances and, of course, the best possible profits.
The iCryptoScalper is an explicit mathematical tool to be used for scalping strategies and optimized for different cryptocurrency pairs on 15/30 min timeframes.
The script gives you many useful informations and details regarding the current and subsequent trade, accompanied with a detailed overview on both the last 20 short
and long trade results.
Let us have a look to all the detailed informations the script shows to you:
CHART
- Lines: The script plots for you the Entry price (yellow line), the Stop Loss price (red line) and a series of 8 Take Profit levels (green lines).
- Background: The green background color indicates that the script is in a long position, viceversa, the red background color indicates that the script is in a short position.
- Labels: The blue labels indicate the maximum achieved profit for each trade.
- Alerts: The script shows two types of alerts, the "prepare to #" one and the true entry one. The prepare alert is very useful to understand when the strategy is going
to enter a specific trade, thus giving you the possibility to set up all the necessary Entry/SL/TP levels on your favorite trading platform.
- Crosses: The green and red crosses are precisely located at the corresponding long and short entry price for the next trade, thus giving you a preview on the target price
that has to be reached for the indicator to enter. They are computed thanks to a mathematical model I set up and optimized for each cryptocurrency pair.
PANEL
- Overview: This part shows you two probability tables for the last 20 long and short trades each. The first table indicates the set of probabilities of reaching the corresponding TP level, whereas the second table shows the conditional probability , namely the probability of reaching a certain profit level once the previous one has been achieved.
Below the tables you can find three quantities again referring to the last 20 long and short trades: the Average Maximum Profit , the Average Maximum Drawdown and the Average Risk/Reward Ratio .
Last but not least, the correlation between the current asset and BTC is displayed together with the current BTC status.
- Active Trade: This part collects all the data related to the current trade status.
- Next Trade: This part collects all the data related to the next trade status.
ATTENTION!
Please notice that the equity line you see in the "Strategy Tester" section of TradingView is unreliable compared to the real performances of the script. This is due to the
fact that the TradingView engine is designed for backtesting automatic trading strategies and not real-time trading bots.
An example is the following: Bob buys 1 BTC-PERP contract at 10000$, setting the Stop Loss at 9000$. The price of the perpetual then goes to 12000$ and then go back hitting the Stop Loss. For the TradingView Engine this is a
trade with a permanent loss of 1000$. However, for the iCryptoScalper users, the trade is perfectly fine thanks to the numerous TP levels (and corresponding probabilities) given by the script within the trade window.
"profit" için komut dosyalarını ara
Premium Planning Tool V1.0Background to the tool
The tool was built out of frustration. Having traded for many years with a reasonable level of success I was always frustrated that my trading never went up a level. The world of trading is filled with people having so much more success than me and this level of FOMO really bothered me and resulted in inconsistency and countless hours sitting in front of a screen, hoping for the best. I also became a little bit of an indicator junkie - was there a holy grail indicator out there for me? I always felt that as a retail trader I was behind the curve. I started to investigate how the major market participants trade and make money and I was astounded at the level of success that they get from creating strategies and sticking to it. The market is driven largely by a "black boxes" which, for us retail traders are outside of our ability to access. I wanted to build a tool that could give me a traders edge.
Another factor that has always bothered me was when reading investing books there is a general assumption that a standard entry, say 8/13 cross over, works on all stocks. However, it is not the case and it can be frustrating for a trader using a set up and not realizing that the set up is the problem, not the trader. This realization alone has made a huge impact on my trading. The big boxes that control the market know this already.
Also, a lot of indicators that are available don’t take advantage of the backtesting capability provided in Tradingview. It is fairly simple to find 8-9 trades where a set up worked and then fall into the trade of assuming that it cannot fail. Knowing which set ups work and how frequently it will print will change the way that you trade.
The goal with the tool is to identify setups that have worked in the past with a high degree of profitability, high profit factor and low drawdown and using the planning tool allows you to customize the setup to find exactly what you are looking for across any tradeable asset on TradingView.
Over the past 20 years I have realized the following:
1) Not all entries and signals work the same on all stocks
2) Not having a plan in advance lowers your probability of success
3) Developing consistency in analysis is critical
4) Developing confidence in your own plan is more important than whose trades you try to copy
5) Having 30 indicators does not help you trade better - it leads to more frustration
So here is the product of these realisations:
1) The tool looks across the most common entry strategies (MA cross on 5 dimensions of type and 5 common crossovers) and can be used on 19 different time frames giving you guidance on what the best set up is for the stock you are analysing
2) It incorporates volatility into the strategy – when stocks are trading outside of a predetermined volatility band, a trade will not be entered. This accommodates traders who tend to get shaken out of trades too early.
3) It looks at the impact of “buying the dip” – often a common strategy employed by many traders which now can be backtested and reviewed to see if it actually helped or hindered the trade.
4) It measures your trade plan against your R – what you are willing to risk – and calculates your target profit based on your R multiple
5) It provides a non repaint signal on your base strategy and provides you with signals to trade smaller or shorter signals within the bigger strategy.
There are some additional visual tools:
• Squeeze signals - I am a big fan of the TTM squeeze however the Squeeze by itself can be hard to trade. Seeing a squeeze fire long on a chart can add to trade confidence.
• Seeing zones of support and resistance rather than single lines can also give you some leeway in terms of not getting pushed out of a trade too soon.
The backtester is always reviewed on a 2 to 3 year period to get an understanding of win rate %, profit ratio and average duration of trade. As an option trader knowing that a high probability move is playing out allows me to make sure that I don’t undercut the time frame for the expiration of the option relative to the historical average duration of a trade. Backtesting on shorter times is unrealistic.
Key benefits
1) It saves me a ton of time. I don’t have to sit in front of a screen watching ticks each day. I can plan for an entry, set an alert for a trade and when the conditions are met the TradingView system sends me a message and I will go and confirm a trade, execute it, set my alerts for control and move on with my life.
2) It allows me to review trade ideas in a consistent manner using the best trade plan and set up for a stock.
3) It forces me to be patient and not panic (always a good thing). With an adjustable volatility feature I can modify the volatility band in the trade plan to accommodate choppy market conditions.
4) It looks at both sides of the market (long and short) and you can calculate the impact of being market neutral or having a directional bias.
The setup is based on a reversal set up and we are doing a single entry trade here with a base of 4ATR stop using a long call or a bull call debit spread and allowing GOOGL to trade on a 1ATR price band on a daily basis. This strategy has only generated 10 signals since 2018 however it has been profitable 87.5% of the time with a profit factor of 25.26. Personally, on signals with this degree of strength I will trade a long stock purchase on a STRATEGY ENTRY signal and I will look to trade shorter duration option trades (both debit and credit spreads) on the trend signals INSIDE the major buy signal.
As a high probability set up you can trade this signal by itself or you can trade the trend inside the signal which will trigger at 2966. Either way, set your alerts and get on with your life.
I hope this tool helps you to achieve some degree of peace in your trading.
To get access to the tool, please contact the author.
Double SupertrendThis strategy is based on a custom indicator that was created based on the Supertrend indicator. At its core, there are always 2 super trend indicators with different factors to reduce market noise (false signals).
The strategy/indicator has some parameters to improve the signals and filters.
TECHNICAL ANALYSIS
☑ Show Indicators
This option will enable/disable the Supertrend indicators on the chart.
☑ Length
The length will be used on the Supertrend Indicator to calculate its values.
☑ Dev Fast
The fast deviation or factor from one of the super trend indicators. This will be the leading indicator for entry signals, as well as for the exit signals.
☑ Dev Slow
The slow deviation or factor from one of the super trend indicators. This will be the confirmation indicator for entry and exit signals.
☑ Exit Type
It's possible to select from 4 options for the exit signals. Exit signals always take profit target.
☑ ⥹ Reversals
This option will make the strategy/indicator calculate the exit signals based on the difference between the given period's highest and lowest candle value (see Period on this list). It's displayed on the chart with the cross. As it's possible to verify in the image below, there are multiple exit spots for every entry.
☑ ⥹ ATR
Using ATR as a base indicator for exit signals will make the strategy/indicator place limit/stop orders. Candle High + ATR for longs, Candle Low - ATR for shorts. The strategy will show the ATR level for take profit and stick with it until the next signal. This way, the take profit value remains based on the candle of the entry signal.
☑ ⥹ Fast Supertrend
With this option selected, the exit signals will be based on the Fast Supertsignal value, mirrored to make a profit.
☑ ⥹ Slow Supertrend
With this option selected, the exit signals will be based on the Slow Supertsignal value, which is mirrored to take profit.
☑ Period
This will represent the number of candles used on the exit signals when Reversals is selected as Exit Type. It's also used to calculate the gradient used on the Fills and Supertrend signals.
☑ Multiplier
It's used on the take profit when the ATR option is selected on the Exit Type.
STRATEGY
☑ Use The Strategy
This will enable/disable the strategy to show the trades calculations.
☑ Show Use Long/Short Entries
Option to make the strategy show/use Long or Short signals. Available only if Use The Strategy is enabled
☑ Show Use Exit Long/Short
Option to make the strategy show/use Exit Long or Short signals (valid when Reversals option is selected on the Exit Type). Available only if Use The Strategy is enabled
☑ Show Use Add Long/Short
Option to make the strategy show/use Add Long or Short signals. With this option enabled, the strategy will place multiple trades in the same direction, almost the same concept as a pyramiding parameter. It's based on the Fast Supersignal when the candle fails to cross and reverses. Available only if Use The Strategy is enabled
☑ Trades Date Start/End
The date range that the strategy will check the market data and make the trades
HOW TO USE
It's very straightforward. A long signal will appear as a green arrow with a text Long below it. A short signal will appear as a red arrow with a text Short above it. It's ideal to wait for the candle to finish to validate the signal.
The exit signals are optional but give a good idea of the configuration used when backtesting. Each market and timeframe will have its own configuration for the best results. On average, sticking to ATR as an exit signal will have less risk than the other options.
☑ Entry Signals
Follow the arrows with Long/Short texts on them. Wait for the signal candle to close to validate the entry.
☑ Exit Signals
Use them to close your position or to trail stop your orders and maximize profits. Select the exit type suitable for each timeframe and market
☑ Add Entries
It's possible to increase the position following the add margin/contracts based on the Add signals. Not mandatory, but may work as reentries or late entries using the same signal.
☑ What about Stop Loss?
The stop-loss levels were not included as a separated signal because it's already in the chart. There are some possible ideas for the stop loss:
☑⥹ Candle High/Low (2nd recommend option)
When it's a Long signal from the entry signal candle, the stop loss can be the Low value of the same candle. Very tight stop loss in some cases, depending on the candle range
☑⥹ Local Top/Bottom
Selecting the local top/bottom as stop loss will give the strategy more room for false breakouts or reversals, keeping the trade open and minimizing noises. Increases the risk
☑⥹ Fast Supertrend (1st recommend option)
The fast supertrend can be used as stop-loss as well. making it a moving level and working close to trail stop management
☑⥹ Fixed Percentage
It's possible to use a fixed risk percentage for the trades, making the risk easier to control and project. Since the market volatility is not fixed, this may affect the accuracy of the trades
☑⥹ Based on the ATR (3rd recommend option)
When the exit type option ATR is selected, it will display the take profit level for that entry. Just mirror that value and put it as stop-loss, or multiply that amount by 1.5 to have more room for market noise.
EXAMPLE CONFIGURATIONS
Here are some configuration ideas for some markets (all of them are from crypto, especially futures markets)
BTCUSDT 15min - Default configuration
BTCUSDT 1h - Length 10 | Dev Fast 3 | Dev Slow 4 | Exit Type ATR | Period 50 | Multiplier 1
BTCUSDT 4h - Length 10 | Dev Fast 2 | Dev Slow 4 | Exit Type ATR | Period 50 | Multiplier 1
ETHUSDT 15min - Length 20 | Dev Fast 1 | Dev Slow 3 | Exit Type Fast Supertrend | Period 50 | Multiplier 1
IOTAUSDT 15min - Length 10 | Dev Fast 1 | Dev Slow 2 | Exit Type Slow Supertrend | Period 50 | Multiplier 1
OMGUSDT 15min - Length 10 | Dev Fast 1 | Dev Slow 4 | Exit Type Slow Supertrend | Period 50 | Multiplier 1
VETUSDT 15min - Length 10 | Dev Fast 3 | Dev Slow 4 | Exit Type Slow Supertrend | Period 50 | Multiplier 1
HOW TO FIND OTHER CONFIGURATIONS
Here are some steps to find suitable configurations
select a market and time frame
enable the Use This Strategy option on the strategy
open the strategy tester panel and select the performance summary
open the strategy configuration and go to properties
change the balance to the same price of the symbol (example: BTCUSDT 60.000, use 60.000 as balance)
go back to the inputs tab and keep changing the parameters until you see the net profit be positive and bigger than the absolute value of the drawdown
in case you can't find a suitable configuration, try other timeframes
Since the tester reflects what happened in the past candles, it's not guaranteed to give the same results. However, this indicator/Strategy can be used with other indicators as a leading signal or confirmation signal.

Bollinger Bands And Aroon Scalping (by Coinrule)Many technical indicators can be profitable in certain market conditions while failing in others. No indicator is perfect alone.
All the best trading strategies involve multiple indicators and leverage the benefit of each of them. The following is an optimised strategy based on Bollinger Bands and the Aroon indicator.
The Bollinger Bands are among the most famous and widely used indicators. They can suggest when an asset is oversold or overbought in the short term, thus provide the best time for buying and selling it.
A strategy buying dips can work well during times of uptrend. Downtrends will result in a drawdown for the P&L of the strategy. The suggested approach minimises the drawdowns, ensuring that the system trades only when it's more likely to close the trade in profit.
The Setup
ENTRY
The price crosses below the basis line of the Bollinger Band indicator
The Aroon Indicator is above 90
EXIT
The price crosses below the upper Bollinger Band
The Aroon Indicator drops below 70
The Aroon Indicator plays a key role in this strategy. It acts as a confirmation that the asset is currently in an uptrend. On the other hand, it acts as a stop if market conditions deteriorate. The strategy uses an Aroon Indicator set to 288 periods to provide a longer-term view on market conditions, not being heavily dependent on short-term volatility.
The best time frame for this strategy based on our backtest is the 4-hr . The 1-hr can work well with three times more trades, on average. As trades increase, the profitability decreases. Yet again, this is the confirmation that trading more does not mean gaining more.
To make the results more realistic, the strategy assumes each order to trade 30% of the available capital. A trading fee of 0.1% is taken into account. The fee is aligned to the base fee applied on Binance, which is the largest cryptocurrency exchange.

Chaikin Money Flow + MACD + ATRHere I present you on of Trade Pro's Trading Idea: Chaikin Money Flow + MACD + ATR.
This strategy is not as profitable as it can be seen in one of his videos. In the forex market, the strategy could reach a maximum of 35% profitability.
I have, as some of my followers have requested, created an overview of the current position, risk and leverage settings in the form of a table.
Furthermore, one can again swap between short and long positions.
It is now possible to select or deselect individual indicators.
I have chosen the ATR alone as a take profit stop loss, as in his strategy.
A position is only triggered as soon as all prerequisites have been fulfilled and a command is executed. This prevents false triggering by bots and repainting.
-----------------------------------------------------------------------------------
How does the strategy work?
ENTRY
Long
The MACD indicator must be above the zero line.
Then the K line must cross the D line.
Finally, when this happens, the Money Flow Index must be above the zero line.
Short
Contrary to the premise of long positions.
EXIT
ATR Exit
The value of ATR at the time of buying is multiplied by the value entered in "Profit factor ATR" and "Stop factor ATR". As soon as the price reaches this value, it is closed.
Important
The script must be optimized for each coin or currency pair.
I will publish a guide to the strategy shortly. There I will explain how the table works and how to set the strategy correctly.
The results of the strategy are without commissions and leverage.
If you have any questions or feedback, please let me know in the comments.

SSP + VWMAInput menu allows you to set long / short entries using,
Net volume change from above or below zero.,
Net volume changes of positive to negative values,
VWAP rising or falling.
VWMA rising or falling
Stop loss and take profit are built in to test the most profitable strategy.
uncheck net volume in menu bar to remove background colours on chart
Uncheck VWAP and VWMAto test long and short entries ( using net volume change ) note session look back is available to edit, if use take profit is unchecked then this will simulate net volume change from positive to negative.
Check VWMA or VWAP to simulate long or short entries
With VWAP checked this will simulate VWAP entries with rising / falling VWAP with previous take profit and stop losses that we’re profitable.

Backtest Service Program (BASE) [FAF-Software-Solutions]{Deutsche Beschreibung folgt der englischen Beschreibung}
█ OVERVIEW
With BASE you can quick and easy create, test or optimize seasonal trading strategies. Seasonality is a strong, if not the strongest, trading approach to making money in the capital markets over the long term. Whether individually or in combination with other strategies, seasonality is a tool for your trading that should not be underestimated.
We have packed this script with everything you need for a meaningful seasonal analysis. Define entry and exit times according to day of the week, day of the month and the month itself, very easily via the settings window. Determine the period to be evaluated and, if desired, add a stop loss and / or a take profit to add a healthy risk and money management to your strategy. Since this is a pine strategy script, the usual trading view strategy parameters such as account size, commission, slippage, etc. are also available and you can set up your backtest even more realistically and therefore more truthfully.
Would you like to evaluate the behavior of a certain share over the turn of the year, would you like to find out which day of the week in gold has been the most profitable over the past 50 years or just check the "Sell in May" effect? This is exactly what we created this script for. With just a few clicks you can evaluate approaches such as the "Sell in May" effect or the "Santa Claus Rally", you can check which day of the week, which day of the month or which month is the strongest in an instrument and develop individual strategy systems from this.
█ FEATURES
The script input window has the following setting options:
• Backtest start / Backtest end: Set your Backtast Range here.
• Trade direction: Decide whether your strategy should open buy or sell positions.
• Pyramiding Indicates how many positions can be open at the same time (maximum 10 positions)
• Stop Loss / Take Profit: In order to optimize your strategy, you have the option of adding profit and loss levels (visible in the chart) to your open positions.
This enables you to adapt your trading system to your risk and money management. The stop and take profit levels are freely selectable.
• Entrys / Exits: Divided into days of the week, days of month and months itself, you can individually choose when you want to open and close a position.
• Advanced Filter: Seasonally, the 4-year election cycle of the US presidential election has a strong impact on the markets.
In order to be able to develop analyzes in connection with this cycle, there is an advanced filter to be able to filter the different election years.
█ HOW TO USE
After the script has been added to the chart, the input window opens immediately and you can easily select your strategy parameters. After confirming your selection, all trades will be added to the chart and you will find the key metrics for your system in the Tradingview Strategy Tester. If you have added a stop or profit level, you can also see this graphically in the chart and thus analyze every trade in the chart very precisely.
The entry and exit fields can be selected individually to be activated. If no selection is made, e.g. no selection for the weekday entry, then there is no longer any filtering and entry / exit is possible on any weekday. As soon as a selection is made under the entry / exit parameters, the system filters according to the criteria made during the selection. A position is always opened / closed at the closing price (close) of the candle, at which all selected criteria match.
█ LIMITATIONS
This script is just a tool for your trading. You dont receive any finished trading strategy or backtest, but a program with which you can create and optimize your own seasonal trading strategies without any programming knowledge.
This script was developed for seasonal back tests over a long history and therefore works best in a time resolution greater than or equal to the daily chart (1D).
█ IMPORTANT
The strategy results shown here were made with the default script settings in the SPX symbol. In order to test the pure seasonality, no slippage and commission are included in the default inputs. By default, 100% of the capital is used to open a position. These settings allow a quick check of seasonality without the distortion from commissions, slippage or margin calls, but to get a real strategy you need to add these things later. If you have identified a seasonal phase and want to build a trading strategy from it, you have to add realistic commission and slippage and adjust the positionsize. The backtesting results shown here are chosen randomly and are not a real strategy. The strategy key metrics are therefore not relevant and the chart is only used to illustrate the script design
Use the link below to get more information
═════════════════════════════════════════════════════════════════════════
█ ÜBERSICHT
Mit der BASE kannst Du schnell und unkompliziert saisonale Handelsstrategien erstellen, testen oder optimieren. Die Saisonalität ist ein starker, wenn nicht sogar der stärkste Handelsansatz, um langfristig Geld an den Kapitalmärkten zu verdienen. Ob nun einzeln oder in Kombination mit anderen Strategien, die Saisonalität ist ein nicht zu unterschätzendes Hilfsmittel für deinen Handel.
Dieses Skript haben wir mit allem vollgepackt was du für eine aussagekräftige saisonale Auswertung benötigst. Definiere Ein- und Ausstiegszeitpunkte nach Wochentag, Tag des Monats und dem Monat selbst, ganz einfach über das Einstellungsfenster. Bestimme den auszuwertenden Zeitraum und ergänze wenn gewünscht einen Stop Loss und/oder einen Take Profit um deiner Strategie ein gesundes Risiko- und Moneymanagement hinzuzufügen. Da es sich hierbei um ein Pine-Strategieskript handelt stehen Dir die üblichen Tradingview Strategieparameter wie Kontogröße, Kommission, Slippage usw. ebenfalls zur Verfügung und Du kannst deinen Backtest noch realistischer und damit auch wahrheitsgemäßer aufstellen.
Du möchtest das Verhalten einer bestimmten Aktie über den Jahreswechsel auswerten, möchtest herausfinden welcher Wochentag in Gold über die letzten 50 Jahre der profitabelste war oder einfach mal eben den "Sell in May" Ansatz überprüfen? Genau hierfür haben wir dieses Skript erstellt. Mit wenigen Klicks kannst Du Ansätze wie den "Sell in May" Effekt oder die "Santa Claus Rally" auswerten, kannst prüfen welcher Wochentag, welcher Tag des Monats oder welcher Monat der stärkste in einem Instrument ist und daraus ganz individuelle Strategie-Systeme entwickeln.
█ EIGENSCHAFTEN
Das Eingabefenster des Skripts hat folgende Einstellungsmöglichkeiten:
• Backtest start / Backtest end: Hier legst Du fest für welchen Zeitraum dein Backtest erstellt werden soll.
• Trade direction: In diesem Feld wird bestimmt ob die Positionen in Long- oder Short-Richtung eröffnet werden sollen.
• Pyramiding Gibt an wie viele Positionen zu selben Zeit offen stehen können (maximal 10 Positionen möglich)
• Stop Loss / Take Profit: Um deine Strategie optimieren zu können hast Du die Möglichkeit Gewinn- und Verlustlevel (sichtbar im Chart) zu deinen offenen Positionen hinzuzufügen.
Dadurch ist es Dir möglich dein Handelssystem an dein Risiko- und Moneymanagement anzupassen. Die Stop Loss und Take Profit Level sind frei wählbar.
• Entrys / Exits: Unterteilt in Wochentage, Kalendertage und Monate kannst Du hier ganz individuell auswählen zu welchem Zeitpunkt Du eine Position eröffnen und schließen möchtest.
• Advanced Filter: Saisonal betrachtet beeinflusst der 4-jährige Wahlzyklus der US-Präsidentschaftswahlen die Märkte stark.
Um Analysen im Zusammenhang mit diesem Zyklus entwickeln zu können gibt es hierfür einen erweiterten Filter um die verschiedenen Wahljahre filtern zu können.
█ ANWENDUNG
Nachdem das Skript auf den Chart aufgerufen wurde öffnet sich sofort das Eingabefenster in welchem Du deine Strategieparameter auswählen kannst. Nach dem Bestätigen der Auswahl kannst du sofort deine Trades auf dem Chart erkennen und hast über den Tradingview Strategie-Tester die Auswertung zu deinem System vorliegen. Wenn du ein Stop Loss oder Take Profit Level hinzugefügt hast kannst Du auch dieses grafisch auf dem Chart erkennen und so jeden Trade im Chart ganz genau analysieren.
Die Entry und Exit Felder können einzeln angewählt und somit aktiviert werden. Ist in einer Reihe wie beispielsweise den Wochentagen keiner der Tage ausgewählt so wird nicht mehr nach den Wochentagen gefiltert und ein Einstieg/ Ausstieg ist zu jedem Wochentag möglich. Sobald unter den Entry/ Exit Parametern eine Auswahl getroffen wird filtert das System nach den in der Auswahl getroffenen Kriterien. Es wird immer zum Schlusskurs (Close) der Kerze eingestiegen bei der alle ausgewählten Kriterien übereinstimmen.
█ EINSCHRÄNKUNGEN
Dieses Skript stellt ausschließlich ein Hilfsmittel für deinen Handel dar. Du erhältst keine fertigen Handelsstrategien oder Backtests sondern ein Tool mit welchem Du ohne Programmierkenntnisse in der Lage bist eigene saisonale Handelsstrategien zu erstellen und zu optimieren.
Das Skript wurde für saisonale Backtests über eine lange Historie entwickelt und arbeitet daher am besten in den Zeitfenstern größer oder gleich dem Tageschart (1D).
█ WICHTIG
Die hier gezeigten Strategieergebnisse wurden mit den Standard-Skripteinstellungen im SPX-Symbol erstellt. Um die reine Saisonalität zu testen, sind in den Standardeingaben keine Slippage und Provision enthalten. Standardmäßig wird 100% des Kapitals verwendet, um eine Position zu eröffnen. Diese Einstellungen ermöglichen eine schnelle Prüfung der Saisonalität ohne Verzerrungen durch Provisionen, Slippage oder Margin Calls. Um eine handelbare Strategie zu erhalten müssen die Angaben zu Slippage, Kommission und Positionsgröße aber später unbedingt ergänzt werden. Die hier gezeigten Backtesting-Ergebnisse wurden zufällig ausgewählt und sind keine echte Strategie. Die Strategiekennzahlen sind daher nicht relevant und das Chartbild dient nur zur Veranschaulichung des Skriptdesigns
Verwende den untenstehenden Link für mehr Informationen
RSI Strategy w/ Trailing SL / TP Optimized for Crypto [Strategy]This strategy is designed to use the RSI and EMA filters. A 200 period EMA is used for short / long filters, and the 50 period EMA is used to determine the direction of the short term trend.
In addition, the script uses "rate of change" for the fast EMA (trend), volume , RSI (momentum), and price (volatility) and only takes trades when all are in optimal conditions.
I.E., the EMA is in an uptrend, the volume is increasing, price is in an uptrend, and the RSI is in an uptrend, so we will place a Long trade.
This strategy uses EMAs as a trailing stop loss and take profit. As this is a trend following strategy, the idea is to maximize profits when correct and minimize losses when
wrong.
It was designed specifically using crypto pairs, and was optimized for the 10 minute chart.
My goal was to get the best use out of the RSI indicator. I was originally an MACD fanboy, but have recently converted.
Want to help me improve this code or strategy? Have suggestions for improvement? Leave them in the comments below.
Thanks for using my script! I hope it works well for you and good luck in the markets.
If you have any questions, please leave them in the comments and I'll do my best to respond.
This script does not repaint as it only relies on close data to make a decision to enter a trade.
How to use this strategy:
___________________________
Enable Long Entries? - Used to enable or disable the strategy from executing long entries.
Enable Short Entries? - Used to enable or disable the strategy from executing short entries.
How Many Bars To Look Back for Hi/Lo: - This is used for the Stop Loss and Take Profit targets. An integer of bars is used to look back and calculate the values.
RSI Length (Rec: 8) - The length of the RSI
Source - The RSI Source
Use Slow EMA? - If checked, a 200 period EMA will be used to filter entries long or short (only take shorts when the price is below, long when above). In addition, the script will close any trades that cross the 200 period EMA. By default this is disabled.
EMA Slow - the period of the Slow EMA (200 by default)
EMA Slow Src - what to use to calculate the Slow EMA (high by default)
EMA Fast - The Fast EMA (50 period) is used to calculate the direction of the short term trend. This also factored into the Rates of Change.
EMA Fast Src - what to use to calculate the Fast EMA
ATR Length - If used, the ATR length is used to calculate the Stop Loss and Take Profit targets.
SL Multiplier - The distance away from the initial value to multiply the Stop Loss
TP Multiplier - The distance away from the initial value to multiply the Take Profit.
Use EMA as SL / TP? - If true (default) a 3 period EMA is used to calculate Stop Loss and Take Profit targets. Else, an ATR is used to calculate these values.
Stop Loss / Take Profit Offset - Default: 3 - this is used to shift the EMA / ATR Stop Loss and Take Profit lines to the right X bars. This is to ensure that they are hit properly and not exceeded.
Short Len Vol - Use to calculate the volume of the short length, used in rate of change calculations
Long Len - Use to calculate the volume of the long length, used in rate of change calculations
RSI Long Entry Val - Minimum RSI crossover value to enter a trade Long. If the RSI is below this value, trade entries are not valid.
RSI Long Cutoff Threshold - Long entry RSI value cutoff to no longer enter trades. If the RSI is above this value, trades entries are not valid.
RSI Short Entry Val - Minimum RSI crossover value to enter a trade Short. If the RSI is above this value, trade entries are not valid.
RSI Short Cutoff Threshold - Short entry RSI value cutoff to no longer enter trades. If the RSI is below this value, trades entries are not valid.
ROC Fast EMA - Calculates the rate of change between the Fast Ema now and 'X' bars ago. \n\n For a long entry, a positive value is needed, and for a short entry, a negative value is needed.
ROC Price - Calculates the rate of change between the most recent price close and 'X' bars ago. \n\n For a long entry, a positive value is needed, and for a short entry, a negative value is needed.
ROC RSI - Calculates the rate of change between the RSI now and 'X' bars ago. \n\n For a long entry, a positive value is needed, and for a short entry, a negative value is needed.
Use Close for SL - Default = Off - If checked, when a candle hits the stop loss, the trade will close on the next candle. If unchecked, the trade will remain open until the candle closes at or beyond the stop loss lines.
Custom Message Boxes - Primarily used for bots, but can be used to also insert your own messages for your trading alerts.

FCMS - Time in x Timing - The Market - StudyTime in x Timing - The Market
█ DISCLAIMER
THIS IS NOT AN INVESTMENT ADVICE
The use of strategy functions doesn't compile recurring investments/contributions as used in this study, so disregard the results of the strategy tester.
As seen in the style/plots lists, I calculate the results in internal variables to analyze historical results.
prnt.sc
Anyway, this is only a historical study and past performance is no guarantee of future results
█ CONCEPTS
There is a discussion about Timing x Time in the market.
The point of this discussion is between buying in the better moment, against exposing yourself to the market as soon as possible.
Anyone who argues that the most important factor is the time exposed to the asset, no matter when, is usually based on the SP500 asset.
As shown in the image above, a hypothetical investor who made a single investment of US $ 1500.00 in December 1999, was trapped by a volatility of approximately 10% in the period, followed by a loss of around 50% in the following years. In December 2012, this investment was finally positive, and after 20 years it accumulated a gain of 180% - without reducing inflation in the period.
█ Timing the news
When an asset reaches a new historic high, the idea of "time in the market is the best strategy" gains momentum, after all, at this "moment" everyone previously exposed to the asset is making a profit, regardless of inflation or any benchmark.
█ Time in the market
Considering using this strategy, we can define 3 points for a brief analysis:
1. Asset
SPX is used as a reference for this type of statement due to the difficulty of finding another one with such consistency, liquidity, ease of access and time of history.
2. Long Term
We cannot consider it a long term strategy, as it never has a predetermined term
3. Recurring contributions.
To generate an average cost spread over periods of high and low, opening the possibility to realize positions with profit in eventual needs.
As shown in the image below, if this hypothetical investor made monthly contributions since the date of the first contributions, he would have the possibility of making profits between the period from October 2004 to September 2008, returning to the loss until October 2010, and then with a profit of 100% over the total amount invested.
Below, an example of an asset in a downtrend with the final balance returning below the total volume invested.
█ First Conclusion
> Recurring contributions (3) to an asset (1) during a downtrend will increase the loss for an indefinite period (2).
> Recurring contributions (3) to an asset (1) during an uptrend are more important than immediate exposure to the asset, regardless of the term (2).
> Recurring contributions (3) in an asset (1) in a region of possible long-term top (2), will negatively affect profitability even considering the resumption of the upward trend in an indefinite period.
█ Timing the market
As shown in the image below, following the strategy above: a single contribution in the amount of US$ 1000.00 at the worst moment (Dec / 2017), the hypothetical investor would have hold a loss of over 80%. At the moment it accumulates 89% of profit, having reached the maximum of 200% at the beginning of the year.
By making monthly contributions since the date of the first contribution, this investor would have the possibility to make profits from May 2019, accumulating 335% profit at the moment.
Adding the condition of buying the maximum cost of 10% above the average price of the last 200 days, the final result is little affected, and reduces losses in the initial investment period.
Adding the condition of taking profit of 50% of the position when the price is above the average of the last 200 days, and reinvesting 50% of the cash obtained in the next purchase opportunity (paying a maximum of 10% above the average of the last 200 days), the profit cumulative final price drops to 270%, but the realized profit already exceeds the total amount invested, which eliminates future risk of the operation. (favorable risk-return ratio)
Adding the condition to reinvest 50% of the cash flow, with the condition to buy when the price is below 20% away from the average of the last 200 days, the final result would be more than 400% of retained earnings, and realized profit in cash greater than the total amount invested.
█ Other Assets
It's possible to analyze other assets, including dividend yield and earnings for the equity formula. This way we can analyse assets more fairly.
ITSA4
BOVA11
█ Final Conclusion
> Exposing yourself early to a good opportunity may be good, but the risk of doing so at the wrong time could delay your projects indefinitely.
> Investment recurrence is the main driver for your future results.
> Setting a maximum value for making entries reduces short-term fluctuation but, in the long run, the effect is almost imperceptible.
> The realization of profits at favorable times considerably reduces the risk and volatility of the balance, in addition to providing cash for better opportunities in the short and medium term.
> Taking advantage of part of this cash flow for purchases in moments of opportunity, enhances future earnings.
Even an extremely simple strategy like the one used in the examples above, offers a better risk return for the investor compared to the immediate exposure to an asset.
Thus arises the desire to study more sophisticated strategies, as we will see in the future
█ Challenges
Time in the market
- Find good assets (1) to make recurring contributions (3) for an indeterminate period (2).
Timing the market
- Reading the markets to position yourself in favor of the more probable trends at certain times with predetermined terms.

(IK) Base Break BuyThis strategy first calculates areas of support (bases), and then enters trades if that support is broken. The idea is to profit off of retracement. Dollar-cost-averaging safety orders are key here. This strategy takes into account a .1% commission, and tests are done with an initial capital of 100.00 USD. This only goes long.
The strategy is highly customizable. I've set the default values to suit ETH/USD 15m. If you're trading this on another ticker or timeframe, make sure to play around with the settings. There is an explanation of each input in the script comments. I found this to be profitable across most 'common sense' values for settings, but tweaking led to some pretty promising results. I leaned more towards high risk/high trade volume.
Always remember though: historical performance is no guarantee of future behavior . Keep settings within your personal risk tolerance, even if it promises better profit. Anyone can write a 100% profitable script if they assume price always eventually goes up.
Check the script comments for more details, but, briefly, you can customize:
-How many bases to keep track of at once
-How those bases are calculated
-What defines a 'base break'
-Order amounts
-Safety order count
-Stop loss
Here's the basic algorithm:
-Identify support.
--Have previous candles found bottoms in the same area of the current candle bottom?
--Is this support unique enough from other areas of support?
-Determine if support is broken.
--Has the price crossed under support quickly and with certainty?
-Enter trade with a percentage of initial capital.
-Execute safety orders if price continues to drop.
-Exit trade at profit target or stop loss.
Take profit is dynamic and calculated on order entry. The bigger the 'break', the higher your take profit percentage. This target percentage is based on average position size, so as safety orders are filled, and average position size comes down, the target profit becomes easier to reach.
Stop loss can be calculated one of two ways, either a static level based on initial entry, or a dynamic level based on average position size. If you use the latter (default), be aware, your real losses will be greater than your stated stop loss percentage . For example:
-stop loss = 15%, capital = 100.00, safety order threshold = 10%
-you buy $50 worth of shares at $1 - price average is $1
-you safety $25 worth of shares at $0.9 - price average is $0.966
-you safety $25 worth of shares at $0.8. - price average is $0.925
-you get stopped out at 0.925 * (1-.15) = $0.78625, and you're left with $78.62.
This is a realized loss of ~21.4% with a stop loss set to 15%. The larger your safety order threshold, the larger your real loss in comparison to your stop loss percentage, and vice versa.
Indicator plots show the calculated bases in white. The closest base below price is yellow. If that base is broken, it turns purple. Once a trade is entered, profit target is shown in silver and stop loss in red.

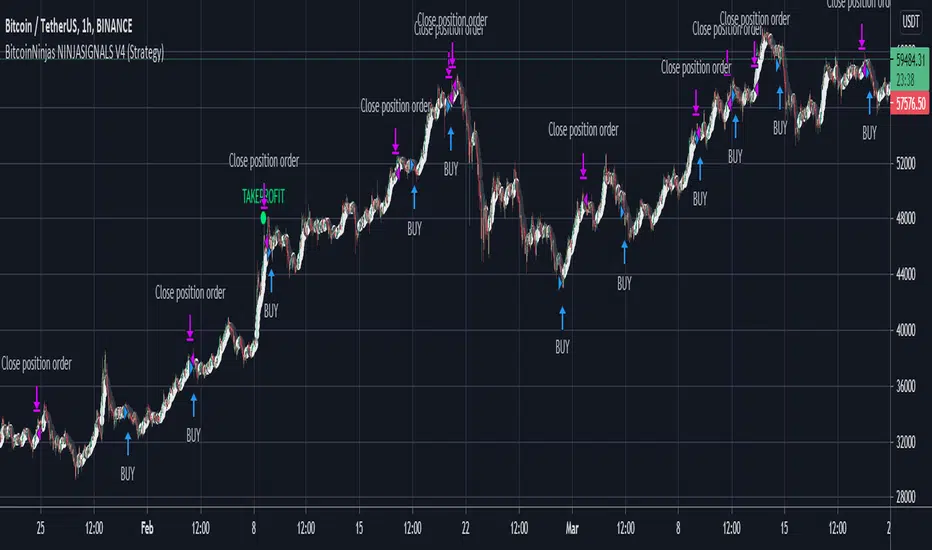
BitcoinNinjas NINJASIGNALS V4 (Strategy)BitcoinNinjas NINJASIGNALS V4 (Strategy)
(for Cryptocurrencies, Forex, GunBot, ProfitTrailer, Autoview, CryptoHopper, manual or automated trading, and more)
This is version 4 of our Ninja Signals trading script, with accompanying backtesting strategy.
BitcoinNinjas NINJASIGNALS V4 (Script)
•Allows users to easily set automated buy/long and sell/short alerts on TradingView for use with automatic and manual trading of cryptocurrencies, Forex securities, and more (alerts are compatible with automatic trading software such as GunBot, ProfitTrailer, Autoview, CryptoHopper, and more).
•Synthesizes many powerful indicators [e.g., Relative Strength Index (RSI), Stochastic RSI, Money Flow Index (MFI), Moving Average Convergence Divergence (MACD), etc.) into one powerful script to generate very precise buy and sell signals in virtually all market conditions.
•Features user-defined adjustable calibration settings, allowing traders to customize the script to fit any currency / security on any exchange available through TradingView.com, simply by adjusting settings.
•Buy/Long arrows, Sell/Short arrows, & EMA trendline can be customized or hidden, if desired.
•Complete with backtesting strategy version of script which allows users to test various trading strategies based on the alerts the script generates (see information and screenshots below).
•Backtesting strategy features a user-defined adjustable date range, so traders can estimate performance of the script over specific periods of time, such as the last week, month, or year.
•Script and backtesting strategy feature many user-adjustable settings including stop loss and take profit alerts, an ‘only sell for profit’ option (Gunbot-specific), many different buy and sell filters, and more. Simply adjust the script settings and the backtesting results will automatically refresh.
•Backtesting strategy allows for pyramid buying to test various average down / dollar cost average trading strategies. Simply adjust the number of pyramid buys and the quantity of each buy.
•Fully compatible with margin and futures trading for any currency / security on TradingView.com.
DISCLAIMER: By using our BitcoinNinjas ‘Ninja Signals’ planning script, you agree to the BitcoinNinjas 'Terms of Use'. No sharing, copying, reselling, modifying, or any other forms of use are authorized for our documents, script / strategy, and the information published with them. This informational planning script / strategy is strictly for individual use and educational purposes only. This is not financial or investment advice. Investments are always made at your own risk and are based on your personal judgement. BitcoinNinjas is not responsible for any losses you may incur. Please invest wisely.
Dankland Playground DCAing multi-strategy OPThis is essentially a script that I made for myself before deciding it may be good enough for you all as well.
How it works basically is this... you have 18 oscillators which can all be used as independently as you wish. That means there are 20 groups which they can be split amongst as you choose.
When in separate groups they should not be able to sell eachothers positions without triggering a stop loss. Every single oscillator has its own position sizing and exit sizing which can be stated as either a percent of balance or a flat amount of contracts. Each oscillator has a minimum amount of profit you can tell it to sell it, which is calculated from the average cost of your current position, which does include all groups. This works out to help you average out better entry and exit prices, essentially a method of DCAing.
You can set the minimum sale amount, which is to keep it from placing orders below your exchanges minimum dollar trade cost.
The included oscillators are as follows:
Chande Momentum cross
Moving Average Cross
MACD cross
%B Bollinger cross
Stochastic cross + region filter
Stochastic RSI cross + region filter
SMII cross and region
Three RMIs
Standard RSI
LSMA-smoothed RSI
Know Sure Thing
RSI of KST
Coppock Curve
RSI of Curve
PPO
RSI of PPO
Trix
RSI of Trix
So the idea is that this is essentially multiple strategies combined into one backtestable house. Balance is calculated for all position sizes in order to try to prevent false entries that plague so many scripts (IE, you set pyramiding to 2, each buy $1000, initial balance $1000, and yet it buys two orders off the bat for $2000 total and nets 400% profit because the second was considered free)/
You tune each side and position size them so that they work together as well as you can and in doing so you are able to create a single backtest that is capable of running a bot, essentially, between multiple strategies - you can run a slower Moving Average cross, a faster SMI cross or MACD, or Bollinger that grabs big moves only, all the while having MACD trade small bonuses along the way. This way you can weight the Risk to Reward of each against eachother.
I will not try to claim this is something you can open and with no work have the best bot on the planet. This scripts intention is to take a lot of relatively common trading strategies and combine them under on roof with some risk management and the ability to weigh each against eachother.
If you are looking for a super advanced singular algorithm that tries to capture every peak and valley exactly on the dot, this is not for you. If you are looking for a tool with a high level of customizability, with a publisher who intends to update it to the best of his ability in accordance to seeking to make the best product that I personally can make for both myself and the community (because I will be using this myself of course!) that was specifically designed with the intention of performing well in spot markets by averaging low entry costs and high exit costs, this is for you! That is the exact intention here.
I do not trade margin currently, I trade spot. I am sure this script can be tuned to work on margin but this is not my intention or area so if this is you and there is something you need for margin specifically implemented, ask, because I likely don't know what you need yet.
The current backtest shown is hand-optimized by myself for BTC/USD 1hr market with NO stop loss enabled and all sales weighed to be around 0% minimum profit from the total average entry cost.
I chose to run it myself with no stop losses because Bitcoin is so bullish to me. The stop losses can still be very profitable, but not 1495% net profit. This style of automation is not for everyone as when running with no stop loss and the requirement every sale is somewhat profitable, or at least no very noticeable loss, you wind up relying on yourself to manually stop out if things crash too much and the bot has to stop trading to wait for market to go back up. The thing to do here if you are playing without a stop loss is to have your own alerts set at your fear level, a % drop in a period of time or something like that, and when you reach that point I would consider resetting the bot so it continues to take trades. I personally will accept a temporary drop in USD as long as I can keep my BTC holdings up overall as the goal should always be to have as many BTC as possible by the start and end of the bull run.

HEINKI ASHI SUPERTRENDHi friends....publishing Heikin ashi supertrend strategy... which shows the movement of price over time and how strong those movements are/will be, regardless of the direction the price moves, up, or down. Indicator specifically useful, as it helps traders and analysts spot points where the market can and will reverse by providing signals long (buy) and short (sell). Show the relative strength of price movements but leave out the directionality of the price movements, best utilized in combination with other technical indicators – such as trend lines and moving averages – which show price trends and directions. Having an alert feature to make aware market players from signals provided by strategy.
HA charts are a great way to help those who can be spooked by the chaos of the markets (I'm one!), but they have a big drawback in that the price you see on a HA candle is often significantly different from the real price that you would trade on. This brings issues of unrealistic expectations of profits/losses, and also makes back testing a strategy very difficult. I still wouldn't recommend ever using TradingView's "strategy" tool when using HA charts, but using this indicator you can do accurate back tests.
***************This uses Heikin Ashi Candles as source on normal chart..dont use it on heikin ashi chart*****************************
There is an option for use normal japanes candle supertrend..so we can compare how this heikin ashi prevent false trades.
some tips for new traders to become successful trader
1: always follow risk management...
2: every stock/ forex / crypto has it own cycle.. So pls dont jump from one stock / forex pair to another when u hear some stock / crypto has
made new high or low... Bcs after that consolidation period starts.. During consolidation we can not make more profit as in trending market.. So be patient when u had made some position or tarde in one stock/ pair...
3 : we dont require to trade in every stocks / forex/crypto.. Just one stock and pair trading daily make u profitable beyond ur expection.. Bcs
trading in one stock / forex pair.. make u very comfortable and u may always know its movement... And u also trade in every cycle of this
stock/ pair.. So u also trdae its trend days which made highest profit. We dont know when is trend of any stock... Compare with it
business... Trading is business not one day rich game... Its business... It takes time and u have to do same thing agian and again to become
sucessfull trader for this u can use tradingview alerts. .for that u dont need to seat infrot of ur terminal screen.. u can also do algo trading
by using tradingview alerts
4 : By following risk management and incerase lot size as profit increased... This is the key 🔑 of sucess in stocks / forex / crypto market.
I thinks this tips may help new trader. U can modified according to ur trading style..
You can personal message me if u want to use this strategy
******************if u want to use this indicator u can personal message me********************************************************

888 BOT #backtest█ 888 BOT #backtest (open source)
This is an Expert Advisor 'EA' or Automated trading script for ‘longs’ and ‘shorts’, which uses only a Take Profit or, in the worst case, a Stop Loss to close the trade.
It's a much improved version of the previous ‘Repanocha’. It doesn`t use 'Trailing Stop' or 'security()' functions (although using a security function doesn`t mean that the script repaints) and all signals are confirmed, therefore the script doesn`t repaint in alert mode and is accurate in backtest mode.
Apart from the previous indicators, some more and other functions have been added for Stop-Loss, re-entry and leverage.
It uses 8 indicators, (many of you already know what they are, but in case there is someone new), these are the following:
1. Jurik Moving Average
It's a moving average created by Mark Jurik for professionals which eliminates the 'lag' or delay of the signal. It's better than other moving averages like EMA , DEMA , AMA or T3.
There are two ways to decrease noise using JMA . Increasing the 'LENGTH' parameter will cause JMA to move more slowly and therefore reduce noise at the expense of adding 'lag'
The 'JMA LENGTH', 'PHASE' and 'POWER' parameters offer a way to select the optimal balance between 'lag' and over boost.
Green: Bullish , Red: Bearish .
2. Range filter
Created by Donovan Wall, its function is to filter or eliminate noise and to better determine the price trend in the short term.
First, a uniform average price range 'SAMPLING PERIOD' is calculated for the filter base and multiplied by a specific quantity 'RANGE MULTIPLIER'.
The filter is then calculated by adjusting price movements that do not exceed the specified range.
Finally, the target ranges are plotted to show the prices that will trigger the filter movement.
Green: Bullish , Red: Bearish .
3. Average Directional Index ( ADX Classic) and ( ADX Masanakamura)
It's an indicator designed by Welles Wilder to measure the strength and direction of the market trend. The price movement is strong when the ADX has a positive slope and is above a certain minimum level 'ADX THRESHOLD' and for a given period 'ADX LENGTH'.
The green color of the bars indicates that the trend is bullish and that the ADX is above the level established by the threshold.
The red color of the bars indicates that the trend is down and that the ADX is above the threshold level.
The orange color of the bars indicates that the price is not strong and will surely lateralize.
You can choose between the classic option and the one created by a certain 'Masanakamura'. The main difference between the two is that in the first it uses RMA () and in the second SMA () in its calculation.
4. Parabolic SAR
This indicator, also created by Welles Wilder, places points that help define a trend. The Parabolic SAR can follow the price above or below, the peculiarity that it offers is that when the price touches the indicator, it jumps to the other side of the price (if the Parabolic SAR was below the price it jumps up and vice versa) to a distance predetermined by the indicator. At this time the indicator continues to follow the price, reducing the distance with each candle until it is finally touched again by the price and the process starts again. This procedure explains the name of the indicator: the Parabolic SAR follows the price generating a characteristic parabolic shape, when the price touches it, stops and turns ( SAR is the acronym for 'stop and reverse'), giving rise to a new cycle. When the points are below the price, the trend is up, while the points above the price indicate a downward trend.
5. RSI with Volume
This indicator was created by LazyBear from the popular RSI .
The RSI is an oscillator-type indicator used in technical analysis and also created by Welles Wilder that shows the strength of the price by comparing individual movements up or down in successive closing prices.
LazyBear added a volume parameter that makes it more accurate to the market movement.
A good way to use RSI is by considering the 50 'RSI CENTER LINE' centerline. When the oscillator is above, the trend is bullish and when it is below, the trend is bearish .
6. Moving Average Convergence Divergence ( MACD ) and ( MAC-Z )
It was created by Gerald Appel. Subsequently, the histogram was added to anticipate the crossing of MA. Broadly speaking, we can say that the MACD is an oscillator consisting of two moving averages that rotate around the zero line. The MACD line is the difference between a short moving average 'MACD FAST MA LENGTH' and a long moving average 'MACD SLOW MA LENGTH'. It's an indicator that allows us to have a reference on the trend of the asset on which it is operating, thus generating market entry and exit signals.
We can talk about a bull market when the MACD histogram is above the zero line, along with the signal line, while we are talking about a bear market when the MACD histogram is below the zero line.
There is the option of using the MAC-Z indicator created by LazyBear, which according to its author is more effective, by using the parameter VWAP ( volume weighted average price ) 'Z-VWAP LENGTH' together with a standard deviation 'STDEV LENGTH' in its calculation.
7. Volume Condition
Volume indicates the number of participants in this war between bulls and bears, the more volume the more likely the price will move in favor of the trend. A low trading volume indicates a lower number of participants and interest in the instrument in question. Low volumes may reveal weakness behind a price movement.
With this condition, those signals whose volume is less than the volume SMA for a period 'SMA VOLUME LENGTH' multiplied by a factor 'VOLUME FACTOR' are filtered. In addition, it determines the leverage used, the more volume , the more participants, the more probability that the price will move in our favor, that is, we can use more leverage. The leverage in this script is determined by how many times the volume is above the SMA line.
The maximum leverage is 8.
8. Bollinger Bands
This indicator was created by John Bollinger and consists of three bands that are drawn superimposed on the price evolution graph.
The central band is a moving average, normally a simple moving average calculated with 20 periods is used. ('BB LENGTH' Number of periods of the moving average)
The upper band is calculated by adding the value of the simple moving average X times the standard deviation of the moving average. ('BB MULTIPLIER' Number of times the standard deviation of the moving average)
The lower band is calculated by subtracting the simple moving average X times the standard deviation of the moving average.
the band between the upper and lower bands contains, statistically, almost 90% of the possible price variations, which means that any movement of the price outside the bands has special relevance.
In practical terms, Bollinger bands behave as if they were an elastic band so that, if the price touches them, it has a high probability of bouncing.
Sometimes, after the entry order is filled, the price is returned to the opposite side. If price touch the Bollinger band in the same previous conditions, another order is filled in the same direction of the position to improve the average entry price, (% MINIMUM BETTER PRICE ': Minimum price for the re-entry to be executed and that is better than the price of the previous position in a given %) in this way we give the trade a chance that the Take Profit is executed before. The downside is that the position is doubled in size. 'ACTIVATE DIVIDE TP': Divide the size of the TP in half. More probability of the trade closing but less profit.
█ STOP LOSS and RISK MANAGEMENT.
A good risk management is what can make your equity go up or be liquidated.
The % risk is the percentage of our capital that we are willing to lose by operation. This is recommended to be between 1-5%.
% Risk: (% Stop Loss x % Equity per trade x Leverage) / 100
First the strategy is calculated with Stop Loss, then the risk per operation is determined and from there, the amount per operation is calculated and not vice versa.
In this script you can use a normal Stop Loss or one according to the ATR. Also activate the option to trigger it earlier if the risk percentage is reached. '% RISK ALLOWED'
'STOP LOSS CONFIRMED': The Stop Loss is only activated if the closing of the previous bar is in the loss limit condition. It's useful to prevent the SL from triggering when they do a ‘pump’ to sweep Stops and then return the price to the previous state.
█ BACKTEST
The objective of the Backtest is to evaluate the effectiveness of our strategy. A good Backtest is determined by some parameters such as:
- RECOVERY FACTOR: It consists of dividing the 'net profit' by the 'drawdown’. An excellent trading system has a recovery factor of 10 or more; that is, it generates 10 times more net profit than drawdown.
- PROFIT FACTOR: The ‘Profit Factor’ is another popular measure of system performance. It's as simple as dividing what win trades earn by what loser trades lose. If the strategy is profitable then by definition the 'Profit Factor' is going to be greater than 1. Strategies that are not profitable produce profit factors less than one. A good system has a profit factor of 2 or more. The good thing about the ‘Profit Factor’ is that it tells us what we are going to earn for each dollar we lose. A profit factor of 2.5 tells us that for every dollar we lose operating we will earn 2.5.
- SHARPE: (Return system - Return without risk) / Deviation of returns.
When the variations of gains and losses are very high, the deviation is very high and that leads to a very poor ‘Sharpe’ ratio. If the operations are very close to the average (little deviation) the result is a fairly high 'Sharpe' ratio. If a strategy has a 'Sharpe' ratio greater than 1 it is a good strategy. If it has a 'Sharpe' ratio greater than 2, it is excellent. If it has a ‘Sharpe’ ratio less than 1 then we don't know if it is good or bad, we have to look at other parameters.
- MATHEMATICAL EXPECTATION: (% winning trades X average profit) + (% losing trades X average loss).
To earn money with a Trading system, it is not necessary to win all the operations, what is really important is the final result of the operation. A Trading system has to have positive mathematical expectation as is the case with this script: ME = (0.87 x 30.74$) - (0.13 x 56.16$) = (26.74 - 7.30) = 19.44$ > 0
The game of roulette, for example, has negative mathematical expectation for the player, it can have positive winning streaks, but in the long term, if you continue playing you will end up losing, and casinos know this very well.
PARAMETERS
'BACKTEST DAYS': Number of days back of historical data for the calculation of the Backtest.
'ENTRY TYPE': For '% EQUITY' if you have $ 10,000 of capital and select 7.5%, for example, your entry would be $ 750 without leverage. If you select CONTRACTS for the 'BTCUSDT' pair, for example, it would be the amount in 'Bitcoins' and if you select 'CASH' it would be the amount in $ dollars.
'QUANTITY (LEVERAGE 1X)': The amount for an entry with X1 leverage according to the previous section.
'MAXIMUM LEVERAGE': It's the maximum allowed multiplier of the quantity entered in the previous section according to the volume condition.
The settings are for Bitcoin at Binance Futures (BTC: USDTPERP) in 15 minutes.
For other pairs and other timeframes, the settings have to be adjusted again. And within a month, the settings will be different because we all know the market and the trend are changing.

Grid System With Fake MartingaleThe proposed strategy is based on a grid system with a money management that tries to replicate the effect of a martingale without having to double your position size after each loss, hence the name "fake martingale". Note that a balance using this strategy is still subject to exponential decay, the risk is not minimized, as such, it would be dangerous to use this strategy.
For more information on the martingale and grid systems see:
Strategy Settings
Point determines the "grid" size and should be adjusted accordingly to the scale of the security you are applying the strategy to. Higher value would require larger price movements in order to trigger a trade, generating fewer trades as a result.
The order size determines the number of contracts/shares to purchase.
The martingale multiplier determines the factor by which the position size is multiplied after a loss, using values higher to 2 will "squarify" your balance, while a value of 1 would use a constant position sizing.
Finally, the anti-martingale parameter determines whether the strategy uses a reverse martingale or not, if set to true then the position size is multiplied after each win.
How It Works
Let's illustrate how we replicate a martingale without doubling our exposure with a simple casino example. Imagine you are playing roulette, and that you are betting on colors (black/red), your payout is 1 to 1, in the case you win, you will have your initial stake back plus a profit equal to your initial stake.
If your strategy is to recover any previous losses, you can double your stake each time you lose, once you win you will get back the previous losses plus a profit equal to your original stake, this is the martingale system. So how can we win back previous losses without having to double our stake? We could do that by doubling the payout ratio after a loss, so after a loss, we must use a payout ratio of 2:1, if we lose once again we must use a payout of 4:1...etc, our payout ratio would be subject to exponential growth instead of our stake.
Of course, the payout ratio is fixed with casino games, but in trading, we can manipulate the position of our take profit in order to replicate such effect, this is what this strategy is doing. So after a loss, we place our take profit such that a win recover our losses back plus generate a profit.
Advantages
The advantage of this approach is that unlike the martingale we don't double our position size, which instead can remain constant, this is a huge advantage as a martingale will require a significant capital in order to tank a series of losses.
Disadvantages
The main disadvantage of this method is that the price might never reach our take profit after a long losing streak, our balance would remain in the red and we couldn't do anything about it except reset the strategy.
Frictional costs are still a disadvantage, as such, we would need to place our take profits in order to account for them, while this is still better than purchasing additional shares, it minimizes the chances of the price reaching the take profit.
Conclusions
An alternative money management system replicating the effect of a martingale as been presented, we can see that such a system is far from being perfect, and it would be foolish to use it, however, it stills offer a convenient alternative to less aggressive progressive position sizing systems.
I have been receiving some messages from users criticizing me for exposing the martingale money management system, and I understand why but I can't agree, talking about it allow me to warn users against it, the grid-martingale methodology is will create more harm than anything else, the reward is only one side of the story and should always be compared against the risk, so always take a look at all the statics in a backtest.
Thanks for reading!
Shout-Out
This post was made possible thanks to my patrons:
@Happymono, @AmariMars, @kkhaial, @Nugehe, @LucF, @Nosmok, @iflostio, @DankBeans, @ecletv, @Neverstorm, @alex.crown.jr, @uk503, @xkingshotss, @vsov, @jbelka, @yatrader2, @hughza, @ganh

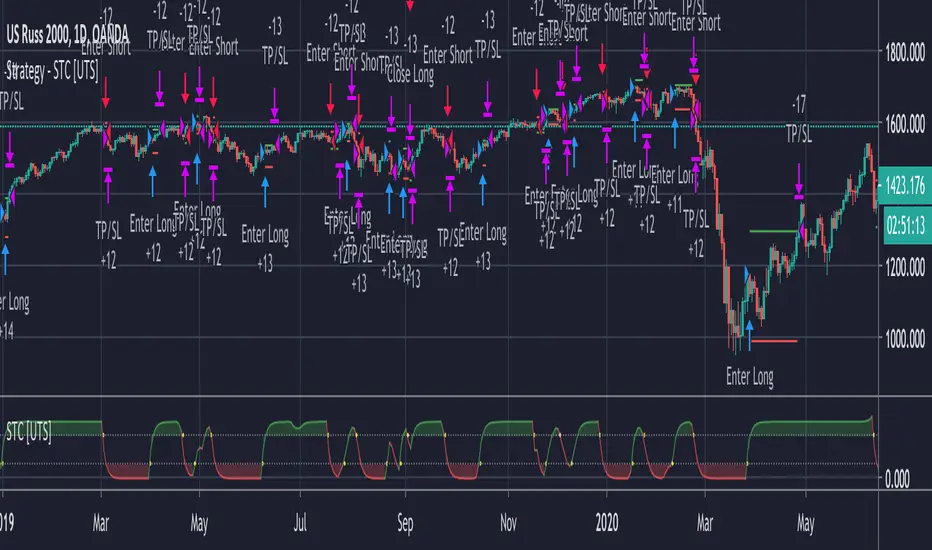
Strategy - Uber STC - Schaff Trend Cycle [UTS]Backtesting of Uber STC - Schaff Trend Cycle
Backtest with focus win/loss profitability.
Formula: profitability = win / (win+loss)
Default equity 100k USD
Default 2% Risk per trade
Default currency USD
Define backtest interval precisely by month, year, day
LONG and SHORT positions
Visualize SL and TP on chart
ATR (len: 14, smooth: SMA)
ATR based Stop-Loss, if hit trade will be closed and considered as loss
ATR based Take-Profit, if hit trade will be closed and considered as win
On TP or SL hit the trade is closed and marked as win/loss
Support/ Resistance with H1 ATR - strategy mainline versionThis script using ATR (average true range) with source hl2 for create Support/ Resistance line
The color meaning:
- Green = Support line
- Red = Resistance line
Signal:
- If close price breakout Resistance line -> LONG signal will been active.
- If close price breakout Support line -> SHORT signal will been active.
Input setting:
Recommended default setting.
- Factor: amplitude for create Support/ Resistance line.
- Length: length of ATR.
- Offset: number of bar for check sideway or choppy market.
- Take profit: if you want test close position by profit.
- Stop loss: should not be missed.
- Open Position with Stop-Market type:
+ Open LONG position with high price and type Stop-Market.
+ Open SHORT position with low price and type Stop-Market.
Strategy setting:
Recommended default setting if you trade on Binance Futures or change Comission if you trade on another exchange.
Best backtest if:
- Max drawdown less than 10%.
- Min backtest time: 6 month.
- Avg profit: 10%/ month when no leverage is used.
Alert version:
1 - Select create new alert
2 - Condition:
+ eb BUY -> LONG signal
+ eb BUY close -> close LONG position
+ eb SELL -> SHORT signal
+ eb SELL close -> close SHORT position
3 - Option: recommended using only. Because the signal will be more accurate if the price close breakout successfully.
+ Always put stop loss position to avoid PUMP/ DUMP market.
// Note: alert version not free, send for me a private message on TradingView to get price and gain access.
Recommended:
- Using in M30, M45, H1 timeframe with default setting.
- Symbol: BTC
- Exchange: Binance Futures
- Order size: 10% wallet balance, maximum 25% wallet balance.
- Leverage: X2-X5, maximum X10.
---> I using 10% wallet balance and X2 only.

Strategy - Backtest Uber WAE - Waddah Attar Explosion [UTS]Backtest of WAE - Waddah Attar Explosion
Backtest with focus win/loss profitability.
Formula: profitability = win / (win+loss)
Default equity 100k USD
Default 2% Risk per trade
Default currency USD
Define backtest interval precisely by month, year, day
LONG and SHORT positions
Visualize SL and TP on chart
ATR (len: 14, smooth: SMA)
ATR based Stop-Loss, if hit trade will be closed and considered as loss
ATR based Take-Profit, if hit trade will be closed and considered as win
On TP or SL hit the trade is closed and marked as win/loss

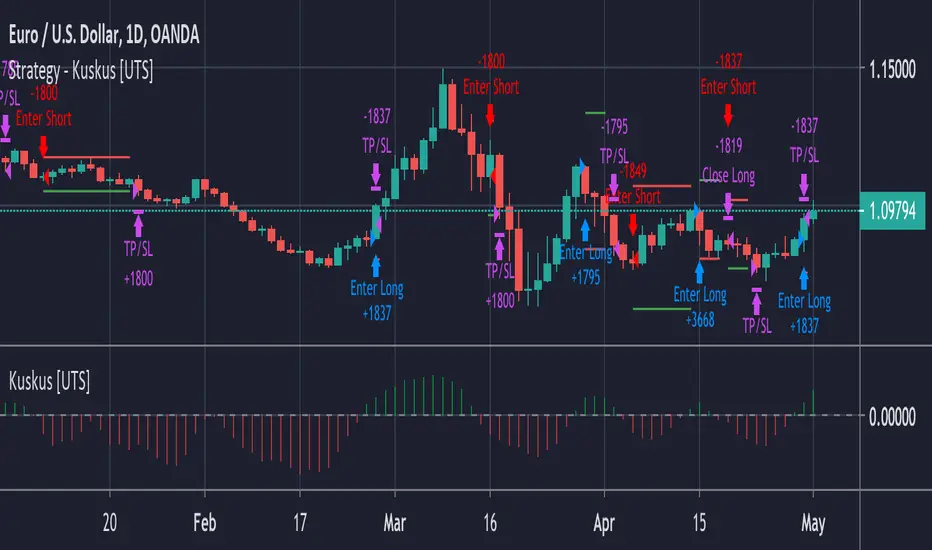
Strategy - Backtest Uber Kuskus Starlight [UTS]Backtest of Uber Kuskus Starlight
Backtest with focus win/loss profitability.
Formula: profitability = win / (win+loss)
Default equity 100k USD
Default 2% Risk per trade
Default currency USD
Define backtest interval precisely by month, year, day
LONG and SHORT positions
Visualize SL and TP on chart
ATR (len: 14, smooth: SMA)
ATR based Stop-Loss, if hit trade will be closed and considered as loss
ATR based Take-Profit, if hit trade will be closed and considered as win
On TP or SL hit the trade is closed and marked as win/loss
The MATRIX: Ultimate Crypto Position StrategyHi all,
We are cryptocurrency miners and 'hodlers’ since 2013, with unwavering confidence in the technology behind it. We’d always thought that it would be a life-changing êvent. And we were right. We went from “broke” to making shit loads of money and all the way back to bitter nothing. If you are lucky, you probably haven’t experienced what if feels to be high on cash and then fall very deep low, but let me reassure you, it is a nasty feeling.
Then we wondered, what the hell did we do wrong? Or better say, what didn’t we do right! The answer was dead simple: We had no experience in trading, we were overwhelmed by emotions and we didn't use any trading strategy. Hence, we were doomed to fail from the beginning.
In order to build an all-in-one profitable trading strategy, we had to start from zero. The one thing we learned is that your goal for financial gain cannot be achieved without discipline and consistency. Our prime focus was to absorb as much info as possible regarding trading and coding by doing an extensive self-study, which consequentially took us to the next level.
One of the secrets to being successful from a trading perspective is to have an indefatigable and undying thirst for information and knowledge. As Bruce Lee once said: “Learning is never cumulative; it is a movement of knowing which has no beginning nor end”. So, we adapted what was useful, rejected what was useless, and added our own preferences based on our mindset. We were totally committed to be the best. Our goal was never to lose money again! Of course, this is an illusion, as no single strategy is correct all of the time.
Therefore, the final trading strategy was based on the following key elements:
• The avoidance of risk is more important than absolute profit. Do not anticipate and do not move without market confirmation. Being a little late in your trade is your indication if you are right or wrong.
• Offering simplicity and practicality, for those that do not have the time to trade 24/7.
• Believe in analysis and not in forecasting. Trading is a skill for those who are smart and gambling for those who are not.
In conclusion, we are absolutely thrilled to finally release this trading strategy after one year of extensive back testing and optimization. The script was supposed to be for personal use only, but because Tradingview has helped us a lot in this process, we want to share it with all of you and give something back to this amazing community. If you learned something new today and found value, please give us a like to show your support! We’d really appreciate it.
***The script is invite-only, message us to get script access***
-------------------------------------------------------------------------------------------------
The MATRIX: Ultimate Crypto Position Strategy should be used as follows:
• The trading strategy was designed and optimized for trading cryptocurrencies only ; furthermore it works best on established high market cap cryptocurrencies that have a clear trend such as:
BTCUSD
ETHUSD
LTCUSD
XRMUSD
EOSUSD
ADAUSD
DASHUSD
ETCUSD
• The trading strategy is based on swing/position methodology. The script must therefore be used on daily timeframe candles only (1D) .
• Use USD trading pairs only (e.g. use ETHUSD instead of the ETHBTC) since the individual trend is captured more effectively and therefore gives better results.
-------------------------------------------------------------------------------------------------
The MATRIX:Ultimate Crypto Position Strategy is based on the following indicators:
• Ichimoku Cloud ; acts as the leading indicator.
• Volume ; without strong volume , a market move is not valid.
• MACD and Vortex ; both being used as confirmation indicators.
• Choppiness index ; avoids trading in choppy markets.
• Bullish/ Bearish Regular Divergences in combination with RSI to spot tops and bottoms.
• Simple and Exponential Moving Averages ; prêvents trading against the trend.
The trading strategy is easy to use, trend based and without repainting, meaning once a signal has been made it is permanent and that no future data is used in the decision making. It detects the trend and filters out market noise based on more than 10 technical indicators. ONLY when all indicators align with each other the algorithm prints a BUY or SELL signal. The trading strategy provides high probability trading signals and minimizes risk! This script aims to capture the profit from longer term trending moves and by doing so filters out non-substantial trends and avoids the associated risks with these trades.
-------------------------------------------------------------------------------------------------
The MATRIX: Ultimate Crypto Position Strategy has the following features:
• Automatically generated Buy / Sell alerts in the form of a label.
• NO Repaint once candle is closed.
• SAFEGUARD ; custom built-in security prevẹnts trading when the price is out of equilibrium.
• Customizable Display for the Ichimoku cloud indicator display.
-------------------------------------------------------------------------------------------------
Below are the backtest results. Keep in mind that this strategy is quite conservative resulting in few long positions. These results are therefore no guarantee for the future.
Back test results: (only Long trades, signal to signal, order size: 100% of equity, commision fee 0.1%, period: start of chart)
Exchange-----Asset---------Timeframe---Percent Profitable----Profit Factor-----Total Trades----Max Drawdown---Average bars in trade-----Net Profit
Coinbase-----BTC/USD---------1D----------------100----------------N/A------------------10---------------0.00---------------------54-------------------6183.6
Coinbase-----ETH/USD---------1D----------------100----------------N/A------------------7----------------0.00---------------------46-------------------11673.0
Coinbase-----LTC/USD---------1D-----------------100---------------N/A-------------------7----------------0.00---------------------46------------------4727.0
Bínance------EOS/USD---------1D-----------------100---------------N/A-------------------3----------------0.00---------------------34------------------42.8
Bínance------ADA/USD---------1D-----------------100---------------N/A-------------------2----------------0.00---------------------40------------------118.4
Coinbase-----XTZ/USD---------1D-----------------100---------------N/A-------------------1----------------0.00---------------------36------------------34.4
Bínance------BNB/USD---------1D-----------------66.7--------------10.8-------------------6---------------24.22--------------------38------------------1488.8
Bínance------ETC/USD---------1D-----------------100---------------N/A-------------------2----------------0.00---------------------33------------------94.9
Bínance------XMR/USD---------1D-----------------100---------------N/A-------------------3----------------0.00---------------------43------------------74.2
Bínance------ICX/USD----------1D-----------------100---------------N/A-------------------2----------------0.00---------------------29------------------215.3
-------------------------------------------------------------------------------------------------
Reminder: Use this trading strategy at your own risk and trade responsibly. We are not responsible for any financial loss using this strategy.
***The script is invite-only, message us to get script access***

888 BOT #backtest█ 888 BOT #backtest
This is an Expert Advisor 'EA' or Automated trading script for ‘longs’ and ‘shorts’, which uses only a Take Profit or, in the worst case, a Stop Loss to close the trade.
It's a much improved version of the previous ‘Repanocha’. It doesn`t use 'Trailing Stop' or 'security()' functions (although using a security function doesn`t mean that the script repaints) and all signals are confirmed, therefore the script doesn`t repaint in alert mode and is accurate in backtest mode.
Apart from the previous indicators, some more and other functions have been added for Stop-Loss, re-entry and leverage.
It uses 8 indicators, (many of you already know what they are, but in case there is someone new), these are the following:
1. Jurik Moving Average
It's a moving average created by Mark Jurik for professionals which eliminates the 'lag' or delay of the signal. It's better than other moving averages like EMA, DEMA, AMA or T3.
There are two ways to decrease noise using JMA. Increasing the 'LENGTH' parameter will cause JMA to move more slowly and therefore reduce noise at the expense of adding 'lag'
The 'JMA LENGTH', 'PHASE' and 'POWER' parameters offer a way to select the optimal balance between 'lag' and over boost.
Green: Bullish, Red: Bearish.
2. Range filter
Created by Donovan Wall, its function is to filter or eliminate noise and to better determine the price trend in the short term.
First, a uniform average price range 'SAMPLING PERIOD' is calculated for the filter base and multiplied by a specific quantity 'RANGE MULTIPLIER'.
The filter is then calculated by adjusting price movements that do not exceed the specified range.
Finally, the target ranges are plotted to show the prices that will trigger the filter movement.
Green: Bullish, Red: Bearish.
3. Average Directional Index (ADX Classic) and (ADX Masanakamura)
It's an indicator designed by Welles Wilder to measure the strength and direction of the market trend. The price movement is strong when the ADX has a positive slope and is above a certain minimum level 'ADX THRESHOLD' and for a given period 'ADX LENGTH'.
The green color of the bars indicates that the trend is bullish and that the ADX is above the level established by the threshold.
The red color of the bars indicates that the trend is down and that the ADX is above the threshold level.
The orange color of the bars indicates that the price is not strong and will surely lateralize.
You can choose between the classic option and the one created by a certain 'Masanakamura'. The main difference between the two is that in the first it uses RMA () and in the second SMA () in its calculation.
4. Parabolic SAR
This indicator, also created by Welles Wilder, places points that help define a trend. The Parabolic SAR can follow the price above or below, the peculiarity that it offers is that when the price touches the indicator, it jumps to the other side of the price (if the Parabolic SAR was below the price it jumps up and vice versa) to a distance predetermined by the indicator. At this time the indicator continues to follow the price, reducing the distance with each candle until it is finally touched again by the price and the process starts again. This procedure explains the name of the indicator: the Parabolic SAR follows the price generating a characteristic parabolic shape, when the price touches it, stops and turns (SAR is the acronym for 'stop and reverse'), giving rise to a new cycle. When the points are below the price, the trend is up, while the points above the price indicate a downward trend.
5. RSI with Volume
This indicator was created by LazyBear from the popular RSI.
The RSI is an oscillator-type indicator used in technical analysis and also created by Welles Wilder that shows the strength of the price by comparing individual movements up or down in successive closing prices.
LazyBear added a volume parameter that makes it more accurate to the market movement.
A good way to use RSI is by considering the 50 'RSI CENTER LINE' centerline. When the oscillator is above, the trend is bullish and when it is below, the trend is bearish.
6. Moving Average Convergence Divergence (MACD) and (MAC-Z)
It was created by Gerald Appel. Subsequently, the histogram was added to anticipate the crossing of MA. Broadly speaking, we can say that the MACD is an oscillator consisting of two moving averages that rotate around the zero line. The MACD line is the difference between a short moving average 'MACD FAST MA LENGTH' and a long moving average 'MACD SLOW MA LENGTH'. It's an indicator that allows us to have a reference on the trend of the asset on which it is operating, thus generating market entry and exit signals.
We can talk about a bull market when the MACD histogram is above the zero line, along with the signal line, while we are talking about a bear market when the MACD histogram is below the zero line.
There is the option of using the MAC-Z indicator created by LazyBear, which according to its author is more effective, by using the parameter VWAP (volume weighted average price) 'Z-VWAP LENGTH' together with a standard deviation 'STDEV LENGTH' in its calculation.
7. Volume Condition
Volume indicates the number of participants in this war between bulls and bears, the more volume the more likely the price will move in favor of the trend. A low trading volume indicates a lower number of participants and interest in the instrument in question. Low volumes may reveal weakness behind a price movement.
With this condition, those signals whose volume is less than the volume SMA for a period 'SMA VOLUME LENGTH' multiplied by a factor 'VOLUME FACTOR' are filtered. In addition, it determines the leverage used, the more volume, the more participants, the more probability that the price will move in our favor, that is, we can use more leverage. The leverage in this script is determined by how many times the volume is above the SMA line.
The maximum leverage is 8.
8. Bollinger Bands
This indicator was created by John Bollinger and consists of three bands that are drawn superimposed on the price evolution graph.
The central band is a moving average, normally a simple moving average calculated with 20 periods is used. ('BB LENGTH' Number of periods of the moving average)
The upper band is calculated by adding the value of the simple moving average X times the standard deviation of the moving average. ('BB MULTIPLIER' Number of times the standard deviation of the moving average)
The lower band is calculated by subtracting the simple moving average X times the standard deviation of the moving average.
the band between the upper and lower bands contains, statistically, almost 90% of the possible price variations, which means that any movement of the price outside the bands has special relevance.
In practical terms, Bollinger bands behave as if they were an elastic band so that, if the price touches them, it has a high probability of bouncing.
Sometimes, after the entry order is filled, the price is returned to the opposite side. If price touch the Bollinger band in the same previous conditions, another order is filled in the same direction of the position to improve the average entry price, (% MINIMUM BETTER PRICE ': Minimum price for the re-entry to be executed and that is better than the price of the previous position in a given %) in this way we give the trade a chance that the Take Profit is executed before. The downside is that the position is doubled in size. 'ACTIVATE DIVIDE TP': Divide the size of the TP in half. More probability of the trade closing but less profit.
█ STOP LOSS and RISK MANAGEMENT.
A good risk management is what can make your equity go up or be liquidated.
The % risk is the percentage of our capital that we are willing to lose by operation. This is recommended to be between 1-5%.
% Risk: (% Stop Loss x % Equity per trade x Leverage) / 100
First the strategy is calculated with Stop Loss, then the risk per operation is determined and from there, the amount per operation is calculated and not vice versa.
In this script you can use a normal Stop Loss or one according to the ATR. Also activate the option to trigger it earlier if the risk percentage is reached. '% RISK ALLOWED'
'STOP LOSS CONFIRMED': The Stop Loss is only activated if the closing of the previous bar is in the loss limit condition. It's useful to prevent the SL from triggering when they do a ‘pump’ to sweep Stops and then return the price to the previous state.
█ BACKTEST
The objective of the Backtest is to evaluate the effectiveness of our strategy. A good Backtest is determined by some parameters such as:
- RECOVERY FACTOR: It consists of dividing the 'net profit' by the 'drawdown’. An excellent trading system has a recovery factor of 10 or more; that is, it generates 10 times more net profit than drawdown.
- PROFIT FACTOR: The ‘Profit Factor’ is another popular measure of system performance. It's as simple as dividing what win trades earn by what loser trades lose. If the strategy is profitable then by definition the 'Profit Factor' is going to be greater than 1. Strategies that are not profitable produce profit factors less than one. A good system has a profit factor of 2 or more. The good thing about the ‘Profit Factor’ is that it tells us what we are going to earn for each dollar we lose. A profit factor of 2.5 tells us that for every dollar we lose operating we will earn 2.5.
- SHARPE: (Return system - Return without risk) / Deviation of returns.
When the variations of gains and losses are very high, the deviation is very high and that leads to a very poor ‘Sharpe’ ratio. If the operations are very close to the average (little deviation) the result is a fairly high 'Sharpe' ratio. If a strategy has a 'Sharpe' ratio greater than 1 it is a good strategy. If it has a 'Sharpe' ratio greater than 2, it is excellent. If it has a ‘Sharpe’ ratio less than 1 then we don't know if it is good or bad, we have to look at other parameters.
- MATHEMATICAL EXPECTATION: (% winning trades X average profit) + (% losing trades X average loss).
To earn money with a Trading system, it is not necessary to win all the operations, what is really important is the final result of the operation. A Trading system has to have positive mathematical expectation as is the case with this script: ME = (0.87 x 30.74$) - (0.13 x 56.16$) = (26.74 - 7.30) = 19.44$ > 0
The game of roulette, for example, has negative mathematical expectation for the player, it can have positive winning streaks, but in the long term, if you continue playing you will end up losing, and casinos know this very well.
PARAMETERS
'BACKTEST DAYS': Number of days back of historical data for the calculation of the Backtest.
'ENTRY TYPE': For '% EQUITY' if you have $ 10,000 of capital and select 7.5%, for example, your entry would be $ 750 without leverage. If you select CONTRACTS for the 'BTCUSDT' pair, for example, it would be the amount in 'Bitcoins' and if you select 'CASH' it would be the amount in $ dollars.
'QUANTITY (LEVERAGE 1X)': The amount for an entry with X1 leverage according to the previous section.
'MAXIMUM LEVERAGE': It's the maximum allowed multiplier of the quantity entered in the previous section according to the volume condition.
The settings are for Bitcoin at Binance Futures (BTC: USDTPERP) in 30 minutes.
For other pairs and other timeframes, the settings have to be adjusted again. And within a month, the settings will be different because we all know the market and the trend are changing.
█ 888 BOT (SPANISH)
Este es un Expert Advisor 'EA' o script de trading automatizado para ‘longs’ y ‘shorts’, el cual, utiliza solo un Take Profit o, en el peor de los casos, un Stop Loss para cerrar el trade.
Es una versión muy mejorada del anterior ‘Repanocha’. No utiliza ‘Trailing Stop’, ni funciones ‘security()’ (aunque usar una función security no significa que el script repinte) y todas las señales son confirmadas, por consiguiente, el script no repinta en modo alertas y es preciso en en el modo backtest.
Aparte de los anteriores indicadores se han añadido algunos más y otras funciones para Stop-Loss, de re-entrada y apalancamiento.
Utiliza 8 indicadores, (muchos ya sabéis sobradamente lo que son, pero por si hay alguien nuevo), son los siguientes:
1. Jurik Moving Average
Es una media móvil creada por Mark Jurik para profesionales la cual elimina el ‘lag’ o retardo de la señal. Es mejor que otras medias móviles como la EMA, DEMA, AMA o T3.
Hay dos formas de disminuir el ruido utilizando JMA. El aumento del parámetro 'LENGTH' hará que JMA se mueva más lentamente y, por lo tanto, reducirá el ruido a expensas de añadir ‘lag’
Los parámetros 'JMA LENGTH', 'PHASE' y 'POWER' ofrecen una forma de seleccionar el equilibrio óptimo entre ‘lag’ y sobre impulso.
Verde : Alcista, Rojo: Bajista.
2. Range filter
Creado por Donovan Wall, su función es la de filtrar o eliminar el ruido y poder determinar mejor la tendencia del precio a corto plazo.
Primero, se calcula un rango de precio promedio uniforme 'SAMPLING PERIOD' para la base del filtro y se multiplica por una cantidad específica 'RANGE MULTIPLIER'.
A continuación, el filtro se calcula ajustando los movimientos de precios que no exceden el rango especificado.
Por último, los rangos objetivo se trazan para mostrar los precios que activarán el movimiento del filtro.
Verde : Alcista, Rojo: Bajista.
3. Average Directional Index (ADX Classic) y (ADX Masanakamura)
Es un indicador diseñado por Welles Wilder para medir la fuerza y dirección de la tendencia del mercado. El movimiento del precio tiene fuerza cuando el ADX tiene pendiente positiva y está por encima de cierto nivel mínimo 'ADX THRESHOLD' y para un periodo dado 'ADX LENGTH'.
El color verde de las barras indica que la tendencia es alcista y que el ADX está por encima del nivel establecido por el threshold.
El color Rojo de las barras indica que la tendencia es bajista y que el ADX está por encima del nivel de threshold.
El color naranja de las barras indica que el precio no tiene fuerza y seguramente lateralizará.
Se puede elegir entre la opción clásica y la creada por un tal 'Masanakamura'. La diferencia principal entre los dos es que en el primero utiliza RMA() y en el segundo SMA() en su cálculo.
4. Parabolic SAR
Este indicador, creado también por Welles Wilder, coloca puntos que ayudan a definir una tendencia. El Parabolic SAR puede seguir al precio por encima o por debajo, la particularidad que ofrece es que cuando el precio toca al indicador, este salta al otro lado del precio (si el Parabolic SAR estaba por debajo del precio salta arriba y viceversa) a una distancia predeterminada por el indicador. En este momento el indicador vuelve a seguir al precio, reduciendo la distancia con cada vela hasta que finalmente es tocado otra vez por el precio y se vuelve a iniciar el proceso. Este procedimiento explica el nombre del indicador: el Parabolic SAR va siguiendo al precio generando una característica forma parabólica, cuando el precio lo toca, se para y da la vuelta (SAR son las siglas en inglés de ‘stop and reverse’), dando lugar a un nuevo ciclo. Cuando los puntos están por debajo del precio, la tendencia es alcista, mientras que los puntos por encima del precio indica una tendencia bajista.
5. RSI with Volume
Este indicador lo creo un tal LazyBear de TV a partir del popular RSI.
El RSI es un indicador tipo oscilador utilizado en análisis técnico y creado también por Welles Wilder que muestra la fuerza del precio mediante la comparación de los movimientos individuales al alza o a la baja de los sucesivos precios de cierre.
LazyBear le añadió un parámetro de volumen que lo hace más preciso al movimiento del mercado.
Una buena forma de usar el RSI es teniendo en cuenta la línea central de 50 'RSI CENTER LINE'. Cuando el oscilador está por encima, la tendencia es alcista y cuando está por debajo la tendencia es bajista.
6. Moving Average Convergence Divergence (MACD) y (MAC-Z)
Fue creado por Gerald Appel. Posteriormente se añadió el histograma para anticipar el cruce de medias. A grandes rasgos podemos decir que el MACD es un oscilador consistente en dos medias móviles que van girando en torno a la línea de cero. La línea del MACD no es más que la diferencia entre una media móvil corta 'MACD FAST MA LENGTH' y una media móvil larga 'MACD SLOW MA LENGTH'. Es un indicador que nos permite tener una referencia sobre la tendencia del activo sobre el cual se está operando, generando de este modo señales de entrada y salida del mercado.
Podemos hablar de mercado alcista cuando el histograma del MACD se sitúe por encima de la línea cero, junto con la línea de señal, mientras que hablaremos de mercado bajista cuando el histograma MACD se situará por debajo de la línea cero.
Está la opción de utilizar el indicador MAC-Z creado por LazyBear que según su autor es más eficaz, por utilizar el parámetro VWAP (precio medio ponderado por volumen) 'Z-VWAP LENGTH' junto con una desviación standard 'STDEV LENGTH' en su cálculo.
7. Volume Condition
El volumen indica el número de participantes en esta guerra entre toros y osos, cuanto más volumen más probabilidad de que se mueva el precio a favor de la tendencia. Un volumen bajo de negociación indica un menor número de participantes e interés por el instrumento en cuestión. Los bajos volúmenes pueden revelar debilidad detrás de un movimiento de precios.
Con esta condición se filtran aquellas señales cuyo volumen es inferior a la SMA de volumen para un periodo 'SMA VOLUME LENGTH' multiplicado por un factor 'VOLUME FACTOR'. Además, determina el apalancamiento utilizado, a más volumen, más participantes, más probabilidad de que se mueva el precio a nuestro favor, es decir, podemos utilizar más apalancamiento. El apalancamiento en este script lo determina las veces que está el volumen por encima de la línea de la SMA.
El apalancamiento máximo es de 8.
8. Bollinger Bands
Este indicador fue creado por John Bollinger y consiste en tres bandas que se dibujan superpuestas al gráfico de evolución del precio.
La banda central es una media móvil, normalmente se emplea una media móvil simple calculada con 20 períodos. ('BB LENGTH' Número de periodos de la media móvil)
La banda superior se calcula sumando al valor de la media móvil simple X veces la desviación típica de la media móvil. ('BB MULTIPLIER' Número de veces la desviación típica de la media móvil)
La banda inferior de calcula restando a la media móvil simple X veces la desviación típica de la media móvil.
la franja comprendida entre las bandas superior e inferior contiene, estadísticamente, casi un 90% de las posibles variaciones del precio, lo que significa que cualquier movimiento del precio fuera de las bandas tiene especial relevancia.
En términos prácticos, las bandas de Bollinger se comporta como si de una banda elástica se tratara de manera que, si el precio las toca, éste tiene mucha probabilidad de rebotar.
En ocasiones, después de rellenarse la orden de entrada, el precio se devuelve hacia el lado contrario. Si toca la banda de Bollinger se rellena otra orden en la misma dirección de la posición para mejorar el precio medio de entrada, (% MINIMUM BETTER PRICE': Precio mínimo para que se ejecute la re-entrada y que sea mejor que el precio de la posición anterior en un % dado) de esta manera damos una oportunidad al trade de que el Take Profit se ejecute antes. La desventaja es que se dobla el tamaño de la posición. 'ACTIVATE DIVIDE TP': Divide el tamaño del TP a la mitad. Más probabilidad de que se cierre el trade pero menos ganancias.
█ STOP LOSS y RISK MANAGEMENT.
Una buena gestión de las pérdidas o gestión del riesgo es lo que puede hacer que tu cuenta suba o se liquide en poco tiempo.
El % de riesgo es el porcentaje de nuestro capital que estamos dispuestos a perder por operación. Este se aconseja que debe estar comprendido entre un 1-5%.
% Risk = (% Stop Loss x % Equity per trade x Leverage) / 100
Primero se calcula la estrategia con Stop Loss, después se determina el riesgo por operación y a partir de ahí se calcula el monto por operación y no al revés.
En este script puedes usar un Stop Loss normal o uno según el ATR. También activar la opción de que salte antes si se alcanza el porcentaje de riesgo. '% RISK ALLOWED'
'STOP LOSS CONFIRMED': Solamente se activa el Stop Loss si el cierre de la barra anterior se encuentra en la condición de límite de pérdidas. Es útil para evitar que se dispare el SL cuando hacen un ‘pump’ para barrer Stops y luego se devuelve el precio a la normalidad.
█ BACKTEST
El objetivo del Backtest es evaluar la eficacia de nuestra estrategia. Un buen Backtest lo determinan algunos parámetros como son:
- RECOVERY FACTOR: Consiste en dividir el ‘beneficio neto’ entre el ‘drawdown’. Un excelente sistema de trading tiene un recovery factor de 10 o más; es decir, genera 10 veces más beneficio neto que drawdown.
- PROFIT FACTOR: El ‘Profit Factor’ es otra medida popular del rendimiento de un sistema. Es algo tan simple como dividir lo que ganan las operaciones con ganancias entre lo que pierden las operaciones con pérdidas. Si la estrategia es rentable entonces por definición el ‘Profit Factor’ va a ser mayor que 1. Las estrategias que no son rentables producen factores de beneficio menores que uno. Un buen sistema tiene un profit factor de 2 o más. Lo bueno del ‘Profit Factor’ es que nos dice lo que vamos a ganar por cada dolar que perdemos. Un profit factor de 2.5 nos dice que por cada dolar que perdamos operando vamos a ganar 2.5.
- SHARPE: (Retorno sistema – Retorno sin riesgo) / Desviación de los retornos.
Cuando las variaciones de ganancias y pérdidas son muy altas, la desviación es muy elevada y eso conlleva un ratio de ‘Sharpe’ muy pobre. Si las operaciones están muy cerca de la media (poca desviación) el resultado es un ratio de ‘Sharpe’ bastante elevado. Si una estrategia tiene un ratio de ‘Sharpe’ mayor que 1 es una buena estrategia. Si tiene un ratio de ‘Sharpe’ mayor que 2, es excelente. Si tiene un ratio de ‘Sharpe’ menor que 1 entonces no sabemos si es buena o mala, hay que mirar otros parámetros.
- MATHEMATICAL EXPECTATION:(% operaciones ganadoras X ganancia media) + (% operaciones perdedoras X pérdida media).
Para ganar dinero con un sistema de Trading, no es necesario ganar todas las operaciones, lo verdaderamente importante es el resultado final de la operativa. Un sistema de Trading tiene que tener esperanza matemática positiva como es el caso de este script.
El juego de la ruleta, por ejemplo, tiene esperanza matemática negativa para el jugador, puede tener rachas positivas de ganancias, pero a la larga, si se sigue jugando se acabará perdiendo, y esto los casinos lo saben muy bien.
PARAMETROS
'BACKTEST DAYS': Número de días atrás de datos históricos para el calculo del Backtest.
'ENTRY TYPE': Para % EQUITY si tienes 10000$ de capital y seleccionas 7.5% tu entrada sería de 750$ sin apalancamiento. Si seleccionas CONTRACTS para el par BTCUSDT sería la cantidad en Bitcoins y si seleccionas CASH sería la cantidad en dólares.
'QUANTITY (LEVERAGE 1X)': La cantidad para una entrada con apalancamiento X! según el apartado anterior.
'MAXIMUM LEVERAGE': Es el máximo multiplicador permitido de la cantidad introducida en el apartado anterior según la condición de volumen.
Los settings son para Bitcoin en Binance Futures (BTC:USDTPERP) en 30 minutos.
Para otro pares y otras temporalidades se tienen que ajustar las opciones de nuevo. Además para dentro de un mes, los ajustes serán otros distintos ya que el mercado y la tendencia es cambiante.

MARUSIA TRADING STRATEGIES [VCRYPTO]Description of MARUSIA TRADING STRATEGIES
«MARUSIA» is a compilation of several strategies.
You may choose the one which best suits your trading habit from options menu.
The strategies are based on indicator’s and bar’s closing level analysis on different timeframes.
At the time being there are 3 types of strategies for BTC on 1H and 3H tf.
+++ BTC 1H 90% Success +++ (Beginner)
Instrument - BTC, timeframe – 1H, exchange – Bitmex.
The advantage of the strategy is a high quantity of profitable trades (90% at the time of publishing).
The Trading View backtest results from 2019:
+ 303% net profit
+ 90% profitable trades
+ 6% drawback
+++ BTC 1H Mega Scalper +++ (Intermediate)
Instrument - BTC, timeframe – 1H, exchange – Bitmex.
The advantage of the strategy is more frequent trades with a good probability of success.
The Trading View backtest results from 2019:
+ 792% net profit
+ 64% profitable trades
+ 5% drawback
+++ BTC 3H Mega Scalper +++ (Expert)
Instrument - BTC, timeframe – 3H, exchange – Bitmex.
The advantage of the strategy is more frequent trades with a good probability of success.
The Trading View backtest results from 2018:
+ 1637% net profit
+ 79% profitable trades
+ 4,4% drawback
HOW TO USE
1. Choose the strategy from the strategy’s option menu on the chart. Pay attention to the instrument and timeframe you are using the selected strategy for.
2. Wait until you see green (above bar) or orange (below bar) label. To receive an alert when these labels (or signals) appear on the chart use ALERT INDICATOR for this strategy.
3. On the opening of the next bar enter the position if the label on the previous bar hasn’t disappeared. Green – for Buy, orange – for Sell. In this case you will see Buy/Sell signal on the chart.
4. Putting TRAILING STOPS
4.1. You should put a trailing stop when the price moves to profit up or down for 1% from your entry. For example, if you are long at 7255 USD and price moves up to 7328 USD (7255*1.01), put trailing stop with a trailing value 0,4% of your entry price, which is 29 USD (7255*0.004).
4.2. Every time when there is a long or short position, you may see a green info label with entry price, trail stop activation level and trail value. You may use this information instead of making a calculation by yourself. Only if your entry is the same as in the label.
5. Position closing maybe by reaching your trailing stop (in this case you may reenter the position on the next bar, if there is a signal label as per step 2 on the bar where your trailing stop is triggered) or when there is a signal for opposite direction.
6. If the signals appear differently than described as above, just refresh the website of Trading View. This happens because mostly take profits are shown only after the current bar is closed.
• The Buy/Sell signal label may move up or down on the bar with price’s movement. Don’t worry it doesn’t mean that your entry is changing.
• The lines on the chart are weekly price levels – the price levels of the previous week –
Green – open, Red – close, Blue – high, Brown – low, Black – hl2 (average of high and low). You may use them as support and resistance levels.
***
+ Trading View backtest results
+No repaint
+ Several strategies to choose which suits your trading habit
+Free testing
+Support with a call
Pm to get access to the strategy.
____________________________________________________________________________
Описание к стратегии "MARUSIA TRADING STRATEGIES "
Сборник нескольких стратегий серии "Marusia"
Выбор конкретной стратегии осуществляется из удобного меню
Основа наших стратегий - совмещение индикаторного анализа и анализа уровня закрытия свечей на разных временных интервалах (анализ уровней).
+++ BTC 1H 90% Success +++ (Beginner)
Стратегия работает на инструменте Bitcoin (BTC) по котировкам биржи BITMEX на 1 часовом таймфрейме (1H).
Основное преимущество данной стратегии - супервысокая успешность сделок (более 90% на момент публикации).
Данная стратегия представляет собой гибрид среднесрочных стратегий по частоте сделок (с 2019 по 12.04.2020 - 204 сделки, в среднем одна сделка раз в 2 дня) и элемент высокочастотных (скальп) стратегий - необходимо выставление использование скользящего стоп-приказа (trailing stop-loss), расчетные данные по которому появляются прямо на экране при открытии сделки.
Статистика по данной стратегии, подтвержденная бэктестом в Trading View
С 2019 года до момента публикации стратегии бектест показывает следующие данные:
+ 303% чистой прибыли
+ 90% успешных сделок
+ 6% макс. единовременная просадка
+++ BTC 1H Mega Scalper +++ (Intermediate)
Стратегия работает на инструменте Bitcoin (BTC) по котировкам биржи BITMEX на 1 часовом таймфрейме (1H)
Основное преимущество данной стратегии - высокочастотные сделки с хорошей вероятностью успеха.
С 2019 года до момента публикации стратегии бектест Trading View показывает следующие данные:
+ 792% чистой прибыли
+ 64% успешных сделок
+ 5% макс. единовременная просадка
+++ BTC 3H Mega Scalper +++ (Expert)
Стратегия работает на инструменте Bitcoin (BTC) по котировкам биржи BITMEX на 3 часовом таймфрейме (3H)
Основное преимущество данной стратегии - высокочастотные сделки с хорошей вероятностью успеха
С 2019 года до момента публикации стратегии бектест Trading View показывает следующие данные:
+ 1637% чистой прибыли
+ 79% успешных сделок
+ 4,4% макс. единовременная просадка
***
Инструкиция по использованию:
1. Вы открываете график с включенной стратегией. Обратите внимание на инструмент и таймфрейм стратегии.
2. Ожидаете появления на графике зеленого (снизу) или оранжевого (сверху) флажка.
Для получения уведомления появления значков (сигналов) используйте АЛЕРТНЫЙ ИНДИКАТОР для данной стратегии.
3. На открытии следующей свечи входите в сделку, если флажек из п.2 остался и не пропал (зеленый флажек - покупка, оранжевый - продажа)
4. Выставление trailing stop-loss
4.1 Trailing stop-loss выставляется, когда цена прошла 1% в профит от цены выхода в сделку (например: покупка 7255 и когда цена будет 7328 (7255*1,01) выставляется плавающий стоп-лосс (trailing stop-loss) в размере 0,4% от цены входа "29" (7255*0,004).
4.2. Как только будет закрыта свеча, на которой Вы вошли в сделку - вы увидете значения из п.4.1 на экране рядом с графиком (вы можете их использовать без самостоятельного расчета, но тогда есть риск, что если цена на свече входа достигнет значения из п. 4.1 - то сделка закроется, а вы это увидите только на следующей свече, когда значение цены может быть менее выгодное)
5. Выход из сделки осуществляется либо по trailing stop-loss (тогда вы можете перезайти в сделку на открытии следующей свечи, если на свече, на которой произошло закрытие по trailing stop-loss появились флажки из п.2), либо по появлению противоположного флажка, тогда вход в сделку, в соответствии с п. 2 и 3
7. Если Вы увидели, что сигналы отличаются от написанного в данной инструкции - просто обновите страницу с Trading View в браузере и все встанет на свои места.
* На свече захода в сделку сигнал "buy/sell" может "плавать" по свече, но если Вы выполнили п.1-3 Вам неочем беспокоиться. Не обращайте на него внимание.
***
Основные отличия от стратегий наших коллег:
+ Результаты бэктеста в платформе Trading View – прозрачная статистика по сделкам, которую вы можете посмотреть самостоятельно
+ Построен на принципах non-repaint basis – сигналы не исчезают (при правильном соблюдении инструкции по использованию)
+ Каждая стратегия серии построена на своем уникальном принципе - вы можете выбрать для себя оптимальный набор стратегий
+ Бесплатный тестовый период
+ Поддержка с возможностью организации телефонного звонка
Для предоставления доступа к данной стратегии - пожалуйста пишите в личные сообщения. Мы быстро с Вами свяжемся.
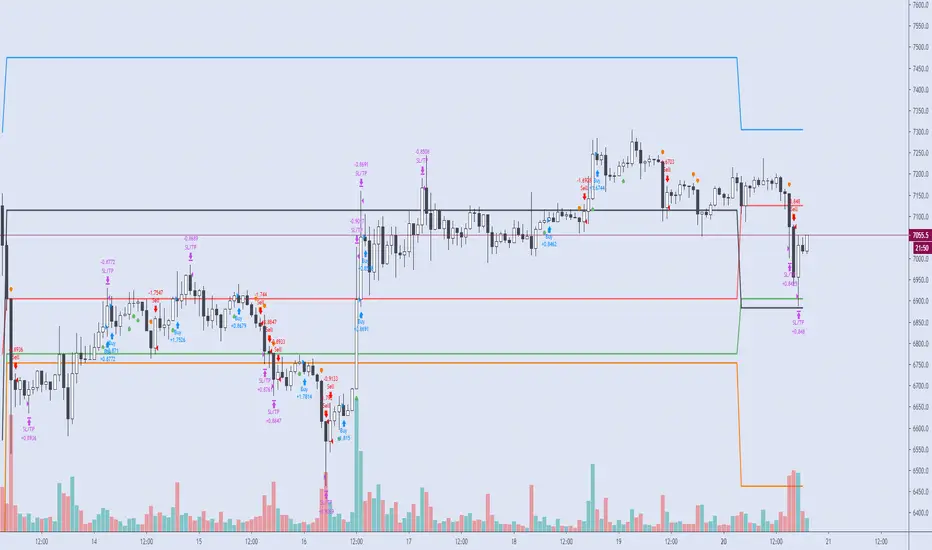
VITALIY ETHEREUM 3H STRATEGY [VCRYPTO]DESCRIPTION OF VITALIY ETH 3H STRATEGY
This strategy is made for trading ETHEREUM ( ETH ) using data from BITMEX exchange on 3 hour timeframe.
There is also a special indicator for the strategy to receive alerts on your tradingview platform which is very handful to enter the market as soon as there is a buy/sell signal.
Strategy is based on Pine script v.4 and it uses several indicators and oscillators to generate a buy/sell signal for ETH .
There is no repaint, which means that a signal will not disappear when price goes in wrong direction. I.e when a signal is generated, it
will be listed in trade history after bar's close and wont be changed.
And this is one of the advantages of the strategy over other 90% strategies.
The profitability curve of the strategy also has a stable growth, which means that the strategy is profitable at any phase the market,
not only at any particalar moment.
The strategy is a SWING strategy, which means that a signal for opening a position (buy or sell) at the same time closes previous position.
Because of its specificity the strategy doesn’t have take profit/stop loss options and it is not recommended to use leverage.
Your risc is limited by time interval from opening one position and opening another one when the price reverses.
The strategy has a backtest statistics on TradingView. 2018 – 141%, 2019 – 171%, until Apr. 6th, 2020 – 103%, from 2018 till Apr. 6th, 2020 - 417% of net profit
Max drawdown (the sum of non-profitable trades until receiving a profitable trade) during a year not more than 12.44%.
The strategy is published for testing and will be free to use during this period of time.
To get access to the strategy after testing finishes write in comments and pm me.
______________________________________________________________________________________________________________________
ОПИСАНИЕ VITALIY ETH 3H STRATEGY
Стратегия работает на инструменте Ethereum (ETH) по котировкам биржи BITMEX на 3 часовом таймфрейме (3H), а также имеет удобные алерты для сигналов на покупку/продажу.
Это позволит Вам заниматься своими делами, не следя за тем, что происходит на рынке, но в нужное время совершить сделку, получив предупреждение на телефон / компьютер.
Стратегия построена на последней версии Pine Script, в ее основе лежит совокупность множества индикаторов и правил, которые в определенный момент дают сигнал на покупку или продажу ETH. Стратегия основана на "non-repaint" базисе, таким образом, если стратегия показала вход в сделку (по итогу закрытия свечи) - то данная сделка так и остается без изменений и записывается в историю сделок. Это выгодно отличает данную стратегию от 90% таковых в Trading View и дает уверенность, что появившийся сигнал на сделку не исчезнет в случае, если рынок пойдет в противоположную сторону. Данный фактор означает, что статистика по данной стратегии не будет "нарисована", как в большинстве других стратегий. Также, не маловажным фактором является поступательная кривая доходности, что означает, что стратегия будет зарабатывать на всех фазах рынка, а не только в определенный момент времени.
Данная стратегия относится к сегменту SWING стратегий, когда один сигнал является одновременно закрытием одной сделки и открытием противоположной.
В связи со спецификой стратегии она не использует стоп-ордера, поэтому предполагает торговлю строго без плечей. Если вы хотите снизить риск по данной стратегии, то можете заходить в сделки пониженным объемом средств.
Ваш риск ограничен временным интервалом от момента, как цена пошла в противоположную сторону, до момента пока стратегия не дала сигнал на перекладку в новую сделку.
Статистика, подтвержденная бэктестом в Trading View, за последние пару лет: 2018 - 141%, 2019 - 171%, на 06.04.2020 - 103%, с 2018 по 06.04.2020 - 417%. Это данные по Чистой прибыли на вложенный капитал. Максимальная просадка ("Max drawdown" по данным Trading View) за период с 2018 по 06.04.2020 не превысила 12,44%
Для предоставления доступа к данной стратегии - пожалуйста пишите в комментариях запрос с копией в личные сообщения. Мы быстро с Вами свяжемся.