SRD
SRD v11 - Multi-Timeframe Volume Profile (POC, VAH, VAL)
Key Features
Dual Timeframe Analysis:
📈 Main Analysis (Daily): Calculates and displays the most significant levels based on a user-defined period of daily bars. This is ideal for identifying intraday and short-term trading opportunities.
📊 Strategic Analysis (Weekly): Plots key levels from a weekly perspective, giving you a broader, long-term view of market sentiment and structure. This can be toggled on or off.
Volume Profile Core Levels: The indicator automatically calculates and visualizes the three most important levels derived from volume analysis for both timeframes:
🎯 POC (Point of Control): The price level with the highest traded volume for the specified period. It acts as a powerful magnet for price and a key reference for market equilibrium.
🔴 VAH (Value Area High): The highest price level within the "Value Area" (where ~70% of the volume was traded). It often acts as a significant resistance zone.
🟢 VAL (Value Area Low): The lowest price level within the Value Area. It often serves as a strong support zone.
🟠 24-Hour High: An optional feature that plots the highest price reached in the last 24 hours, providing a crucial reference point for breakout and reversal traders.
Dynamic and Non-Repainting: The levels are calculated based on historical confirmed bars and update automatically as new periods (daily or weekly) close. The lines extend to the right, remaining relevant until a new calculation period begins.
Integrated Alert System: Never miss a key price interaction. The indicator includes a comprehensive alert system for:
Breakouts: Triggers when the price crosses above or below the POC, VAH, or VAL.
Touches: Triggers when the price touches one of these key levels without breaking through it (within a small tolerance).
Unified Alert: A single alert that notifies you of any of the above conditions.
Customization
The SRD v11 is fully customizable to fit your trading style. You can adjust:
Timeframes: Change the base timeframes for both the main (default Daily) and strategic (default Weekly) analysis.
Analysis Periods: Define the number of bars (days or weeks) to include in the Volume Profile calculation.
Visuals: Customize the color, width, and style (solid, dashed, dotted) of every line and label for clear and intuitive visualization.
Toggle Elements: Easily show or hide the strategic (weekly) analysis and the 24-hour high line.
How to Use It >
Identify Key Zones: Use the VAH (resistance) and VAL (support) lines to identify potential entry and exit zones. The area between VAH and VAL is the "Value Area," where the market has found acceptance.
Monitor the POC: The Point of Control is the ultimate level of equilibrium. Watch for price reactions around the POC. A sustained break above or below can signal a new trend.
Combine Timeframes: Use the strategic (weekly) levels as major, long-term points of interest and the main (daily) levels for your day-to-day trading setup. Confluence between levels from different timeframes can indicate extremely strong support or resistance.
Set Alerts: Configure alerts for breakouts or touches to be notified of critical market movements in real-time, even when you are away from the charts.
"point of control" için komut dosyalarını ara

X rVPoCOverview
The rVPoC indicator isolates and displays the Volume Point of Control — the price level within a chosen lookback window that has accumulated the highest traded volume.
Unlike typical volume profiles that analyze an entire session or day, this version is designed for rolling intraday precision. It continually updates the VPoC using data from a lower “zoomed-in” timeframe (e.g., 1-minute) to refine accuracy, even when viewed on higher-timeframe charts.
How It Works
At its core, the indicator “zooms in” via Pine Script’s multi-timeframe engine:
Lower timeframe aggregation:
A secondary (zoomed) timeframe — by default 1-minute — is used to pull detailed OHLCV data through request.security().
Rolling window analysis:
The user-defined bars_per_current parameter determines how many of those lower-timeframe bars to include (e.g., 15 → a 15-minute rolling window).
Volume binning:
The high-to-low range of that window is divided into evenly spaced price bins (vp_price_levels). Each bin accumulates the volume of trades overlapping its range.
Point of Control selection:
The bin with the greatest accumulated volume is located, and its volume-weighted midpoint is plotted as the VPoC.
Visual output:
Discrete line-break markers are plotted for each bar, preventing the “connecting line” distortions common in continuous plots.
Use Case
This indicator is ideal for intraday traders who want to:
Track how the most active traded price shifts over time.
Identify short-term value zones forming within a 15-minute (or custom) rolling range.
Observe micro-structure behavior during developing sessions without committing to full volume profile tools.
Overlay a lightweight VPoC on top of other tools such as open-range or VWAP-based frameworks.
It is particularly effective on 1-minute and 5-minute charts, providing a granular yet efficient measure of volume concentration that updates bar-by-bar.
Summary
The VPoC indicator delivers a continuously updating micro-profile of where trading volume is most active within a chosen intraday window.
It’s designed to complement range, VWAP, and order-flow analysis by highlighting evolving value zones without visual clutter or session-anchoring logic.
Traders can interpret shifts in the VPoC as changes in short-term control — where buyers or sellers are concentrating their activity within the evolving price structure.

Trend Pivots Profile [BigBeluga]🔵 OVERVIEW
The Trend Pivots Profile is a dynamic volume profile tool that builds profiles around pivot points to reveal where liquidity accumulates during trend shifts. When the market is in an uptrend , the indicator generates profiles at low pivots . In a downtrend , it builds them at high pivots . Each profile is constructed using lower timeframe volume data for higher resolution, making it highly precise even in limited space. A colored trendline helps traders instantly recognize the prevailing trend and anticipate which type of profile (bullish or bearish) will form.
🔵 CONCEPTS
Pivot-Driven Profiles : Profiles are only created when a new pivot forms, aligning liquidity analysis with market structure shifts.
Trend-Contextual : Profiles form at low pivots in uptrends and at high pivots in downtrends.
Lower Timeframe Data : Volume and close values are pulled from smaller timeframes to provide detailed, high-resolution profiles inside larger pivot windows.
Adaptive Bin Sizing : Bin size is automatically calculated relative to ATR, ensuring consistent precision across different markets and volatility conditions.
Point of Control (PoC) : The highest-volume level within each profile is marked with a PoC line that extends until the next pivot forms.
Trendline Visualization : A wide, semi-transparent line follows the rolling average of highs and lows, colored blue in uptrends and orange in downtrends.
🔵 FEATURES
Pivot Length Control : Adjust how far back the script looks to detect pivots (e.g., length 5 → profiles cover 10 bars after pivot).
Pivot Profile toggle :
On → draw the filled pivot profile + PoC + pivot label.
Off → hide profiles; show only PoC level (clean S/R mode).
Trend Length Filter : Smooths trendline detection to ensure reliable up/down bias.
Precise Volume Distribution : Volume is aggregated into bins, creating a smooth volume curve around the pivot range.
PoC Extension : Automatically extends the most active price level until a new pivot is confirmed.
Profile Visualization : Profiles appear as filled shapes anchored at the pivot candle, colored based on trend.
Trendline Overlay : Thick, semi-transparent trendline provides visual guidance on directional bias.
Automatic Cleanup : Old profiles are deleted once they exceed the chart’s capacity (default 25 stored profiles).
🔵 HOW TO USE
Spotting Trend Liquidity : In an uptrend, monitor profiles at low pivots to see where buyers concentrated. In downtrends, use high-pivot profiles to spot sell-side pressure.
Watch the PoC : The PoC line highlights the strongest traded level of the pivot structure—expect reactions when price retests it.
Anticipate Trend Continuation/Reversal : Use the trendline (blue = bullish, orange = bearish) together with pivot profiles to forecast directional momentum.
Combine with HTF Context : Overlay with higher timeframe structure (order blocks, liquidity zones, or FVGs) for confluence.
Fine-Tune with Inputs : Adjust Pivot Length for sensitivity and Trend Length for smoother or faster trend shifts.
🔵 CONCLUSION
The Trend Pivots Profile blends pivot-based structure with precise volume profiling. By dynamically plotting profiles on pivots aligned with the prevailing trend, highlighting PoCs, and overlaying a directional trendline, it equips traders with a clear view of liquidity clusters and directional momentum—ideal for anticipating reactions, pullbacks, or breakouts.

Quadro Volume Profile [BigBeluga]🔵 OVERVIEW
The Quadro Volume Profile is a precision-engineered volume profiling tool that segments market activity into four distinct quadrants surrounding the current price. By separating bullish and bearish volume above and below the current price, it helps traders identify dominant forces and high-interest price zones with ease. Each quadrant includes label annotations showing total volume and its share of overall activity — delivering powerful insights into the market’s internal structure.
🔵 CONCEPTS
Four-Quadrant Volume Distribution : Volume is separated into Buy and Sell profiles both above and below the current price.
Directional Volume Logic : Bullish and bearish candle volume is allocated to specific bins, creating color-coded volume stacks.
Dynamic PoC Detection : Point of Control (PoC) levels are calculated per quadrant and optionally displayed.
Lookback-Based Anchoring : The volume histogram is anchored to a fixed lookback window, ensuring consistency and historical context.
Label-Based Analytics : Each quadrant displays a labeled breakdown of direction, total volume, and percentage weight of total activity.
🔵 FEATURES
Four separate volume profiles:
Upper Left: Bearish volume (Sell Quad above price)
Upper Right: Bullish volume (Buy Quad above price)
Lower Left: Bullish volume (Buy Quad below price)
Lower Right: Bearish volume (Sell Quad below price)
Live Labels for Each Quad:
Displays BUY or SELL direction
Shows total volume per quadrant (e.g. 607.49K)
Displays percent share of total quad volume (e.g. 18.87%)
Toggle visibility for each profile and each Point of Control (PoC) dashed PoC lines with volume annotations
Adjustable calculation period (lookBack), number of bins, and horizontal offset
Color gradient intensity represents volume strength per bin
Auto-cleaning visuals to keep the chart uncluttered
Gradient color control for Buy and Sell volumes
Clean midline split between upper and lower quadrants
🔵 HOW TO USE
Select your desired calculation period (default: 200 bars) to define the range for volume analysis.
Adjust the bins parameter for more or less resolution in volume distribution.
Toggle each quadrant on/off depending on your preference using the settings panel:
“Upper Sell Quad” – shows bearish volume above current price (left)
“Upper Buy Quad” – shows bullish volume above current price (right)
“Lower Buy Quad” – shows bullish volume below current price (left)
“Lower Sell Quad” – shows bearish volume below current price (right)
Enable or disable PoC lines for each quad to highlight where volume peaked.
Use the gradient coloring to identify volume imbalances — sharp differences between opposing quads often indicate key zones of rejection or breakout.
Monitor the midline level which splits the four quadrants — it serves as a psychological pivot zone.
🔵 CONCLUSION
The Quadro Volume Profile offers a powerful and visually intuitive way to dissect market activity around price. By splitting volume into four quadrants, traders can better interpret order flow, identify dominant volume zones, and spot potential reversals or continuation setups. Whether you're trading breakouts, liquidity sweeps, or range-bound behavior — this tool adds a structured layer of volume context to your charting workflow.

Composite Time ProfileComposite Time Profile Overlay (CTPO) - Market Profile Compositing Tool
Automatically composite multiple time periods to identify key areas of balance and market structure
What is the Composite Time Profile Overlay?
The Composite Time Profile Overlay (CTPO) is a Pine Script indicator that automatically composites multiple time periods to identify key areas of balance and market structure. It's designed for traders who use market profile concepts and need to quickly identify where price is likely to find support or resistance.
The indicator analyzes TPO (Time Price Opportunity) data across different timeframes and merges overlapping profiles to create composite levels that represent the most significant areas of balance. This helps you spot where institutional traders are likely to make decisions based on accumulated price action.
Why Use CTPO for Market Profile Trading?
Eliminate Manual Compositing Work
Instead of manually drawing and compositing profiles across different timeframes, CTPO does this automatically. You get instant access to composite levels without spending time analyzing each individual period.
Spot Areas of Balance Quickly
The indicator highlights the most significant areas of balance by compositing overlapping profiles. These areas often act as support and resistance levels because they represent where the most trading activity occurred across multiple time periods.
Focus on What Matters
Rather than getting lost in individual session profiles, CTPO shows you the composite levels that have been validated across multiple timeframes. This helps you focus on the levels that are most likely to hold.
How CTPO Works for Market Profile Traders
Automatic Profile Compositing
CTPO uses a proprietary algorithm that:
- Identifies period boundaries based on your selected timeframe (sessions, daily, weekly, monthly, or auto-detection)
- Calculates TPO profiles for each period using the C2M (Composite 2 Method) row sizing calculation
- Merges overlapping profiles using configurable overlap thresholds (default 50% overlap required)
- Updates composite levels as new price action develops in real-time
Key Levels for Market Profile Analysis
The indicator displays:
- Value Area High (VAH) and Value Area Low (VAL) levels calculated from composite TPO data
- Point of Control (POC) levels where most trading occurred across all composited periods
- Composite zones representing areas of balance with configurable transparency
- 1.618 Fibonacci extensions for breakout targets based on composite range
Multiple Timeframe Support
- Sessions: For intraday market profile analysis
- Daily: For swing trading with daily profiles
- Weekly: For position trading with weekly structure
- Monthly: For long-term market profile analysis
- Auto: Automatically selects timeframe based on your chart
Trading Applications for Market Profile Users
Support and Resistance Trading
Use composite levels as dynamic support and resistance zones. These levels often hold because they represent areas where significant trading decisions were made across multiple timeframes.
Breakout Trading
When composite levels break, they often lead to significant moves. The indicator calculates 1.618 Fibonacci extensions to give you clear targets for breakout trades.
Mean Reversion Strategies
Value Area levels represent the price range where most trading activity occurred. These levels often act as magnets, drawing price back when it moves too far from the mean.
Institutional Level Analysis
Composite levels represent areas where institutional traders have made significant decisions. These levels often hold more weight than traditional technical analysis levels because they're based on actual trading activity.
Key Features for Market Profile Traders
Smart Compositing Logic
- Automatic overlap detection using price range intersection algorithms
- Configurable overlap thresholds (minimum 50% overlap required for merging)
- Dead composite identification (profiles that become engulfed by newer composites)
- Real-time updates as new price action develops using barstate.islast optimization
Visual Customization
- Customizable colors for active, broken, and dead composites
- Adjustable transparency levels for each composite state
- Premium/Discount zone highlighting based on current price vs composite range
- TPO aggression coloring using TPO distribution analysis to identify buying/selling pressure
- Fibonacci level extensions with 1.618 target calculations based on composite range
Clean Chart Presentation
- Only shows the most relevant composite levels (maximum 10 active composites)
- Eliminates clutter from individual session profiles
- Focuses on areas of balance that matter most to current price action
Real-World Trading Examples
Day Trading with Session Composites
Use session-based composites to identify intraday areas of balance. The VAH and VAL levels often act as natural profit targets and stop-loss levels for scalping strategies.
Swing Trading with Daily Composites
Daily composites provide excellent swing trading levels. Look for price reactions at composite zones and use the 1.618 extensions for profit targets.
Position Trading with Weekly Composites
Weekly composites help identify major trend changes and long-term areas of balance. These levels often hold for months or even years.
Risk Management
Composite levels provide natural stop-loss levels. If a composite level breaks, it often signals a significant shift in market sentiment, making it an ideal place to exit losing positions.
Why Composite Levels Work
Composite levels work because they represent areas where significant trading decisions were made across multiple timeframes. When price returns to these levels, traders often remember the previous price action and make similar decisions, creating self-fulfilling prophecies.
The compositing process uses a proprietary algorithm that ensures only levels validated across multiple time periods are displayed. This means you're looking at levels that have proven their significance through actual market behavior, not just random technical levels.
Technical Foundation
The indicator uses TPO (Time Price Opportunity) data combined with price action analysis to identify areas of balance. The C2M row sizing method ensures accurate profile calculations, while the overlap detection algorithm (minimum 50% price range intersection) ensures only truly significant composites are displayed. The algorithm calculates row size based on ATR (Average True Range) divided by 10, then converts to tick size for precise level calculations.
How the Code Actually Works
1. Period Detection and ATR Calculation
The code first determines the appropriate timeframe based on your chart:
- 1m-5m charts: Session-based profiles
- 15m-2h charts: Daily profiles
- 4h charts: Weekly profiles
- 1D charts: Monthly profiles
For each period type, it calculates the number of bars needed for ATR calculation:
- Sessions: 540 minutes divided by chart timeframe
- Daily: 1440 minutes divided by chart timeframe
- Weekly: 7 days worth of minutes divided by chart timeframe
- Monthly: 30 days worth of minutes divided by chart timeframe
2. C2M Row Size Calculation
The code calculates True Range for each bar in the determined period:
- True Range = max(high-low, |high-prevClose|, |low-prevClose|)
- Averages all True Range values to get ATR
- Row Size = (ATR / 10) converted to tick size
- This ensures each TPO row represents a meaningful price movement
3. TPO Profile Generation
For each period, the code:
- Creates price levels from lowest to highest price in the range
- Each level is separated by the calculated row size
- Counts how many bars touch each price level (TPO count)
- Finds the level with highest count = Point of Control (POC)
- Calculates Value Area by expanding from POC until 68.27% of total TPO blocks are included
4. Overlap Detection Algorithm
When a new profile is created, the code checks if it overlaps with existing composites:
- Calculates overlap range = min(currentVAH, prevVAH) - max(currentVAL, prevVAL)
- Calculates current profile range = currentVAH - currentVAL
- Overlap percentage = (overlap range / current profile range) * 100
- If overlap >= 50%, profiles are merged into a composite
5. Composite Merging Logic
When profiles overlap, the code creates a new composite by:
- Taking the earliest start bar and latest end bar
- Using the wider VAH/VAL range (max of both profiles)
- Keeping the POC from the profile with more TPO blocks
- Marking the composite as "active" until price breaks through
6. Real-Time Updates
The code uses barstate.islast to optimize performance:
- Only recalculates on the last bar of each period
- Updates active composite with live price action if enabled
- Cleans up old composites to prevent memory issues
- Redraws all visual elements from scratch each bar
7. Visual Rendering System
The code uses arrays to manage drawing objects:
- Clears all lines/boxes arrays on every bar
- Iterates through composites array to redraw everything
- Uses different colors for active, broken, and dead composites
- Calculates 1.618 Fibonacci extensions for broken composites
Getting Started with CTPO
Step 1: Choose Your Timeframe
Select the period type that matches your trading style:
- Use "Sessions" for day trading
- Use "Daily" for swing trading
- Use "Weekly" for position trading
- Use "Auto" to let the indicator choose based on your chart timeframe
Step 2: Customize the Display
Adjust colors, transparency, and display options to match your charting preferences. The indicator offers extensive customization options to ensure it fits seamlessly into your existing analysis.
Step 3: Identify Key Levels
Look for:
- Composite zones (blue boxes) - major areas of balance
- VAH/VAL lines - value area boundaries
- POC lines - areas of highest trading activity
- 1.618 extension lines - breakout targets
Step 4: Develop Your Strategy
Use these levels to:
- Set entry points near composite zones
- Place stop losses beyond composite levels
- Take profits at 1.618 extension levels
- Identify trend changes when major composites break
Perfect for Market Profile Traders
If you're already using market profile concepts in your trading, CTPO eliminates the manual work of compositing profiles across different timeframes. Instead of spending time analyzing each individual period, you get instant access to the composite levels that matter most.
The indicator's automated compositing process ensures you're always looking at the most relevant areas of balance, while its real-time updates keep you informed of changes as they happen. Whether you're a day trader looking for intraday levels or a position trader analyzing long-term structure, CTPO provides the market profile intelligence you need to succeed.
Streamline Your Market Profile Analysis
Stop wasting time on manual compositing. Let CTPO do the heavy lifting while you focus on executing profitable trades based on areas of balance that actually matter.
Ready to Streamline Your Market Profile Trading?
Add the Composite Time Profile Overlay to your charts today and experience the difference that automated profile compositing can make in your trading performance.

Volume Profile + Pivot Levels [ChartPrime]⯁ OVERVIEW
Volume Profile + Pivot Levels combines a rolling volume profile with price pivots to surface the most meaningful levels in your selected lookback window. It builds a left-side profile from traded volume, highlights the session’s Point of Control (PoC) , and then filters pivot highs/lows so only those aligned with significant profile volume are promoted to chart levels. Each promoted level extends forward until price retests it—so your chart stays focused on levels that actually matter.
⯁ KEY FEATURES
Rolling Volume Profile (Period & Resolution)
Calculates a profile over the last Period bars (default 200). The profile is discretized into Volume Profile Resolution bins (default 50) between the highest high and lowest low inside the window. Each bin accumulates traded volume and is drawn as a smooth left-side polyline for compact, lightweight rendering.
HL = array.new()
// collect highs/lows over 'start' bars to define profile range
for i = 0 to start - 1
HL.push(high ), HL.push(low )
H = HL.max(), L = HL.min()
bin_size = (H - L) / bins
// accumulate per-bin volume
for i = 0 to bins - 1
for j = 0 to start - 1
if close >= (L + bin_sizei) - bin_size and close < (L + bin_size*(i+1)) + bin_size
Bins += volume
Delta-Aware Coloring
The script tracks up-minus-down volume across all period to compute a net Delta . The profile, PoC line, and PoC label adopt a teal tone when net positive, and maroon when net negative—an immediate read on buyer/seller dominance inside the window.
Point of Control (PoC) + Volume Label
Automatically marks the highest-volume bin as the PoC . A horizontal PoC line extends to the last bar, and a label shows the absolute volume at the PoC. Toggle visibility via PoC input.
Pivot Detection with Volume Filter
Identifies raw pivots using Length (default 10) on both sides of the bar. Each candidate pivot is then validated against the profile: only pivots that land within their bin and meet or exceed the Filter % threshold (percentage of PoC volume) are promoted to chart levels. This removes weak, low-participation pivots.
// pivot promotion when volume% >= pivotFilter
if abs(mid - p.value) <= bin_size and volPercent >= pivotFilter
// draw labeled pivot level
line.new(p.index - pivotLength, p.value, p.index + pivotLength, p.value, width = 2)
Forward-Extending, Self-Stopping Levels
Promoted pivot levels extend forward as dotted rays. As soon as price intersects a level (high/low straddles it), that level stops extending—so your chart doesn’t clutter with stale zones.
Concise Level Labels (Volume + %)
Each promoted pivot prints a compact label at the pivot bar with its bin’s absolute volume and percentage of PoC volume (ordering flips for highs vs. lows for quick read).
Lightweight Visuals
The volume profile is rendered as a smooth polyline rather than dozens of boxes, keeping charts responsive even at higher resolutions.
⯁ SETTINGS
Volume Profile → Period : Lookback window used to compute the profile (max 500).
Volume Profile → Resolution : Number of bins; higher = finer structure.
Volume Profile → PoC : Toggle PoC line and volume label.
Pivots → Display : Show/hide volume-validated pivot levels.
Pivots → Length : Pivot detection left/right bars.
Pivots → Filter % 0–100 : Minimum bin strength (as % of PoC) required to promote a pivot level.
⯁ USAGE
Read PoC direction/color for a quick net-flow bias within your window.
Prioritize promoted pivot levels —they’re backed by meaningful participation.
Watch for first retests of promoted levels; the line will stop extending once tested.
Adjust Period / Resolution to match your timeframe (scalps → higher resolution, shorter period; swings → lower resolution, longer period).
Tighten or loosen Filter % to control how selective the level promotion is.
⯁ WHY IT’S UNIQUE
Instead of plotting every pivot or every profile bar, this tool cross-checks pivots against the profile’s internal volume weighting . You only see levels where price structure and liquidity overlap—clean, data-driven levels that self-retire after interaction, so you can focus on what the market actually defends.

VPOC Harmonics - Liquidity-Weighted Price / Time RatiosVPOC Harmonics - Liquidity-Weighted Price / Time Ratios
Summary
This indicator transforms a swing’s price range, duration, and liquidity profile into a structured set of price-per-bar ratios. By anchoring two points and manually entering the swing’s VPOC (highest-volume price), it generates candidate compression values that unify price, time, and liquidity structure. These values can be applied to chart scaling, harmonic testing, and liquidity-aware market geometry.
________________________________________
Overview
Most swing analysis tools only consider price (ΔP) and time (N bars). This script goes further by incorporating the VPOC (Point of Control) — the price with the highest traded volume — directly into swing geometry.
• Anchors define the swing’s Low (L), High (H), and bar count (N).
• The user manually enters the VPOC (highest-volume price).
• The indicator then computes a suite of ratios that integrate range, duration, and liquidity placement.
The output is a table of liquidity-weighted price-per-bar candidates, designed for compression testing and harmonic analysis across swings and instruments.
________________________________________
How to Use
1. Select a Swing
- Place Anchor A and Anchor B to define the swing’s Low, High, and bar count.
2. Find the VPOC
- Apply TradingView’s Fixed Range Volume Profile tool over the same swing.
- Identify the Point of Control (POC) — the price level with the highest traded volume.
3. Enter the VPOC
- Manually input the POC into the indicator settings.
4. Review Outputs
- The table will display candidate ratios expressed mainly as price-per-bar values.
5. Apply in Practice
- Use the ratios as chart compression inputs or as benchmarks for testing harmonic alignments across swings.
________________________________________
Outputs
Swing & Inputs
• Bars (N): total bar count of the swing.
• Low (L): swing low price.
• High (H): swing high price.
• ΔP = H − L: price range.
• Mid = (L + H) ÷ 2: midpoint price.
• VPOC (V): user-entered highest-volume price.
• Base slope s0 = ΔP ÷ N: average change per bar.
• π-adjusted slope sπ = (π × ΔP) ÷ (2 × N): slope adjusted for half-cycle arc geometry.
________________________________________
VPOC Harmony Ratios (L, H, V, N)
• λ = (V − L) ÷ ΔP: normalized VPOC position within the range.
• R = (V − L) ÷ (H − V): symmetry ratio comparing lower vs. upper segment.
• s1 = (V − L) ÷ N: slope from Low → VPOC.
• s2 = (H − V) ÷ N: slope from VPOC → High.
________________________________________
Blended Means (s1, s2)
These combine the two segment slopes in different ways:
• HM(s1,s2) = 2 ÷ (1/s1 + 1/s2): Harmonic mean, emphasizes the smaller slope.
• GM(s1,s2) = sqrt(s1 × s2): Geometric mean, balances both slopes proportionally.
• RMS(s1,s2) = sqrt((s1² + s2²) ÷ 2): Root-mean-square, emphasizes the larger slope.
• L2 = sqrt(s1² + s2²): Euclidean norm, the vector length of both slopes combined.
________________________________________
Slope Blends
• Quadratic weighting: s_quad = s0 × ((V−L)² + (H−V)²) ÷ (ΔP²)
• Tilted slope: s_tilt = s0 × (0.5 + λ)
• Entropy-scaled slope: s_ent = s0 × H2(λ), with H2(λ) = −
________________________________________
Curvature & Liquidity Extensions
• π-arc × λ: s_arc = sπ × λ
• Liquidity-π: s_piV = sπ × (V ÷ Mid)
________________________________________
Scale-Normalized Families
With k = sqrt(H ÷ L):
• k (scale factor) = sqrt(H ÷ L)
• s_comp = s0 ÷ k: compressed slope candidate
• s_exp = s0 × k: expanded slope candidate
• Exponentiated blends:
- s_kλ = s0 × k^(2λ−1)
- s_φλ = s0 × φ^(2λ−1), with φ = golden ratio ≈ 1.618
- s_√2λ = s0 × (√2)^(2λ−1)
________________________________________
Practical Application
All formulas generate liquidity-weighted price-per-bar ratios that integrate range, time, and VPOC placement.
These values are designed for:
• Chart compression settings
• Testing harmonic alignments across swings
• Liquidity-aware scaling experiments
________________________________________

Volume Profile Grid [Alpha Extract]A sophisticated volume distribution analysis system that transforms market activity into institutional-grade visual profiles, revealing hidden support/resistance zones and market participant behavior. Utilizing advanced price level segmentation, bullish/bearish volume separation, and dynamic range analysis, the Volume Profile Grid delivers comprehensive market structure insights with Point of Control (POC) identification, Value Area boundaries, and volume delta analysis. The system features intelligent visualization modes, real-time sentiment analysis, and flexible range selection to provide traders with clear, actionable volume-based market context.
🔶 Dynamic Range Analysis Engine
Implements dual-mode range selection with visible chart analysis and fixed period lookback, automatically adjusting to current market view or analyzing specified historical periods. The system intelligently calculates optimal bar counts while maintaining performance through configurable maximum limits, ensuring responsive profile generation across all timeframes with institutional-grade precision.
// Dynamic period calculation with intelligent caching
get_analysis_period() =>
if i_use_visible_range
chart_start_time = chart.left_visible_bar_time
current_time = last_bar_time
time_span = current_time - chart_start_time
tf_seconds = timeframe.in_seconds()
estimated_bars = time_span / (tf_seconds * 1000)
range_bars = math.floor(estimated_bars)
final_bars = math.min(range_bars, i_max_visible_bars)
math.max(final_bars, 50) // Minimum threshold
else
math.max(i_periods, 50)
🔶 Advanced Bull/Bear Volume Separation
Employs sophisticated candle classification algorithms to separate bullish and bearish volume at each price level, with weighted distribution based on bar intersection ratios. The system analyzes open/close relationships to determine volume direction, applying proportional allocation for doji patterns and ensuring accurate representation of buying versus selling pressure across the entire price spectrum.
🔶 Multi-Mode Volume Visualization
Features three distinct display modes for bull/bear volume representation: Split mode creates mirrored profiles from a central axis, Side by Side mode displays sequential bull/bear segments, and Stacked mode separates volumes vertically. Each mode offers unique insights into market participant behavior with customizable width, thickness, and color parameters for optimal visual clarity.
// Bull/Bear volume calculation with weighted distribution
for bar_offset = 0 to actual_periods - 1
bar_high = high
bar_low = low
bar_volume = volume
// Calculate intersection weight
weight = math.min(bar_high, next_level) - math.max(bar_low, current_level)
weight := weight / (bar_high - bar_low)
weighted_volume = bar_volume * weight
// Classify volume direction
if bar_close > bar_open
level_bull_volume += weighted_volume
else if bar_close < bar_open
level_bear_volume += weighted_volume
else // Doji handling
level_bull_volume += weighted_volume * 0.5
level_bear_volume += weighted_volume * 0.5
🔶 Point of Control & Value Area Detection
Implements institutional-standard POC identification by locating the price level with maximum volume accumulation, providing critical support/resistance zones. The Value Area calculation uses sophisticated sorting algorithms to identify the price range containing 70% of trading volume, revealing the market's accepted value zone where institutional participants concentrate their activity.
🔶 Volume Delta Analysis System
Incorporates real-time volume delta calculation with configurable dominance thresholds to identify significant bull/bear imbalances. The system visually highlights price levels where buying or selling pressure exceeds threshold percentages, providing immediate insight into directional volume flow and potential reversal zones through color-coded delta indicators.
// Value Area calculation using 70% volume accumulation
total_volume_sum = array.sum(total_volumes)
target_volume = total_volume_sum * 0.70
// Sort volumes to find highest activity zones
for i = 0 to array.size(sorted_volumes) - 2
for j = i + 1 to array.size(sorted_volumes) - 1
if array.get(sorted_volumes, j) > array.get(sorted_volumes, i)
// Swap and track indices for value area boundaries
// Accumulate until 70% threshold reached
for i = 0 to array.size(sorted_indices) - 1
accumulated_volume += vol
array.push(va_levels, array.get(volume_levels, idx))
if accumulated_volume >= target_volume
break
❓How It Works
🔶 Weighted Volume Distribution
Implements proportional volume allocation based on the percentage of each bar that intersects with price levels. When a bar spans multiple levels, volume is distributed proportionally based on the intersection ratio, ensuring precise representation of trading activity across the entire price spectrum without double-counting or volume loss.
🔶 Real-Time Profile Generation
Profiles regenerate on each bar close when in visible range mode, automatically adapting to chart zoom and scroll actions. The system maintains optimal performance through intelligent caching mechanisms and selective line updates, ensuring smooth operation even with maximum resolution settings and extended analysis periods.
🔶 Market Sentiment Analysis
Features comprehensive volume analysis table displaying total volume metrics, bullish/bearish percentages, and overall market sentiment classification. The system calculates volume dominance ratios in real-time, providing immediate insight into whether buyers or sellers control the current price structure with percentage-based sentiment thresholds.
🔶 Visual Profile Mapping
Provides multi-layered visual feedback through colored volume bars, POC line highlighting, Value Area boundaries, and optional delta indicators. The system supports profile mirroring for alternative perspectives, line extension for future reference, and customizable label positioning with detailed price information at critical levels.
Why Choose Volume Profile Grid
The Volume Profile Grid represents the evolution of volume analysis tools, combining traditional volume profile concepts with modern visualization techniques and intelligent analysis algorithms. By integrating dynamic range selection, sophisticated bull/bear separation, and multi-mode visualization with POC/Value Area detection, it provides traders with institutional-quality market structure analysis that adapts to any trading style. The comprehensive delta analysis and sentiment monitoring system eliminates guesswork while the flexible visualization options ensure optimal clarity across all market conditions, making it an essential tool for traders seeking to understand true market dynamics through volume-based price discovery.

Dynamic Support and Resistance V2 | AnonycryptousThe Dynamic Support and Resistance V2 indicator, an easy tool to identify key support, resistance, trendline levels, pivot points and volume data.
Pivot Points.
Calculates support, resistance and trendline levels using pivot points, which are derived from the high, low, and close prices of previous trading periods.
Customize the pivot calculation by using Close' or 'High/Low' and adjusting the lookback periods for both the left and right sides of the pivot calculation.
Pivot points are crucial for forecasting potential market turning points, so it allows traders to adapt the indicator to different market conditions and timeframes.
By using pivot points, traders can spot reversal and consolidation levels or trendlines early on, allowing them to react to them in time.
Volume Levels.
This option focuses on identifying support and resistance levels based on volume data, specifically the Point of Control.
The POC is the highest traded volume price level during a time period.
This POC calculation, allow traders to areas of significant trading levels as support or resistance zones.
Volume-based levels gives insights into market sentiment and showes strong support and resistance based on trading volume.
Traders can choose between pivot-based and volume-based levels or use both simultaneously, depending on their analysis.
The indicator offers custom colors, so the trader can customize their visual analysis to their own style.
It calculates the importance of each level based on the number of touches and the duration it holds.
This indicator is intended for educational and informational purposes only and should not be considered financial advice.
Trading involves significant risk, and you should consult with a financial advisor before making any trading decisions.
The performance of this indicator is not guaranteed, and past results do not predict future performance.
Use at your own risk.

VP-Period with Previous Day Levels & Historical POC# Volume Profile with Previous Day Levels & Historical POCs
## Description
Comprehensive indicator combining Volume Profile analysis, previous day levels, and historical POC (Point of Control) levels for advanced technical analysis.
## Key Features
### Volume Profile
- **Customizable period**: 3 to 500 days
- **Calculation resolution**: 400 to 700 points
- **Current VPOC**: Point of Control line for current period
- **Volume bars**: graphical display of volume profile distribution
### Historical POCs
- **POC history**: up to 20 previous days
- **Time labels**: shows how many days ago for each POC
- **Dashed lines**: easy identification of historical levels
### Previous Day Levels (last 5 days)
- **High/Low**: daily highs and lows
- **Midpoint**: 50% level (High+Low)/2
- **Open/Close**: opening and closing prices
- **Progressive thickness**: day 1 thicker, decreasing for previous days
## Customization
- Fully configurable colors for each element
- Toggle on/off switches for every component
- Different line styles (solid, dashed, dotted)
## Usage
Perfect for traders using volume analysis and support/resistance based on previous daily levels. Ideal for identifying key zones and significant breakout points.
Volume Profile (Simple)Simple Volume Profile (Simple)
Master the Market's Structure with a Clear View of Volume
by mercaderoaurum
The Simple Volume Profile (Simple) indicator removes the guesswork by showing you exactly where the most significant trading activity has occurred. By visualizing the Point of Control (POC) and Value Area (VA) for today and yesterday, you can instantly identify the price levels that matter most, giving you a critical edge in your intraday trading.
This tool is specifically optimized for day trading SPY on a 1-minute chart, but it's fully customizable for any symbol or timeframe.
Key Features
Multi-Day Analysis: Automatically plots the volume profiles for the current and previous trading sessions, allowing you to see how today's market is reacting to yesterday's key levels.
Automatic Key Level Plotting: Instantly see the most important levels from each session:
Point of Control (POC): The single price level with the highest traded volume, acting as a powerful magnet for price.
Value Area High (VAH): The upper boundary of the area where 50% of the volume was traded. It often acts as resistance.
Value Area Low (VAL): The lower boundary of the 50% value area, often acting as support.
Extended Levels: The POC, VAH, and VAL from previous sessions are automatically extended into the current day, providing a clear map of potential support and resistance zones.
Customizable Sessions: While optimized for the US stock market, you can define any session time and time zone, making it a versatile tool for forex, crypto, and futures traders.
Core Trading Strategies
The Simple Volume Profile helps you understand market context. Instead of trading blind, you can now make decisions based on where the market has shown the most interest.
1. Identifying Support and Resistance
This is the most direct way to use the indicator. The extended lines from the previous day are your roadmap for the current session.
Previous Day's POC (pPOC): This is the most significant level. Watch for price to react strongly here. It can act as powerful support if approached from above or strong resistance if approached from below.
Previous Day's VAH (pVAH): Expect this level to act as initial resistance. A clean break above pVAH can signal a strong bullish trend.
Previous Day's VAL (pVAL): Expect this level to act as initial support. A firm break below pVAL can indicate a strong bearish trend.
Example Strategy: If SPY opens and rallies up to the previous day's VAH and stalls, this is a high-probability area to look for a short entry, with a stop loss just above the level.
2. The "Open-Drive" Rejection
How the market opens in relation to the previous day's value area is a powerful tell.
Open Above Yesterday's Value Area: If the market opens above the pVAH, it signals strength. The first pullback to test the pVAH is often a key long entry point. The level is expected to flip from resistance to support.
Open Below Yesterday's Value Area: If the market opens below the pVAL, it signals weakness. The first rally to test the pVAL is a potential short entry, as the level is likely to act as new resistance.
3. Fading the Extremes
When price pushes far outside the previous day's value area, it can become overextended.
Reversal at Highs: If price rallies significantly above the pVAH and then starts to lose momentum (e.g., forming bearish divergence on RSI or a topping pattern), it could be an opportunity to short the market, targeting a move back toward the pVAH or pPOC.
Reversal at Lows: Conversely, if price drops far below the pVAL and shows signs of bottoming, it can be a good opportunity to look for a long entry, targeting a reversion back to the value area.
Recommended Settings (SPY Intraday)
These settings are the default and are optimized for scalping or day trading SPY on a 1-minute chart.
Value Area (%): 50%. This creates a tighter, more sensitive value area, perfect for identifying the most critical intraday zones.
Number of Rows: 1000. This high resolution is essential for a low-volatility instrument like SPY, ensuring that the profile is detailed and the levels are precise.
Session Time: 0400-1800 in America/New_York. This captures the full pre-market and core session, which is crucial for understanding the day's complete volume story.
Ready to trade with an edge? Add the Simple Volume Profile (Multi-Day) to your chart now and see the market in a new light!

Candle Volume Profile Marker# 📊 Candle Volume Profile Marker (CVPM)
**Transform your chart analysis with precision volume profile levels on every candle!**
The Candle Volume Profile Marker displays key volume profile levels (POC, VAH, VAL) for individual candles, giving you granular insights into price acceptance and rejection zones at the micro level.
## 🎯 **Key Features**
### **Core Levels**
- **POC (Point of Control)** - The price level with highest volume concentration
- **VAH (Value Area High)** - Upper boundary of the value area
- **VAL (Value Area Low)** - Lower boundary of the value area
- **Customizable Value Area** - Adjust percentage from 50% to 90%
### **Flexible Display Options**
- **Current Candle Only** or **Historical Lookback** (1-50 candles)
- **Multiple Visual Styles** - Lines, dots, crosses, triangles, squares, diamonds
- **Smart Line Extensions** - Right only, both sides, or left only
- **4 Line Length Modes** - Normal, Short, Ultra Short, Micro (for ultra-clean charts)
- **Full Color Customization** - Colors, opacity, line width
- **Adjustable Marker Sizes** - Tiny to Large
### **Advanced Calculation Methods**
Choose your POC calculation:
- **Weighted** - Smart estimation based on volume distribution (default)
- **Close** - Uses closing price
- **Middle** - High-Low midpoint
- **VWAP** - Volume weighted average price
### **Professional Tools**
- **Real-time Info Table** - Current levels display
- **Smart Alerts** - POC crosses and Value Area breakouts
- **Highlight Current Candle** - Extended dotted lines for current levels
- **Developing Levels** - Real-time updates for active candle
## 🚀 **Why Use CVPM?**
### **Precision Trading**
- Identify exact support/resistance on each candle
- Spot volume acceptance/rejection zones
- Plan entries and exits with micro-level precision
### **Clean & Customizable**
- Lines extend only right (eliminates confusion)
- Ultra-short line options for minimal chart clutter
- Professional appearance with full customization
### **Multiple Timeframes**
- Works on any timeframe from 1-minute to monthly
- Historical analysis with adjustable lookback
- Real-time developing levels
## 📈 **Perfect For**
- **Day Traders** - Micro-level entry/exit points
- **Swing Traders** - Key levels for position management
- **Volume Analysis** - Understanding price acceptance zones
- **Support/Resistance Trading** - Precise level identification
- **Breakout Trading** - Value area breakout alerts
## ⚙️ **Easy Setup**
1. Add indicator to your chart
2. Choose your preferred visual style (lines/dots)
3. Select line extension (right-only recommended)
4. Adjust line length (try "Ultra Short" for clean charts)
5. Customize colors and enable alerts
## 🎨 **Customization Groups**
- **Display Options** - What to show and how many candles
- **Calculation** - POC method and value area percentage
- **POC Visual** - Style, color, width, length for Point of Control
- **Value Area Visual** - Style, color, width, length for VAH/VAL
- **Line Settings** - Extension direction and length modes
- **Size** - Marker sizes and opacity
## 🔔 **Built-in Alerts**
- Price crosses above/below POC
- Value Area breakouts (up/down)
- Fully customizable alert messages
## 💡 **Pro Tips**
- Use "Right Only" extension to avoid confusion about which candle owns the levels
- Try "Ultra Short" or "Micro" line modes for cleaner charts
- Enable "Highlight Current Candle" for extended reference lines
- Combine with volume indicators for enhanced analysis
- Use different colors for easy POC/VAH/VAL identification
---
**Transform your volume analysis today with the most flexible and customizable candle-level volume profile indicator available!**
*Perfect for traders who demand precision and clean, professional charts.*

TrueTrend MaxRThe TrueTrend MaxR indicator is designed to identify the most consistent exponential price trend over extended periods. It uses statistical analysis on log-transformed prices to find the trendline that best fits historical price action, and highlights the most frequently tested or traded level within that trend channel.
For optimal results, especially on high timeframes such as weekly or monthly, it is recommended to use this indicator on charts set to logarithmic scale. This ensures proper visual alignment with the exponential nature of long-term price movements.
How it works
The indicator tests 50 different lookback periods, ranging from 300 to 1280 bars. For each period, it:
- Applies a linear regression on the natural logarithm of the price
- Computes the slope and intercept of the trendline
- Calculates the unbiased standard deviation from the regression line
- Measures the correlation strength using Pearson's R coefficient
The period with the highest Pearson R value is selected, meaning the trendline drawn corresponds to the log-scale trend with the best statistical fit.
Trendline and deviation bands
Once the optimal period is identified, the indicator plots:
- A main log-scale trendline
- Upper and lower bands, based on a user-defined multiple of the standard deviation
These bands help visualize how far price deviates from its core trend, and define the range of typical fluctuations.
Point of Control (POC)
Inside the trend channel, the space between upper and lower bands is divided into 15 logarithmic levels. The script evaluates how often price has interacted with each level, using one of two selectable methods:
- Touches: Counts the number of candles crossing each level
- Volume: Weighs each touch by the traded volume at that candle
The level with the highest cumulative interaction is considered the dynamic Point of Control (POC), and is plotted as a line.
Annualized performance and confidence display
When used on daily or weekly timeframes, the script also calculates the annualized return (CAGR) based on the detected trend, and displays:
- A performance estimate in percentage terms
- A textual label describing the confidence level based on the Pearson R value
Why this indicator is useful
- Automatically detects the most statistically consistent exponential trendline
- Designed for log-scale analysis, suited to long-term investment charts
- Highlights key price levels frequently visited or traded within the trend
- Provides objective, data-based trend and volatility insights
- Displays annualized growth rate and correlation strength for quick evaluation
Notes
- All calculations are performed only on the last bar
- No future data is used, and the script does not repaint
- Works on any instrument or timeframe, with optimal use on higher timeframes and logarithmic scaling

Delta Volume Profile [BigBeluga]🔵Delta Volume Profile
A dynamic volume analysis tool that builds two separate horizontal profiles: one for bullish candles and one for bearish candles. This indicator helps traders identify the true balance of buying vs. selling volume across price levels, highlighting points of control (POCs), delta dominance, and hidden volume clusters with remarkable precision.
🔵 KEY FEATURES
Split Volume Profiles (Bull vs. Bear):
The indicator separates volume based on candle direction:
If close > open , the candle’s volume is added to the bullish profile (positive volume).
If close < open , it contributes to the bearish profile (negative volume).
ATR-Based Binning:
The price range over the selected lookback is split into bins using ATR(200) as the bin height.
Each bin accumulates both bull and bear volumes to form the dual-sided profile.
Bull and Bear Volume Bars:
Bullish volumes are shown as right-facing bars on the right side, colored with a bullish gradient.
Bearish volumes appear as left-facing bars on the left side, shaded with a bearish gradient.
Each bar includes a volume label (e.g., +12.45K or -9.33K) to show exact volume at that price level.
Points of Control (POC) Highlighting:
The bin with the highest bullish volume is marked with a border in POC+ color (default: blue).
The bin with the highest bearish volume is marked with a POC− color (default: orange).
Total Volume Density Map:
A neutral gray background box is plotted behind candles showing the total volume (bull + bear) per bin.
This reveals high-interest price zones regardless of direction.
Delta and Total Volume Summary:
A Delta label appears at the top, showing net % difference between bull and bear volume.
A Total label at the bottom shows total accumulated volume across all bins.
🔵 HOW IT WORKS
The indicator captures all candles within the lookback period .
It calculates the price range and splits it into bins using ATR for adaptive resolution.
For each candle:
If price intersects a bin and close > open , volume is added to the positive profile .
If close < open , volume is added to the negative profile .
The result is two side-by-side histograms at each price level—one for buyers, one for sellers.
The bin with the highest value on each side is visually emphasized using POC highlight colors.
At the end, the script calculates:
Delta: Total % difference between bull and bear volumes.
Total: Sum of all volumes in the lookback window.
🔵 USAGE
Volume Imbalance Zones: Identify price levels where buyers or sellers were clearly dominant.
Fade or Follow Volume Clusters: Use POC+ or POC− levels for reaction trades or breakouts.
Delta Strength Filtering: Strong delta values (> ±20%) suggest momentum or exhaustion setups.
Volume-Based Anchoring: Use profile levels to mark hidden support/resistance and execution zones.
🔵 CONCLUSION
Delta Volume Profile offers a unique advantage in market reading by separating buyer and seller activity into two visual layers. This allows traders to not only spot where volume was high, but also who was more aggressive. Whether you’re analyzing trend continuations, reversals, or absorption levels, this indicator gives you the transparency needed to trade with confidence.

Forex Session + Volume Profile [RunRox]📊 Forex Session + Volume Profile is built especially for traders who work with intra-session liquidity concepts or any strategy that needs a clear visual of trading sessions and the liquidity inside them.
Our team created this indicator to give you better session visibility, flexible session styling, and extra tools that help you navigate the market more easily.
📌 Features:
6 fully customizable sessions
Kill Zone (the high-impact trading window)
Volume Profile for each session
POC / VAL / VAH / LVN levels (Point of Control, Value Area Low, Value Area High, Low Volume Node)
PDH / PDL levels (Previous Day High / Low)
PWH / PWL levels (Previous Week High / Low)
NYM level (New York Market level)
Active sessions table
5 style options for each session
All of this gives you the flexibility to set up exactly the layout you need for your trading. Below, you’ll find a more detailed look at each feature.
🗓️ 6 CUSTOMIZABLE SESSION
The indicator includes six sessions that you can fully customize to fit your needs—everything from naming each session and choosing line colors to adjusting opacity, showing the volume profile, or even turning off a session entirely if you don’t need it.
Plus, you can pick different display styles for each session. As shown in the screenshot below, there are five style options you can apply individually to every session.
5 Style Options for Sessions
BOX
AREA
ZONES
LINES
CURVED
These styles can be customized for each session individually to help you highlight the sessions you care about on your chart. Example below
📢 VOLUME PROFILE
We’ve also integrated a Volume Profile into the indicator to pinpoint important levels on the chart. On top of that, we’ve added extra volume-based levels. Below, you’ll find the settings and a visual demo of how it appears on your chart.
To identify optimal entry points, you can use the following key reference levels:
POC (Point of Control)
VAL (Value Area Low)
VAH (Value Area High)
LVN (Low Volume Node)
You can also customize colors and line styles, or hide any levels you don’t need on your chart.
📐 ADDITIONAL LEVELS
You can display the following levels on your chart:
NYM (New York Market)
PDH (Previous Day High)
PDL (Previous Day Low)
PWH (Previous Week High)
PWL (Previous Week Low)
All of these are fully customizable with color selection and the option to extend lines into the next period.
💹 ACTIVE SESSION TABLE
The active sessions table helps you quickly identify the trading times for the sessions you care about. It’s fully customizable, with options to choose border and background colors for the table itself.
🟠 USAGE
This indicator is highly versatile: use it to simply mark trading sessions on your chart, set up the Kill Zone at your chosen time, or identify the context of the previous session by its most traded range levels. All of this makes the indicator an invaluable tool for any trader!

RSI VWAP POC [Uncle Sam Trading]Category: Oscillators, Volume, Market Profile
Timeframe: Suitable for all timeframes
Markets: Crypto, Forex, Stocks, Commodities
Overview
The RSI VWAP POC indicator is a powerful and innovative oscillator that combines the Relative Strength Index (RSI), Volume-Weighted Average Price (VWAP), and Point of Control (POC) from market profile analysis. Designed to provide traders with clear, high-probability trading signals, this indicator helps you identify key market levels, spot overbought/oversold conditions, and time your entries and exits with precision. Whether you’re a day trader, swing trader, or scalper, this free tool adds significant value to your trading strategy by offering a unique blend of momentum, volume, and market profile insights.
How It Works
This indicator integrates three core components to deliver actionable insights:
RSI (Relative Strength Index): Measures momentum to identify overbought (above 70) and oversold (below 30) conditions, helping you anticipate potential reversals.
VWAP (Volume-Weighted Average Price): Calculates a volume-weighted price benchmark, which is used to compute a more accurate, volume-sensitive RSI. This ensures the indicator reflects true market dynamics.
POC (Point of Control): Derived from market profile analysis, the POC represents the price level with the highest traded volume in a session, acting as a critical support or resistance level.
The indicator plots a smoothed RSI based on VWAP, overlaid with market profile data on a user-defined higher timeframe (default: 4H). The POC is displayed as a red line, with aqua bars indicating the value area where the majority of trading volume occurred. When the RSI crosses the POC, the indicator generates clear buy and sell signals:
Strong Buy (SBU): RSI crosses above the POC in an oversold zone.
Strong Sell (SBD): RSI crosses below the POC in an overbought zone.
Additional features include:
Background colors to highlight bullish (green) or bearish (red) trends.
Shaded zones for overbought (70/60) and oversold (30/40) levels.
Customizable settings to fit your trading style and timeframe.
How This Indicator Adds Value
The RSI VWAP POC indicator offers several key benefits that enhance your trading performance:
High-Probability Signals: By combining RSI, VWAP, and POC, this indicator identifies trades at key market levels where price is likely to react, increasing your win rate.
Improved Timing: Clear buy and sell signals, such as ‘SBU’ and ‘SBD’, help you enter and exit trades at optimal points, maximizing profitability.
Risk Management: Overbought/oversold zones and trend confirmation via background colors help you avoid false signals, protecting your capital.
Versatility: Suitable for all markets (crypto, forex, stocks) and timeframes, making it a valuable tool for traders of all experience levels.
Time Efficiency: The indicator does the heavy lifting by analyzing momentum, volume, and market profile data, allowing you to focus on executing trades.
Real-World Performance Example: On a 1-hour Bitcoin chart with a 4-hour higher timeframe, this indicator identified a strong sell signal on April 6th at 12:00 ($82,000), leading to a 9% drop to $74,600. A subsequent strong buy signal on April 7th at 04:00 ($76,200) captured a 6% rise to $81,200 – a potential 25% profit with 5x leverage if exited at 5%.
How to Use
Add the Indicator: Search for “RSI VWAP POC ” in TradingView’s indicator library and add it to your chart.
Set Your Timeframe: The indicator works on any timeframe but is optimized for a 1-hour chart with a 4-hour higher timeframe (set in the settings).
Interpret Signals:
Look for ‘SBU’ (strong buy) labels when the RSI crosses above the POC in an oversold zone, indicating a potential buying opportunity.
Look for ‘SBD’ (strong sell) labels when the RSI crosses below the POC in an overbought zone, signaling a potential selling opportunity.
Use the background colors (green for bullish, red for bearish) to confirm the trend.
Combine with Your Strategy: Use the indicator alongside your existing analysis (e.g., support/resistance, candlestick patterns) for best results.
Settings and Customization
The indicator is highly customizable to suit your trading needs:
RSI Length (Default: 14): Adjust the sensitivity of the RSI. Use a shorter length (e.g., 10) for scalping, or a longer length (e.g., 20) for smoother signals.
EMA Smoothing Length (Default: 3): Smooths the RSI line. Increase to 5 or 7 for less choppy signals in volatile markets.
Higher Timeframe (Default: 240 minutes): Set to 240 (4 hours) for a 1-hour chart. Adjust based on your chart’s timeframe (e.g., 60 minutes for a 15-minute chart).
Value Area Percentage (Default: 100%): Defines the size of the value area around the POC. Lower to 70% for a tighter focus on key levels.
Overbought/Oversold Thresholds (Defaults: 70/30): Adjust these levels to match market conditions (e.g., 80/20 for trending markets).
Show POC Line (Default: True): Toggle the red POC line on or off.
Show Buy/Sell Signals: Enable ‘Show Strong Breakup Signals’ and ‘Show Strong Breakdown Signals’ to focus on high-probability trades.
Why Choose This Indicator?
The RSI VWAP POC indicator stands out by offering a unique combination of momentum, volume, and market profile analysis in a single, easy-to-use tool. It’s designed to help traders of all levels make informed decisions, reduce risk, and increase profitability. Whether you’re trading Bitcoin, forex pairs, or stocks, this indicator provides the clarity and precision you need to succeed.

volume profile ranking indicator📌 Introduction
This script implements a volume profile ranking indicato for TradingView. It is designed to visualize the distribution of traded volume over price levels within a defined historical window. Unlike TradingView’s built-in Volume Profile, this script gives full customization of the profile drawing logic, binning, color gradient, and the ability to anchor the profile to a specific date.
⚙️ How It Works (Logic)
1. Inputs
➤POC Lookback Days (lookback): Defines how many bars (days) to look back from a selected point to calculate the volume distribution.
➤Bin Count (bin_count): Determines how many price bins (horizontal levels) the price range will be divided into.
➤Use Custom Lookback Date (useCustomDate): Enables/disables manually selecting a backtest start date.
➤Custom Lookback Date (customDate): When enabled, the profile will calculate volume based on this date instead of the most recent bar.
2. Target Bar Determination
➤If a custom date is selected, the script searches for the bar closest to that date within 1000 bars.
➤If not, it defaults to the latest bar (bar_index).
➤The profile is drawn only when the current bar is close to the target bar (within ±2 bars), to avoid unnecessary recalculations and performance issues.
3. Volume Binning
➤The price range over the lookback window is divided into bin_count segments.
➤For each bar within the lookback window, its volume is added to the appropriate bin based on price.
➤If the price falls outside the expected range, it is clamped to the first or last bin.
4. Ranking and Sorting
➤A bubble sort ranks each bin by total volume.
➤The most active bin (POC, or Point of Control) is highlighted with a thicker bar.
5. Rendering
➤Horizontal bars (line.new) represent volume intensity in each price bin.
➤Each bar is color-coded by volume heat: more volume = more intense color.
➤Labels (label.new) show:
➤Total volume
➤Rank
➤Percentage of total volume
➤Price range of the bin
🧑💻 How to Use
1. Add the Script to Your Chart
➤Copy the code into TradingView’s Pine Script editor and add it to your chart.
2. Set Lookback Period
➤Default is 252 bars (about one year for daily charts), but can be changed via the input.
3. (Optional) Use Custom Date
●Toggle "Use Custom Lookback Date" to true.
➤Pick a date in the "Custom Lookback Date" input to anchor the profile.
4. Analyze the Volume Distribution
➤The longest (thickest) red/orange bar represents the Point of Control (POC) — the price with the most volume traded.
➤Other bars show volume distribution across price.
➤Labels display useful metrics to evaluate areas of high/low interest.
✅ Features
🔶 Customizable anchor point (custom date).
🔶Adjustable bin count and lookback length.
🔶 Clear visualization with heatmap coloring.
🔶 Lightweight and performance-optimized (especially with the shouldDrawProfile filter)

Casa_VolumeProfileSessionLibrary "Casa_VolumeProfileSession"
Analyzes price and volume during regular trading hours to provide a session volume profile,
including Point of Control (POC), Value Area High (VAH), and Value Area Low (VAL).
Calculates and displays these levels historically and for the developing session.
Offers customizable visualization options for the Value Area, POC, histogram, and labels.
Uses lower timeframe data for increased accuracy and supports futures sessions.
The number of rows used for the volume profile can be fixed or dynamically calculated based on the session's price range and the instrument's minimum tick increment, providing optimal resolution.
calculateEffectiveRows(configuredRows, dayHigh, dayLow)
Determines the optimal number of rows for the volume profile, either using the configured value or calculating dynamically based on price range and tick size
Parameters:
configuredRows (int) : User-specified number of rows (0 means auto-calculate)
dayHigh (float) : Highest price of the session
dayLow (float) : Lowest price of the session
Returns: The number of rows to use for the volume profile
debug(vp, position)
Helper function to write some information about the supplied SVP object to the screen in a table.
Parameters:
vp (Object) : The SVP object to debug
position (string) : The position.* to place the table. Defaults to position.bottom_center
getLowerTimeframe()
Depending on the timeframe of the chart, determines a lower timeframe to grab volume data from for the analysis
Returns: The timeframe string to fetch volume for
get(volumeProfile, lowerTimeframeHigh, lowerTimeframeLow, lowerTimeframeVolume, lowerTimeframeTime, lowerTimeframeSessionIsMarket)
Populated the provided SessionVolumeProfile object with vp data on the session.
Parameters:
volumeProfile (Object) : The SessionVolumeProfile object to populate
lowerTimeframeHigh (array) : The lower timeframe high values
lowerTimeframeLow (array) : The lower timeframe low values
lowerTimeframeVolume (array) : The lower timeframe volume values
lowerTimeframeTime (array) : The lower timeframe time values
lowerTimeframeSessionIsMarket (array) : The lower timeframe session.ismarket values (that are futures-friendly)
drawPriorValueAreas(todaySessionVolumeProfile, extendYesterdayOverToday, showLabels, labelSize, pocColor, pocStyle, pocWidth, vahlColor, vahlStyle, vahlWidth, vaColor)
Given a SessionVolumeProfile Object, will render the historical value areas for that object.
Parameters:
todaySessionVolumeProfile (Object) : The SessionVolumeProfile Object to draw
extendYesterdayOverToday (bool) : Defaults to true
showLabels (bool) : Defaults to true
labelSize (string) : Defaults to size.small
pocColor (color) : Defaults to #e500a4
pocStyle (string) : Defaults to line.style_solid
pocWidth (int) : Defaults to 1
vahlColor (color) : The color of the value area high/low lines. Defaults to #1592e6
vahlStyle (string) : The style of the value area high/low lines. Defaults to line.style_solid
vahlWidth (int) : The width of the value area high/low lines. Defaults to 1
vaColor (color) : The color of the value area background. Defaults to #00bbf911)
drawHistogram(volumeProfile, bgColor, showVolumeOnHistogram)
Given a SessionVolumeProfile object, will render the histogram for that object.
Parameters:
volumeProfile (Object) : The SessionVolumeProfile object to draw
bgColor (color) : The baseline color to use for the histogram. Defaults to #00bbf9
showVolumeOnHistogram (bool) : Show the volume amount on the histogram bars. Defaults to false.
Object
Object Contains all settings and calculated values for a Volume Profile Session analysis
Fields:
numberOfRows (series int) : Number of price levels to divide the range into. If set to 0, auto-calculates based on price range and tick size
valueAreaCoverage (series int) : Percentage of total volume to include in the Value Area (default 70%)
trackDevelopingVa (series bool) : Whether to calculate and display the Value Area as it develops during the session
valueAreaHigh (series float) : Upper boundary of the Value Area - price level containing specified % of volume
pointOfControl (series float) : Price level with the highest volume concentration
valueAreaLow (series float) : Lower boundary of the Value Area
startTime (series int) : Session start time in Unix timestamp format
endTime (series int) : Session end time in Unix timestamp format
dayHigh (series float) : Highest price of the session
dayLow (series float) : Lowest price of the session
step (series float) : Size of each price row (calculated as price range divided by number of rows)
pointOfControlLevel (series int) : Index of the row containing the Point of Control
valueAreaHighLevel (series int) : Index of the row containing the Value Area High
valueAreaLowLevel (series int) : Index of the row containing the Value Area Low
lastTime (series int) : Tracks the most recent timestamp processed
volumeRows (map) : Stores volume data for each price level row (key=row number, value=volume)
ltfSessionHighs (array) : Stores high prices from lower timeframe data
ltfSessionLows (array) : Stores low prices from lower timeframe data
ltfSessionVols (array) : Stores volume data from lower timeframe data

TPO IQ [TradingIQ]Hello Traders!
Introducing "TPO IQ"!
TPO IQ offers a Time Price Opportunity profile with several customization options that packs several related features to help traders navigate the generated profiles!
Features
TPO Profiles
Single Print identification
Initial Balance Identification
Can be anchored to timeframe change
Can be anchored to fixed time interval
Last profile detailed visuals
Customizable value area percentage
POC identification
Mid-point identification
TPO Profiles
A TPO profile is a market profile visualization that details how much time was spent at each price level throughout the time interval.
The image above further explains what a TPO Profile is!
Each letter corresponds to a candlestick. With this information, traders are able to visualize how much time was spent at each price area.
With customizable gradient colors, specifically in this example, blocks colored red are the earliest times in the profile, blocks colored green are in the beginning half of the time midpoint of the profile. Blue blocks represent the first half of the end of the time period, and purple blocks correspond to the end of the time period.
Please note that this form of TPO profile generation will only occur when the most recent profile uses less than 500 alphabet characters! If more than 500 characters are preset, TPO IQ will revert to using labels!
Initial Balance
TPO IQ also identifies the initial balance range and all alphabet characters that form within it!
The image above exemplifies this feature. The initial balance range is denoted by a a neon-blue line, with a blue circle showing the opening price. All characters within the initial balance range are highlighted blue, which is a feature that can be disabled with customizable colors.
POC
TPO IQ also identifies the point of control (POC) of the TPO Profile.
The point of control for the profile is labeled yellow by default, and shows where price spent the most time throughout the time period.
The image above shows the POC for the time period being identified by TPO IQ.
Value Area
TPO IQ also identifies the value area of the profile. A customizable percentage that is 70% by default, the value area of a TPO profile shows where price traded the majority of the time.
The image above further explains this feature. For this example, with the value area percentage being set to 70%, the value area high and value area low show the price zone that prices traded at 70% of the time throughout the profile.
TPO Midpoint
In addition to the POC, the TPO profile midpoint is also identified by TPO IQ.
The TPO midpoint simply corresponds to the middle price between the session's high and low!
Fixed Interval Mode
By default, TPO IQ recalculates every day, but this can also be changed to a customizable session time, such as 4 hours. If 4 hours is selected, then a new TPO profile will be generated every 4 hours.
However, in Fixed Interval mode, a TPO profile will be generated through a user-defined time range, such as 1300-1700.
In the image above, Fixed Interval mode is applied with a time range of 1300-1700 and, consequently, TPO IQ generates a new profile throughout every 1300-1700 time range!
This feature allows traders to specify time ranges of interest to generate TPO profiles for!
TPO Overview Label
The TPO overview label shows key statistics for the TPO profile generated throughout the trading session!
The "TPO Count" statistic shows how many alphabetical letters were generated for the profile, which is an adequate method to determine the session's volatility and price range.
The "Tick Levels" statistic shows how many tick levels were used to create the profile - another method to determine the volatility and price range of the session.
The "Top Letter" statistic shows which letter appears most throughout the profile. In this example, the top letter was "f", which means throughout creation of the profile, the letter "f" appeared the most!
And that's all for now!
If you have any feedback or new feature ideas for TPO IQ please feel free to share them with us!
Thank you traders!

Volume Footprint POC for Every CandleCalculating and plotting the Point of Control (POC) for every candle on a volume footprint chart can provide valuable insights for traders. Here are some interpretations and uses of this information:
1. Identify Key Price Levels
Highest Traded Volume: The POC represents the price level with the highest traded volume for each candle. This level often acts as a significant support or resistance level.
Confluence Zones: When multiple POCs align at similar price levels over several candles, it indicates strong support or resistance zones.
2. Gauge Market Sentiment
Buyer and Seller Activity: High volume at certain price levels can indicate where buyers and sellers are most active. A rising POC suggests stronger buying activity, while a falling POC suggests stronger selling activity.
Volume Profile: Analyzing the volume profile helps in understanding the distribution of traded volume across different price levels, providing insights into market sentiment and potential reversals.
3. Spot Trends and Reversals
Trend Continuation: Consistent upward or downward shifts in POC levels can indicate a trend continuation. Traders can use this information to stay in trending positions.
Reversal Signals: A sudden change in the POC direction may signal a potential reversal. This can be used to take profits or enter new positions.
4. Intraday Trading Strategies
Short-Term Trading: Intraday traders can use the POC to make informed decisions on entry and exit points. For example, buying near the POC during an uptrend or selling near the POC during a downtrend.
Scalping Opportunities: High-frequency traders can use shifts in the POC to scalp small profits from price movements around these key levels.
5. Volume-Based Indicators
Confirmation of Other Indicators: The POC can be used in conjunction with other technical indicators (e.g., moving averages, RSI) to confirm signals and improve trading accuracy.
Support and Resistance: Combining the POC with traditional support and resistance levels can provide a more comprehensive view of the market dynamics.
In summary, the Point of Control (POC) is a valuable tool for traders to understand market behavior, identify key levels, and make more informed trading decisions. If you have specific questions or need further details on how to use this information in your trading strategy, feel free to ask! 😊

Real-Time HTF Volume Footprint [BigBeluga]Real-time HTF Volume Footprint Profile is designed to provide a comprehensive view of higher timeframe volume profiles on your current chart. It overlays critical volume information from larger timeframes (like daily, weekly, or monthly) onto lower timeframe charts, helping you spot significant levels where volume is concentrated, acting as potential support or resistance.
🔵 Key Features:
HTF High and Low Zones: The indicator highlights the high and low of the chosen higher timeframe with clear zones, marking them with boxes. These zones help you see the broader market structure at a glance.
Volume Profile within HTF Range: Each higher timeframe range displays a volume profile, showing the distribution of volume at each price level. The most-traded price is highlighted in blue, known as the Point of Control (POC), indicating the price level with the highest activity.
Dynamic POC Option: Activate Dynamic POC to observe how the Point of Control shifts over time, giving insight into changing market interests and potential price direction.
Timeframe Flexibility: Select from daily, weekly, and monthly ranges (and more) to overlay their footprint profiles on your lower timeframe chart. This helps you tailor the indicator to the trading horizon that suits your strategy.
Info Table: Table shows a traders which timeframe is selected with last high and low of the selected timeframe
Visual Clarity with Custom Colors: The indicator uses subtle fills and distinct colors to ensure volume profile data integrates seamlessly into your chart without overwhelming other indicators or price data.
🔵 When to Use:
The HTF Volume Footprint Profile is essential for traders who want to bridge the gap between high-timeframe and intraday analysis. By visualizing HTF volume distribution on lower timeframes, this tool helps you:
Spot potential liquidity zones where price might react.
Identify support and resistance levels within HTF ranges.
Monitor PoC shifts that indicate changes in market behavior.
Track how current price aligns with significant volume clusters, providing a clear edge for volume-based strategies.
This indicator empowers traders to analyze lower timeframes with the context of higher timeframe volume profiles, providing a solid basis for identifying critical support and resistance levels shaped by large volume clusters. Whether you’re looking to spot liquidity zones or align your trades with broader market trends, HTF Volume Footprint Profile equips you with a strategic view.

First In, First Out Moving AverageThis script is a tool designed to calculate a First In, First Out (FIFO) Moving Average (MA) using traded prices and volumes. Additionally, it computes the Point of Control (PoC) from, which identifies the price levels (developing POC) with the maximum volume. The script is built to provide traders with a comprehensive analysis of price movements and volume dynamics, enhancing their understanding of market trends and potential entry/exit points.
Understanding the Mechanics:
The script maintains arrays for prices and volumes, where hypothetical trades are added.
For long trades (identified by red candles/bars), traded prices and volumes are appended to the respective arrays.
Short trades (identified by green candles/bars) trigger the removal of volumes from the arrays following the FIFO principle.
This process ensures the adjustment of partial or complete removal of oldest entries based on traded volume.
Analyzing Profit and Loss (PnL):
The script also tracks a hypothetical Profit and Loss (PnL) to understand whether the outcome is in red (negative) or green (positive) - color of the FIFO MA.
Interpreting the Results:
Once the script is applied to the chart, traders can observe the FIFO Moving Average (MA) and Point of Control (PoC) lines plotted.
By analyzing these lines and the associated colors (indicating positive or negative PnL), traders can make informed decisions regarding market trends, support/resistance levels and potential trading opportunities.
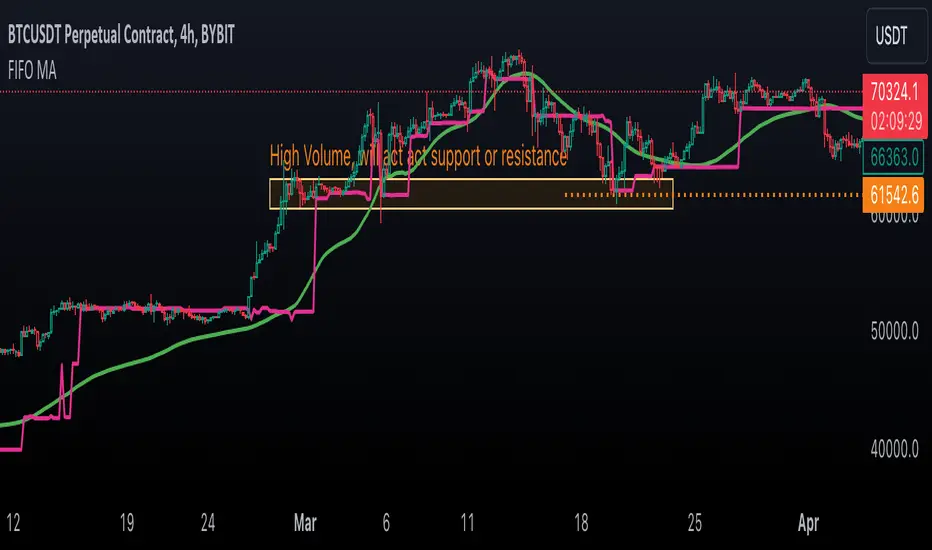
Volume Footprint Voids [BigBeluga]Volume Footprint Voids is a unique tool that uses lower timeframe calculation to plot different styles of single candle POC.
This indicator is very powerful for scalping and finding very precise entry and exits, spotting potential trapped traders, and more.
Unlike many other volume profiles, this aims to plot single candle profiles as well as their own footprints.
🔶 FEATURES
The script includes the following settings:
Windows: Plotting style and calculations
Coloring modes
Display modes
lower-timeframe calculations
🔶 CALCULATION
In the image above we can see how the script calculates each level position that will serve as a calculation process to see how much volume/closes there are within the levels.
In the image above, we can have a more clear example of how we count each candle close.
We use the prior screenshot as an example, after setting each level we will use the lower-timeframe input to measure the amount of closes within the ranges.
Depending on the lot size, the box will be larger or smaller, usually the POC will always have the highest box size.
NOTE: Size is the starting point, always from the low of the candle.
To find more voids, select a closer LTF to the current one you're using.
To find fewer voids, select a timeframe away from your current one.
Due to Pine Script limitations, we are only able to plot a certain amount of footprints, and we can't plot the whole history chart.
POC will be the largest block displayed, indicating the time point of control
Gray areas are closes above the average
Black are Void or imbalance that price will fill in the future, like FVG
The image above shows an incorrect size input that will lead to bad calculations, while on the other side, a correct size input that will lead to a clear vision and better calculation.
🔶 WINDOWS
The "▲▼" Mode will display delta buyers and delta sellers coloring with voids as black.
It also offers a gradient mode for a beautier visualization
The "Total Volume" mode will display the net volume within the lot size (closes within the levels).
This is useful to spot possible highest net volume within the same highest lot size.
The "POC + Gaps" will show both POC and Gaps as the highest block while all the rest will be considered as the smaller block.
This is useful to see where the highest lot were and if there are higher or lower imbalances within the candle
The last option "Gaps" will simply display the gaps as the highest block, while the POC as the lowest block.
This is useful to have a better view of the gaps areas
🔶 EXAMPLE
This is one of the most basic examples of how this script can be used. POC at the bottom creating a strong support area as price holds and creates higher voids gap that price fills while rising.
🔶 SETTINGS
Users have full control over the script, from colors to choosing the lower-timeframe inputs to disabling the lot size.
