PoC Migration Map [BackQuant]PoC Migration Map
A volume structure tool that builds a side volume profile, extracts rolling Points of Control (PoCs), and maps how those PoCs migrate through time so you can see where value is moving, how volume clusters shift, and how that aligns with trend regime.
What this is
This indicator combines a classic volume profile with a segmented PoC trail. It looks back over a configurable window, splits that window into bins by price, and shows you where volume has concentrated. On top of that, it slices the lookback into fixed bar segments, finds the local PoC in each segment, and plots those PoCs as a chain of nodes across the chart.
The result is a "migration map" of value:
A side volume profile that shows how volume is distributed over the recent price range.
A sequence of PoC nodes that show where local value has been accepted over time.
Lines that connect those PoCs to reveal the path of value migration.
Optional trend coloring based on EMA 12 and EMA 21, so each PoC also encodes trend regime.
Used together, this gives you a structural read on where the market has actually traded size, how "value" is moving, and whether that movement is aligned or fighting the current trend.
Core components
Lookback volume profile - a side histogram built from all closes and volumes in the chosen lookback window.
Segmented PoC trail - rolling PoCs computed over fixed bar segments, plotted as nodes in time.
Trend heatmap - optional color mapping of PoC nodes using EMA 12 versus EMA 21.
PoC labels - optional labels on every Nth PoC for easier reading and referencing.
How it works
1) Global lookback and binning
You choose:
Lookback Bars - how far back to collect data.
Number of Bins - how finely to split the price range.
The script:
Finds the highest high and lowest low in the lookback.
Computes the total price range and divides it into equal binCount slices.
Assigns each bar's close and volume into the appropriate price bin.
This creates a discretized volume distribution across the entire lookback.
2) Side volume profile
If "Show Side Profile" is enabled, a right-hand volume profile is drawn:
Each bin becomes a horizontal bar anchored at a configurable "Right Offset" from the current bar.
The horizontal width of each bar is proportional to that bin's volume relative to the maximum volume bin.
Optionally, volume values and percentages are printed inside the profile bars.
Color and transparency are controlled by:
Base Profile Color and its transparency.
A gradient that uses relative volume to modulate opacity between lower volume and higher volume bins.
Profile Width (%) - how wide the maximum bin can extend in bars.
This gives you an at-a-glance view of the volume landscape for the chosen lookback window.
3) Segmenting for PoC migration
To build the PoC trail, the lookback is divided into segments:
Bars per Segment - bars in each local cluster.
Number of Segments - how many segments you want to see back in time.
For each segment:
The script uses the same price bins and accumulates volume only from bars in that segment.
It finds the bin with the highest volume in that segment, which is the local PoC for that segment.
It sets the PoC price to the center of that bin.
It finds the "mid bar" of the segment and places the PoC node at that time on the chart.
This is repeated for each segment from older to newer, so you get a chain of PoCs that shows how local value has migrated over time.
4) Trend regime and color coding
The indicator precomputes:
EMA 12 (Fast).
EMA 21 (Slow).
For each PoC:
It samples EMA 12 and EMA 21 at the mid bar of that segment.
It computes a simple trend score as fast EMA minus slow EMA.
If trend heatmap is enabled, PoC nodes (and the lines between them) are colored by:
Trend Up Color if EMA 12 is above EMA 21.
Trend Down Color if EMA 12 is below EMA 21.
Trend Flat Color if they are roughly equal.
If the trend heatmap is disabled, PoC color is instead based on PoC migration:
If the current PoC is above the previous PoC, use the Up PoC Color.
If the current PoC is below the previous PoC, use the Down PoC Color.
If unchanged, use the Flat PoC Color.
5) Connecting PoCs and labels
Once PoC prices and times are known:
Each PoC is connected to the previous one with a dotted line, using the PoC's color.
Optional labels are placed next to every Nth PoC:
Label text uses a simple "PoC N" scheme.
Label background uses a configurable label background color.
Label border is colored by the PoC's own color for visual consistency.
This turns the PoCs into a visual path that can be read like a "value trajectory" across the chart.
What it plots
When fully enabled, you will see:
A right-sided volume profile for the chosen lookback window, built from volume by price.
Colored horizontal bars representing each price bin's relative volume.
Optional volume text showing each bin's volume and its percentage of the profile maximum.
A series of PoC nodes spaced across the chart at the mid point of each segment.
Dotted lines connecting those PoCs to show the migration path of value.
Optional PoC labels at each Nth node for easier reference.
Color-coding of PoCs and lines either by EMA 12 / 21 trend regime or by up/down PoC drift.
Reading PoC migration and market pressure
Side profile as a pressure map
The side profile shows where trading has been most active:
Thick, opaque bars represent high volume zones and possible high interest or acceptance areas.
Thin, faint bars represent low volume zones, potential rejection or transition areas.
When price trades near a high volume bin, the market is sitting on an area of prior acceptance and size.
When price moves quickly through low volume bins, it often does so with less friction.
This gives you a static map of where the market has been willing to do business within your lookback.
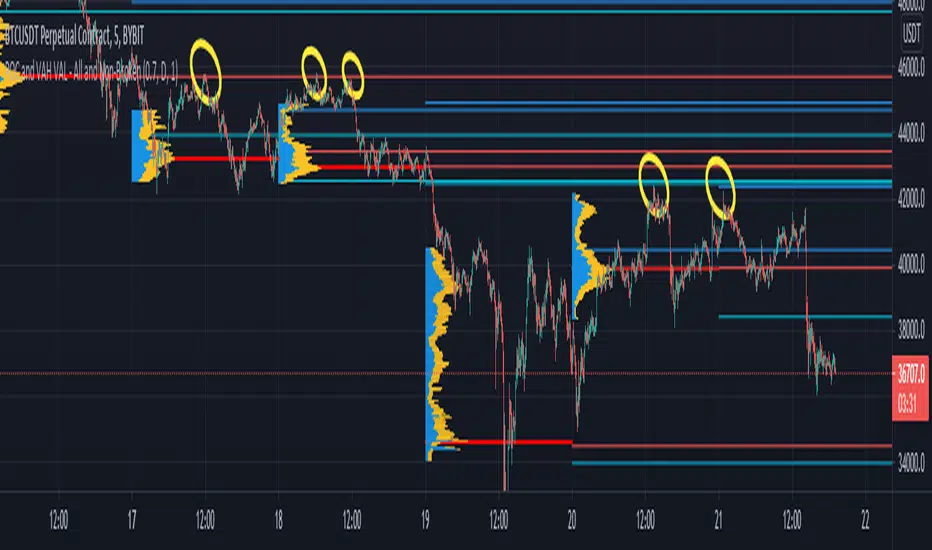
PoC trail as a value migration map
The PoC chain represents "where value has lived" over time:
An upward sloping PoC trail indicates value migrating higher. Buyers have been willing to transact at increasingly higher prices.
A downward sloping trail indicates value migrating lower and sellers pushing the center of mass down.
A flat or oscillating trail indicates balance or rotational behaviour, with no clear directional acceptance.
Taken together, you can interpret:
Side profile as "where the volume mass sits", a static pressure field.
PoC trail as "how that mass has moved", the dynamic path of value.
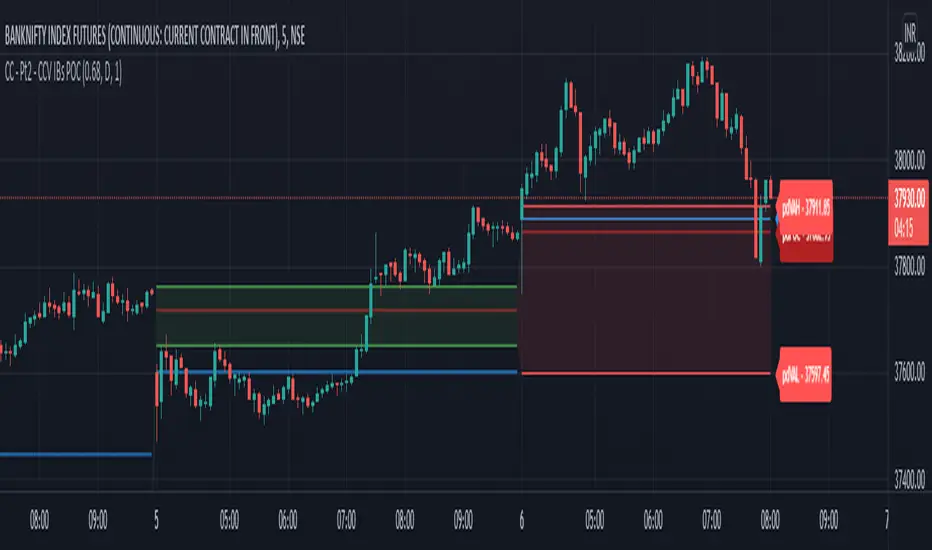
Trend heatmap as a regime overlay
When PoCs are colored by the EMA 12 / 21 spread:
Green PoCs mark segments where the faster EMA is above the slower EMA, that is, a local uptrend regime.
Red PoCs mark segments where the faster EMA is below the slower EMA, that is, a local downtrend regime.
Gray PoCs mark flat or ambiguous trend segments.
This lets you answer questions like:
"Is value migrating higher while the trend regime is also up?" (trend confirming value).
"Is value migrating higher but most PoCs are red?" (value against the prevailing trend).
"Has value started to roll over just as PoCs flip from green to red?" (early regime transition).
Key settings
General Settings
Lookback Bars - how many bars back to use for both the global volume profile and segment profiles.
Number of Bins - how many price bins to split the high to low range into.
Profile Settings
Show Side Profile - toggle the right-hand volume profile on or off.
Profile Width (%) - how wide the largest volume bar is allowed to be in terms of bars.
Base Profile Color - the starting color for profile bars, with transparency.
Show Volume Values - if enabled, print volume and percent for each non-zero bin.
Profile Text Color - color for volume text inside the profile.
PoC Migration Settings
Show PoC Migration - toggle the PoC trail plotting.
Bars per Segment - the number of bars contained in each segment.
Number of Segments - how many segments to build backwards from the current bar.
Horizontal Spacing (bars) - spacing between PoC nodes when drawn. (Used to separate PoCs horizontally.)
Label Every Nth PoC - draw labels at every Nth PoC (0 or 1 to suppress labels).
Right Offset (bars) - horizontal offset to anchor the side profile on the right.
Up PoC Color - color used when a PoC is higher than the previous one, if trend heatmap is off.
Down PoC Color - color used when a PoC is lower than the previous one, if trend heatmap is off.
Flat PoC Color - color used when the PoC is unchanged, if trend heatmap is off.
PoC Label Background - background color for PoC labels.
Trend Heatmap Settings
Color PoCs By Trend (EMA 12 / 21) - when enabled, overrides simple up/down coloring and uses EMA-based trend colors.
Fast EMA - length for the fast EMA.
Slow EMA - length for the slow EMA.
Trend Up Color - color for PoCs in a bullish EMA regime.
Trend Down Color - color for PoCs in a bearish EMA regime.
Trend Flat Color - color for neutral or flat EMA regimes.
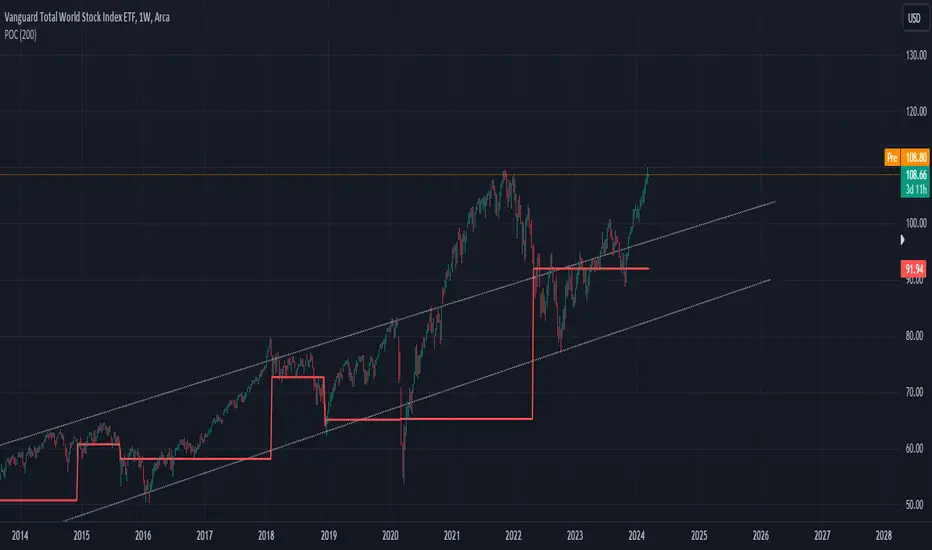
Trading applications
1) Value migration and trend confirmation
Use the PoC path to see if value is following price or lagging it:
In a healthy uptrend, price, PoCs, and trend regime should all lean higher.
In a weakening trend, price may still move up, but PoCs flatten or start drifting lower, suggesting fewer participants are accepting the new highs.
In a downtrend, persistent downward PoC migration confirms that sellers are winning the value battle.
2) Identifying acceptance and rejection zones
Combine the side profile with PoC locations:
High volume bins near clustered PoCs mark strong acceptance zones, good areas to watch for re-tests and decision points.
PoCs that quickly jump across low volume areas can indicate rejection and fast repricing between value zones.
High volume zones with mixed PoC colors may signal balance or prolonged negotiation.
3) Structuring entries and exits
Use the map to refine trade location:
Fade trades against value migration are higher risk unless you see clear signs of exhaustion or regime change.
Pullbacks into prior PoC zones in the direction of the current PoC slope can offer higher quality entries.
Stops placed beyond major accepted zones (clusters of PoCs and high volume bins) are less likely to be hit by random noise.
4) Regime transitions
Watch how PoCs behave as the EMA regime changes:
A flip in EMA 12 versus EMA 21, coupled with a turn in PoC slope, is a strong signal that value is beginning to move with the new trend.
If EMAs flip but PoC migration does not follow, the trend signal may be early or false.
A weakening PoC path (lower highs in PoCs) while trend colors are still green can warn of a late-stage trend.
Best practices
Start with a moderate lookback such as 200 to 300 bars and a moderate bin count such as 20 to 40. Too many bins can make the profile overly granular and sparse.
Align "Bars per Segment" with your trading horizon. For example, 5 to 10 bars for intraday, 10 to 20 bars for swing.
Use the profile and PoC trail as structural context rather than as a direct buy or sell signal. Combine with your existing setups for timing.
Pay attention to clusters of PoCs at similar prices. Those are areas where the market has repeatedly accepted value, and they often matter on future tests.
Notes
This is a structural volume tool, not a complete trading system. It does not manage execution, position sizing or risk management. Use it to understand:
Where the bulk of trading has occurred in your chosen window.
How the center of volume has migrated over time.
Whether that migration is aligned with or fighting the current trend regime.
By turning PoC evolution into a visible path and adding a trend-aware heatmap, the PoC Migration Map makes it easier to see how value has been moving, where the market is likely to feel "heavy" or "light", and how that structure fits into your trading decisions.
Pine Script® göstergesi