Pivot Points HL DetailedThis indicator marks important turning points in the market, showing you the most recent swing high and swing low as horizontal lines across the chart. Each pivot line has a price label where it formed and a small counter that updates whenever the market touches that level again. The line’s color reflects the prevailing trend, determined by an EMA filter, so you can quickly see if the level is likely acting as support or resistance in the current market environment.
It works by scanning recent bars for points where price made a local high higher than several bars to its left and right, or a local low lower than several bars to its left and right. These pivots are calculated directly from price action using the ta.pivothigh and ta.pivotlow functions. Once identified, the level is tracked in real time, counting every time price crosses it. The EMA provides context: if price is above the EMA, the market is considered in an uptrend and the pivots are colored to match; if price is below, they’re marked as part of a downtrend.
For traders, this offers a clean way to see where the market has turned before and whether those levels are still relevant. Strong levels often show multiple touches, which can be used for entries, exits, or risk management. The built-in alert system can notify you when price approaches either the most recent swing high or swing low, so you can react quickly.
This tool can be applied in almost any market — forex, stocks, indices, commodities, or crypto — because price tends to respect recent swing points regardless of the asset class. It tends to be most effective in liquid markets, where many traders see and react to the same key levels, and it’s valuable in both trending and ranging conditions, though the EMA trend filter adds extra clarity when the market is moving directionally.
"pivot" için komut dosyalarını ara
Next Day Key Levels [Auto-Pivot Suite] RobustNext Day Key Levels
Automatically plot key levels (Floor Pivots) for the next U.S. trading day, with smart session detection.
What does this script do?
Automatically detects the most recent completed U.S. regular trading session (9:30 AM–4:00 PM Eastern) and plots all classic Floor Pivot levels for the next trading day.
Handles Mondays and holidays: Always uses the most recent session’s data, so Friday’s values are shown on Monday, and holidays are skipped seamlessly.
Works in both pre-market and after-hours—levels appear for the next session at the right time.
Levels plotted:
Previous Session High (H)
Previous Session Low (L)
Previous Session Close (C)
Pivot (P)
Resistance 1, 2, 3 (R1, R2, R3)
Support 1, 2, 3 (S1, S2, S3)
How it works
Monitors each bar and tracks session highs/lows/close only during regular market hours.
At the close of each session (4:00 PM ET), saves these values.
In pre-market (before 9:30 AM ET) and after-hours (after 4:00 PM ET), automatically plots levels based on the last completed session—always the correct session, even on Mondays and after holidays.
Why is it better?
No clutter: Only one set of levels per day, drawn cleanly.
Accurate pivots for every next U.S. session.
Zero manual setup: Add to any U.S. ticker, on any intraday timeframe.
Features
Works across all U.S. stocks and ETFs.
Plots and labels all levels with color coding for quick reference.
Designed for intraday and short-term trading strategies.
Handles time zone and market session edge cases automatically.
How to use
Add the indicator to any U.S. equity or ETF chart (15m–1h timeframes recommended).
Levels will appear automatically in pre-market or after the market closes, always for the next session.
Trade with confidence using automatic, accurate pivots and support/resistance levels.
Developed by .
For questions or feedback, leave a comment below!

Long-Only Opening Range Breakout (ORB) with Pivot PointsIntraday Trading Strategy: Long-Only Opening Range Breakout (ORB) with Pivot Points
Background:
Opening Range Breakout (ORB) is a popular long-only trading strategy that capitalizes on the early morning volatility in financial markets. It's based on the idea that the initial price movements during the first few minutes or hours of the trading day can set the tone for the rest of the session. The strategy involves identifying a price range within which the asset trades during the opening period and then taking long positions when the price breaks out to the upside of this range.
Pivot Points are a widely used technical indicator in trading. They represent potential support and resistance levels based on the previous day's price action. Pivot points are calculated using the previous day's high, low, and close prices and can help traders identify key price levels for making trading decisions.
How to Use the Script:
Initialization: This script is written in Pine Script, a domain-specific language for trading strategies on the TradingView platform. To use this script, you need to have access to TradingView.
Apply the Script: You can do this by adding it to your favorites, then selecting the script in the indicators list under favorites or by searching for it by name under community scripts.
Customize Settings: The script allows you to customize various settings through the TradingView interface. These settings include:
Opening Session: You can set the time frame for the opening session.
Max Trades per Day: Specify the maximum number of long trades allowed per trading day.
Initial Stop Loss Type: Choose between using a percentage-based stop loss or the previous candles low for stop loss calculations.
Stop Loss Percentage: If you select the percentage-based stop loss, specify the percentage of the entry price for the stop loss.
Backtesting Start and End Time: Set the time frame for backtesting the strategy.
Strategy Signals:
The script will display pivot points in blue (R1, R2, R3, R4, R5) and half-pivot points in gray (R0.5, R1.5, R2.5, R3.5, R4.5) on your chart.
The green line represents the opening range.
The script generates long (buy) signals based on specific conditions:
---The open price is below the opening range high (h).
---The current high price is above the opening range high.
---Pivot point R1 is above the opening range high.
---It's a long-only strategy designed to capture upside breakouts.
---It also respects the maximum number of long trades per day.
The script manages long positions, calculates stop losses, and adjusts long positions according to the defined rules.
Trailing Stop Mechanism
The script incorporates a dynamic trailing stop mechanism designed to protect and maximize profits for long positions. Here's how it works:
1. Initialization:
The script allows you to choose between two types of initial stop loss:
---Percentage-based: This option sets the initial stop loss as a percentage of the entry price.
---Previous day's low: This option sets the initial stop loss at the previous day's low.
2. Setting the Initial Stop Loss (`sl_long0`):
The initial stop loss (`sl_long0`) is calculated based on the chosen method:
---If "Percentage" is selected, it calculates the stop loss as a percentage of the entry price.
---If "Previous Low" is selected, it sets the stop loss at the previous day's low.
3. Dynamic Trailing Stop (`trail_long`):
The script then monitors price movements and uses a dynamic trailing stop mechanism (`trail_long`) to adjust the stop loss level for long positions.
If the current high price rises above certain pivot point levels, the trailing stop is adjusted upwards to lock in profits.
The trailing stop levels are calculated based on pivot points (`r1`, `r2`, `r3`, etc.) and half-pivot points (`r0.5`, `r1.5`, `r2.5`, etc.).
The script checks if the high price surpasses these levels and, if so, updates the trailing stop accordingly.
This dynamic trailing stop allows traders to secure profits while giving the position room to potentially capture additional gains.
4. Final Stop Loss (`sl_long`):
The script calculates the final stop loss level (`sl_long`) based on the following logic:
---If no position is open (`pos == 0`), the stop loss is set to zero, indicating there is no active stop loss.
---If a position is open (`pos == 1`), the script calculates the maximum of the initial stop loss (`sl_long0`) and the dynamic trailing stop (`trail_long`).
---This ensures that the stop loss is always set to the more conservative of the two values to protect profits.
5. Plotting the Stop Loss:
The script plots the stop loss level on the chart using the `plot` function.
It will only display the stop loss level if there is an open position (`pos == 1`) and it's not a new trading day (`not newday`).
The stop loss level is shown in red on the chart.
By combining an initial stop loss with a dynamic trailing stop based on pivot points and half-pivot points, the script aims to provide a comprehensive risk management mechanism for long positions. This allows traders to lock in profits as the price moves in their favor while maintaining a safeguard against adverse price movements.
End of Day (EOD) Exit:
The script includes an "End of Day" (EOD) exit mechanism to automatically close any open positions at the end of the trading day. This feature is designed to manage and control positions when the trading day comes to a close. Here's how it works:
1. Initialization:
At the beginning of each trading day, the script identifies a new trading day using the `is_newbar('D')` condition.
When a new trading day begins, the `newday` variable becomes `true`, indicating the start of a new trading session.
2. Plotting the "End of Day" Signal:
The script includes a plot on the chart to visually represent the "End of Day" signal. This is done using the `plot` function.
The plot is labeled "DayEnd" and is displayed as a comment on the chart. It signifies the EOD point.
3. EOD Exit Condition:
When the script detects that a new trading day has started (`newday == true`), it triggers the EOD exit condition.
At this point, the script proceeds to close all open positions that may have been active during the trading day.
4. Closing Open Positions:
The `strategy.close_all` function is used to close all open positions when the EOD exit condition is met.
This function ensures that any remaining long positions are exited, regardless of their current profit or loss.
The function also includes an `alert_message`, which can be customized to send an alert or notification when positions are closed at EOD.
Purpose of EOD Exit
The "End of Day" exit mechanism serves several essential purposes in the trading strategy:
Risk Management: It helps manage risk by ensuring that positions are not left open overnight when markets can experience increased volatility.
Capital Preservation: Closing positions at EOD can help preserve trading capital by avoiding potential adverse overnight price movements.
Rule-Based Exit: The EOD exit is rule-based and automatic, ensuring that it is consistently applied without emotions or manual intervention.
Scalability: It allows the strategy to be applied to various markets and timeframes where EOD exits may be appropriate.
By incorporating an EOD exit mechanism, the script provides a comprehensive approach to managing positions, taking profits, and minimizing risk as each trading day concludes. This can be especially important in volatile markets like cryptocurrencies, where overnight price swings can be significant.
Backtesting: The script includes a backtesting feature that allows you to test the strategy's performance over historical data. Set the start and end times for backtesting to see how the long-only strategy would have performed in the past.
Trade Execution: If you choose to use this script for live trading, make sure you understand the risks involved. It's essential to set up proper risk management, including position sizing and stop loss orders.
Monitoring: Monitor the long-only strategy's performance over time and be prepared to make adjustments as market conditions change.
Disclaimer: Trading carries a risk of capital loss. This script is provided for educational purposes and as a starting point for your own long-only strategy development. Always do your own research and consider seeking advice from a qualified financial professional before making trading decisions.

Opening Range & Daily and Weekly PivotsThis script is for a combination of two indicators: an Opening Range Breakout (ORB) indicator and a daily/weekly high/low pivot indicator. The ORB indicator displays the opening range (the high and low of the first X minutes of the trading day, where X is a user-defined parameter) as two lines on the chart. If the price closes above the ORB high, the script triggers an alert with the message "Price has broken above the opening range." Similarly, if the price closes below the ORB low, the script triggers an alert with the message "Price has broken below the opening range."
The daily/weekly high/low pivot indicator plots the previous day's high and low as well as the previous week's high and low. If the current price closes above yesterday's high or last week's high, the script triggers an alert with the messages "We are now trading higher than the previous daily high" and "We are now trading higher than the last week high", respectively. If the current price closes below yesterday's low or last week's low, the script triggers an alert with the messages "We are now trading lower than the previous daily low" and "We are now trading lower than the last week low", respectively.
In addition to the visual representation on the chart, the script also triggers alerts when the price crosses any of these levels. These alerts are intended to help traders make decisions about entering or exiting trades based on the price action relative to key levels of support and resistance.

Price Pivots for NSE Index & F&O StocksPrice Pivots for NSE Index & F&O Stocks
What is this Indicator?
• This indicator calculates the price range a Stock or Index can move in a Day, Week or Month.
Advantages of this Indicator
• This is a Leading indicator, not Dynamic or Repaint.
• Helps to identify the tight range of price movement.
• Can easily identify the Options strike price.
• The levels are more reliable and authentic than Gann Square of 9 Levels.
• Develops a discipline in placing Targets.
Disadvantages of this Indicator
• The indicator is specifically made for National Stock Exchange of India (NSE) listed index and stocks.
• The indicator is calculated only for index NIFTY, BANKNIFTY, FINNIFTY, MIDCPNIFTY and Stocks listed in Futures and Options.
• The indicator shows nothing for other indexes and stocks other than above mentioned.
• The data need to be entered manually.
• The data need to be updated manually when the F&O listed stocks are updated.
Who to use?
Highly beneficial for Day Traders, it can be used for Swing and Positions as well.
What timeframe to use?
• Any timeframe.
• The highlighted levels in Red and Green will not show correct levels in 1 minute timeframe.
• 5min is recommended for Day Traders.
When to use?
• Wait for proper swing to form.
• Recommended to avoid 1st 1 hour or market open, that is 9.15am to 10.15 or 10.30am.
• Within this time a proper swing will be formed.
How to use?
Entry
• Enter when the Price reach closer to the Blue line.
• Enter Long when the Price takes a pullback or breakout at the Red lines.
Exit
• Exit position when the Price reach closer to the Red lines in Long positions.
What are the Lines?
Gray Lines:
• Every lines with price labels are the Strike Prices in the Option Chain from NSE website.
• Price moves from 1 Strike Price level to another.
• The dashed lines are average levels of 2 Strike Prices.
Red & Green Lines:
• The Red and Green Lines will appear only after the first 1 hour.
• The levels are calculated based on the 1st 1 hour.
• Red Lines are important Resistance levels, these are strong Bearish reversal points. It is also a breakout level, this need to be figured out from the past levels, trend, percentage change and consolidation.
• Green Lines are important Support levels, these are strong Bullish reversal points. It is also a breakdown level, this need to be figured out from the past levels, trend, percentage change and consolidation.
What are the Labels?
• First Number: Price of that level.
• Numbers in (): Percentage change and Change of price from LTP(Last Traded Price) to that Level.
How to use?
Entry:
• Enter when price is closer to the Red or Green lines.
• Enter after considering previous Swing and Trend.
• Note the 50% of previous Swing.
• Enter Short when price reverse from each level.
• If 50% of swing and the pivot level is closer it can be a good entry.
Exit:
• Use the logic of Entry, each level can be a target.
• Exit when price is closer to the Red or Green lines.
Indicator Menu
Source
• Custom: Enter the price manually after choosing the Source as Custom to show the Pivots at that price.
• LTP: Pivot is calculated based on Last Traded Price.
• Day Open: Pivot is calculated based on current day opening price.
• PD Close: Pivot is calculated based on previous day closing price.
• PD HL2: Pivot is calculated based on previous day average of High and Low.
• PD HLC3: Pivot is calculated based on previous day average of High, Low and Close.
"Time (IST) (Vertical)"
• This is a marker of every 1 hour.
• Usually major price movement happen between previous day last 1 hour (2:15 pm) to today first 1 hour (10:15 pm).
• Two swings can happen between first 2 hour of current day.
• At the end of the day last 1 hour from 2.15 pm another important movement will happen.
• Usually rest of the time won't show any interesting movement.
To the Users
• Certain symbols may show the levels as a single line. For such symbols choose a different Source or Timeframe from the indicator menu.
• Please inform if any of the Symbol's price levels don't react to the pivots, include the Symbol a well.
• Also inform if you notice any wrong values, errors or abnormal behavior in the indicator.
• Feel free to suggest or adding new features and options.
General Tips
• It is good if Stock trend is same as that of NIFTY trend.
• Lots of indicators creates lots of confusion.
• Keep the chart simple and clean.
• Buy Low and Sell High.
• Master averages or 50%.
• Previous Swing High and Swing Low are crucial.

Fibonacci Pivot Points UltimateA better version of the Fibonacci Pivot Points . I added 100, 138, 161 and 200 support/resistance pivots , lookback function and now you can use daily/weekly/monthly/yearly fibonacci pivot points .

MTF Pivots Zones [tanayroy]Dear Fellow Traders,
I only publish scripts that I use and found good for my trading. Pivots are my favorite indicator. I use daily, weekly, monthly, quarterly, and yearly pivots levels. multiple pivot zones are very strong levels and I like to watch these levels for possible price action.
But when I include all pivots levels at a time, my charts get too clumsy. To see price action properly, you need a clean chart. And when we trade we want to see only important levels within the price horizon.
To resolve this, I created this script, which shows important levels within my display option. I control the display option with 14 periods ATR and a multiplier to adjust the display levels.
The following chart displays levels within 14 ATR * 0.5 multipliers. As the price progress, it will automatically add levels and delete levels that do not come within this option.
What levels are included?
I have used traditional pivot calculation and included Daily, Weekly, Monthly, Quarterly, and Yearly pivots with high and low.
What options are available?
You can replace the yearly timeframe with your desired time frame and can adjust the ATR multiplier to increase or decrease display levels.
Use this in 5m, 15m, or 1H chart or any timeframe below Daily.
Please like, share, and comment.

Pivot Squeeze IndicatorThe Pivot Squeeze Indicator is an oscillator that identifies when markets are "squeezed" between recent pivot highs and lows, then signals when they're ready to make their next big move.
How it Works
The indicator calculates the percentage distance between the current price and the most recent pivot high vs. pivot low. When this distance gets compressed (small), the market is "squeezed" and building energy. When it expands rapidly, you get your breakout signal.
The indicator adapts to current market volatility using four different modes:
- ATR-Based
- Bollinger Bands
- Keltner Channels
- Fixed %
What to Look For
🟠 Orange Background = Squeeze Zone
Market is compressed between recent pivots
Low volatility, building pressure
🟢 Green Breakout = Bullish Signal
Price breaking out above recent highs
Momentum shifting upward
Time to look for long opportunities
🔴 Red Breakout = Bearish Signal
Price breaking down below recent lows
Momentum shifting downward
Time to look for short opportunities
Using Histogram Colors:
Green bars = Bullish territory (closer to recent highs)
Red bars = Bearish territory (closer to recent lows)
Orange bars = Squeeze conditions (compressed between pivots)
Using MA Line:
When Histogram bars cross below or above MA Line in opposite direction, it might be good time to exit.
Default Settings: ATR-based thresholds with 14-period lookback - works great out of the box, but feel free to experiment with the different threshold modes to find what works best for your trading style! Recommended to use with other indicators to confirm signals

Pivot Highs/Lows with Bar CountsWhat does the indicator do?
This indicator adds labels to a chart at swing (a.k.a., "pivot") highs and lows. Each label may contain a date, the closing price at the swing, the number of bars since the last swing in the same direction, and the number of bars from the last swing in the opposite direction. A table is also added to the chart that shows the average, min, and max number of bars between swings.
OK, but how do I use it?
Many markets -- especially sideways-moving ones -- commonly cycle between swing highs and lows at regular time intervals. By measuring the number of bars between highs and lows -- both same-sided swings (i.e., H-H and L-L) and opposite-sided swings (i.e., H-L and L-H) -- you can then project the averages of those bar counts from the last high or low swing to make predictions about where the next swing high or low should occur. Note that this indicator does not make the projection for you. You have to determine which swing you want to project from and then use the bar counts from the indicator to draw a line, place a label, etc.
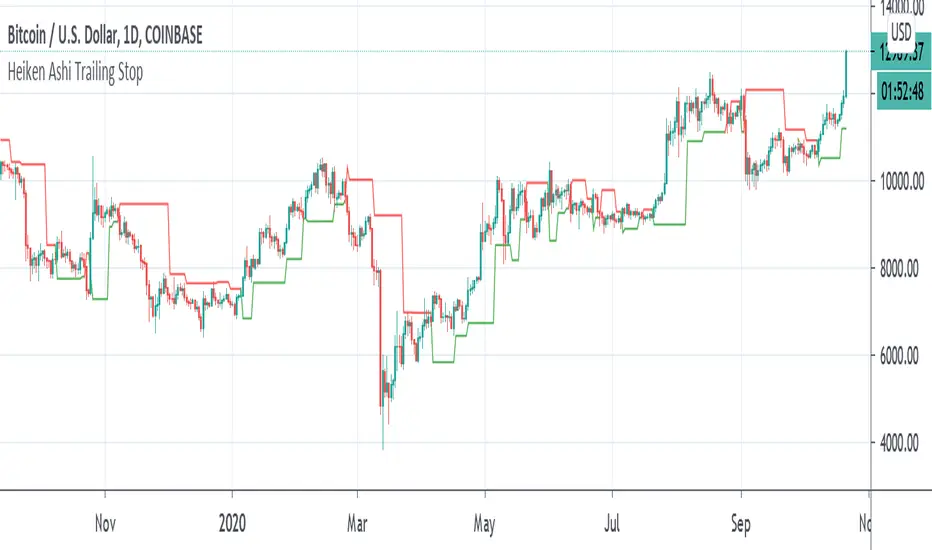
Example: Chart of BTC/USD
The indicator shows pivot highs and lows with bar counts, and it displays a table of stats on those pivots.
If you focus on the center section of the chart, you can see that prices were moving in a sideways channel with very regular highs and lows. This indicator counts the bars between these pivots, and you could have used those counts to predict when the next high or low may have occurred.
The bar counts do not work as well on the more recent section of the chart because there are no regularly time swings.

3 Pivots Interpolation BreakoutsI designed the '3 Pivots Interpolation Breakouts' indicator to intuitively identify breakout opportunities using pivot points. This tool stems from my need to anticipate market direction and capitalize on breakouts. It uses a line interpolated from three pivot highs or lows to forecast upcoming breakouts. This offers a straightforward way to visualize potential bullish and bearish breakouts with color-coded extrapolations. The aim is to simplify breakout detection, enhancing your trading strategy with precise, actionable insights.
Simple Pivot Points with dots, not lines(manual setup)1. Why Pivot Point is popular?
Because unlike most indicators, it's not lagging! It is forward-looking, it's real-time, it's just right there.
2. Why this script is created?
I don't like many indicator lines crossing my screen everywhere, just as some Pivot Point indicators did. So I wrote this script to keep my screen as clean/neat as possible.
3. MUST READ before you add this “manual setup” version to your chart
I'm a E-mini S&P500 future trader, and I found the close prices on Daily chart is different from the ones on lower timeframe occasionally.
So I asked some TradingView staff and the reply was:
The closing price of a daily bar on TradingView is based on a Settle price from the exchange. The exchanges, at times, send this value before the close of the trading day, which leads to the situation when the price for daily-based resolutions does not change after receiving this Settle value, while the price changes still occur at smaller resolutions, since the construction of intraday bars is based on the actual trades produced.
So, in order to use the most accurate price,
I replace the D(representing the Daily timeframe) with 1440(representing 1440 minutes) in the script, making the daily Pivot Points more accurate.
The default Pivot Points are from daly timeframe.
You have to set the "last week/month close" in the "script settings" MANUALLY to ensure the weekly/monthly Pivot Point is the most accurate.
4. What if you don't want to go through the hassle of setting it up manually?
If the tickers you trade doesn't have the occasional problems as mentioned before, you can search the "Simple Pivot Points with dots, not lines(automatic setup)" version which uses the default close prices on each timeframe.
--------
If you want the dots stay a little further from your bars, you can adjust the "offset" parameter in the code. The larger the number is, the further the dot stays.
Pivots High-Low Screener & AlertsHi fellow traders ,
Pleased to share a Pivot High - Low Screener.
The script uses the TV inbuilt Pivot function.
It Screens 25 tickers default set, these can be modified in the input dialog box.
All you need to do is attach to any chart and set the periodicity or the resolution of the chart to your desired alert() frequency requirement.
Now go to the input settings icon of the script and set your Pivot right and left parameters!
Set the alert from the menu as usual click - Any alert() function call and bingo you are done!!
Similarily change the chart periodicity to the next timeframe and set the next alert.
No more opening multiple charts and setting individual time consuming alerts().
You will get concatenated alerts or summary alerts for your tickers.
Track 25tickers with a single alert for each timeframe(Supports 40 tickers).
Happy trading with TV..

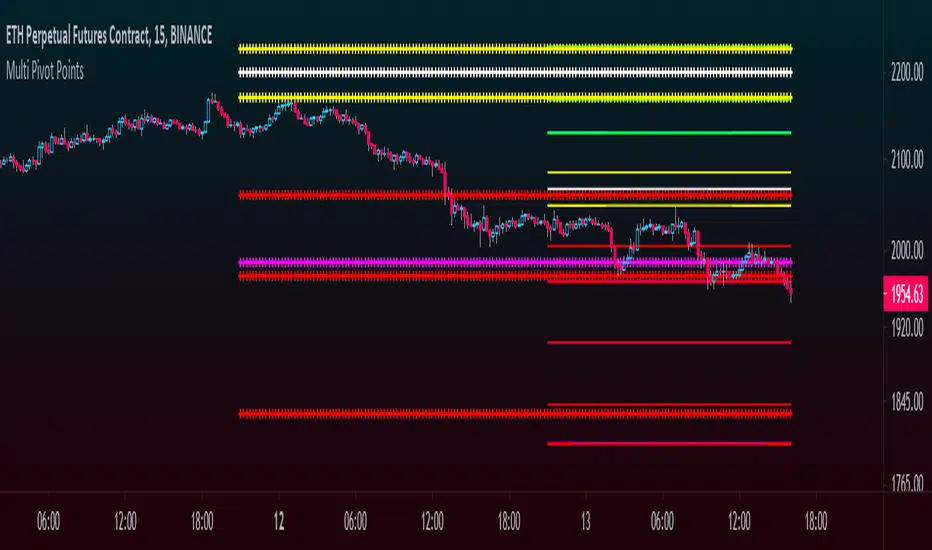
Multi Pivot Points - All in One IndicatorThis multi pivot indicator allows you to plot and overlay different types of pivot points:
-Fibonacci
-Floor Traders
-Camarilla
In addition to this, you can plot pivots from two different timeframes of your choice, for example the daily & weekly pivots, monthly & yearly, etc.
-You can select the linestyle, width and color of each pivot type for easy recognition of levels.
-You can choose to show only the current set of pivots or you can show the historical levels too.
This indicator allows traders to search for high probability targets or support and resistance zones via the confluence of both different pivot types and timeframes. These levels can work for either day traders or longer terms traders.
In the case of Fibonacci levels these can be chosen in the menu.
Enjoy!!
Daily Pivot (Traditional)Hello all
-
This code is for daily pivot points, support and resistance with pivot labels and value.
simple code with no bugs.
this code use previous day values on online chat and current day values on offline chat.
pivot values are placed on right side, so no overlapping with other values.
.
.
Thank you Trading View for other educational script to make this possible.

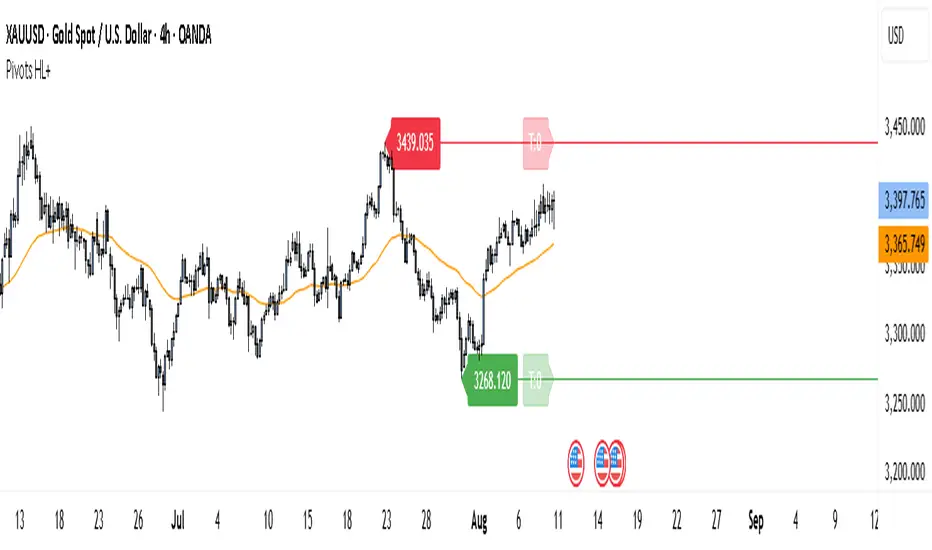
Floor Pivots With CPR and Camarilla 3 LevelsThis script plots floor pivots with the central pivot range and camarilla R3/S3 pivots, to spot with ease the Golden Pivot Zone (GPZ). As described in the book *Secret of a pivot Boss* by Franklin Ochoa, the Golden Pivot Zone occurs when R3 or S3 pivot from the Camarilla Equation or from lies within the central pivot range. This combination can be simply profitable.
A bearish GPZ occurs when R3 of the Camarilla Equation is mixed within the central pivot range, therefore we should look for sells in that zone.
A bullish GPZ occurs when S3 of the Camarilla Equation is mixed within the central pivot range, therefore we should look for buys in that zone.
Here are some examples on Gold
Good luck !
Ps* i got part of the code from @cristian.d script

Heiken Ashi Pivot Breakout Trailing StopThis is a heiken ashi pivot based trailing stop for breakout entries and exits. It's possibly related to the Swing Index System by Welles Wilder or an alternative to it that I came up with, in case determining the swings on the Accumulative Swing Index is too much of a burden. It is believed that the ASI uses the calculation of heiken ashi in its formula. This does not use the ASI as a bottom indicator in the chart but instead uses the heiken ashi bars on the top of the chart to objectively find the swing pivots . These swings pivots act as support and resistance and can be used to confirm the start of a breakout or the end of one.
Suppose you find a chart pattern or setup, such as divergence or a pennant in the RSI , a pattern on the ASI, and/or on the chart, or the end of an elliot wave , etc and want to confirm a strong breakout and ride it to the end. Many trailing stops won't be able to confirm the beginning or would last too long or not long enough to exit out of one. On an uptrend, when the price breaks below the last swing low pivot , it can confirm the end of the breakout. On a downtrend, when the price breaks above the last swing high pivot , it can confirm the end of the breakout.
This trailing stop is not meant to replace trend following ones. The swing pivots can vary yet the price can still continue at an uptrend whereas this heiken ashi pivot based trailing stop exits as soon as it goes above or below the last resistance point. These swing points can end up being too close for trend following but can work well for breakout trading. The bigger the chart pattern or breakout, the more reliable the exit signal will be in my opinion. This is an experimental idea that I came up with from trying to interpret the ASI.
RVC-Trade-With-Pivot-LevelsHow to Use PIVOT Levels for Trading
Always remember ->: *Trade with trend*
About script:
1. Daily and Weekly close above Pivot Level.
-- Sentiment is highly positive. Pivot Level acts as strong support.
2. Daily Close above Pivot and Weekly Close Below Pivot
-- Sentiment is positive.Weekly Pivot Level may act as strong resistance.
3. Daily close below Pivot and weekly close above Pivot
-- Sentiment is negative but weekly Pivot Level can acts as strong support.
4. Daily and Weekly Close below Pivot Level
-- Sentiment is highly Negative. Pivot Level acts as strong resistance.
BUY/SELL -- ENTRY
BUY ABOVE 23.6% UPWARD
IF Trend is positive and price cross and sustains above 23.6%(R1) upside, then it will be entry from BUY perspective.
If R1 is entry, R2/R3/R4/R5 ... will be targets.
SELL Below 23.6% Downward
IF Trend is negative and price cross and sustains below 23.6%(S1) downside, then it will be entry from SELL perspective.
If S1 is Sell side entry, S2/S3/S4/S5 will be targets.
Before taking ENTRY on BUY or SELL Side, please know your risk levels, Stop Loss and trade EXECUTION process.
Finally:
My view is my view and remains with me only. Once you accept it and trade it, it becomes your view. So credit or blame all yours.:)

Pivot TrendHello Traders,
Another original idea is here with you. Actualy I can say that it's a breakout strategy that uses multiple Pivot Point's averages.
How it works?
- it finds the Pivot Points, you can set the length as you want
- it gets averages of Pivot Highs and Pivot Lows, you can set the number of Pivot Points to be included
- it compares the current closing price with averages of Pivot Highs and Pivot Lows
- if both are positive or negative then trend changes
You have two options:
- Pivot Point Period => is the length that is used to find Pivot Points. means it checks left/right bars if it's Pivot Point (4 by default)
- Number of PP to check => is the number of Pivot Points that the script finds and calculates the averages (3 by default)
An Example with the settings Pivot Point Period = 5 and Number of PP to check = 2
Play with settings as you wish. Comments are welcome, together we can improve it ;)
Enjoy!
Pivot Point + MidPointsTraditional floor pivots with additional lines in between the s/r levels called Mid Points
If the Pivot Points are used as entering at s/r levels, you can use the Mid Points to scale out of a position or place Sl's behind
Alto Basso Swing Pivots + Barry Support Resistance Levels2 indicators, 1 script: swing pivots and Barry support resistance levels
Alto
high swing pivot
Basso
low swing pivot
Dal Segno
lookback period length for swing pivots
Barry Length
length for support resistance calculation
--------------------------------------------------------------------------------------------------------------------------------------------------------------------------------------------
Use swing pivots for confirmation of new structure levels on short term
Barry support resistance levels in proximity to standard pivots or Fibonacci levels may indicate greater strength
credit to BacktestRookies and likebike
stay ♯
Example: Dal Segno 13, Barry Length 21

VWAP From Pivots Lows and Highs
This script starts automatically VWAP from pivot lows and highs.
Parameter allows you to enable up to 3 VWAP (default).
If you use 3, the VWAP from the last three pivots point will be drawn.
If you use 1, just the last pivot point will be used.
You can also just enable VWAPs starting from pivot lows or highs.
Let me know if there are any problems.

Pivot Triangles High/Low (anchored)“It is used to detect price action pivots. You can choose the number of candles before a pivot is marked. It is useful for identifying trends.”

[DarkTrader] Pivot Point HeatmapThe indicator calculates pivot points using price data from different timeframes such as 12M, 1M, 1W, 3D, and 1D. For each timeframe, it retrieves the high, low, open, and close prices of the previous bar. The pivot point is calculated as the average of the high, low, and close prices, which provides a central level where market sentiment may shift. This calculation is repeated for each timeframe, ensuring a multi-dimensional view of potential interest zones.
Importance of Pivot Points :
Pivot points are essential tools in technical analysis, providing traders with levels that act as potential support and resistance zones. These zones help identify price levels where reversals or breakouts are more likely to occur.
Visual Representation :
The core feature of this indicator is its ability to visualize pivot points as a heatmap on the chart. Instead of showing just the latest pivot points, it tracks the historical pivot swipe, providing a dynamic view of how price interacts with these key levels. Each pivot point is represented by a line, color-coded based on its position relative to other points, creating a gradient effect that highlights the most critical price areas.
Customization Options :
Traders can customize various aspects of the heatmap to suit their preferences. The indicator offers options to toggle pivot swipe history, enabling traders to either focus on the most recent price interactions or consider how price has behaved over time. The background color and pivot line colors are fully customizable, making it easy to match the heatmap with your chart's theme or emphasize certain price levels.
Detecting Sweeps and Price Interaction :
Another important feature is the detection of price interactions with pivot levels. If the current bar's high and low cross a pivot point, it signals that the pivot level has been "swept" by price action, potentially indicating a change in market sentiment. The indicator either extends the line if the pivot point remains relevant or deletes it if price has broken through. This dynamic adjustment helps traders stay updated on which pivot levels are still valid.
