Wave Trend OscillatorThis is a very standard version of the Wave Trend Oscillator.
The Channel and Average values are displayed as lines, most people display them as areas.
The Channel and Average difference is displayed as a histogram, most people display it as a tiny noisy area.
I was unable to find a standard version of the Wave Trend Oscillator.
The colorful hyped up versions of this indicator made me feel like a clown while using them.
I have essentially copied the style of the MACD with this indicator, to keep things professional.
With this WTO, you can change the timeframe and source.
You can also change the histogram average length and multiplier, making it usable.
The typical way that people display the histogram is completely unusable and just for appearance.
Now it does a decent job showing when the momentum of the WTO's downward movement is slowing down, just like how the MACD histogram works.
This indicator is essentially a normalized MACD, though they are calculated differently.
The Wave Trend Oscillator is useful for spotting/monitoring changed in mid-trend momentum.
In my experience, divergence in this indicator is a strong signal.
If the MACD is too slow for you, then this is a great alternative; without all the extra fluff people usually add to it.
"oscillator" için komut dosyalarını ara

Trigonometric On Balance Volume (OBV) OscillatorLove volume analysis but it's hard for you to implement a simple strategy by it?
Use OBV.
Is OBV still not quite as it should be for you to get it in your trading system?
Use OBV Oscillator.
Does OBV Oscillator give you too many false signals and when you smooth it, it lags by a ton?
Then this indicator is the answer to your problem.
Introducing the Trigonometric OBV Oscillator.
The Trigonometric OBV Oscillator or "Trig OBV" for short, uses an old, but uniquely extremely reliable mathematical formula to smooth the OBV, while eliminating more than 95% of its false signals (noises) and keeping with the real direction of the trend without introducing any lags.
It is very responsive, predictive even to some degree, very reliable, and keeps you out of false trades (like false breakouts, sudden changes in the price, etc).
To go long: wait until the white line crosses up the purple line and continues in that direction.
To go short: wait until the white line crosses down the blue line and continues in that direction.
To exit, do the opposite.
Better to be used with a baseline filter such as Kaufman's moving average.
Use it and let me know what you think about it.

The Bayesian Q OscillatorFirst of all the biggest thanks to @tista and @KivancOzbilgic for publishing their open source public indicators Bayesian BBSMA + nQQE Oscillator. And a mighty round of applause for @MarkBench for once again being my superhero pinescript guy that puts these awesome combination Ideas and ES stradegies in my head together. Now let me go ahead and explain what we have here.
I am gonna call it the Bayesian Q Oscillator I suppose. The goal of the script is to solve an issue both indicators on their own suffer from. QQE signals are not new and often the problem has always been false signals for them. They are good for scalping but the difference between a quality move and a small to nearly nonexistent move following a signal is not so clear. Kivanc made his normalized version to help reduce this problem by adding colors to his histogram type verision that would essentially represent if price was a trending move or in a ranging structure. As you can see I have kept this Idea but instead opted for lines as the oscillator. two yellow line (default color) is a ranging sideways area and when there is red or green it is trending up or down. I wanted to take this to the next level with combining the Bayesian probability oscillator that tista put together.
The Bayesian indicator is the opposite for its issue as it is a probability indicator that shows which candle or price movement is more likely to come next. Red rising means possibly down move soon and green means up soon. I will not go into the complex details of this indicator but will suggest others take a look at his and others to understand the idea behind them. The point I am driving at is that it show probabilities or likelyhood without the most effecient signal device to match it. This original was line form and now it is background filled colors.
The idea. is that you can potentially get some stronger and more accurate reversal signals with these two paired together. when you see a sell signal or cross with the towering or rising red... maybe it is a good jump potentially. The same for green. At the same time it is a double added filter effect from just having yellow represent it is ranging... but now if you get a buy signal (example) and have yellow lines (example) along wi5h a red rising or mountain color background... it not only is an indication of ranging, but also that there is potentially even a counter move coming based on the probabilities. Also if you get into a good trade and see dual yellow qqe crosses with no color represented by the bayesian background... it is possible it might only be noise.
I have found them to work decently in the 1 hour timframe. Let me know your experience.
I hope everyone takes a look at the originals to understand them. Full credit goes to those guys for this to be here. Let me know how it is working out for you.
Here are the original links.
bayesian
Normalized QQE

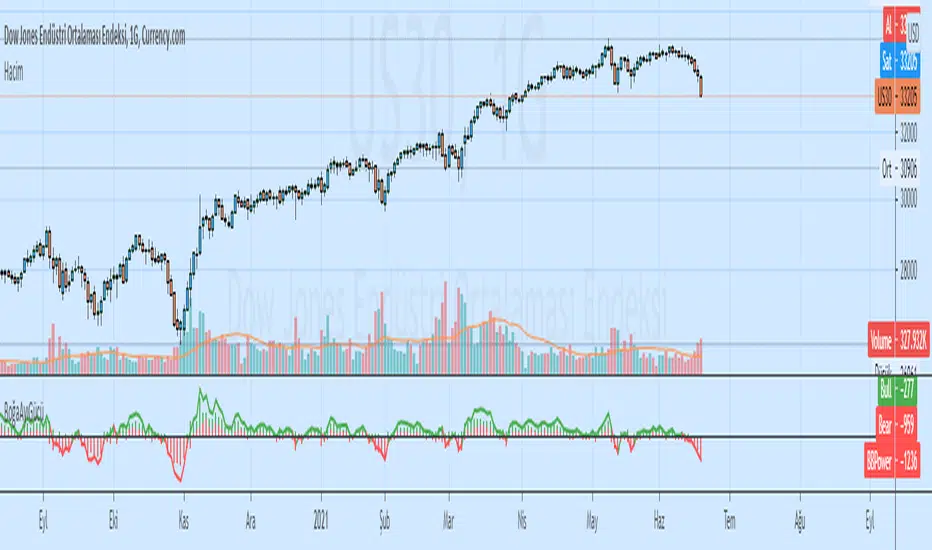
Elder Ray Bull and Bear Power OscillatorsElder Ray Bull and Bear Power Oscillators
Tradingview Screener Bull Bear Power(BBPOWER)
OVERVIEW
The Bull and Bear Power oscillators developed by Dr Alexander Elder attempt to measure the power of buyers (bulls) and sellers (bears) to push prices above and below the consensus of value. The primary principles on which Elder based the oscillator are:
The highest price displays the maximum buyer’s power within the day.
The lowest price displays the maximum seller’s power within the day.
The moving average can be construed as a price agreement between buyers and sellers for a given time period.
The Bulls/Bears power balance is important since changes in this balance can signal the early stages of a potential trend reversal.
CALCULATION
Elder uses a 13-day exponential moving average (EMA) to indicate the consensus market value.
Bull Power is calculated by subtracting the 13-day EMA from the day’s high.
Bear Power is derived by subtracting the 13-day EMA from the day’s low.
TRADING WITH THE ELDER RAY BULL AND BEAR POWER OSCILLATORS
BULL POWER
Where a currency uptrend is sustained to the point that maximum prices move above the EMA the Bull Power histogram will be greater than zero. As price maximums accelerate to greater levels (above the EMA) during the rising trend histogram bars will increase in height above the zero line showing the increased buying strength during the period.
BEAR POWER
Where a currency downtrend is sustained to the point that minimum prices move below the EMA the Bear Power histogram will be less than zero. As price minimums accelerate to lower levels (below the EMA) during the falling trend histogram bars will increase in height below the zero line showing increased selling strength during the period.
TRADING SIGNALS
It is important for traders to use the Elder Ray oscillators in conjunction with the EMA overlay over the price chart (typically as per period being analysed) to give additional context to the signals. Sell signals are given if Bull Power is above zero and there is a bearish divergence in the Bull Power histogram or if the Bull Power histogram is above zero and falling.
Buy signals are given if Bear Power is below zero and there is a bullish divergence in the Bear Power histogram or if the Bear Power histogram is below zero and rising. It is extremely important for traders to only trade in the above scenarios if the direction of the trend indicated by the slope of the EMA on the price chart is in the direction of their trade when the signal is given (or shortly after).
CEF (Chaos Theory Regime Oscillator)Chaos Theory Regime Oscillator
This script is open to the community.
What is it?
The CEF (Chaos Entropy Fusion) Oscillator is a next-generation "Regime Analysis" tool designed to replace traditional, static momentum indicators like RSI or MACD. Unlike standard oscillators that only look at price changes, CEF analyzes the "character" of the market using concepts from Chaos Theory and Information Theory.
It combines advanced mathematical engines (Hurst Exponent, Entropy, VHF) to determine whether a price movement is a real trend or just random noise. It uses a novel "Adaptive Normalization" technique to solve scaling problems common in advanced indicators, ensuring the oscillator remains sensitive yet stable across all assets (Crypto, Forex, Stocks).
What It Promises:
Intelligent Filtering: Filters out false signals in sideways (volatile) markets using the Hurst Base to measure trend continuity.
Dynamic Adaptation: Automatically adapts to volatility. Thanks to trend memory, it doesn't get stuck at the top during uptrends or at the bottom during downtrends.
No Repainting: All signals are confirmed at the close of the bar. They don't repaint or disappear.
What It Doesn't Promise:
Magic Wand: It's a powerful analytical tool, not a crystal ball. It determines the regime, but risk management is up to the investor.
Late-Free Holy Grail: It deliberately uses advanced correction algorithms (WMA/SMA) to provide stability and filter out noise. Speed is sacrificed for accuracy.
Which Concepts Are Used for Which Purpose?
CEF is built on proven mathematical concepts while creating a unique "Fusion" mechanism. These are not used in their standard forms, but are remixed to create a consensus engine:
Hurst Exponent: Used to measure the "memory" of the time series. Tells the oscillator whether there is a probability of the trend continuing or reversing to the mean.
Vertical Horizontal Filter (VHF): Determines whether the market is in a trend phase or a congestion phase.
Shannon Entropy: Measures the "irregularity" or "unpredictability" of market data to adjust signal sensitivity.
Adaptive Normalization (Key Innovation): Instead of fixed limits, the oscillator dynamically scales itself based on recent historical performance, solving the "flat line" problem seen in other advanced scripts.
Original Methodology and Community Contribution
This algorithm is a custom synthesis of public domain mathematical theories. The author's unique contribution lies in the "Adaptive Normalization Logic" and the custom weighting of Chaos components to filter momentum.
Why Public Domain? Standard indicators (RSI, MACD) were developed for the markets of the 1970s. Modern markets require modern mathematics. This script is presented to the community to demonstrate how Regime Analysis can improve trading decisions compared to static tools.
What Problems Does It Solve?
Problem 1: The "Stagnant Market" Trap
CEF Solution: While the RSI gives false signals in a sideways market, CEF's Hurst/VHF filter suppresses the signal, essentially making the histogram "off" (or weak) during noise.
Problem 2: The "Overbought" Fallacy
CEF Solution: In a strong trend (Pump/Dump), traditional oscillators get stuck at 100 or 0. CEF uses "Trend Memory" to understand that an overbought price is not a reversal signal but a sign of trend strength, and keeps the signal green/red instead of reversing it prematurely. Problem 3: Visual Confusion
CEF Solution: Instead of multiple lines, it presents a single, color-coded histogram featuring only prominent "Smart Circles" at high-probability reversal points.
Automation Ready: Custom Alerts
CEF is designed for both manual trading and automation.
Smart Buy/Sell Circles: Visual signals that only appear when trend filters are aligned with momentum reversals.
Deviation Labels: Automatically detects and labels structural divergences between price and entropy.
Disclaimer: This indicator is for educational purposes only. Past performance does not guarantee future results. Always practice appropriate risk management.

Volume Delta Oscillator with Divergence█ OVERVIEW
The Volume Delta Oscillator with Divergence is a technical indicator designed for the TradingView platform, helping traders identify potential trend reversal points and market momentum shifts through volume delta analysis and divergence detection. The indicator combines a smoothed volume delta oscillator with moving average-based signals, overbought/oversold levels, and divergence visualization, enhanced by configurable gradients and alerts for quick decision-making.
█ CONCEPT
The core idea of the indicator is to measure net buying or selling pressure through volume delta, smooth it for greater clarity, and detect divergences between price action and the oscillator. The indicator does not use external data, making it a compromise but practical tool for analyzing market dynamics based on available price and volume data. It provides insights into market dynamics, overbought/oversold conditions, and potential reversal points, with an attractive visual presentation.
█ WHY USE IT?
- Divergence detection: Identifies bullish and bearish divergences between price and the oscillator, signaling potential reversals.
- Volume delta analysis: Measures cumulative volume delta to assess buying/selling pressure, expressed as a percentage for cross-market comparability.
- Signal generation: Creates buy/sell signals based on overbought/oversold level crossovers, zero line crossovers, and moving average zero line crossovers.
- Visual clarity: Uses gradients, fills, and dynamic colors for intuitive chart analysis.
- Flexibility: Numerous settings allow adaptation to various markets (e.g., forex, crypto, stocks) and trading strategies.
█ HOW IT WORKS?
- Volume delta calculation: Computes net buying/selling pressure per candle as volume * (close - open) / (high - low), aggregated over a specified period (Cumulative Delta Length).
- Smoothing: Applies an EMA (Smoothing Length) to the cumulative delta percentage, creating a smoother oscillator (Delta Oscillator).
- Moving Average: Calculates an SMA (Moving Average Length) of the smoothed delta for trend confirmation (Moving Average (SMA)).
- Divergence detection: Identifies bullish and bearish divergences by comparing price and oscillator pivot highs/lows within a specified range (Pivot Length).
- Normalization: Delta is expressed as a percentage of total volume, ensuring consistency across instruments and timeframes.
- Signals: Generates signals for:
Crossing the oversold level upward (buy) or overbought level downward (sell).
Crossing the zero line by the oscillator or moving average (buy/sell).
Bullish/bearish divergences, marked with labels.
- Visualization: Draws the oscillator and moving average with dynamic colors, gradient fills, and transparent bands and labels, with configurable overbought/oversold levels.
- Alerts: Built-in alerts for divergence detection, overbought/oversold crossovers, and zero line crossovers (both oscillator and moving average).
█ SETTINGS AND CUSTOMIZATION
- Cumulative Delta Length: Period for aggregating volume delta (default: 14).
- Smoothing Length (EMA): EMA length for smoothing the delta oscillator (default: 2). Higher values smooth the signal but reduce the number of generated signals.
- Moving Average Length (SMA): SMA length for the moving average line (default: 40). Higher values allow SMA to be analyzed as a trend indicator, but require adjusting overbought/oversold levels for MA, as longer MA oscillates less.
- Pivot Length (Left/Right): Number of candles for detecting pivot highs/lows in divergence calculations (default: 2). Higher values can reduce noise but introduce a delay equal to the set value.
- Overbought/Oversold Levels: Thresholds for the oscillator (default: 18/-18) and for the moving average (default: 10/-10). For the moving average, no arrows appear; instead, the band changes color from gray to green (oversold) or red (overbought), which can strengthen entry signals for delta.
- Signal Type: Select signals to display: "Overbought/Oversold", "Zero Line", "MA Zero Line", "All", or "None" (default: Overbought/Oversold).
- Colors and gradients: Customize colors for bullish/bearish oscillator, moving average, zero line, overbought/oversold levels, and divergence labels.
- Transparency: Adjust gradient fill transparency (default: 70) and band/label transparency (default: 40) for consistent appearance.
- Visualizations: Enable/disable the moving average, gradients for zero/overbought/oversold levels, and gradient fills.
█ USAGE EXAMPLES
- Momentum analysis: Observe the delta oscillator above 0 for bullish momentum or below 0 for bearish momentum. The moving average (SMA), being smoothed, reacts more slowly and can confirm trend direction as a noise filter.
- Reversal signals: Look for buy triangles when the oscillator crosses the oversold level upward, especially when the moving average is below the MA oversold threshold. Similarly, look for sell triangles when crossing the overbought level downward, with the moving average above the MA overbought threshold. Divergence labels (bullish/bearish) indicate potential reversals.
- Divergence trading: Use bullish divergence labels (green) for potential buy opportunities and bearish labels (red) for sell opportunities, especially when confirmed by price action or other indicators.
- Customization: Adjust the cumulative delta length, smoothing, and moving average length to specific instruments and timeframes to minimize false signals.
█ NOTES FOR USERS
- Combine the indicator with other tools, such as Fibonacci levels, RSI, or pivot points, to increase accuracy.
- Test different settings for cumulative delta length, smoothing, and moving average length on your chosen instrument and timeframe to find optimal values.

Heikin-Ashi Mean Reversion Oscillator [Alpha Extract]The Heikin-Ashi Mean Reversion Oscillator combines the smoothing characteristics of Heikin-Ashi candlesticks with mean reversion analysis to create a powerful momentum oscillator. This indicator applies Heikin-Ashi transformation twice - first to price data and then to the oscillator itself - resulting in smoother signals while maintaining sensitivity to trend changes and potential reversal points.
🔶 CALCULATION
Heikin-Ashi Transformation: Converts regular OHLC data to smoothed Heikin-Ashi values
Component Analysis: Calculates trend strength, body deviation, and price deviation from mean
Oscillator Construction: Combines components with weighted formula (40% trend strength, 30% body deviation, 30% price deviation)
Double Smoothing: Applies EMA smoothing and second Heikin-Ashi transformation to oscillator values
Signal Generation: Identifies trend changes and crossover points with overbought/oversold levels
Formula:
HA Close = (Open + High + Low + Close) / 4
HA Open = (Previous HA Open + Previous HA Close) / 2
Trend Strength = Normalized consecutive HA candle direction
Body Deviation = (HA Body - Mean Body) / Mean Body * 100
Price Deviation = ((HA Close - Price Mean) / Price Mean * 100) / Standard Deviation * 25
Raw Oscillator = (Trend Strength * 0.4) + (Body Deviation * 0.3) + (Price Deviation * 0.3)
Final Oscillator = 50 + (EMA(Raw Oscillator) / 2)
🔶 DETAILS Visual Features:
Heikin-Ashi Candlesticks: Smoothed oscillator representation using HA transformation with vibrant teal/red coloring
Overbought/Oversold Zones: Horizontal lines at customizable levels (default 70/30) with background highlighting in extreme zones
Moving Averages: Optional fast and slow EMA overlays for additional trend confirmation
Signal Dashboard: Real-time table showing current oscillator status (Overbought/Oversold/Bullish/Bearish) and buy/sell signals
Reference Lines: Middle line at 50 (neutral), with 0 and 100 boundaries for range visualization
Interpretation:
Above 70: Overbought conditions, potential selling opportunity
Below 30: Oversold conditions, potential buying opportunity
Bullish HA Candles: Green/teal candles indicate upward momentum
Bearish HA Candles: Red candles indicate downward momentum
MA Crossovers: Fast EMA above slow EMA suggests bullish momentum, below suggests bearish momentum
Zone Exits: Price moving out of extreme zones (above 70 or below 30) often signals trend continuation
🔶 EXAMPLES
Mean Reversion Signals: When the oscillator reaches extreme levels (above 70 or below 30), it identifies potential reversal points where price may revert to the mean.
Example: Oscillator reaching 80+ levels during strong uptrends often precedes short-term pullbacks, providing profit-taking opportunities.
Trend Change Detection: The double Heikin-Ashi smoothing helps identify genuine trend changes while filtering out market noise.
Example: When oscillator HA candles change from red to teal after oversold readings, this confirms potential trend reversal from bearish to bullish.
Moving Average Confirmation: Fast and slow EMA crossovers on the oscillator provide additional confirmation of momentum shifts.
Example: Fast EMA crossing above slow EMA while oscillator is rising from oversold levels provides strong bullish confirmation signal.
Dashboard Signal Integration: The real-time dashboard combines oscillator status with directional signals for quick decision-making.
Example: Dashboard showing "Oversold" status with "BUY" signal when HA candles turn bullish provides clear entry timing.
🔶 SETTINGS
Customization Options:
Calculation: Oscillator period (default 14), smoothing factor (1-50, default 2)
Levels: Overbought threshold (50-100, default 70), oversold threshold (0-50, default 30)
Moving Averages: Toggle display, fast EMA length (default 9), slow EMA length (default 21)
Visual Enhancements: Show/hide signal dashboard, customizable table position
Alert Conditions: Oversold bounce, overbought reversal, bullish/bearish MA crossovers
The Heikin-Ashi Mean Reversion Oscillator provides traders with a sophisticated momentum tool that combines the smoothing benefits of Heikin-Ashi analysis with mean reversion principles. The double transformation process creates cleaner signals while the integrated dashboard and multiple confirmation methods help traders identify high-probability entry and exit points during both trending and ranging market conditions.

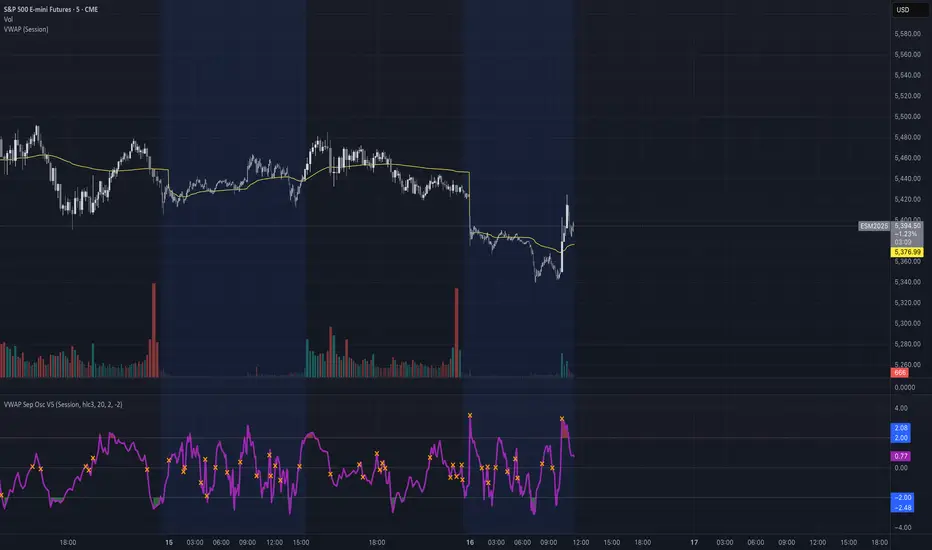
VWAP Separation Oscillator V5 (No Arrows)Okay, here is a draft description you can adapt for your TradingView publication. It starts from the basics and explains the concepts behind the indicator and how to interpret its visual elements.
VWAP Separation Oscillator
Summary
This indicator provides a normalized view of how far the current price has deviated from its Volume-Weighted Average Price (VWAP), helping traders identify potentially overbought or oversold conditions relative to recent VWAP dynamics. It calculates the price separation from VWAP and expresses it in terms of standard deviations (a Z-score), making it easier to gauge the statistical significance of the deviation.
Core Concepts Explained
What is VWAP?
VWAP stands for Volume-Weighted Average Price. It's a trading benchmark calculated by taking the total dollar value traded for every transaction (price multiplied by volume) and dividing it by the total shares traded for the day (or other chosen period).
Unlike a simple moving average, VWAP gives more weight to price levels where more volume occurred. Many institutional traders use it as a reference point for execution quality.
This indicator allows you to choose the "Anchor Period" (Session, Week, Month, etc.) which determines when the VWAP calculation resets.
What is VWAP Separation?
P
rice doesn't always stay at the VWAP; it naturally fluctuates above and below it.
"VWAP Separation" is simply the difference between the current price (Source) and the calculated VWAP value (Separation = Price - VWAP). A positive separation means the price is above VWAP; negative means below.
How Standard Deviation is Used:
While knowing the separation is useful, its significance can vary wildly between different stocks or market conditions. A $1 separation might be huge for one stock but tiny for another.
Standard Deviation is a statistical measure of how spread out data points are from their average. In this indicator, we calculate the standard deviation of the VWAP Separation over a specified Lookback Length. This tells us how volatile or dispersed the separation has been recently.
The Oscillator Line (Z-Score):
The main purple (or Green/Red) line plotted by this indicator is the Z-score of the VWAP Separation.
Formula conceptually: Oscillator Value = (Current Separation - Average Separation) / Standard Deviation of Separation
Interpretation: It tells you how many standard deviations the current separation is away from the average separation over the lookback period.
A value of +2.0 means the current separation is 2 standard deviations higher (more extended to the upside) than the average separation.
A value of -1.5 means the current separation is 1.5 standard deviations lower (more extended to the downside) than the average separation.
This normalization makes it easier to compare readings across different assets or timeframes and to define consistent thresholds for "extreme" deviations.
Visual Elements Explained
Oscillator Line: The primary line showing the Z-score value (explained above). Can optionally be colored Green/Red based on its slope (rising/falling).
Overbought Line (Solid Red): A user-defined level (default: 2.0). When the oscillator moves above this line, it suggests the price deviation above VWAP is statistically significant compared to recent history.
Oversold Line (Solid Green): A user-defined level (default: -2.0). When the oscillator moves below this line, it suggests the price deviation below VWAP is statistically significant compared to recent history.
Overbought/Oversold Zone Fills (Transparent Red/Green): These shaded areas appear only when the oscillator line enters the respective Overbought or Oversold territory (defined by the OB/OS Lines), visually highlighting these periods.
Zero Line (Dotted Gray): Represents the point where the current VWAP separation is exactly equal to the average VWAP separation over the lookback period. Crossings indicate shifts relative to this mean.
Zero Cross Markers (Orange 'X'): Small 'x' marks plotted directly on the oscillator line whenever it crosses the Zero Line, pinpointing these moments.
Potential Usage / Interpretation
Identifying Extremes: High positive values (above OB Level) or low negative values (below OS Level) can suggest the price move relative to VWAP might be over-extended and potentially due for a pause or pullback. Look for the oscillator turning back from these extremes.
Spotting Divergences: Look for discrepancies between price action and the oscillator.
Bearish Divergence: Price makes a new high, but the oscillator makes a lower high (often in the OB zone). Suggests weakening upside momentum relative to VWAP dynamics.
Bullish Divergence: Price makes a new low, but the oscillator makes a higher low (often in the OS zone). Suggests weakening downside momentum relative to VWAP dynamics.
Context is Key: This oscillator measures deviation from a specific benchmark (VWAP). Its interpretation should always be done within the context of the overall market trend, price structure (support/resistance), volume analysis, and potentially other confirming indicators.
Disclaimer: This indicator is a tool for analysis, not a standalone trading system. It does not provide financial advice. Always use risk management.
Settings Overview
Anchor Period: Determines how often the VWAP calculation resets (Session, Week, Month, etc.).
Source: The price data used for the separation calculation (default: hlc3).
Lookback Length: The number of bars used to calculate the average and standard deviation of the separation, influencing the oscillator's responsiveness.
Overbought/Oversold Levels: User-defined thresholds for identifying extreme Z-score values.
Color Oscillator Line: Option to color the oscillator line based on whether it's rising or falling.
Chande Momentum Oscillator StrategyThe Chande Momentum Oscillator (CMO) Trading Strategy is based on the momentum oscillator developed by Tushar Chande in 1994. The CMO measures the momentum of a security by calculating the difference between the sum of recent gains and losses over a defined period. The indicator offers a means to identify overbought and oversold conditions, making it suitable for developing mean-reversion trading strategies (Chande, 1997).
Strategy Overview:
Calculation of the Chande Momentum Oscillator (CMO):
The CMO formula considers both positive and negative price changes over a defined period (commonly set to 9 days) and computes the net momentum as a percentage.
The formula is as follows:
CMO=100×(Sum of Gains−Sum of Losses)(Sum of Gains+Sum of Losses)
CMO=100×(Sum of Gains+Sum of Losses)(Sum of Gains−Sum of Losses)
This approach distinguishes the CMO from other oscillators like the RSI by using both price gains and losses in the numerator, providing a more symmetrical measurement of momentum (Chande, 1997).
Entry Condition:
The strategy opens a long position when the CMO value falls below -50, signaling an oversold condition where the price may revert to the mean. Research in mean-reversion, such as by Poterba and Summers (1988), supports this approach, highlighting that prices often revert after sharp movements due to overreaction in the markets.
Exit Conditions:
The strategy closes the long position when:
The CMO rises above 50, indicating that the price may have become overbought and may not provide further upside potential.
Alternatively, the position is closed 5 days after the buy signal is triggered, regardless of the CMO value, to ensure a timely exit even if the momentum signal does not reach the predefined level.
This exit strategy aligns with the concept of time-based exits, reducing the risk of prolonged exposure to adverse price movements (Fama, 1970).
Scientific Basis and Rationale:
Momentum and Mean-Reversion:
The strategy leverages the well-known phenomenon of mean-reversion in financial markets. According to research by Jegadeesh and Titman (1993), prices tend to revert to their mean over short periods following strong movements, creating opportunities for traders to profit from temporary deviations.
The CMO captures this mean-reversion behavior by monitoring extreme price conditions. When the CMO reaches oversold levels (below -50), it signals potential buying opportunities, whereas crossing overbought levels (above 50) indicates conditions for selling.
Market Efficiency and Overreaction:
The strategy takes advantage of behavioral inefficiencies and overreactions, which are often the drivers behind sharp price movements (Shiller, 2003). By identifying these extreme conditions with the CMO, the strategy aims to capitalize on the market’s tendency to correct itself when price deviations become too large.
Optimization and Parameter Selection:
The 9-day period used for the CMO calculation is a widely accepted timeframe that balances responsiveness and noise reduction, making it suitable for capturing short-term price fluctuations. Studies in technical analysis suggest that oscillators optimized over such periods are effective in detecting reversals (Murphy, 1999).
Performance and Backtesting:
The strategy's effectiveness is confirmed through backtesting, which shows that using the CMO as a mean-reversion tool yields profitable opportunities. The use of time-based exits alongside momentum-based signals enhances the reliability of the strategy by ensuring that trades are closed even when the momentum signal alone does not materialize.
Conclusion:
The Chande Momentum Oscillator Trading Strategy combines the principles of momentum measurement and mean-reversion to identify and capitalize on short-term price fluctuations. By using a widely tested oscillator like the CMO and integrating a systematic exit approach, the strategy effectively addresses both entry and exit conditions, providing a robust method for trading in diverse market environments.
References:
Chande, T. S. (1997). The New Technical Trader: Boost Your Profit by Plugging into the Latest Indicators. John Wiley & Sons.
Fama, E. F. (1970). Efficient Capital Markets: A Review of Theory and Empirical Work. The Journal of Finance, 25(2), 383-417.
Jegadeesh, N., & Titman, S. (1993). Returns to Buying Winners and Selling Losers: Implications for Stock Market Efficiency. The Journal of Finance, 48(1), 65-91.
Murphy, J. J. (1999). Technical Analysis of the Financial Markets: A Comprehensive Guide to Trading Methods and Applications. New York Institute of Finance.
Poterba, J. M., & Summers, L. H. (1988). Mean Reversion in Stock Prices: Evidence and Implications. Journal of Financial Economics, 22(1), 27-59.
Shiller, R. J. (2003). From Efficient Markets Theory to Behavioral Finance. Journal of Economic Perspectives, 17(1), 83-104.

Squeeze Momentum Oscillator [AlgoAlpha]🎉📈 Introducing the Squeeze Momentum Oscillator by AlgoAlpha 📉🎊
Unlock the secrets of market dynamics with our innovative Squeeze Momentum Oscillator! Crafted for those who seek to stay ahead in the fast-paced trading environment, this tool amalgamates critical market momentum and volatility indicators to offer a multifaceted view of potential market movements. Here's why it's an indispensable part of your trading toolkit:
Key Features:
🌈 Customizable Color Schemes: Easily distinguish between bullish (green) and bearish (red) momentum phases for intuitive analysis.
🔧 Extensive Input Settings: Tailor the oscillator lengths for both Underlying and Swing Momentum to match your unique trading approach.
📊 Dedicated Squeeze Settings: Leverage precise volatility insights to identify market squeeze scenarios, signaling potential breakouts or consolidations.
🔍 Advanced Divergence Detection: Utilize sophisticated algorithms to detect and visualize both bullish and bearish divergences, pointing towards possible market reversals.
📈 Hyper Squeeze Detection: Stay alert to high-momentum market movements with our hyper squeeze feature, designed to extremely suppressed market volatility.
🔔 Comprehensive Alert System: Never miss a trading opportunity with alerts for momentum changes, squeeze conditions, and more.
Quick Guide to Using the Squeeze Momentum Oscillator:
🛠 Add the Indicator: Add the indicator to your favourites. Adjust the oscillator and squeeze settings to suit your trading preferences.
📊 Market Analysis: Keep an eye on the squeeze value and momentum z-score for insights into volatility and market direction. Hyper Squeeze signals are your cue for high momentum trading opportunities.
🔔 Alerts: Configure alerts for shifts in underlying and swing momentum, as well as entry and exit points for squeeze conditions, to capture market moves efficiently.
How It Works:
The Squeeze Momentum Oscillator by AlgoAlpha synergistically combines the principles of momentum tracking and market squeeze detection. By integrating the core logic of the Squeeze & Release indicator, it calculates the Squeeze Value (SV) through a comparison of the Exponential Moving Average (EMA) of the Average True Range (ATR) against the high-low price EMA. This SV is further analyzed alongside its EMA to pinpoint squeeze conditions, indicative of potential market breakouts or consolidations. In addition to this, the oscillator employs Hyper Squeeze Detection for identifying extremely low volatility. The momentum aspect of the oscillator evaluates the price movement relative to EMAs of significant highs and lows, refining these observations with a z-score normalization for short-term momentum insights. Moreover, the incorporation of divergence detection aids in identifying potential reversals, making this oscillator a comprehensive tool for traders looking to harness the power of volatility and momentum in their market analysis. The combination of the Squeeze & Release and the Momentum Oscillator allows traders to time their trades with more precision by entering when the market is in a squeeze and front running the volatility of a major move.
Elevate your trading strategy with the Squeeze Momentum Oscillator by AlgoAlpha and gain a competitive edge in deciphering market dynamics! 🌟💼 Happy trading!

Trend System Oscillator Averages RatingThis is a trend system made with multiple oscillator averages designed especially for trending markets such as stocks or crypto.
It can be used with any timeframe.
Its made of multiple moving oscillators such as
RSI
Stochastic
ADX
CCI
AO
MACD
MOM
STOCH RSI
WPR
BP
UO
Avg of all oscillators
It has also a rating, making an avg from all of the oscillators , going from -100 (all ma's are telling to go short ) to 100 ( all ma are telling to go long).
If you have any questions let me know !

Percentage Volume Oscillator (PVO)The Percentage Volume Oscillator (PVO) is a momentum oscillator for volume. The PVO measures the difference between two volume-based moving averages as a percentage of the larger moving average. As with MACD and the Percentage Price Oscillator (PPO), it is shown with a signal line, a histogram and a centerline. The PVO is positive when the shorter volume EMA is above the longer volume EMA and negative when the shorter volume EMA is below. This indicator can be used to define the ups and downs for volume, which can then be used to confirm or refute other signals. Typically, a breakout or support break is validated when the PVO is rising or positive.
Generally speaking, volume is above average when the PVO is positive and below average when the PVO is negative. A negative and rising PVO indicates that volume levels are increasing. A positive and falling PVO indicates that volume levels are decreasing. Chartists can use this information to confirm or refute movements on the price chart.
Even though the PVO is based on a momentum oscillator formula, it is important to remember that moving averages lag. A 12-day EMA include 12 days of volume data, with newer data weighted more heavily. A 26-day EMA lags even more because it contains 26 days of data. This means that the PVO(12,26,9) can sometimes be out of sync with price action.
The Percentage Volume Oscillator (PVO) is a momentum indicator applied to volume. This oscillator can be quite choppy due to the fact that volume doesn't trend. Bullish and bearish divergences are not well suited for the PVO. Instead, chartists would be better off looking for signs of increasing volume with a move into positive territory and signs of decreasing volume with a move into negative territory. Increasing volume can validate a support or resistance break. Similarly, a surge or significant support break on low volume may be less robust. As with all technical indicators, it is important to use the Percentage Volume Oscillator (PVO) in conjunction with other aspects of technical analysis, such as chart patterns and momentum oscillators.

Grover Llorens Cycle Oscillator [alexgrover & Lucía Llorens]Cycles represent relatively smooth fluctuations with mean 0 and of varying period and amplitude, their estimation using technical indicators has always been a major task. In the additive model of price, the cycle is a component :
Price = Trend + Cycle + Noise
Based on this model we can deduce that :
Cycle = Price - Trend - Noise
The indicators specialized on the estimation of cycles are oscillators, some like bandpass filters aim to return a correct estimate of the cycles, while others might only show a deformation of them, this can be done in order to maximize the visualization of the cycles.
Today an oscillator who aim to maximize the visualization of the cycles is presented, the oscillator is based on the difference between the price and the previously proposed Grover Llorens activator indicator. A relative strength index is then applied to this difference in order to minimize the change of amplitude in the cycles.
The Indicator
The indicator include the length and mult settings used by the Grover Llorens activator. Length control the rate of convergence of the activator, lower values of length will output cycles of a faster period.
here length = 50
Mult is responsible for maximizing the visualization of the cycles, low values of mult will return a less cyclical output.
Here mult = 1
Finally you can smooth the indicator output if you want (smooth by default), you can uncheck the option if you want a noisy output.
The smoothing amount is also linked with the period of the rsi.
Here the smoothing amount = 100.
Conclusion
An oscillator based on the recently posted Grover Llorens activator has been proposed. The oscillator aim to maximize the visualization of cycles.
Maximizing the visualization of cycles don't comes with no cost, the indicator output can be uncorrelated with the actual cycles or can return cycles that are not present in the price. Other problems arises from the indicator settings, because cycles are of a time-varying periods it isn't optimal to use fixed length oscillators for their estimation.
Thanks for reading !
If my work has ever been of use to you you can donate, addresses on my signature :)
Beast Mode Adaptive Oscillator V6⭐ Beast Mode Adaptive Oscillator V6
Description (Copy/Paste for Publishing)
Beast Mode Adaptive Oscillator V6 is a high-precision, regime-aware momentum engine that adapts dynamically to market conditions.
It blends ADX-based market regime filtering, StochRSI adaptive oscillation, and ATR-driven signal validation to deliver a powerful, low-noise, context-smart oscillator.
Instead of giving the same overbought/oversold signals in every environment, this oscillator changes its behavior depending on market regime:
Market Regime Filter (MRF)
Automatically detects:
✔ Strong Bull Trend
✔ Strong Bear Trend
✔ Ranging Bull
✔ Ranging Bear
✔ Noise / Low-Volatility Environment
ADX + DI structure determines how aggressive or conservative the oscillator becomes.
Adaptive Regime Oscillator (ARO)
A smart StochRSI core whose OB/OS levels shift depending on trend regime:
• In strong trends → wider OB/OS bands (10–90)
• In ranges → tighter, mean-reverting bands (20–80)
• Higher accuracy and fewer false reversals
Price/Volatility Control (PVC)
Built-in ATR risk modules:
• ATR-based stop zones
• ATR-based target zones
• Internal validation to confirm signal strength
Optional Visual Aids
• Entry signal markers
• Regime bar at the bottom of the chart
• ADX line display
• Custom colors for trend strength
What This Indicator Is Best At
• Avoiding bad signals during chop
• Catching trend continuation entries
• Identifying exhaustion points in strong moves
• Adapting OB/OS logic to match volatility
• Confirming strength with ADX + DI structure
Perfect For
• Intraday traders
• Swing traders
• Trend traders
• Mean-reversion setups
• Volatility-based strategies
This is a complete adaptive oscillator system designed to stay accurate across every market condition.

VWAP Deviation Oscillator [BackQuant]VWAP Deviation Oscillator
Introduction
The VWAP Deviation Oscillator turns VWAP context into a clean, tradeable oscillator that works across assets and sessions. It adapts to your workflow with four VWAP regimes plus two rolling modes, and three deviation metrics: Percent, Absolute, and Z-Score. Colored zones, optional standard deviation rails, and flexible plot styles make it fast to read for both trend following and mean reversion.
What it does
This tool measures how far price is from a chosen VWAP and expresses that gap as an oscillator. You can view the deviation as raw price units, percent, or standardized Z-Score. The plot can be a histogram or a line with optional fills and sigma bands, so you can quickly spot polarity shifts, overbought and oversold conditions, and strength of extension.
VWAP modes track a session VWAP that resets (4H, Daily, Weekly) or a rolling VWAP that updates continuously over a fixed number of bars or days.
Deviation modes let you choose the lens: Percent, Absolute, or Z-Score. Each highlights different aspects of stretch and mean pressure.
Visual encoding uses a 10-zone color palette to grade the magnitude of deviation on both sides of zero.
Volatility guards compute mode-specific sigma so thresholds are stable even when volatility compresses.
Why this works
VWAP is a high signal anchor used by institutions to gauge fair participation. Deviations around VWAP cluster in regimes: mild oscillations within a band, decisive pushes that signal imbalance, and standardized extremes that often precede either continuation or snapback. Expressing that distance as a single time series adds clarity: bias is the oscillator’s sign, risk context is its magnitude, and regime is the way it behaves around sigma lines.
How to use it
Trend following
Favor the side of the zero line. Bullish when the oscillator is above zero and making higher swing highs. Bearish when below zero and making lower swing lows. Use +1 sigma and +2 sigma in your mode as strength tiers. Pullbacks that hold above zero in uptrends, or below zero in downtrends, are often continuation entries.
Mean reversion
Fade stretched readings when structure supports it. Look for tests of +2 sigma to +3 sigma that fail to progress and roll back toward zero, or the mirror on the downside. Z-Score mode is best when you want standardized gates across assets. Percent mode is intuitive for intraday scalps where a given percent stretch tends to mean revert.
Session playbook
Use Daily or Weekly VWAP for intraday or swing context. Rolling modes help when the asset lacks clean session boundaries or when you want a continuous anchor that adapts to liquidity shifts.
Key settings
VWAP computation
VWAP Mode = 4 Hours, Daily, Weekly, Rolling (Bars), Rolling (Days). Session modes reset the VWAP when a new session begins. Rolling modes compute VWAP over a fixed trailing window.
Rolling (Lookback: Bars) controls the trailing bar count when using Rolling (Bars).
Rolling (Lookback: Days) converts days to bars at runtime and uses that trailing span.
Use Close instead of HLC3 switches the price reference. HLC3 is smoother. Close makes the anchor track settlement more tightly.
Deviation measurement
Deviation Mode
Percent : 100 * (Price / VWAP - 1). Good for uniform scaling across instruments.
Absolute : Price - VWAP. Good when price units themselves matter.
Z-Score : Standardizes the absolute residual by its own mean and standard deviation over Z/Std Window . Ideal for cross-asset comparability and regime studies.
Z/Std Window sets the mean and standard deviation window for Z-Score mode.
Volatility controls
Percent Mode Volatility Lookback estimates sigma for percent deviations.
Absolute Mode Volatility Lookback estimates sigma for absolute deviations.
Minimum Sigma Guard (pct pts) prevents the percent sigma from collapsing to near zero in extremely quiet markets.
Visualization
Plot Type = Histogram or Line. Histogram emphasizes impulse and polarity changes. Line emphasizes trend waves and divergences.
Positive Color / Negative Color define the palette for line mode. Histogram uses a 10-bucket gradient automatically.
Show Standard Deviations plots symmetric rails at ±1, ±2, ±3 sigma in the current mode’s units.
Fill Line Oscillator and Fill Opacity add a soft bias band around zero for line mode.
Line Width affects both the oscillator and the sigma rails.
Reading the zones
The oscillator’s color and height map deviation to nine graded buckets on each side of zero, with deeper greens above and deeper reds below. In Percent and Absolute modes, those buckets are scaled by their mode-specific sigma. In Z-Score mode the bucket edges are fixed at 0.5, 1.0, 2.0, and 2.8.
0 to +1 sigma weak positive bias, usually rotational.
+1 to +2 sigma constructive impulse. Pullbacks that hold above zero often continue.
+2 to +3 sigma strong expansion. Watch for either trend continuation or exhaustion tells.
Beyond +3 sigma statistical extreme. Requires structure to avoid fading too soon.
Mirror logic applies on the negative side.
Suggested workflows
Trend continuation checklist
Pick a session VWAP that matches your timeframe, for example Daily for intraday or Weekly for position trades.
Wait for the oscillator to hold the correct side of zero and for a sequence of higher swing lows in the oscillator (uptrend) or lower swing highs (downtrend).
Buy pullbacks that stabilize between zero and +1 sigma in an uptrend. Sell rallies that stabilize between zero and -1 sigma in a downtrend.
Use the next sigma band or a prior price swing as your target reference.
Mean reversion checklist
Switch to Z-Score mode for standardized thresholds.
Identify tests of ±2 sigma to ±3 sigma that fail to extend while price meets support or resistance.
Enter on a polarity change through the prior histogram bar or a small hook in line mode.
Fade back to zero or to the opposite inner band, then reassess.
Notes on the three modes
Percent is easy to reason about when you care about proportional stretch. It is well suited to intraday and multi-asset dashboards.
Absolute tracks cash distance from VWAP. This is useful when instruments have tight ticks and you plan risk in price units.
Z-Score standardizes the residual and is best for quant studies, cross-asset comparisons, and threshold research that must be scale invariant.
What the alerts can tell you
Polarity changes at zero can mark the start or end of a leg.
Crosses of ±1 sigma identify overbought or oversold in the current mode’s units.
Zone changes signal an upgrade or downgrade in deviation strength.
Troubleshooting and edge cases
If your instrument has long flat periods, keep Minimum Sigma Guard above zero in Percent mode so the rails do not vanish.
In Rolling modes, very short windows will respond quickly but can whip around. Session modes smooth this by resetting at well known boundaries.
If Z-Score looks erratic, increase Z/Std Window to stabilize the estimate of mean and sigma for the residual.
Final thoughts
VWAP is the anchor. The deviation oscillator is the narrative. By separating bias, magnitude, and regime into a simple stream you can execute faster and review cleaner. Pick the VWAP mode that matches your horizon, choose the deviation lens that matches your risk framework, and let the color graded zones guide your decisions.

Market Pressure Oscillator█ OVERVIEW
The Market Pressure Oscillator is an advanced technical indicator for TradingView, enabling traders to identify potential trend reversals and momentum shifts through candle-based pressure analysis and divergence detection. It combines a smoothed oscillator with moving average signals, overbought/oversold levels, and divergence visualization, enhanced by customizable gradients, dynamic band colors, and alerts for quick decision-making.
█ CONCEPT
The indicator measures buying or selling pressure based on candle body size (open-to-close difference) and direction, with optional smoothing for clarity and divergence detection between price action and the oscillator. It relies solely on candle data, offering insights into trend strength, overbought/oversold conditions, and potential reversals with a customizable visual presentation.
█ WHY USE IT?
- Divergence Detection: Identifies bullish and bearish divergences to reinforce signals, especially near overbought/oversold zones.
- Candle Pressure Analysis: Measures pressure based on candle body size, normalized to a ±100 scale.
- Signal Generation: Provides buy/sell signals via overbought/oversold crossovers, zero-line crossovers, moving average zero-line crossovers, and dynamic band color changes.
- Visual Clarity: Uses dynamic colors, gradients, and fill layers for intuitive chart analysis.
Flexibility: Extensive settings allow customization to individual trading preferences.
█ HOW IT WORKS?
- Candle Pressure Calculation: Computes candle body size as math.abs(close - open), normalized against the average body size over a lookback period (avgBody = ta.sma(body, len)). - Candle direction (bullish: +1, bearish: -1, neutral: 0) is multiplied by body weight to derive pressure.
- Cumulative Pressure: Sums pressure values over the lookback period (Lookback Length) and normalizes to ±100 relative to the maximum possible value.
- Smoothing: Optionally applies EMA (Smoothing Length) to normalized pressure.
- Moving Average: Calculates SMA (Moving Average Length) for trend confirmation (Moving Average (SMA)).
- Divergence Detection: Identifies bullish/bearish divergences by comparing price and oscillator pivot highs/lows within a specified range (Pivot Length). Divergence signals appear with a delay equal to the Pivot Length.
- Signals: Generates signals for:
Crossing oversold upward (buy) or overbought downward (sell).
Crossing the zero line by the oscillator or moving average (buy/sell).
Bullish/bearish divergences, marked with labels, enhancing signals, especially near overbought/oversold zones.
Dynamic band color changes when the moving average crosses MA overbought/oversold thresholds (green for oversold, red for overbought).
- Visualization: Plots the oscillator and moving average with dynamic colors, gradient fills, transparent bands, and labels, with customizable overbought/oversold levels.
Alerts: Built-in alerts for divergences, overbought/oversold crossovers, and zero-line crossovers (oscillator and moving average).
█ SETTINGS AND CUSTOMIZATION
- Lookback Length: Period for aggregating candle pressure (default: 14).
- Smoothing Length (EMA): EMA length for smoothing the oscillator (default: 1). Higher values smooth the signal but may reduce signal frequency; adjust overbought/oversold levels accordingly.
- Moving Average Length (SMA): SMA length for the moving average (default: 14, minval=1). Higher values make SMA a trend indicator, requiring adjusted MA overbought/oversold levels.
- Pivot Length (Left/Right): Candles for detecting pivot highs/lows in divergence calculations (default: 2, minval=1). Higher values reduce noise but add delay equal to the set value.
- Enable Divergence Detection: Enables divergence detection (default: true).
- Overbought/Oversold Levels: Thresholds for the oscillator (default: 30/-30) and moving average (default: 10/-10). For the moving average, no arrows appear; bands change color from gray to green (oversold) or red (overbought), reinforcing entry signals.
- Signal Type: Select signals to display: "None", "Overbought/Oversold", "Zero Line", "MA Zero Line", "All" (default: "Overbought/Oversold").
- Colors and Gradients: Customize colors for bullish/bearish oscillator, moving average, zero line, overbought/oversold levels, and divergence labels.
- Transparency: Adjust gradient fill transparency (default: 70, minval=0, maxval=100) and band/label transparency (default: 40, minval=0, maxval=100) for consistent visuals.
- Visualizations: Enable/disable moving average, gradients for zero/overbought/oversold levels, and gradient fills.
█ USAGE EXAMPLES
- Momentum Analysis: Observe the MPO Oscillator above 0 for bullish momentum or below 0 for bearish momentum. The SMA, being smoother, reacts slower and can confirm trend direction as a noise filter.
- Reversal Signals: Look for buy triangles when the oscillator crosses oversold upward, especially when the SMA is below the MA oversold threshold and the band turns green. Similarly, seek sell triangles when crossing overbought downward, with the SMA above the MA overbought threshold and the band turning red.
- Using Divergences: Treat bullish (green labels) and bearish (red labels) divergences as reinforcement for other signals, especially near overbought/oversold zones, indicating stronger potential trend reversals.
- Customization: Adjust lookback length, smoothing, and moving average length to specific instruments and timeframes to minimize false signals.
█ USER NOTES
Combine the indicator with tools like Fibonacci levels or pivot points to enhance accuracy.
Test different settings for lookback length, smoothing, and moving average length on your chosen instrument and timeframe to find optimal values.

ROC-Weighted MA Oscillator [SeerQuant]ROC-Weighted MA Oscillator (ROCWMA)
The ROC-Weighted MA Oscillator (ROCWMA) is a momentum-based indicator which uniquely combines the Rate of Change (ROC) with customizable moving averages, offering a dynamic oscillator for trend analysis. Featuring z-score normalization and weighted MA integration, the ROCWMA delivers actionable trend signals with customizable thresholds.
--------------------------------------------------------------------------------------------------
⚙️ How It Works
1️⃣ Rate of Change (ROC) Normalization
The indicator begins with a normalized ROC calculation over a customizable length, transforming raw momentum data into a dynamic range for enhanced analysis.
2️⃣ Weighted Moving Average (MA)
A custom moving average (MA) is calculated using selectable MA types such as TEMA, SMA, EMA, and more. The normalized ROC is then applied as a weight to derive the ROC-Weighted MA (RWMA), blending trend and momentum data.
3️⃣ Z-Score Oscillator
The RWMA is normalized using z-score calculations, resulting in a smoothed oscillator. This process highlights deviations from the mean, identifying overbought and oversold conditions dynamically.
4️⃣ Threshold Logic
Bullish (Uptrend): Oscillator exceeds the positive threshold.
Bearish (Downtrend): Oscillator drops below the negative threshold.
Neutral: Oscillator remains between thresholds.
5️⃣ Dynamic Visual Representation
A color-coded histogram reflects trend strength and direction.
Optional candle coloring visually emphasizes trends on the chart.
Gradient fills enhance clarity of threshold areas.
--------------------------------------------------------------------------------------------------
✨ Customizable Settings
ROC Settings
Define the ROC length for momentum calculation.
MA Settings
Choose from multiple MA types (TEMA, EMA, SMA, etc.).
Customize the length and data source for MA calculations.
Adjust the signal length for smoothing.
Threshold Settings
Set neutral, bullish, and bearish thresholds to match your strategy.
Style Settings
Toggle candle coloring for visual trend enhancement.
Select from five unique color schemes to suit your chart style.
--------------------------------------------------------------------------------------------------
🚀 Features and Benefits
Momentum-Weighted Analysis: Combines ROC with advanced moving averages for precise trend evaluation.
Dynamic Thresholds: Z-score-based logic adapts to market conditions.
Visual Clarity: Color-coded histograms, candles, and gradient fills make trend detection intuitive.
Highly Customizable: Flexible inputs and multiple MA types ensure adaptability to various trading styles.
--------------------------------------------------------------------------------------------------
📜 Disclaimer
This indicator is for educational purposes only and does not constitute financial advice. Past performance is not indicative of future results. Users should consult a licensed financial advisor before making trading decisions. Use at your own risk.
--------------------------------------------------------------------------------------------------

Price Oscillator TR### Summary: How to Use the Price Oscillator with EMA Indicator
The **Price Oscillator with EMA** is a custom technical analysis tool designed to help traders identify potential buying and selling opportunities based on price momentum. Here's how to use it:
1. **Understanding the Oscillator**:
- The oscillator is calculated by normalizing the current price relative to the highest high and lowest low over a specified lookback period. It fluctuates between -70 and +70.
- When the oscillator is near +70, the price is close to the recent highs, indicating potential overbought conditions. Conversely, when it’s near -100, the price is close to recent lows, indicating potential oversold conditions.
2. **Exponential Moving Average (EMA)**:
- The indicator includes an EMA of the oscillator to smooth out price fluctuations and provide a clearer signal.
- The EMA helps to filter out noise and confirm trends.
3. **Trading Signals**:
- **Bullish Signal**: A potential buying opportunity is signaled when the oscillator crosses above its EMA. This suggests increasing upward momentum.
- **Bearish Signal**: A potential selling opportunity is signaled when the oscillator crosses below its EMA. This indicates increasing downward momentum.
4. **Visual Aids**:
- The indicator includes horizontal lines at +70, 0, and -70 to help you quickly assess overbought, neutral, and oversold conditions.
- The blue line represents the oscillator, while the orange line represents the EMA of the oscillator.
### How to Use:
- **Set your parameters**: Adjust the lookback period and EMA length to fit your trading strategy and time frame.
- **Watch for Crossovers**: Monitor when the oscillator crosses the EMA. A crossover from below to above suggests a buy, while a crossunder from above to below suggests a sell.
- **Confirm with Other Indicators**: For more reliable signals, consider using this indicator alongside other technical tools like volume analysis, trend lines, or support/resistance levels.
This indicator is ideal for traders looking to capture momentum-based trades in various market conditions.
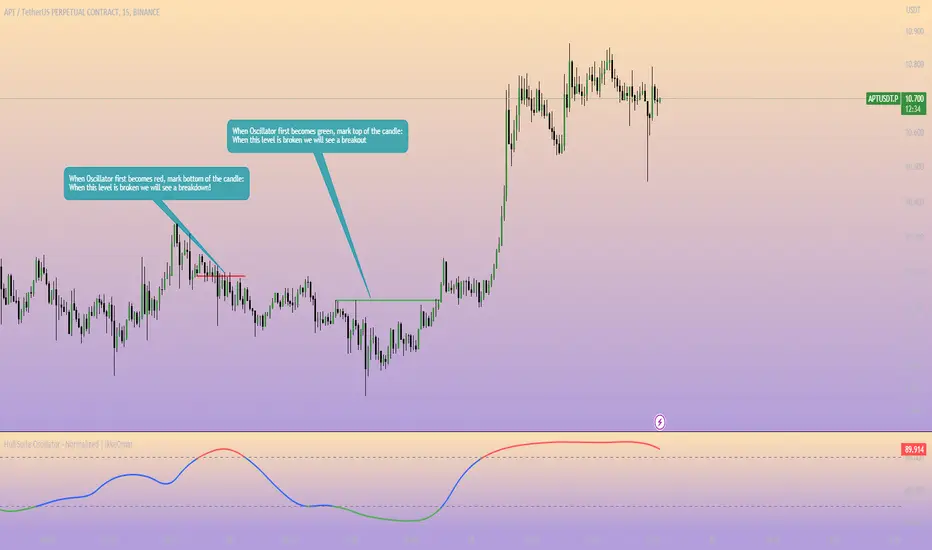
Hull Suite Oscillator - Normalized | IkkeOmarThis script is based off the Hull Suite by @InSilico.
I made this script to provide and calculate the Hull Moving Average (HMA) based on the chosen variation (HMA, TMA, or EMA) and length to then normalize the HMA values to a range of 0 to 100. The normalized values are further smoothed using an exponential moving average (EMA).
The smoothed oscillator is plotted as a line, where values above 80 are colored red, values below 20 are colored green, and values between 20 and 80 are colored blue. Additionally, there are horizontal dashed lines at the levels of 20 and 80 to serve as reference points.
Explanation for the code:
The script uses the close price of the asset as the source for calculations. The modeSwitch parameter allows selecting the type of Hull variation: Hma, Thma, or Ehma. The length parameter determines the calculation period for the Hull moving averages. The lengthMult parameter is used to adjust the length for higher timeframes. The oscSmooth parameter determines the lookback period for smoothing the oscillator.
There are three functions defined for calculating different types of Hull moving averages: HMA, EHMA, and THMA. These functions take the source and length as inputs and return the corresponding Hull moving average.
The Mode function acts as a switch and selects the appropriate Hull variation based on the modeSwitch parameter. It returns the chosen Hull moving average.
The script calculates the Hull moving averages using the selected mode, source, and length. The main Hull moving average is stored in the _hull variable, and aliases are created for the main Hull moving average (HULL), the main Hull value (MHULL), and the secondary Hull value (SHULL).
To create the normalized oscillator values, the script finds the highest and lowest values of the Hull moving average within the specified length. It then normalizes the Hull values to a range of 0 to 100 using a formula. This normalized oscillator represents the strength of the trend.
To smooth out the oscillator values, an exponential moving average is applied using the oscSmooth parameter.
The smoothed oscillator is plotted as a line chart. The line color is determined based on the oscillator value using conditional statements. If the oscillator value is above or equal to 80, the line color is set to red. If it is below or equal to 20, the color is green. Otherwise, it is blue. The linewidth is set to 2.
Additionally, two horizontal reference lines are plotted at levels 20 and 80 for visual reference. They are displayed in gray and dashed style.
Rainbow Oscillator [Strategy]Strategy based on Rainbow Oscillator
.:: Features ::.
Takes and Stops in percent
Configurable indicator iside
.:: Long condition ::.
Indicator line is green (mean uptrend) and crossing averages generated from oscillograph signal fast is go up and crossing slow
.:: Short condition ::.
Indicator line is red (mean downtrend) and crossing averages generated from oscillograph signal fast is go down and crossing slow

Bitcoin Golden Bottom Oscillator (MZ BTC Oscillator)This indicator uses Elliot Wave Oscillator Methodology applied on "BTC Golden Bottom with Adaptive Moving Average" and Relative Strength Index of Resulted EVO to form an Oscillator to detect trend health in Bitcoin price. Ticker is set to "INDEX : BTCUSD" on 1D timeframe.
Methodology
Oscillator uses Adaptive Moving Average with 1 year of length, Minor length of 50 and Major length of 100 to mark AMA as Golden Bottom.
Percentage Elliot Wave Oscillator is calculated between BTC price and AMA.
Relative Strength Index of EVO is calculated to detect trend strength and divergence detection.
Hull Moving Average of resulted RSI is used to smoothen the Oscillator.
Oscillator is hard coded to 'INDEX:BTCUSD' ticker on 1d so it can be used on any other chart and on any other timeframe.
Color Schemes
Bright Red background color indicates that price has left top Fib multiple ATR band and possibly go for top.
Light Red background color indicates that price has left 2nd top Fib multiple ATR band and possibly go for local top.
Lime background color indicates that price has entered lowest band indicating local bottom.
Bright Green background color indicates that price is approximately resting on Golden Bottom i.e. AMA.
Oscillator color is set to gradient for easy directional adaption.
BTC Golden Bottom with Adaptive Moving Average

Percentage OscillatorUsing momentum calculations on multiple time frames and adding everything together into 4 separate directions:
1- green: the strength and momentum in +45 to +90 degrees angle
2- blue: the strength and momentum in 0 to +45 degrees angle
3- orange: the strength and momentum in 0 to -45 degrees angle
4- red: the strength and momentum in -45 to -90 degrees angle
Single parameter to control the size of the largest moving window.
Uptrend is green with orange corrections
Downtrend is red with blue corrections
When downtrend turns into uptrend, blue becomes green
When uptrend turns into downtrend, orange becomes red
The natural cycle of the market is RED->BLUE->GREEN->ORANGE and so on, you will see the cycle repeats itself 3 times before a break up\down. The strength of the movement depends on the height and width of all the waves that created the 3 cycle movement (reminds Elliot in an oscillatory representation)
The script is provided as is, there are no trading strategies implied or recommended.
Feel free to PM with questions

Linear Quadratic Convergence Divergence OscillatorIntroduction
I inspired myself from the MACD to present a different oscillator aiming to show more reactive/predictive information. The MACD originally show the relationship between two moving averages by subtracting one of fast period and another one of slow period. In my indicator i will use a similar concept, i will subtract a quadratic least squares moving average with a linear least squares moving average of same period, since the quadratic least squares moving average is faster than the linear one and both methods have low-lag this will result in a reactive oscillator.
LQCD In Details
A quadratic least squares moving average try to fit a quadratic function (parabola) to the price by using the method of least squares, the linear least squares moving average try to fit a line. Non-linear fit tend to minimize the sum of squares in non-linear data, this is why a quadratic method is more reactive. The difference of both filters give us an oscillator, then we apply a simple moving average to this oscillator to provide the signal line, subtracting the oscillator and its signal line give us the histogram, those two last steps are the same used in the MACD.
Length control the period of the quadratic/linear moving average. While the MACD use a signal line for plotting the histogram i also added the option to plot the momentum of the quadratic moving average instead, the result is smoother and reduce irregularities, in order to do so just check the differential option in the parameter box.
The period of the signal line and the momentum are both controlled by the signal parameter.
A predictive approach can be made by subtracting the histogram with the signal line, this process make the histogram way more predictive, in order to do so just check the predictive histogram option in the parameter box.
Predictive histogram with simple histogram option. The differential mode can also be used with the predictive parameter, this result in a smoother but less reactive prediction.
Information Interpretation
The amount of information the MACD can give us is high. We can use the histogram as signal generator, or the if the oscillator is over/under 0, combine the oscillator/signal line with histogram, combinations can provide various systems. Some traders use the histogram as signal generator and use the cross between the histogram and the signal line as a stop signal, this method can avoid some whipsaw trades. The study of divergences with the price is also another method.
Conclusion
This oscillator aim to show the same amount of information as the MACD with a similar calculation method but using different kind of filters as well as eliminating the need to use two separates periods for the moving averages calculation, its still possible to use different periods for the quadratic/linear moving average but the results can be less accurate. This indicator can be used like the MACD.
