Order Flow Delta Trackerorderflow manager where you
Delta bars: Show net buying/selling per candle.
Cumulative Delta: Helps identify hidden buying/selling pressure.
If price rises but cumulative delta falls → possible hidden selling (divergence).
If price falls but cumulative delta rises → hidden buying.
"order" için komut dosyalarını ara

Order Blocks v2Order Blocks v2 – Smart OB Detection with Time & FVG Filters
Order Blocks v2 is an advanced tool designed to identify potential institutional footprints in the market by dynamically plotting bullish and bearish order blocks.
This indicator refines classic OB logic by combining:
Fractal-based break conditions
Time-level filtering (Power of 3)
Optional Fair Value Gap (FVG) confirmation
Real-time plotting and auto-invalidation
Perfect for traders using ICT, Smart Money, or algorithmic timing models like Hopplipka.
🧠 What the indicator does
Detects order blocks after break of bullish/bearish fractals
Supports 3-bar or 5-bar fractal structures
Allows OB detection based on close breaks or high/low breaks
Optionally confirms OBs only if followed by a Fair Value Gap within N candles
Filters OBs based on specific time levels (3, 7, 11, 14) — core anchors in many algorithmic models
Automatically deletes invalidated OBs once price closes through the zone
⚙️ How it works
The indicator:
Tracks local fractal highs/lows
Once a fractal is broken by price, it backtracks to identify the best OB candle (highest bullish or lowest bearish)
Validates the level by checking:
OB type logic (close or HL break)
Time stamp match with algorithmic time anchors (e.g. 3, 7, 11, 14 – known from the Power of 3 concept)
Optional FVG confirmation after OB
Plots OB zones as lines (body or wick-based) and removes them if invalidated by a candle close
This ensures traders see only valid, active levels — removing noise from broken or out-of-context zones.
🔧 Customization
Choose 3-bar or 5-bar fractals
OB detection type: close break or HL break
Enable/disable OBs only on times 3, 7, 11, 14 (Hopplipka style)
Optional: require nearby FVG for validation
Line style: solid, dashed, or dotted
Adjust OB length, width, color, and use body or wick for OB height
🚀 How to use it
Add the script to your chart
Choose your preferred OB detection mode and filters
Use plotted OB zones to:
Anticipate price rejections and reversals
Validate Smart Money or ICT-based entry zones
Align setups with algorithmic time sequences (3, 7, 11, 14)
Filter out invalid OBs automatically, keeping your chart clean
The tool is useful on any timeframe but performs best when combined with a liquidity-based or time-anchored trading model.
💡 What makes it original
Combines fractal logic with OB confirmation and time anchors
Implements time-based filtering inspired by Hopplipka’s interpretation of the "Power of 3"
Allows OB validation via optional FVG follow-up — rarely available in public indicators
Auto-cleans invalidated OBs to reduce clutter
Designed to reflect market structure logic used by institutions and algorithms
💬 Why it’s worth using
Order Blocks v2 simplifies one of the most nuanced parts of SMC: identifying clean and high-probability OBs.
It removes subjectivity, adds clear timing logic, and integrates optional confluence tools — like FVG.
For traders serious about algorithmic-level structure and clean setups, this tool delivers both logic and clarity.
⚠️ Important
This indicator:
Is not a signal generator or financial advice tool
Is intended for experienced traders using OB/SMC/time-based logic
Does not predict market direction — it provides visual structural levels only

2nd 3rd 4th Order PivotsThis indicator calculates pivots of 2nd, 3rd and 4th order in the current timeframe.
The idea is borrowed from the book "The Art and Science of Technical Trading" by Adam Grimes:
"A pivot high is a bar that has a higher high than the bar that came before it and the bar that comes after it"
"Second-order pivot highs are first-order pivot highs that are preceded and followed by lower first-order pivot highs.
The type of picot calculation can be found as well in script "Higher Order Pivots" by rumpypumpydumpy. However, this script is different in the following ways:
1. Shows pivots of order 2, 3 and 4
2. The chart timeframe can be different than the pivot timeframe, allowing e.g. to map daily pivots to intraday charts via lines
3. Labels and/or lines can be used to show pivot points
4. Use of extended session data can be enabled/disabled, independently from the current chart settings
5. To disable older pivots, a starting time for the pivot calculation can be set
Please consider following limitations:
1. Maximum of 500 drawing objects per chart. Use Notification option to keep track of when running out of chart objects.
2. Lookback history: The max lookback history is limited by the currently selected timeframe. E.g. on a 5min timeframe, 20000 bars (Premium Plan) result in approx. 5 months of lookback period, meaning you may want to verify with a 30 min or higher chart to get a complete picture of pivots.

multiple orders - strategy - educationalHi,
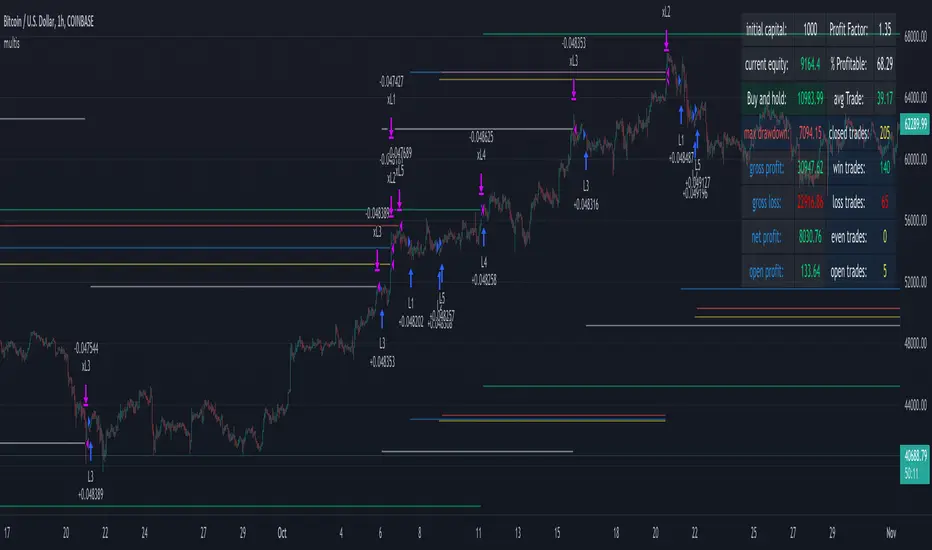
Here is a 'template', using array's, for multiple orders and different SL/TP levels per trade (This is an example with max 5 open trades)
The 'switch' makes sure that the first available position will be used,
for example, when 'L1' is closed in the past, and a buy condition is triggered, position 'L1' will be filled,
should it be that 'L1', 'L2', 'L3' are already filled, then position 'L4' will be filled, ...
An extra table is added with data of the trades
Be aware, the 'Buy and Hold' resembles the profit when 100% of the available equity has been bought at the time of the very first trade and sold now. On the other hand, the positions work with a % of equity, 20% per trade (5 x 20 = 100%)
You can see that every trade exits on its own terms, without interference of other trades
Important, this technique only works if in the strategy() function:
- close_entries_rule -> set at 'ANY'
- pyramiding is set at max amount of trades or higher (in this case 5 or higher)
Cheers!
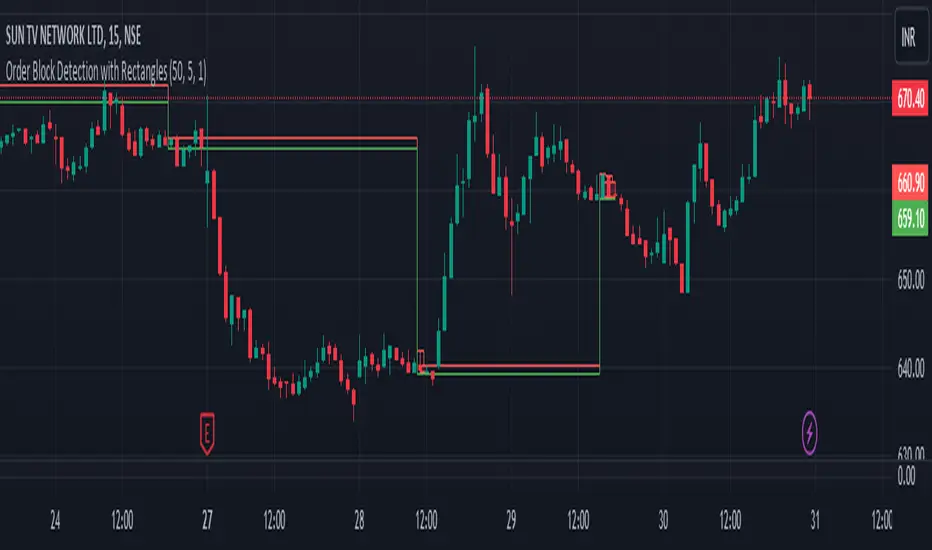
Pivot Order Blocks// How it Works \\
Order Blocks based on pivot reversal candle
When a pivot High or Pivot Low is found and confirmed, a box will be plotted on the open and close values of that pivot candle
// Settings \\
In the settings you have the ability to change the distances required to confirm an pivot High or Low
These are the lengths where the script checks to see if it is at its local high or low.
You also have the ability to change the amount of candles the box stretches over as well as the colors of the bullish and bearish boxes
// Use Case \\
Pivot points often provide Support and Resistance points on their own,
one way of marking up order blocks is by taking the pivot candle and marking that up as a resistance area where you could be looking for price to reverse
// Suggestions \\
Happy for anyone to make any suggestions on changes which could improve the script,
// Terms \\
Feel free to use the script, If you do use the script could you please just tag me as I am interested to see how people are using it. Good Luck!

OrderbugThis script demonstrate what I don't understand - according to documentation with order managements
The from_entry parameter should execute the exit on this specified trade.
The chart shows the right information, but the list of trades, in the Strategy tester panel doesn't make sense:
This is an extract of the CSV file I got from this script:
The enter1 is getting matched against 4 others entry names, each closing 30% of the position.
10,Exit Long,exit loss2
10,Entry Long,enter 3
===================
9,Exit Long,exit loss4
9,Entry Long,enter 3
==================
8,Exit Long,exit loss4
8,Entry Long,enter 2
==================
7,Exit Long,exit loss3
7,Entry Long,enter 2
===================
6,Exit Long,exit loss8
6,Entry Long,enter 2
==================
5,Exit Long,exit loss10
5,Entry Long,enter 2
==================
4,Exit Long,exit loss10
4,Entry Long,enter 1
===================
3,Exit Long,exit loss5
3,Entry Long,enter 1
===================
2,Exit Long,exit loss9
2,Entry Long,enter 1
===================
1,Exit Long,exit loss6
1,Entry Long,enter 1

Svl - Trading SystemPrice can tell lies but volume cannot, so keeping this in mind I have created this indicator in which you see sell order block and buy order block on the basis of price action + volume through which we execute our trade
First of all, let us know its core concepts and logic, which will help you in taking the right decisions in it.
core concept of the " Svl - Trading System " TradingView indicator is based on professional price action, volume, and swing structure. This indicator smartly gives real-time insights of important price turning points, reversal zones, and trend continuation. Its deep explanation is given below.
Edit - default swing length -5 , change according your nature , tested With 7 For 5 minute timeframe
Core Concept:
1. Swing Structure Detection
The indicator automatically detects swing highs (HH/LH) and swing lows (HL/LL) on the chart.
HH: Higher High
HL: Higher Low
LH: Lower High
LL: Lower Low
These swings are the backbone of price action – signaling a change in trend, a bounce, reversal or trend continuation.
2. Order Block (OB) Mapping
Buy Order Block (Buy OB): When the indicator detects the HL/LL swing, we declare Buy OB, the lowest point of the swing.
Sell Order Block (Sell OB): On HH/LH swing, the highest point of our swing is called Sell OB.
Order Blocks are those important zones of price where historically price has reacted strongly – where major clusters of buyers/sellers are located in the market.
3. Volume Analysis (Optional Dashboard/Barcolor)
The candle color depends on the volume ranking on the chart (most high/low, normal, pressure blue shade).
Highest/lowest volume candles are a special highlight, which helps to spot liquidity spikes, exhaustion, or big orders.
4. Live Dashboard
There is an automated dashboard in the top-right of the chart, which shows this in real-time:
Last swing type (HH/HL/LH/LL)
Reversal price (last swing level)
Swing direction (Bull/Bear/Neutral)
Volume, Buy OB, Sell OB, etc.
This helps the trader understand the market situation at a glance.
5. Smart Plotting/Labels
Buy/Sell are plotted as distinct lines on the OB chart.
The Labels option gives clear visual swing points.
All calculations are fast and automated – the user does not need to mark manually.
This indicator is an advanced, fully-automated price action tool that combines
trend, reversal, volume, liquidity and zone detection in one smart system,
makes entry/exit decisions objective and error-free,
and provides complete trading confidence with a live monitor/dashboard.
All of its functions/properties such as: swing detect, OB plot, volume color, dashboard follow best practice for professional chart analysis!

Order Block Detection By Zia (StockWiz)What is an Order Block?
An order block is a concept used in technical analysis, particularly in price action trading and supply and demand analysis. It refers to a significant area on a price chart where institutional traders, such as banks and hedge funds, have placed large orders. These blocks of orders often create strong support or resistance levels, as they represent areas where the "smart money" has shown interest in buying or selling an asset.
Characteristics of Order Blocks:
1. High Volume: Order blocks are typically associated with high trading volume, indicating strong participation from large players in the market.
2. Price Rejection: They often lead to sharp reversals or consolidations in price, as the large orders absorb the market's liquidity and push the price in the opposite direction.
3. Formation: Order blocks are usually formed after significant price movements, such as strong bullish or bearish trends, and can be identified by clusters of candles with long wicks or significant body sizes.
4. Support and Resistance: Once identified, order blocks can serve as potential support or resistance levels in future price movements. Prices often return to these areas, where new orders can be executed.
Identifying Order Blocks:
To identify order blocks, traders look for specific patterns and price actions on the chart. Here is a step-by-step guide to finding order blocks:
1. Identify a Strong Move: Look for strong bullish or bearish moves, which are often the result of large institutional orders.
2. Find Consolidation : After the strong move, find areas where the price consolidates. This is where large orders were likely placed.
3. Look for Rejections: Identify areas where the price has been rejected multiple times, creating a clear support or resistance zone.
4. Mark the Order Block: Draw a rectangle around the consolidation area to mark the order block on your chart.
Student of Parag Mehta (StockWiz)
With Regards
Zia Rahim
Order-Block Detector ICT/SMT + FVG + SignalsOrderBlock-Finder
This script shows order-blocks (OB) and fair-value-gaps (FVG). Additionaly there are entry signals for OB and FVG. The Dist-Parameter tell how many candles should exist between the beginning of the OB or FVG and the pullback.
Order-Blocks
An order block in trading typically refers to a significant grouping of buy or sell orders at a particular price level within a financial market. These blocks of orders can influence price movement when they are executed. Here's a breakdown:
Buy Order Block: This occurs when there's a large concentration of buy orders at a specific price level. It indicates a significant interest among traders to purchase the asset if the price reaches that level.
Sell Order Block: Conversely, a sell order block happens when there's a notable accumulation of sell orders at a particular price level. This suggests that many traders are willing to sell the asset if the price reaches that level.
Impact on Price: Order blocks can influence price movement because when the market approaches these levels, the orders within the block may be triggered, leading to increased buying or selling pressure, depending on the type of block. This surge in trading activity can cause the price to either bounce off the level or break through it.
Support and Resistance: Order blocks are often associated with support and resistance levels. A buy order block may act as support, preventing the price from falling further, while a sell order block may serve as resistance, hindering upward price movement.
Fair-Value-Gap
The fair value gap in trading refers to the difference between the current market price of an asset and its calculated fair value. This concept is often used in financial markets, especially in the context of stocks and other securities. Here's a breakdown:
Market Price: The market price is the price at which an asset is currently trading in the market. It is determined by the interaction of supply and demand forces, as well as various other factors such as news, sentiment, and economic conditions.
Fair Value: Fair value represents the estimated intrinsic value of an asset based on fundamental analysis, which includes factors such as earnings, dividends, cash flow, growth prospects, and prevailing interest rates. It's essentially what an asset should be worth based on its fundamentals.
Fair Value Calculation: Analysts and investors use various methods to calculate the fair value of an asset. Common approaches include discounted cash flow (DCF) analysis, comparable company analysis (CCA), and dividend discount models (DDM), among others.
Fair Value Gap: The fair value gap is the numerical difference between the calculated fair value of an asset and its current market price. If the market price is higher than the fair value, it suggests that the asset may be overvalued. Conversely, if the market price is lower than the fair value, it indicates that the asset may be undervalued.
Trading Implications: Traders and investors often pay attention to the fair value gap to identify potential trading opportunities. If the market price deviates significantly from the fair value, it may present opportunities to buy or sell the asset with the expectation that the market price will eventually converge towards its fair value.

ORDER BLCOK custom strategy# OB Matrix Strategy - Documentation
**Version:** 1.0
**Author:** HPotter
**Date:** 31/07/2017
The **OB Matrix Strategy** is based on the identification of **bullish and bearish Order Blocks** and the management of conditional orders with multiple Take Profit (TP) and Stop Loss (SL) levels. It uses trend filters, ATR, and percentage-based risk management.
---
## 1. Main Parameters
### Strategy
- `initial_capital`: 50
- `default_qty_type`: percentage of capital
- `default_qty_value`: 10
### Money Management
- `rr_threshold`: minimum Risk/Reward threshold to open a trade
- `risk_percent`: percentage of capital to risk per trade (default 2%)
- `maxPendingBars`: maximum number of bars for a pending order
- `maxBarsOpen`: maximum number of bars for an open position
- `qty_tp1`, `qty_tp2`, `qty_tp3`: quantity percentages for multiple TPs
---
## 2. Order Block Identification
### Order Block Parameters
- `obLookback`: number of bars to identify an Order Block
- `obmode`: method to calculate the block (`Full` or `Breadth`)
- `obmiti`: method to determine block mitigation (`Close`, `Wick`, `Avg`)
- `obMaxBlocks`: maximum number of Order Blocks displayed
### Main Variables
- `bullBlocks`: array of bullish blocks
- `bearBlocks`: array of bearish blocks
- `last_bull_volume`, `last_bear_volume`: volume of the last block
- `dom_block`: dominant block type (Bullish/Bearish/None)
- `block_strength`: block strength (normalized volume)
- `price_distance`: distance between current price and nearest block
---
## 3. Visual Parameters
- `Width`: line thickness for swing high/low
- `amountOfBoxes`: block grid segments
- `showBorder`: show block borders
- `borderWidth`: width of block borders
- `showVolume`: display volume inside blocks
- `volumePosition`: vertical position of volume text
Customizable colors:
- `obHighVolumeColor`, `obLowVolumeColor`, `obBearHighVolumeColor`, `obBearLowVolumeColor`
- `obBullBorderColor`, `obBearBorderColor`
- `obBullFillColor`, `obBearFillColor`
- `volumeTextColor`
---
## 4. Screener Table
- `showScreener`: display the screener table
- `tablePosition`: table position (`Top Left`, `Top Right`, `Bottom Left`, `Bottom Right`)
- `tableSize`: table size (`Small`, `Normal`, `Large`)
The table shows:
- Symbol, Timeframe
- Type and status of Order Block
- Number of retests
- Bullish and bearish volumes
---
## 5. Trend Filters
- EMA as a trend filter (`emaPeriod`, default 223)
- `bullishTrend` if close > EMA
- `bearishTrend` if close < EMA
---
## 6. ATR and Swing Points
- ATR calculated with a customizable period (`atrLength`)
- Swing High/Low for SL/TP calculation
- `f_getSwingTargets` function to calculate SL and TP based on direction
---
## 7. Trade Logic
### Buy Limit on Bullish OB
- Conditions:
- New bullish block
- Uptrend
- RR > threshold (`rr_threshold`)
- SL: `bullishOBPrice * (1 - atr * atrMultiplier)`
- Multiple TPs: TP1 (50%), TP2 (80%), TP3 (100% max)
- Quantity calculation based on percentage risk
### Sell Limit on Bearish OB
- Conditions:
- New bearish block
- Downtrend
- RR > threshold (`rr_threshold`)
- SL: `bearishOBPrice * (1 + atr * atrMultiplier)`
- Multiple TPs: TP1 (50%), TP2 (80%), TP3 (100% max)
- Quantity calculation based on percentage risk
---
## 8. Order Management and Timeout
- Close pending orders after `maxPendingBars` bars
- Close open positions after `maxBarsOpen` bars
- Label management for open orders
---
## 9. Alert Conditions
- `bull_touch`: price inside maximum bullish volume zone
- `bear_touch`: price inside maximum bearish volume zone
- `bull_reject`: confirmation of bullish zone rejection
- `bear_reject`: confirmation of bearish zone rejection
- `new_bull`: new bullish block
- `new_bear`: new bearish block
---
## 10. Level Calculation
- Swing levels based on selected timeframe (`SelectPeriod`)
- `xHigh` and `xLow` for S1 and R1 calculation
- Levels plotted on chart
---
## 11. Take Profit / Stop Loss
- Extended horizontal lines (`extendBars`) to visualize TP and SL
- Customizable colors (`tpColor`, `slColor`)
---
## 12. Notes
- Complete script based on Pine Script v5
- Advanced graphical management with boxes, lines, labels
- Dynamically displays volumes and Order Blocks
- Integrated internal screener
---
### End of Documentation

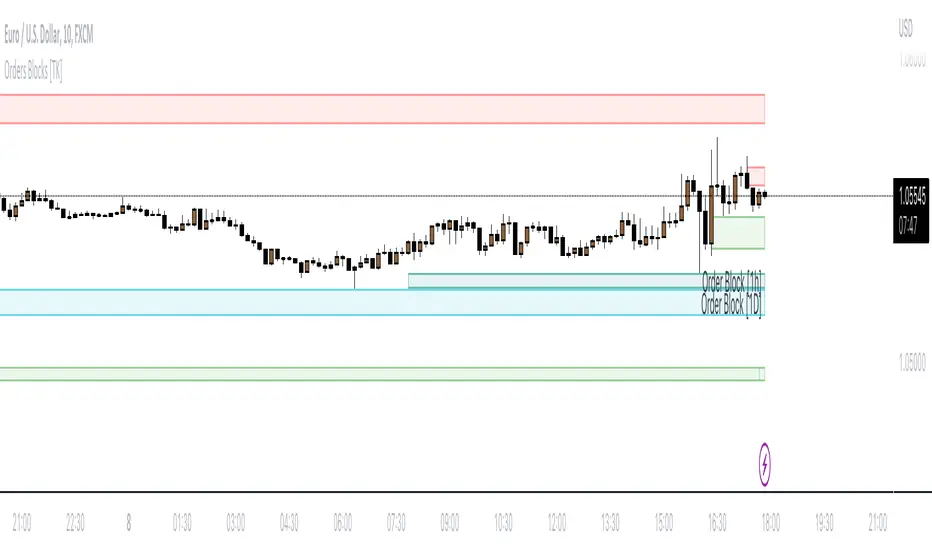
Orders Blocks [TK]This indicator draw only valid orders blocks on your 1 minute Chart
An order block is created when :
A bullish candle engulf a previous bearish candle
A bearish candle engulf a previous bullish candle
Once the order block is created, a zone is stretched to the actual bar
If the price goes into the order block zone, the zone is reduced accordingly
If the price cross the order block zone, the order block and its zone are deleted
This way, you will have on your screen only the orders blocks nevers crossed
You can choose the color of the bearish and of the bullish order block zone in the settings
NB :
Order block older that 5000 bars are deleted
This indicator works only in the 1 minute timeframe
Order Blocks + Order-Flow ProxiesOrder Blocks + Order-Flow Proxies
This indicator combines structural analysis of order blocks with lightweight order-flow style proxies, providing a tool for chart annotation and contextual study. It is designed to help users visualize where significant structural shifts occur and how simple volume-based signals behave around those areas. The script does not guarantee profitable outcomes, nor does it issue financial advice. It is intended purely for research, learning, and discretionary use.
Conceptual Background
Order Blocks
An “order block” is a term often used to describe a zone on the chart where price left behind a significant reversal or imbalance before continuing strongly in the opposite direction. In practice, this can mean the last bullish or bearish candle before a strong breakout. Traders sometimes study these regions because they believe that unfilled resting orders may exist there, or simply because they mark important pivots in price structure. This indicator detects such moments by scanning for breaks of structure (BOS). When price pushes above or below recent swing levels with sufficient displacement, the script identifies the prior opposite candle as the potential order block.
Break of Structure
A break of structure in this context is defined when the closing price moves beyond the highest high or lowest low of a short lookback window. The script compares the magnitude of this break to an ATR-based displacement filter. This helps ensure that only meaningful moves are marked rather than small, random fluctuations.
Order-Flow Proxies
Traditional order flow analysis may use bid/ask data, footprint charts, or volume profiles. Because TradingView scripts cannot access true order-book data, this indicator instead uses proxy signals derived from standard chart data:
Delta (proxy): Estimated imbalance of buying vs. selling pressure, approximated using bar direction and volume.
Imbalance ratio: Normalizes delta by total volume, ranging between -1 and +1 in theory.
Cumulative Delta (CVD): Running sum of delta over time.
Effort vs. Result (EvR): A comparison between volume and actual bar movement, highlighting cases where large effort produced little result (or vice versa).
These are not real order-flow measurements, but rather simple mathematical constructs that mimic some of its logic.
How the Script Works
Detecting Break of Structure
The user specifies a swing length. When price closes above the recent high (for bullish BOS) or below the recent low (for bearish BOS), a potential shift is recorded.
To qualify, the breakout must exceed a displacement filter proportional to the ATR. This helps filter out weak moves.
Locating the Order Block Candle
Once a BOS is confirmed, the script looks back within a short window to find the last opposite-colored candle.
The high/low or open/close of that candle (depending on user settings) is marked as the potential order block zone.
Drawing and Maintaining Zones
Each order block is represented as a colored rectangle extending forward in time.
Bullish zones are teal by default, bearish zones are red.
Zones extend until invalidated (price closing or wicking beyond them, depending on user preference) or until a user-defined lifespan expires.
A pruning mechanism ensures that only the most recent set number of zones remain, preventing chart overload.
Monitoring Touches
The script checks whether the current bar’s range overlaps any existing order block.
If so, the “closest” zone is considered touched, and a label may appear on the chart.
Confirmation Filters
Touches can optionally be confirmed by order-flow proxies.
For a bullish confirmation, the following must align:
Imbalance ratio above threshold,
Delta EMA positive,
Effort vs. Result positive.
For a bearish confirmation, the opposite holds true.
Optionally, a higher-timeframe EMA slope filter can gate these confirmations. For example, a bullish confirmation may only be accepted if the higher-timeframe EMA is sloping upward.
Alerts
Users may create alerts based on conditions such as “bullish touch confirmed” or “bearish touch confirmed.”
Alerts can be gated to only fire after bar close, reducing intrabar noise.
Standard alertcondition calls are provided, and optional inline alert() calls can be enabled.
Inputs and Customization
Structure & OB
Swing length: Defines how many bars back to check for BOS.
ATR length & displacement factor: Adjust sensitivity for structural breaks.
Body vs. wick reference: Choose whether zones are based on candle bodies or full ranges.
Invalidation rule: Pick between wick breach or close beyond the level.
Lifespan (bars): Limit how long a zone remains active.
Max keep: Cap the number of zones stored to reduce clutter.
Order-Flow Proxies
Delta mode: Choose between “Close vs Previous Close” or “Body” for delta calculation.
EMA length: Smooths the delta/imbalance series.
Z-score lookback: Defines the averaging window for EvR.
Confirmation thresholds: Adjust the imbalance levels required for long/short confirmation.
Higher Timeframe Filter
Enable HTF gate: Optional filter requiring higher-timeframe EMA slope alignment.
HTF timeframe & EMA length: Configurable for context alignment.
Style
Colors and transparency for bullish and bearish zones.
Border color customization.
Alerts
Enable inline alerts: Optional direct calls to alert().
Alerts on bar close only: Helps avoid multiple firings during bar formation.
Practical Use
This tool is best seen as a way to annotate charts and to study how simple volume-derived signals behave near important structural levels. Some users may:
Observe whether order blocks line up with later price reactions.
Study how imbalance or cumulative delta conditions align with these zones.
Use it in a discretionary workflow to highlight areas of interest for deeper analysis.
Because the proxies are based only on candle OHLCV data, they are approximations. They cannot replace true depth-of-market analysis. Similarly, order block detection here is one specific algorithmic interpretation; other traders may define order blocks differently.
Limitations and Disclaimers
This indicator does not predict future price movement.
It does not access real order book or tick-by-tick data. All signals are derived from bar OHLCV.
Past performance of signals or zones does not guarantee future results.
The script is for educational and informational purposes only. It is not financial advice.
Users should test thoroughly, adjust parameters to their own instruments and timeframes, and use it in combination with broader analysis.
Summary
The Order Blocks + Order-Flow Proxies script is an experimental study tool that:
Detects potential order blocks using a displacement-filtered break of structure.
Marks these zones as boxes that persist until invalidation or expiry.
Provides lightweight order-flow-style proxies such as delta, imbalance, CVD, and effort vs. result.
Allows confirmation of zone touches through these proxies and optional higher-timeframe context.
Offers flexible customization, alerting, and chart-style options.
It is not a trading system by itself but rather a framework for studying price/volume behavior around structurally significant areas. With careful exploration, it can give users new ways to visualize market structure and to understand how simple flow-like measures behave in those contexts.

Order Flow Imbalance Finder By TurkThis indicator is created to find the imbalances when a market exchange receives too many of one kind of order—buy, sell, limit—and not enough of the order's counterpoint and price shoots up or down and it left with unfilled orders. If you know how to trade the imbalances, this indicator can help you by find imbalances automatically.
Order Flow Hawkes Process [ScorsoneEnterprises]This indicator is an implementation of the Hawkes Process. This tool is designed to show the excitability of the different sides of volume, it is an estimation of bid and ask size per bar. The code for the volume delta is from www.tradingview.com
Here’s a link to a more sophisticated research article about Hawkes Process than this post arxiv.org
This tool is designed to show how excitable the different sides are. Excitability refers to how likely that side is to get more activity. Alan Hawkes made Hawkes Process for seismology. A big earthquake happens, lots of little ones follow until it returns to normal. Same for financial markets, big orders come in, causing a lot of little orders to come. Alpha, Beta, and Lambda parameters are estimated by minimizing a negative log likelihood function.
How it works
There are a few components to this script, so we’ll go into the equation and then the other functions used in this script.
hawkes_process(params, events, lkb) =>
alpha = clamp(array.get(params, 0), 0.01, 1.0)
beta = clamp(array.get(params, 1), 0.1, 10.0)
lambda_0 = clamp(array.get(params, 2), 0.01, 0.3)
intensity = array.new_float(lkb, 0.0)
events_array = array.new_float(lkb, 0.0)
for i = 0 to lkb - 1
array.set(events_array, i, array.get(events, i))
for i = 0 to lkb - 1
sum_decay = 0.0
current_event = array.get(events_array, i)
for j = 0 to i - 1
time_diff = i - j
past_event = array.get(events_array, j)
decay = math.exp(-beta * time_diff)
past_event_val = na(past_event) ? 0 : past_event
sum_decay := sum_decay + (past_event_val * decay)
array.set(intensity, i, lambda_0 + alpha * sum_decay)
intensity
The parameters alpha, beta, and lambda all represent a different real thing.
Alpha (α):
Definition: Alpha represents the excitation factor or the magnitude of the influence that past events have on the future intensity of the process. In simpler terms, it measures how much each event "excites" or triggers additional events. It is constrained between 0.01 and 1.0 (e.g., clamp(array.get(params, 0), 0.01, 1.0)). A higher alpha means past events have a stronger influence on increasing the intensity (likelihood) of future events. Initial value is set to 0.1 in init_params. In the hawkes_process function, alpha scales the contribution of past events to the current intensity via the term alpha * sum_decay.
Beta (β):
Definition: Beta controls the rate of exponential decay of the influence of past events over time. It determines how quickly the effect of a past event fades away. It is constrained between 0.1 and 10.0 (e.g., clamp(array.get(params, 1), 0.1, 10.0)). A higher beta means the influence of past events decays faster, while a lower beta means the influence lingers longer. Initial value is set to 0.1 in init_params. In the hawkes_process function, beta appears in the decay term math.exp(-beta * time_diff), which reduces the impact of past events as the time difference (time_diff) increases.
Lambda_0 (λ₀):
Definition: Lambda_0 is the baseline intensity of the process, representing the rate at which events occur in the absence of any excitation from past events. It’s the "background" rate of the process. It is constrained between 0.01 and 0.3 .A higher lambda_0 means a higher natural frequency of events, even without the influence of past events. Initial value is set to 0.1 in init_params. In the hawkes_process function, lambda_0 sets the minimum intensity level, to which the excitation term (alpha * sum_decay) is added: lambda_0 + alpha * sum_decay
Alpha (α): Strength of event excitation (how much past events boost future events).
Beta (β): Rate of decay of past event influence (how fast the effect fades).
Lambda_0 (λ₀): Baseline event rate (background intensity without excitation).
Other parts of the script.
Clamp
The clamping function is a simple way to make sure parameters don’t grow or shrink too much.
ObjectiveFunction
This function defines the objective function (negative log-likelihood) to minimize during parameter optimization.It returns a float representing the negative log-likelihood (to be minimized).
How It Works:
Calls hawkes_process to compute the intensity array based on current parameters.Iterates over the lookback period:lambda_t: Intensity at time i.event: Event magnitude at time i.Handles na values by replacing them with 0.Computes log-likelihood: event_clean * math.log(math.max(lambda_t_clean, 0.001)) - lambda_t_clean.Ensures lambda_t_clean is at least 0.001 to avoid log(0).Accumulates into log_likelihood.Returns -log_likelihood (negative because the goal is to minimize, not maximize).
It is used in the optimization process to evaluate how well the parameters fit the observed event data.
Finite Difference Gradient:
This function calculates the gradient of the objective function we spoke about. The gradient is like a directional derivative. Which is like the direction of the rate of change. Which is like the direction of the slope of a hill, we can go up or down a hill. It nudges around the parameter, and calculates the derivative of the parameter. The array of these nudged around parameters is what is returned after they are optimized.
Minimize:
This is the function that actually has the loop and calls the Finite Difference Gradient each time. Here is where the minimizing happens, how we go down the hill. If we are below a tolerance, we are at the bottom of the hill.
Applied
After an initial guess the parameters are optimized with a mix of bid and ask levels to prevent some over-fitting for each side while keeping some efficiency. We initialize two different arrays to store the bid and ask sizes. After we optimize the parameters we clamp them for the calculations. We then get the array of intensities from the Hawkes Process of bid and ask and plot them both. When the bids are greater than the ask it represents a bullish scenario where there are likely to be more buy than sell orders, pushing up price.
Tool examples:
The idea is that when the bid side is more excitable it is more likely to see a bullish reaction, when the ask is we see a bearish reaction.
We see that there are a lot of crossovers, and I picked two specific spots. The idea of this isn’t to spot crossovers but avoid chop. The values are either close together or far apart. When they are far, it is a classification for us to look for our own opportunities in, when they are close, it signals the market can’t pick a direction just yet.
The value works just as well on a higher timeframe as on a lower one. Hawkes Process is an estimate, so there is a leading value aspect of it.
The value works on equities as well, here is NASDAQ:TSLA on a lower time frame with a lookback of 5.
Inputs
Users can enter the lookback value and timeframe.
No tool is perfect, the Hawkes Process value is also not perfect and should not be followed blindly. It is good to use any tool along with discretion and price action.

Orderflow Label with OffsetThis Pine Script automatically displays orderflow labels on the chart to visualize the current market structure and potential breakout or reversal zones.
It compares the current candle’s high and low with those of the previous cycle (e.g., 90 minutes) and places descriptive labels that highlight possible bullish or bearish behavior.
Functionality & Logic (Step-by-step explanation)
Inputs:
cycleLength: Defines the duration of one “cycle” in minutes (for example, 90 minutes).
labelXOffset: Moves the label a few bars to the right, so it doesn’t overlap the current candle.
labelStyleOffset: Controls whether labels appear pointing to the right or left side of the chart.
Previous Cycle:
The script uses request.security to retrieve the high and low from the previous cycle timeframe.
These act as reference points (similar to key levels or market structure highs/lows).
Current Candle:
The script reads the current bar’s high, low, and close values for comparison.
Orderflow Conditions:
bullSupport: The current high and close are both above the previous high → bullish breakout (strong continuation).
bullReject: The high breaks above the previous high but closes below → bullish rejection / possible top.
bearRes: The low and close are both below the previous low → bearish breakdown (continuation to downside).
bearReclaim: The low goes below the previous low but closes above → bearish reclaim / possible reversal.
Label Logic:
Before creating a new label, the previous one is deleted (label.delete(flowLbl)) to avoid clutter.
The label’s X position is shifted using xPos = bar_index + labelXOffset.
The style (left/right) is set based on the user’s preference.
Displayed Labels:
🟢 Bullish Breakout → price closes above the previous cycle high.
🟠 Bullish Rejection → fake breakout or possible top.
🔴 Bearish Breakdown → price closes below the previous cycle low.
🟡 Bearish Reclaim → failed breakdown or potential trend reversal.
⚪ Neutral (Wait) → no clear signal, advises patience and watching for setups (like CHoCH or FVGs).
Visual Behavior:
The labels appear slightly to the right of the bar for better visibility.
The color and text alignment dynamically adjust depending on whether the label is pointing left or right.

Order Block Volumatic FVG StrategyInspired by: Volumatic Fair Value Gaps —
License: CC BY-NC-SA 4.0 (Creative Commons Attribution–NonCommercial–ShareAlike).
This script is a non-commercial derivative work that credits the original author and keeps the same license.
What this strategy does
This turns BigBeluga’s visual FVG concept into an entry/exit strategy. It scans bullish and bearish FVG boxes, measures how deep price has mitigated into a box (as a percentage), and opens a long/short when your mitigation threshold and filters are satisfied. Risk is managed with a fixed Stop Loss % and a Trailing Stop that activates only after a user-defined profit trigger.
Additions vs. the original indicator
✅ Strategy entries based on % mitigation into FVGs (long/short).
✅ Lower-TF volume split using upticks/downticks; fallback if LTF data is missing (distributes prior bar volume by close’s position in its H–L range) to avoid NaN/0.
✅ Per-FVG total volume filter (min/max) so you can skip weak boxes.
✅ Age filter (min bars since the FVG was created) to avoid fresh/immature boxes.
✅ Bull% / Bear% share filter (the 46%/53% numbers you see inside each FVG).
✅ Optional candle confirmation and cooldown between trades.
✅ Risk management: fixed SL % + Trailing Stop with a profit trigger (doesn’t trail until your trigger is reached).
✅ Pine v6 safety: no unsupported args, no indexof/clamp/when, reverse-index deletes, guards against zero/NaN.
How a trade is decided (logic overview)
Detect FVGs (same rules as the original visual logic).
For each FVG currently intersected by the bar, compute:
Mitigation % (how deep price has entered the box).
Bull%/Bear% split (internal volume share).
Total volume (printed on the box) from LTF aggregation or fallback.
Age (bars) since the box was created.
Apply your filters:
Mitigation ≥ Long/Short threshold.
Volume between your min and max (if enabled).
Age ≥ min bars (if enabled).
Bull% / Bear% within your limits (if enabled).
(Optional) the current candle must be in trade direction (confirm).
If multiple FVGs qualify on the same bar, the strategy uses the most recent one.
Enter long/short (no pyramiding).
Exit with:
Fixed Stop Loss %, and
Trailing Stop that only starts after price reaches your profit trigger %.
Input settings (quick guide)
Mitigation source: close or high/low. Use high/low for intrabar touches; close is stricter.
Mitigation % thresholds: minimal mitigation for Long and Short.
TOTAL Volume filter: skip FVGs with too little/too much total volume (per box).
Bull/Bear share filter: require, e.g., Long only if Bull% ≥ 50; avoid Short when Bull% is high (Short Bull% max).
Age filter (bars): e.g., ≥ 20–30 bars to avoid fresh boxes.
Confirm candle: require candle direction to match the trade.
Cooldown (bars): minimum bars between entries.
Risk:
Stop Loss % (fixed from entry price).
Activate trailing at +% profit (the trigger).
Trailing distance % (the trailing gap once active).
Lower-TF aggregation:
Auto: TF/Divisor → picks 1/3/5m automatically.
Fixed: choose 1/3/5/15m explicitly.
If LTF can’t be fetched, fallback allocates prior bar’s volume by its close position in the bar’s H–L.
Suggested starting presets (you should optimize per market)
Mitigation: 60–80% for both Long/Short.
Bull/Bear share:
Long: Bull% ≥ 50–70, Bear% ≤ 100.
Short: Bull% ≤ 60 (avoid shorting into strong support), Bear% ≥ 0–70 as you prefer.
Age: ≥ 20–30 bars.
Volume: pick a min that filters noise for your symbol/timeframe.
Risk: SL 4–6%, trailing trigger 1–2%, distance 1–2% (crypto example).
Set slippage/fees in Strategy Properties.
Notes, limitations & best practices
Data differences: The LTF split uses request.security_lower_tf. If the exchange/data feed has sparse LTF data, the fallback kicks in (it’s deliberate to avoid NaNs but is a heuristic).
Real-time vs backtest: The current bar can update until close; results on historical bars use closed data. Use “Bar Replay” to understand intrabar effects.
No pyramiding: Only one position at a time. Modify pyramiding in the header if you need scaling.
Assets: For spot/crypto, TradingView “volume” is exchange volume; in some markets it may be tick volume—interpret filters accordingly.
Risk disclosure: Past performance ≠ future results. Use appropriate position sizing and risk controls; this is not financial advice.
Credits
Visual FVG concept and original implementation: BigBeluga.
This derivative strategy adds entry/exit logic, volume/age/share filters, robust LTF handling, and risk management while preserving the original spirit.
License remains CC BY-NC-SA 4.0 (non-commercial, attribution required, share-alike).

Orderblocks | iSolani
Revealing Institutional Footprints: The iSolani Volume-Powered Order Block System
Where Smart Money Leaves Its Mark – Automated Zone Detection for Discretionary Traders
Core Methodology
Pressure-Weighted Volume Analysis
Calculates directional commitment using candle position:
Buying Pressure = Total Volume × (Closing Price – Low) / (High – Low)
Selling Pressure = Total Volume × (High – Closing Price) / (High – Low)
Normalizes values against 31-period EMAs to filter retail noise
Adaptive Block Triggering
Identifies significant zones when:
Absolute Buy/Sell Difference > 4× SMA of Historical Differences (default)
Price closes bullishly (green block) or bearishly (red block)
Self-Maintaining Visualization
Blocks auto-extend rightward until price breaches critical level
Invalidated zones removed in real-time via array management
Technical Innovation
Dynamic Threshold Adjustment
Multiplier parameter (default 4) automatically scales with market volatility
Institutional-Grade Metrics
Blocks display:
Volume disparity in absolute terms
Percentage deviation from 33-period average
Directional bias through color-coding
Efficient Memory Handling
O(n) complexity cleanup routine prevents chart lag
System Workflow
Calculates real-time buy/sell pressure ratios
Compares to historical average (31-period default)
Generates semi-transparent zones (85% opacity) at spike locations
Monitors price interaction with block boundaries
Automatically retracts invalid zones
Standard Configuration
Sensitivity : 4× multiplier (ideal for 15m-4h charts)
Visuals : Red/green blocks with white text labels
Duration : 50-bar default extension
Volume Baseline : 33-period EMA filter
Boundary Check : Close beyond block high/low triggers deletion
This system transforms raw market data into a institutional roadmap – not by predicting turns, but by revealing where concentrated volume makes turns statistically probable. The color-coded blocks serve as persistent yet adaptive markers of where professional liquidity resides.
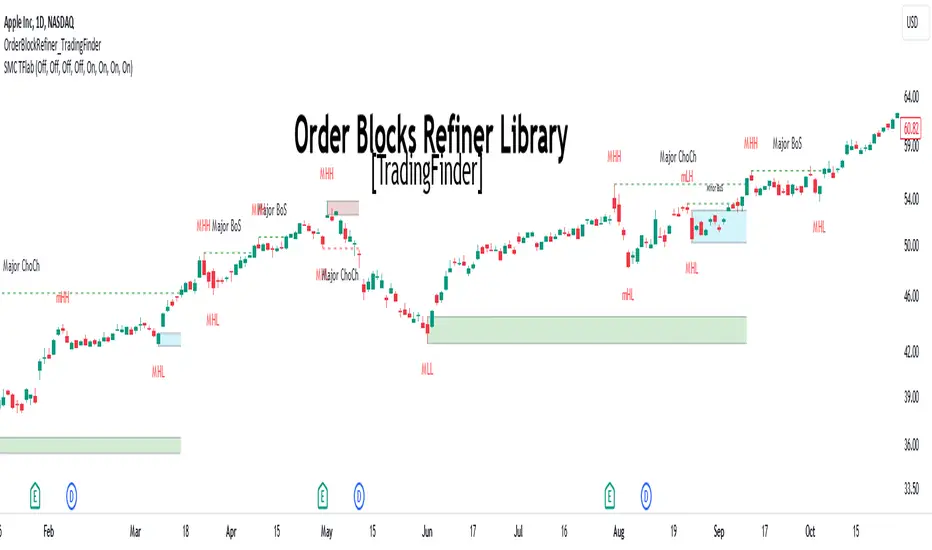
Order Block Refiner [TradingFinder]🔵 Introduction
The "Refinement" feature allows you to adjust the width of the order block according to your strategy. There are two modes, "Aggressive" and "Defensive," in the "Order Block Refine". The difference between "Aggressive" and "Defensive" lies in the width of the order block.
For risk-averse traders, the "Defensive" mode is suitable as it provides a lower loss limit and a greater reward-to-risk ratio. For risk-taking traders, the "Aggressive" mode is more appropriate. These traders prefer to enter trades at higher prices, and this mode, which has a wider order block width, is more suitable for this group of individuals.
Important :
One of the advantages of using this library is increased code accuracy. Not only does it have the capability to create order blocks, but you can also simply define the condition for order block creation (true/false) and "bar_index," and you'll find the primary range without applying any filters.
🟣 Order Block Refinement Algorithm
The order block ranges are filtered in two stages. In the first stage, the "Open," "High," "Low," and "Close" of the current order block candle, its two or three previous candles, and one subsequent candle (if available) are examined. In this stage, minimum and maximum distances are calculated, and logical range filters are applied.
In the second stage, two modes, "Aggressive" and "Defensive," are calculated.
For the "Defensive" mode, the width of these ranges is compared with the "ATR" (Average True Range) of period 55, and if they are smaller than "ATR" or 1 to more than 4 times "ATR," the width of the range is reduced from 0 to 80 percent.
For the "Aggressive" mode, you get the same output as the first filter, which usually has a wider width than the "Defensive" mode.
• Order Block Refiner : Off
• Order Block Refiner : On / "Aggressive Mode"
• Order Block Refiner : On / "Defensive Mode"
🔵 How to Use
OBRefiner(string OBType, string OBRefine, string RefineMethod, bool TriggerCondition, int Index) =>
Parameters:
• OBType (string)
• OBRefine (string)
• RefineMethod (string)
• TriggerCondition (bool)
• Index (int)
To add "Order Block Refiner Library", you must first add the following code to your script.
import TFlab/OrderBlockRefiner_TradingFinder/1
OBType : This parameter receives 2 inputs. If the order block you want to "Refine" is of type demand, you should enter "Demand," and if it's of type supply, you should enter "Supply."
OBRefine : Set to "On" if you want the "Refine" operation to be performed. Otherwise, set to "Off."
RefineMethod : This input receives 2 modes, "Aggressive" and "Defensive." You can switch between these modes according to your needs.
TriggerCondition : Enter the condition with which the order block is formed in this parameter.
Index : Enter the "bar_index" of the candle where the order block is formed in this parameter.
🟣 Function Outputs
This function has 6 outputs: "bar_index" at the beginning of the "Distal" line, "bar_index+1" at the end of the "Distal" line, "Price" at the "Distal" line, "bar_index" at the beginning of the "Proximal" line, "bar_index+1" at the end of the "Proximal" line, and "Price" at the "Proximal" line, which can be used to draw order blocks.
Sample :
= Refiner.OBRefiner('Demand', 'Off', 'Aggressive',BuMChMain_Trigger, BuMChMain_Index)
if BuMChMain_Trigger
BuMChHlineMain := line.new(BuMChMain_Xp1 , BuMChMain_Yp12 , bar_index , BuMChMain_Yp12, color = color.black , style = line.style_dotted)
BuMChLlineMain := line.new(BuMChMain_Xd1 , BuMChMain_Yd12 , bar_index , BuMChMain_Yd12, color = color.black , style = line.style_dotted)
BuMChFilineMain := linefill.new(BuMChHlineMain ,BuMChLlineMain , color = color.rgb(76, 175, 80 , 75 ) )
Order Blocks (SMC/ICT)Order Blocks (SMC/ICT) — TradingATH
Precision. Intent. Structure.
This refined tool automatically detects and displays Order Blocks (OBs) with clean, institutional clarity—mapping the exact zones where displacement originated and where price is most likely to rebalance or react. Built for SMC/ICT Traders , it presents bullish and bearish OBs with disciplined visuals, mitigation logic, and efficient performance on any timeframe.
What You’ll See
Bullish Order Blocks in balanced green shading with a mid-line, borders, and a compact label.
Bearish Order Blocks in refined red tones, equally annotated and visually consistent.
Controlled Extension of zones for a chosen number of bars—or dynamic extension until mitigation.
Configurable Labels with selectable position (Top/Bottom, Left/Right) and custom label font color per side.
Mid-Line (Average) through each OB for precise reference and execution alignment.
Features
Volume Pivot Logic : OBs are derived from a volume pivot length, focusing on zones that matter where displacement had participation.
Mitigation Methods : Validate via Wick or Close, adapting to different liquidity conditions and your SMC playbook.
ATR Size Filter : Enforce minimum/maximum size (×ATR) to remove insignificant zones and retain only the highest-quality blocks.
Extend-Until-Mitigated : Keep active zones projected into future bars until price mitigates—ensuring they remain actionable.
Clean Plotting : Size-safe arrays, time-anchored boxes/lines, and efficient updates for smooth operation in intraday and swing contexts.
Alert Suite :
OB Formed: Bullish/Bearish OB creation.
OB Mitigated: Zone filled/invalidated.
Price Entered OB: Live notification when price re-enters the most recent OB.
Perfect For
ICT/SMC Traders mapping institutional zones with precise mitigation behavior.
Intraday Traders who need real-time OB formation and entry alerts without chart clutter.
Swing Traders filtering only valid, well-sized OBs using ATR-based constraints.
Analysts & Educators requiring a reliable, visually consistent tool for teaching structure and mitigation.
Recommended Settings
Volume Pivot Length : 5–14 (balance sensitivity vs. selectivity).
Mitigation : Wick for responsiveness; Close for stricter confirmation.
OB Length (bars) : 10–50 for controlled reach; enable Extend until mitigation for live tracking.
ATR Filter : Min 0.25×, Max 3× to exclude noise while preserving meaningful blocks.
Labels : Position Bottom-Right (default), adjust label font color for readability on your theme.
In Short
Institutional logic. Clean execution. Professional clarity.
Order Blocks (SMC/ICT) — TradingATH presents structurally sound zones with precise mitigation handling and alerting—crafted for traders who demand both analytical accuracy and visual refinement.
Created by: TradingATH

Order Blocks — Smart Mitigation & OB Labels (SMC/ICT)Order Blocks — Smart Mitigation & OB Labels (SMC/ICT) — TradingATH
Precision. Stability. Execution.
This refined indicator automatically detects and draws bullish and bearish Order Blocks , perfectly anchored to the candle that created them. Each zone remains fixed, never drifting as you move the chart, ensuring absolute spatial accuracy.
ATR-based filters remove insignificant blocks, and optional live extensions allow active OBs to project forward until price delivers mitigation.
What You’ll See
Bullish Order Blocks in subtle green tones, with a fine mid-line and a small label reading “Bullish OB (Order Block)”.
Bearish Order Blocks in elegant red tones, equally marked and labeled.
Compact, controlled-length zones extending only for the defined number of bars.
Optional dynamic extension for unmitigated blocks until price returns.
Real-time alerts when price enters the most recent bullish or bearish OB.
Features
True anchoring : OBs are plotted in absolute time coordinates, fixed to the original source candle. No drift.
Custom length control : Adjust each block’s horizontal reach by number of bars.
ATR-based filters : Define minimum and maximum OB size (in multiples of ATR) to maintain clean and relevant zones.
Smart mitigation logic : Choose between “Wick” or “Close” for OB validation; mitigated blocks are automatically removed.
Elegant labeling : Minimalistic text inside each block, positionable in any corner for optimal readability.
Advanced alerts : Automated signals for new OB formation and price entry into the latest block.
Professional architecture : Size-safe arrays, optimized rendering, and zero performance waste.
ICT/SMC ready : Fully compatible with advanced concepts such as Fair Value Gaps, Liquidity Sweeps, and Session Timing.
Perfect For
Traders applying ICT or Smart Money Concepts who require precise OB identification and mitigation tracking.
Intraday traders seeking clarity and efficiency on fast-moving charts.
Swing traders filtering premium-quality OBs based on volatility structure.
Recommended Settings
OB Length: 10 bars (adjust to timeframe and volatility).
Label position: Bottom-Right for most clarity.
Mitigation method: “Wick” for flexible precision; “Close” for stricter validation.
ATR filter: Minimum 0.25×, Maximum 3× (balanced range for most assets).
In Short
Clean structure. Absolute precision. Professional delivery.
Order Blocks — Smart Mitigation & OB Labels (SMC/ICT) provides a stable, disciplined visualization of institutional order flow — designed for traders who demand both accuracy and aesthetic refinement.
Created by: TradingATH

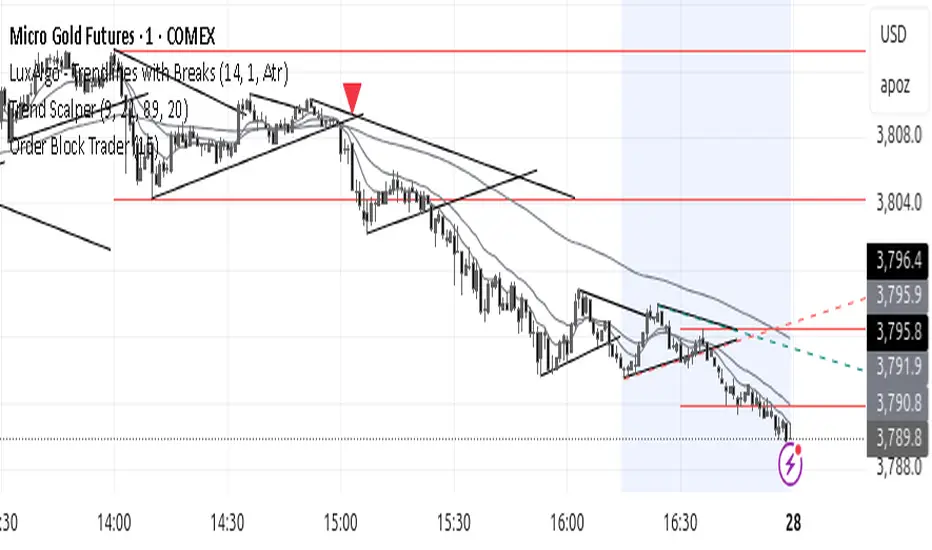
Order Block TraderThe Order Block (HTF) indicator automatically detects and plots higher timeframe order blocks directly onto your chart. Order blocks represent zones of institutional buying or selling pressure that often act as powerful support or resistance levels when revisited. This tool is designed for traders who want to align their lower timeframe entries with higher timeframe structure, helping to filter noise and focus on the most meaningful price levels.
What This Indicator Does
Scans a higher timeframe of your choice to identify potential bullish and bearish order blocks.
Draws the blocks on your current chart, extending them forward in time as reference zones.
Highlights trade signals when price returns to and reacts at these order blocks.
Optionally triggers alerts so that you never miss a potential opportunity.
How It Can Be Used Successfully
Bullish Setup: A bullish order block may serve as a demand zone. When price revisits it, look for bullish confirmation such as a bounce from the block low and a close back above it. This can be used as a long entry point, with stops placed just below the block.
Bearish Setup: A bearish order block may serve as a supply zone. When price revisits it, watch for rejection at the block high followed by a close back below it. This can be used as a short entry point, with stops placed just above the block.
Multi-Timeframe Trading: Use order blocks from larger timeframes (e.g., 4H or Daily) as key zones, then drill down to shorter timeframes (e.g., 5m, 15m) to refine entries.
Confluence with Other Tools: Combine order block signals with your existing strategy—trend indicators, Fibonacci levels, moving averages, or candlestick patterns—for stronger confirmation and improved win probability.
Trade Management: Treat order blocks as zones rather than single price levels. Position sizing, stop placement, and risk-to-reward management remain essential for long-term success.
This indicator is not a standalone trading system but a framework for identifying high-probability supply and demand zones. Traders who apply it consistently—alongside proper risk management and confirmation methods—can improve their ability to catch trend continuations and reversals at structurally important levels.
Order Blocks📈 Order Blocks Only (With Mitigation Alerts)
This indicator identifies bullish and bearish order blocks on your chart and alerts you when they are formed or mitigated . Order blocks are key institutional price levels where strong buying or selling has previously occurred, often leading to significant future price reactions.
🔍 How It Works:
-Bullish Order Block: Formed when price closes above the high of a recent bearish candle. This suggests buyers have taken control.
-Bearish Order Block: Formed when price closes below the low of a recent bullish candle. This signals seller dominance.
-Once an order block is formed, a box is drawn on the chart to highlight the zone.
-These boxes last for a user-defined number of bars (default is 20) and can be automatically removed when price mitigates (retests and closes beyond) the zone.
🛠 User Settings:
-Show Bullish Order Blocks – Toggle green zones on/off.
-Show Bearish Order Blocks – Toggle red zones on/off.
-Order Block Duration – How many bars the boxes should remain on the chart.
-Delete Mitigated Boxes – If enabled, mitigated zones are automatically removed.
-Custom Colors – Personalize the fill and border colors of bullish and bearish blocks.
🔔 Alerts:
This tool supports four built-in alert types:
-Bullish Order Block Formed
-Bearish Order Block Formed
-Bullish Order Block Mitigated
-Bearish Order Block Mitigated
Set these alerts to stay on top of key price reactions.
✅ How to Use It:
1. Apply the indicator to any chart and timeframe.
2. Watch for new order blocks to form after strong price breaks.
3. Use these zones as potential entry points, stop placement areas, or take profit zones.
4. Enable alerts to catch key institutional levels as they form or are retested.

Order BlockOverview:
The Order Block Indicator is designed to help traders identify key bullish and bearish order blocks on their charts. Order blocks are significant price zones where institutional activity may have occurred, often leading to strong reversals or continuations. This indicator visually highlights these blocks and provides alerts for potential trade opportunities.
Key Features
Bullish Order Blocks (Yellow):
Identifies bullish structures where price signals a potential upward movement.
Highlighted in bright yellow to stand out on your chart.
Bearish Order Blocks (Pink):
Detects bearish structures where price suggests a possible downward movement.
Highlighted in pink for easy identification.
Alerts for Order Blocks:
Sends a notification whenever a bullish or bearish order block is detected.
Keeps you informed of key market zones even when you’re away from the screen.
How It Works
Bullish Order Block Criteria
The last candle (close ) is bullish (close > open).
The second last candle (close ) is bearish (close < open).
The bullish candle’s close is above the high of the bearish candle.
The bearish candle’s close is above the low of the third last candle.
The bearish candle’s low is below the low of the third last candle.
The current candle’s low is above the bearish candle’s high.
These conditions combine to identify strong bullish zones.
Bearish Order Block Criteria
The last candle (close ) is bearish (close < open).
The second last candle (close ) is bullish (close > open).
The bearish candle’s close is below the low of the bullish candle.
The third last candle’s high is above the bullish candle’s close.
The bullish candle’s high is above the high of the third last candle.
The current candle’s high is below the bullish candle’s low.
This logic highlights potential bearish zones.
How to Use It
Add the Indicator to Your Chart:
Use it on any timeframe to spot bullish or bearish order blocks.
Visual Assistance:
Yellow bars indicate bullish order blocks.
Pink bars represent bearish order blocks.
Set Alerts:
Configure alerts to notify you when a bullish or bearish order block appears.
Customization
Colors: Easily change the colors for bullish and bearish order blocks.
Alerts: Adjust alert messages to suit your trading preferences.
Disclaimer:
This indicator is a technical analysis tool and should be used alongside other strategies and market analysis. It does not guarantee profits and carries trading risks. Always trade responsibly.