DRM StrategyOne of the ways I go when I develop strategies is by reducing the number of parameters and removing fixed parameters and levels.
In this strategy, I'm trying to create an RSI indicator with a dynamic length.
Length is computed based on the correlation between Price and its momentum.
You can set min and max values for the RSI, and if the correlation is close to 1, we'll be at a min RSI value. When it's -1, we'll be at the max level.
I got this idea from Sofien Kaabar's book.
The strategy is super simple, and there might be much room for improvement.
Performance on the deep backtesting is not excellent, so I think the strategy needs some filters for regimes, etc.
Thanks to @MUQWISHI for helping me code it.
Disclaimer
Please remember that past performance may not indicate future results.
Due to various factors, including changing market conditions, the strategy may no longer perform as well as in historical backtesting.
This post and the script don’t provide any financial advice.
"one一季度财报" için komut dosyalarını ara

IT-Dual Relative StrengthOne can use this indicator to compare two security i.e. (Nifty and stock with its own sector) how it is performing in compare with preferred index ( Nifty 50 by default).
> 0 outperforming
< 0 underperforming
Works best for Daily TF, but can be applied to Weekly and monthly charts .
Can be use on smaller time frame as well, as per the number of hour you want to calculate.
Apply it to Nifty 50 , industry index, sector index or other security in similar sector
I have Added the Box table as well which shows the performance agents Nifty and selected sector.

ERDAL SARIDAS Visual RSIOne-stop shop for all your divergence needs, including:
(1) A single metric for divergence strength across multiple indicators.
(2) Labels that make it easy to spot where the truly strong divergence is by showing the overall divergence strength value along with the number of divergent indicators. Hovering over the label shows a breakdown of each divergent indicator and its individual divergence strength value.
(3) Fully customizable, including inputs for pivot lengths, divergence types, and weights for every component of the divergence strength calculation. This allows you to quickly and easily optimize the output for any chart. Don't worry, the default settings will have you covered if you're not interested in what's going on under the hood.
The Divergence Strength Calculation:
The total divergence strength value is the sum of the divergence strengths of all indicators for which divergence was detected at a given bar. Each indicator's individual divergence strength is comprised of two basic components: (1) |ΔPrice| - the magnitude of the change in price over the divergence period (pivot-to-pivot), and (2) |ΔIndicator| - the magnitude of the change in indicator value over the divergence period.
Because different indicators' scales and volatility can vary greatly, the Δ values are expressed in terms of standard deviation to ensure that the values are meaningful and equitable across all indicators and assets/instruments/currency pairs, etc:
|ΔIndicator| = |indicator_value_1 - indicator_value_2| / 2 * StDev(indicator_series,100)
Calculation Weights:
All components of the calculation are weighted and can be modified on the Inputs page in settings (weights are simply multipliers). For example, if you think hidden divergence should carry less weight than regular divergence, you can assign it a lesser weight. Or if you think RSI divergence is worth more than OBV divergence, you can adjust their weights accordingly. List of weights:
Regular divergence weight - default = 1
Hidden divergence weight - default = 1
ΔPrice weight - default = 0.5 (multiplied by the ΔPrice component)
ΔIndicator weight - default = 1.5 (multiplied by the ΔIndicator component)
RSI weight - default = 1.1
OBV weight - default = 0.8
MACD weight - default = 0.9
STOCH weight - default = 0.9
Development for additional indicators is ongoing, as is research into the optimal weight configuration(s).
Other Inputs:
Pivot lengths - specify the number of bars before and after each pivot high/low to consider it a valid candidate for divergence.
Lookback bars and Lookback pivots - specify the number of bars or the number of pivots to look back across.
Price sources - specify separate price sources for bullish and bearish divergence
Display settings - specify how lines and labels should display, including which divergence strength values should show the largest labels. Include/exclude specific divergence types and indicators.
Please report any bugs, or let me know if you have any enhancement suggestions or requests for additional indicators.

One Minute Algo Run (OMAR)OMAR marks the High and Low range of the opening candle (1min is recommended default for trading this) based on the current time frame in current session.
Additionally it marks recommended 1x and 2x extensions of the ranges for taking profit that may also be adjusted as needed.

Heikin-Ashi Candle ColorOne of the biggest complaints about Heikin Ashi is the lack of real price data you receive. This attempts to give you as much information as possible by displaying both the candle color and the Heikin Ashi color. The wick takes on the original color while the body of the candle gets the Heikin Ashi color. The only downside to this method is that you do not get to see candle patterns. As always I hope you enjoy this release!

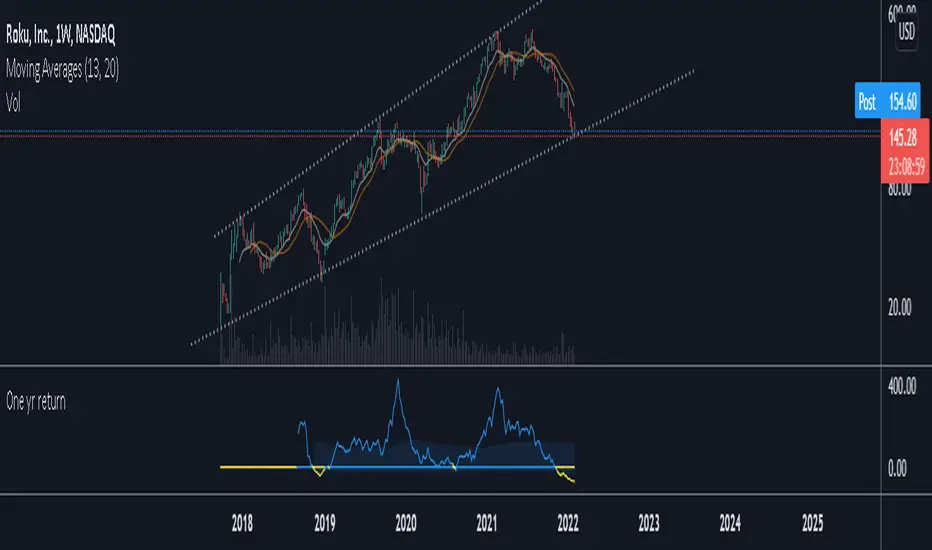
One Year ReturnThis is a script meant for the weekly timeframe . It shows the change between the current close and the close 52 bars ago. I find that this data can be useful for deciding how long to stay in a trade, and for deciding how far a stock is likely to move in a year based on it's historical returns. The High average takes the sum of all positive returns and averages it using the number of bars where the data was positive, the low average does the same but with all the returns below zero. When both are turned on you will see a band between these values.
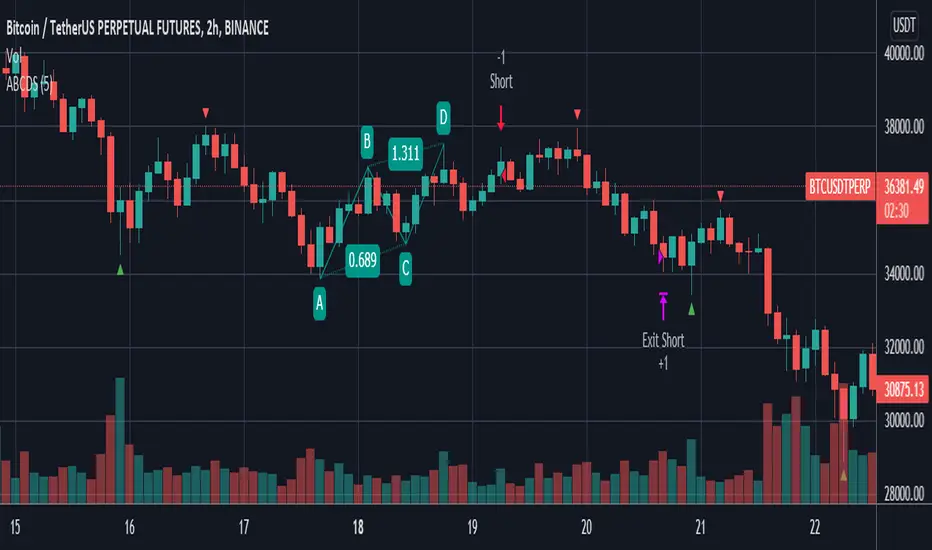
ABCD StrategyOne from many harmonic pattern that consists of two equivalent price legs. The ABCD pattern that helps traders predict when the price is about to change direction.
Tracing And Calculation
This code using pivot high and pivot low built-in method and calculate with Fibonacci Retracement.
Limitation
To find ABCD pattern is very difficult, just coming up a few from thousand candle. That why this code using little bit tolerance ratio to get more pattern.
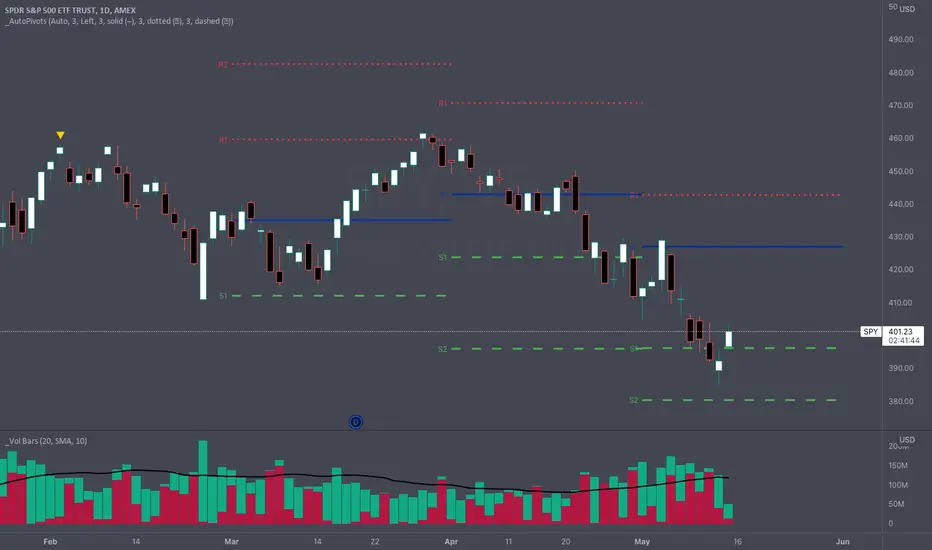
_Auto Pivot PointsOne of the main drawbacks to displaying Pivot Points on a chart is that many times the more extreme pivots (R/S3, R/S4, R/S5) aren't anywhere close to the price action during a timeframe. These extreme pivot points clutter up your chart and make it hard to use the "auto" zoom feature of TradingView.
The " _Auto Pivot Points " indicator solves these problems by automatically only displaying the pivot points if the price has crossed the pivot during the timeframe or it is the next closest pivot . For example, on monthly pivots if the price has only crossed the R1 Pivot then this indicator will display the R2 Pivot and any pivots below but it won't display the R3, R4, R5 pivots . The R3, R4, & R5 pivots are not very useful to the trader because the price hasn't even crossed the R2 Pivot . But as soon as the price crosses the R2 Pivot then this indicator will display the R3 Pivot because it is the next closest. And the same logic applies to the S Pivots .
If you need to see all the Pivots then there is a convenient toggle to display all the pivots by turning off the intelligent auto pivots . But as soon as you don't need to display all the pivots the toggle will turn on the automatic pivots .
This indicator has many style and logic options. This script allows you to control:
Number of past timeframes to display
Displaying Pivot labels
Label position (left/right)
Line color
Line width
Note: TradingView has a limit of 40 security calls per script. Due to this limitation this indicator can only display pivots a max of 7 time periods back.
Note 2: This indicator uses the Traditional pivot calculations.
ATR Trailing Stop v5 One of my favorite stops is the ATR Trailing Stop-loss. With the implementation of PineScript v5, a code update was needed in order to use this stop/exit-strategy with newer strategy scripts. A timeframe selector that was not featured on earlier versions is also included. This new version can be plugged into PineScript v5 strategies, and also has a simpler/cleaner code that makes the code logic easier to follow than prior versions.
For those that are unfamiliar with the ATR Trailing Stop exit strategy; it is a trailing stop that takes into account the volatility of the underlying asset by trailing the price series using a multiple of the Average True Range (ATR). In practice I’ve found that this exit can be more effective than traditional trailing stops, depending on the volatility of the asset you are trading. More detailed information can be found at www.stockopedia.com
How do I use it? Add it to your chart as an indicator to visualize where the ATR stop would be with your settings. Or, copy and add it to your v5 strategy with the addition of a ta.crossunder(close, ATRTrailingStop) or ta.crossover(close, ATRTrailingStop) function. Special thanks and credit to HPotter who coded an earlier version of this in pine!

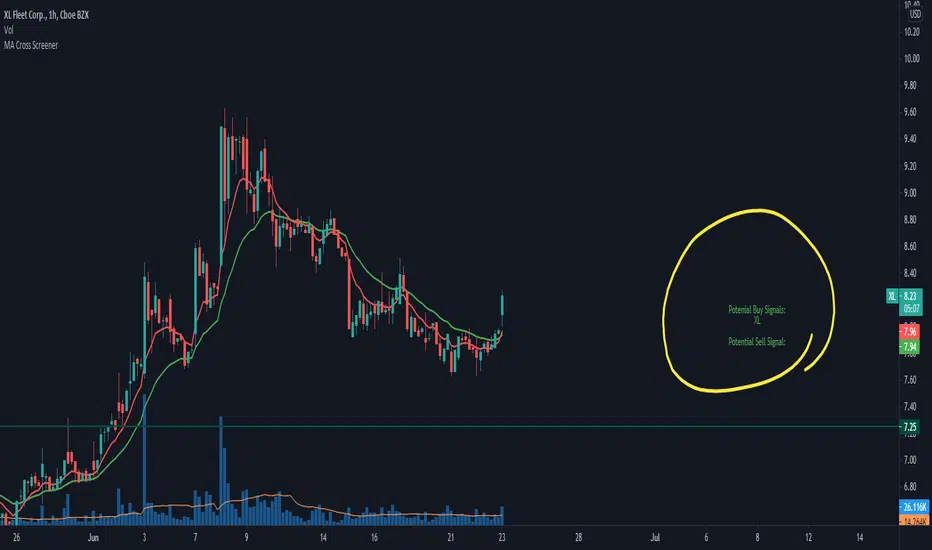
Moving Average Cross ScreenerOne of the best methods to find a winning stock or crypto in the early stages is looking for an 8 and 21 ema cross. I have developed an indicator in trading view which helps you to create a watchlist of 20 instruments (stocks, forex, crypto) and monitor them - in any time frame - continuously and simultaneously to find any moving average crossing (bullish or bearish).
You can easily change the moving average length or moving averages type (EMA, SMA) in the menu of the indicator.
By using this tool you can easily find many potential long or short setups every day.
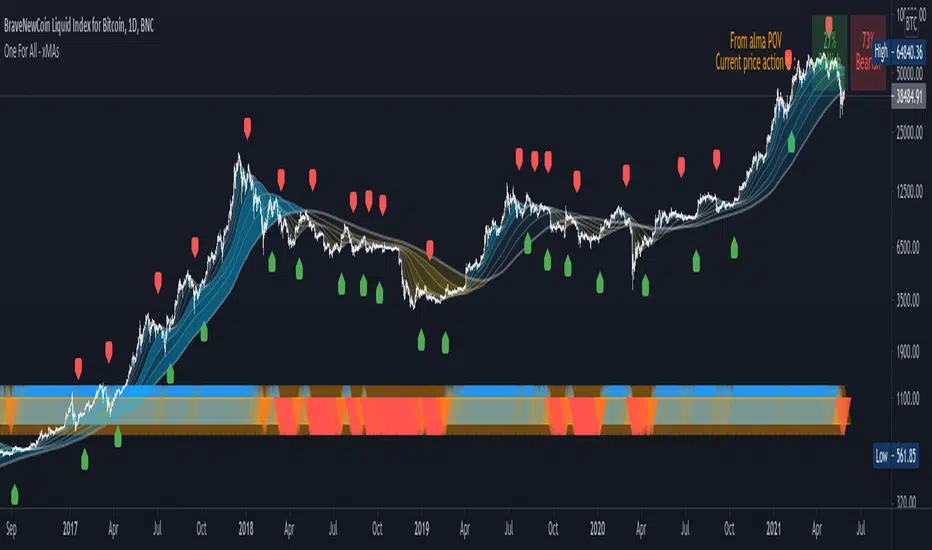
One For All - xMAs : wave ribbon + trend strenght + xMAcrossThis script is not intended to bring anything new or original, but mainly for educational purposes and aesthetic visualization of 10 moving average behavior.
Main features :
Moving Averages : as shown by the wave ribbon (the gradient colored areas opacity is correlated with the distance from the Nth xMA to the last xMA)
Trend Strenght : as shown by the blue/orange/red triangle shape plotted at the bottom of the chart
Moving Average Cross Signal : as shown by the labels green LabelUp and red LabelDown
Also it is designed to be easily customizeable as the settings allow to:
Chose different smoothing method for the 10 xMAs plotted
Manually setup the length of each xMA or simply select a predefined list of convenient length
Choose different MA length not only for crossover but also for crossunder
Trend Strenght explanation :
When all the "fast xMA" are above "slow xMA" there is an opaque Blue UpTriangle plotted at bottom (bull trend)
As more "fast xMA" fall/cross below "slow xMA", the Blue UpTriangle will start fading to a translucid orange UpTriangle
As even more "fast xMA" fall/cross below "slow xMA", a Red DownTriangle is plotted insteand and become more and more opaque as more MA fall below others
Overall, this means that the opacity of the triangles represent trend strenght and a fading trend is shown by the color fading into a translucid orange color
p.s. : If you would like to see some other MA calculation method included, please comment below, I'd be happy to update this script
RSI Classic Strategy (by Coinrule)One of the questions hobbyist traders more often ask is: what is the perfect trading indicator?
Every indicator is just a tool, so its efficiency is proportional to your ability to read its signals and translate them into an actionable trading strategy. The RSI is likely the most flexible and easy to use among the technical indicators.
This trading strategy tries to catch short-term swings on the coins of your choice with a simple yet profitable setup.
Buy when the RSI is lower than 30 (you can adjust it to 35 in times of steep uptrend).
Sell when the RSI is greater than 65 (the target may range between 60 and 75 depending on the volatility of the coin).
Note that the buy signal comes when the indicator crosses below 30 and not when it crosses above 30 as it happens on the built-in RSI strategy on Tradingview.
The present script overperforms the built-in strategy, even adding trading fees and using a lower amount of capital for each trade (30%). That means that the system can deliver higher net-profits with lower risk levels.
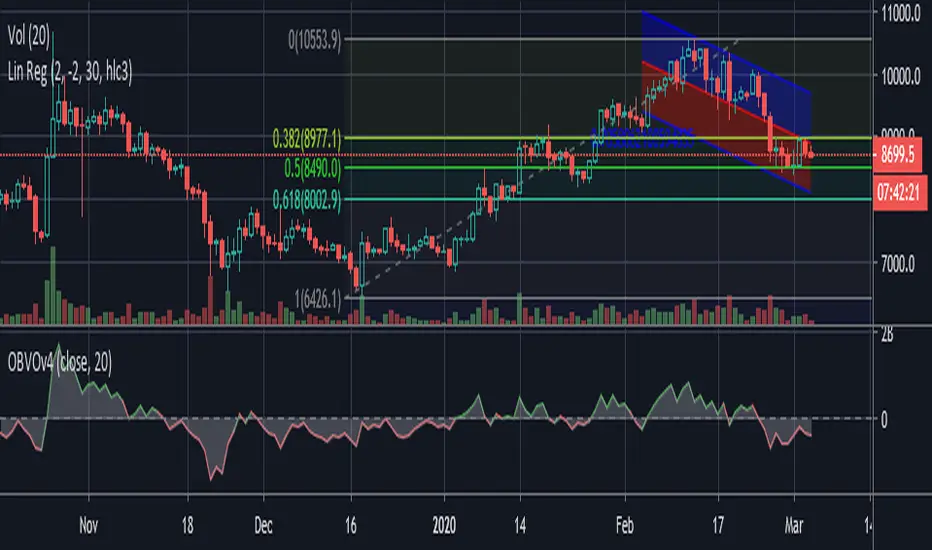
A typical example of market conditions where this strategy works perfectly is as follows.
The first initial breakout indicates that a new leg up in the trend may start. Bitcoin starts to trade within a range which you can identify when it reaches the point 3. That is the perfect time to start the rule because
- trading within a channel anticipates possible swings up and down
- the trend is on the upside, providing low downside risk in buying the dips.
This strategy works well with selected coins of your choice, and it's a great fit on leverage exchanges like Binance Futures.
If you prefer to run it across all available coins on the market, instead, you may choose an optimized version.

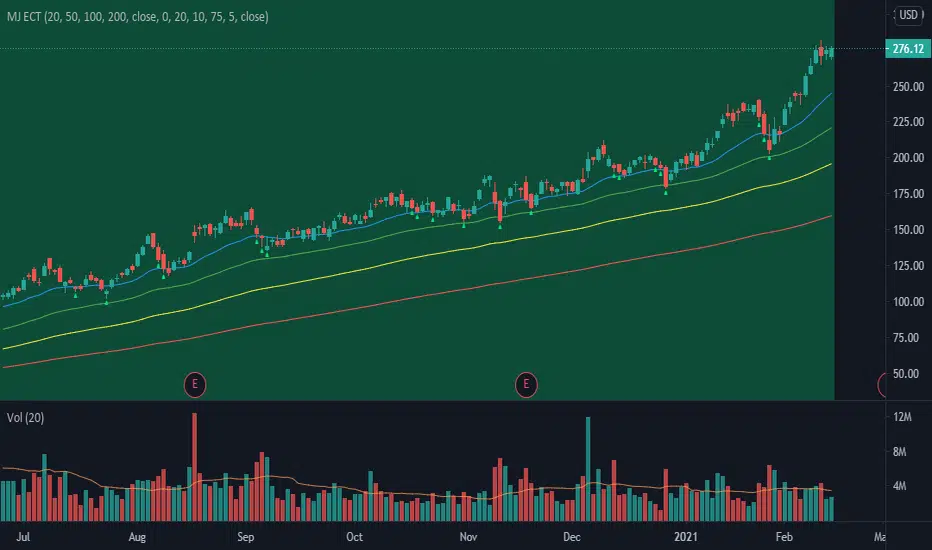
MJ ECT== One Line Introduction ==
ECT is a multi-level, trend focused technical indicator based on a three-step hierarchical approach - comprising the tide, wave, and ripple - to trend identification.
== Indicator Philosophy ==
The author believes that market trends can be understood in a three-step hierarchy, with tide at the top, wave in the middle, and ripple at the bottom, corresponding to long-, middle-, and short-term momentum in the stock price. This indicator therefore comprises three technical indicators which aims to reflect the abovementioned features of a trend. These three components are True Strength Index (TSI), Exponential Moving Averages ( EMA ), and Commodity Channel Index ( CCI ).
== Indicator Components and Breakdown ==
True Strength Index (TSI) -> Tide
A 20-period TSI is used to visualize the bullish or bearish sentiment surrounding the stock. Crossovers above the zero line are interpreted as bullish while crossovers below the zero line are interpreted as bearish . This is painted into the background where green represents bullish and red represents bearish . While the background is red ( bearish ), no bullish positions should be taken. Hence, the TSI painted background acts as a directional bias filter and going against the bias is not recommended. After understanding the directional bias, the user can delve further into the areas of value for the stock in the Wave.
Exponential Moving Averages ( EMA ) -> Wave
Four EMA are used (20, 50, 100, 200) to identify the dynamic support and resistance waves in a trending market. Stock price pullbacks into any of these EMA represent areas of value where the user can consider taking positions. The correct EMA to use depends on individual stock's behavior, with multiple bounces on a specified EMA being the priority. After understanding which wave best reflects the area of value of a stock, the user can move on to the Ripple to time their entries.
Commodity Channel Index ( CCI ) -> Ripple
A 5-period CCI is used to identify short-term oversold conditions where prices are on discount. Discount is defined by the 5-period CCI crossing below -100 as it reflects a weekly oversold condition. The indicator will display a small triangle below the candle when this condition is met.
== Ready To Deploy Field Manual ==
When background is painted red, do nothing.
When background is painted green, begin thinking of bullish opportunities.
Look for the specific EMA that has the most bounces of stock price in recent months, this is the area of value to look for buying opportunity.
For the candles that intersect the EMA you identified above, watch for the appearance of a small triangle below the candle that tells you the entry timing.
When the entry timing signal triangle appears, remember the High of that candle and buy your position when the subsequent candle breaks above this High.
If the High is not broken above in the next immediate candle, remember the newer High of the newer candle (basically follow / trail the latest High until a break above is hit).
If the background turns from green to red, stop following the High and do not enter because the market sentiment has changed to bearish .
If you are holding an existing position and the background turns red, consider exiting the position. You may consider remembering the Low of the candle and exit your position if this Low is broken below on a subsequent candle.
== Best Wishes ==
The author wishes the best success for all users of this technical indicator.
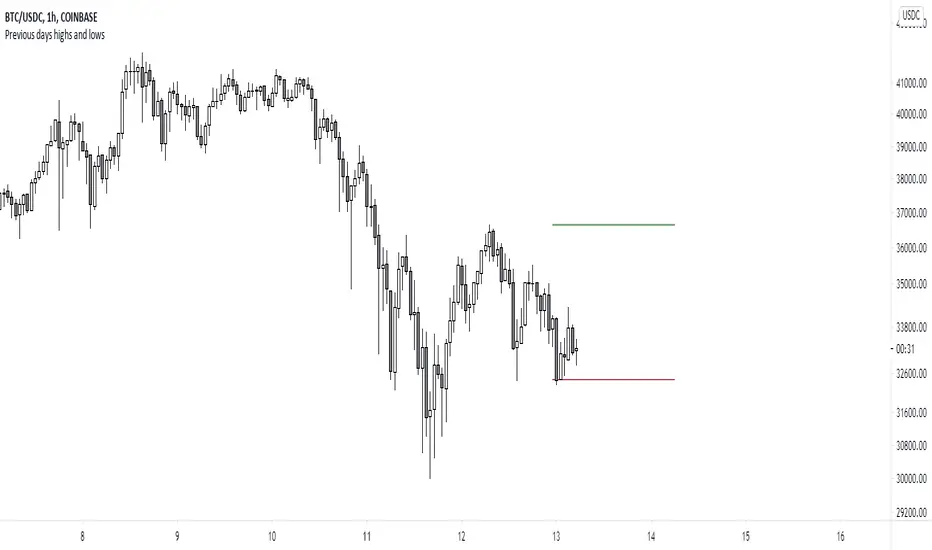
Previous days highs and lowsA script which marks a line pointing the highs and lows of the previous trading day.
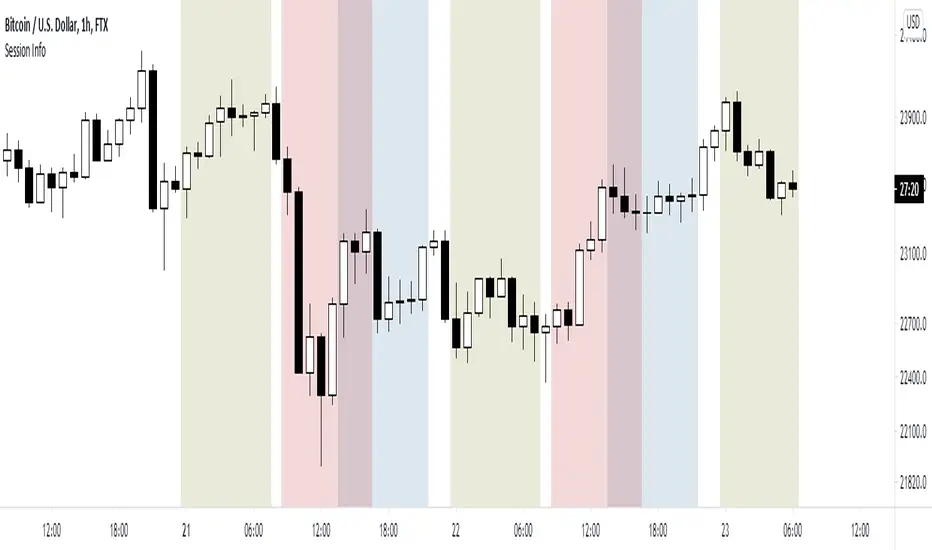
World market Session Information for bitcoinIt marks out different world markets active timings on the bitcoin charts.
You can also modify the script to a strategy and test out different strategies.
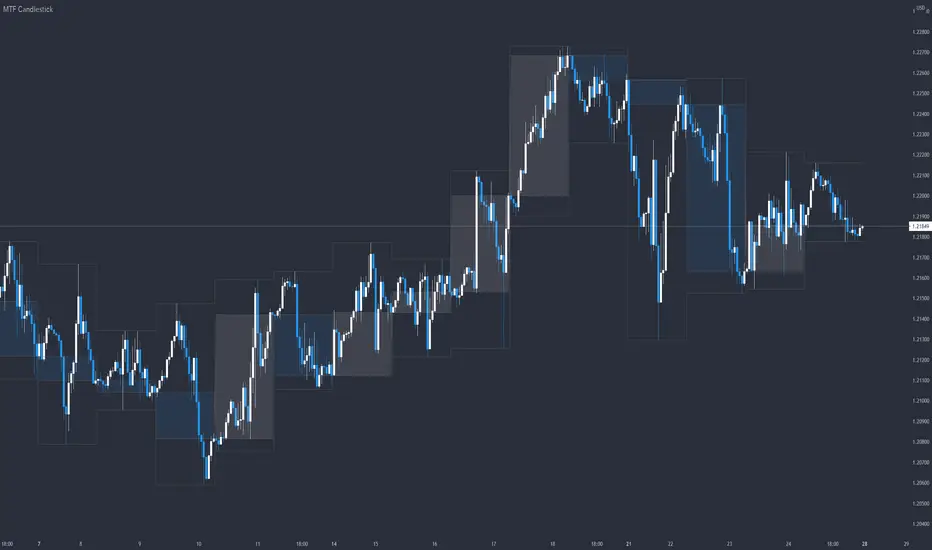
MTF CandlestickOne of the most important thing to understand in order to estimate the trend direction and its continuation is how the lower time frame candlesticks have been formed.
There are many processes by which candlesticks have been formed even if same size.
So in this script, daily candlestick is overlapped on the currently chart as default, and that can be changed.
Only real body is shown so as not to interfere with the currently chart.
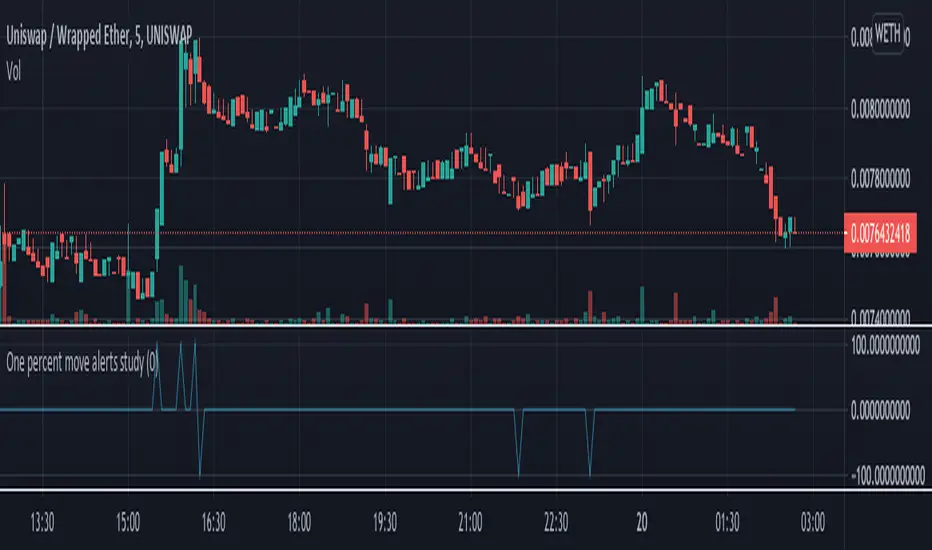
One Percent Move Study (For your Alerts)This is a simple script that can be used to alerts. The signal1 variable goes to 100 if there is a 1% up move in a tick, and goes to -100 if there is a 1% down move in a tick for an asset. This is best on a 1 minute or 5 minute chart.
This example shows this on the DeFi exchange Uniswap for the UNI/ETH pair
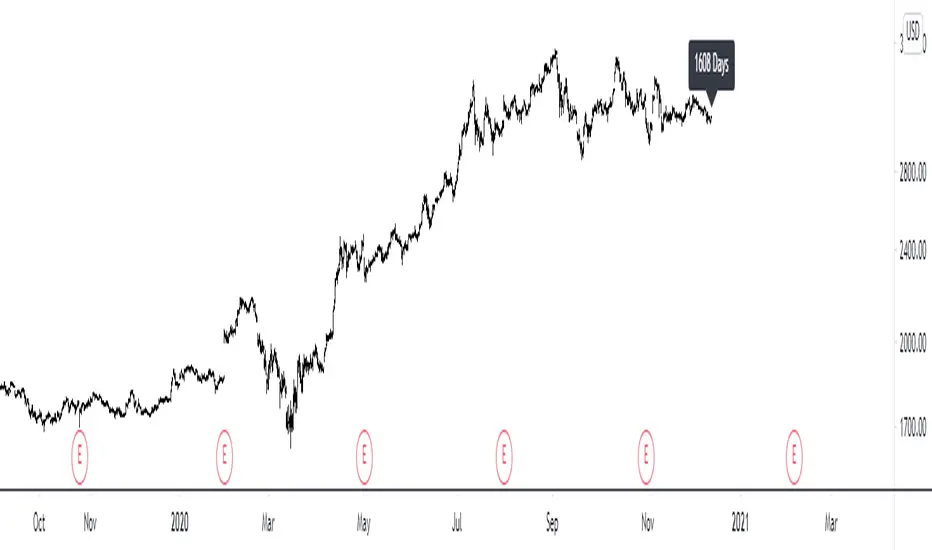
Multi-time-Frame number of days in the chartHelps to see the number of days in any default timeframe chart. (Not yet tested with custom time frames!)
Please like and favorite this script if you like it!
Any donations of tradingview coins to help me buy a tradingview pro membership would also be highly appreciated! Thank you!
Noro's Trend Ribbon StrategyOne moving average ( SMA ) is used. The channel is convened at a moving average rather than prices. Blue is a uptrend. Red is a downtrend.
If the candle has closed above the ribbon - open long (and close short)
If the candle has closed below the ribbon - open short (and close long)

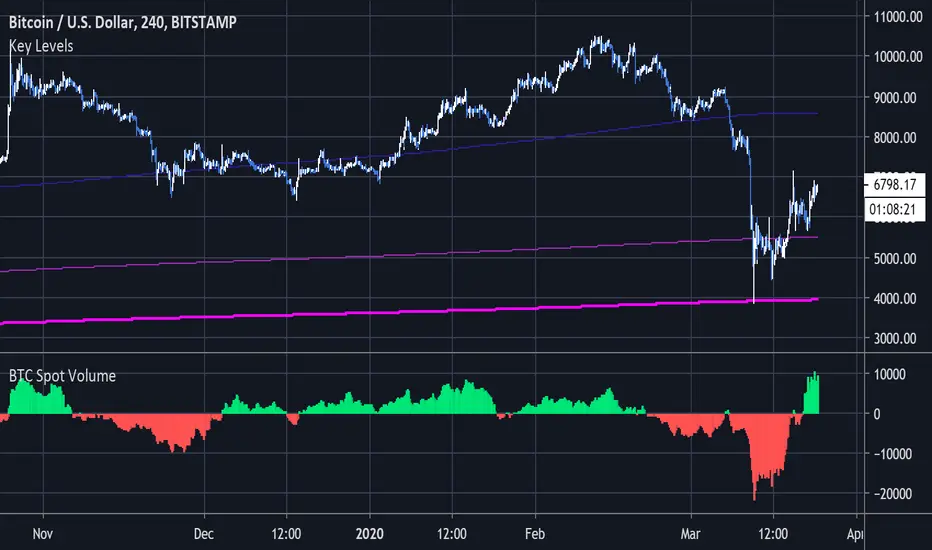
BTC Net Volume Delta (Spot)One of my favorite indicators for trend analysis. We sum the volume from all significant BTC Spot exchanges and subtract the sell volume from the buy volume for a cumulative total. A futures version is also available but spot volume is more consistent for analysis. To follow trends you can buy when sell momentum is decreasing, and sell when buy momentum is decreasing.
Do you have any ideas for monitoring sentiment or open interest across multiple exchanges? Message me and I will try to make it happen.
Code Upd: Weis Wave Volume [LazyBear] v4One of the review indicator from me.
I reviewed code for more comfortable use - the basic code was not modified.
Enjoy it!

Code Upd: On Balance Volume Oscillator [LazyBear] v4One of the review indicator from me.
I reviewed code for more comfortable use - the basic code was not modified.
Enjoy it!
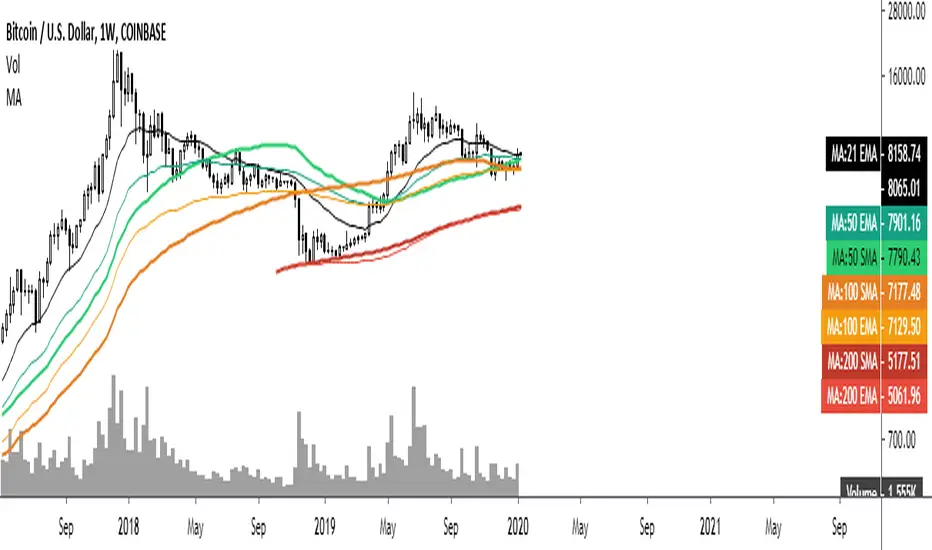
Common Moving averages ( 4 EMA + 3 SMA)Common moving averages used are included in the script. Customize them as per your wishes.
MA's set as default are
21 EMA
50 EMA , SMA
100 EMA , SMA
200 EMA , SMA
Please favorite it if you like it! Thanks!