52SIGNAL RECIPE VWAP Quantum Matrix Pro═══52SIGNAL RECIPE VWAP Quantum Matrix Pro ═══
◆ Overview
52SIGNAL RECIPE VWAP Quantum Matrix Pro is an advanced technical indicator based on Volume Weighted Average Price (VWAP), integrating volatility-adjusted bands and Fibonacci levels to provide multi-dimensional analysis of price movements.
It automatically applies optimized lookback periods for different timeframes, providing customized analysis for various trading styles, and helps traders effectively identify critical support/resistance zones through precise price level identification.
─────────────────────────────────────
◆ Key Features
• **Adaptive VWAP Bands**: Automatically adjusting upper and lower bands based on market volatility
• **Fibonacci Integration**: Fibonacci levels (23.6%, 38.2%, 50%, 61.8%, 78.6%) extended around VWAP center
• **Timeframe Optimization**: Automatic lookback period adjustment for each chart cycle
• **Pivot Point Analysis**: Core support/resistance levels based on volume-weighted highs and lows
• **Precision Labeling**: Accurate numerical display for all major price levels
• **Visual Gradation**: Intuitive visualization through color gradation for each Fibonacci level
─────────────────────────────────────
◆ Technical Foundation
■ VWAP Calculation Principles
• **Volume Weighting**: Calculation of real equilibrium price considering volume rather than simple price averaging
• **Standard Deviation Bands**: Statistical fluctuation range setting around VWAP center
• **Volatility Adjustment Mechanism**: Dynamic band width adjustment using current ATR to historical ATR ratio
• **Precise Price Range**: Identification of highest/lowest price range within specified lookback period
■ Fibonacci Band Implementation
• **VWAP-Centered Extension**: Division of distance from centerline (VWAP) to standard deviation bands by Fibonacci ratios
• **Symmetrical Upper/Lower Structure**: Application of identical Fibonacci ratios in both upward and downward directions
• **Color Gradation**: Progressive color changes for each Fibonacci level providing visual depth
─────────────────────────────────────
◆ Practical Applications
■ Price Movement Interpretation
• **Central Reference Point**:
▶ VWAP serves as intraday/period equilibrium price providing balance point of buying/selling pressure
▶ Movement above/below VWAP can be interpreted as short-term bullish/bearish signals
• **Band Reaction Patterns**:
▶ Reaching outer bands (100%) signals overbought/oversold conditions
▶ Reaction patterns between Fibonacci levels provide basis for trend strength and persistence judgment
■ Trading Strategy Utilization
• **Range-bound Trading**:
▶ Short-term trading utilizing bounce patterns between Fibonacci levels
▶ Oscillation trading between centerline (VWAP) and Fibonacci levels
• **Trend Following Strategy**:
▶ Breakout of Fibonacci levels aligned above/below VWAP signals trend strengthening
▶ Strong momentum confirmation when re-entering after outer band breakout
─────────────────────────────────────
◆ Advanced Configuration Options
■ Input Parameter Guide
• **Base Standard Deviation** (Default: 2.0)
▶ 1.0-1.5: Narrow bands, suitable for short-term trading
▶ 1.8-2.2: Balanced bands, optimal for general market conditions
▶ 2.5-3.0: Wide bands, suitable for long-term positions
• **Maximum/Minimum Standard Deviation** (Default: 3.0/1.0)
▶ Maximum: Cryptocurrency (4.0), Stocks/Forex (3.0), Low volatility (2.5)
▶ Minimum: Intraday trading (0.8), General (1.0), Long-term (1.5)
• **Volatility Measurement Period** (Default: 20)
▶ Short-term (10-14): Fast response, intraday trading
▶ Medium-term (15-25): Balanced response, swing trading
▶ Long-term (30-50): Noise filtering, long-term investment
• **Use Volatility Adjustment** (Default: On)
▶ On: Automatic band width adjustment based on current market volatility (recommended)
▶ Off: Fixed standard deviation bands usage
■ Timeframe-Specific Optimal Settings
• **Intraday Trading** (15min-1hr): Base standard deviation 1.8, volatility period 14
• **Swing Trading** (4hr-daily): Base standard deviation 2.0, volatility period 20
• **Position Trading** (daily-weekly): Base standard deviation 2.5, volatility period 30
■ Market-Specific Optimal Settings
• **Stock Market**: Base standard deviation 2.0, volatility period 20
• **Forex Market**: Base standard deviation 1.8, volatility period 25
• **Cryptocurrency Market**: Base standard deviation 2.5, volatility period 14, maximum standard deviation 4.0
─────────────────────────────────────
◆ Synergy with Other Indicators
• **Moving Averages**: VWAP and major moving average crossovers strengthen trend reversal signals
• **RSI/Stochastic**: Combination of VWAP band reactions in overbought/oversold zones improves reversal signal accuracy
• **Bollinger Bands**: VWAP Quantum Matrix and Bollinger Band convergence/divergence patterns are useful for volatility change prediction
• **Fibonacci Retracement**: Strong support/resistance formation when trend-direction Fibonacci retracement matches VWAP Fibonacci levels
• **Horizontal Support/Resistance**: Reaction probability significantly increases when past important price levels match VWAP Fibonacci levels
─────────────────────────────────────
◆ Conclusion
VWAP Quantum Matrix Pro provides deep insights into price action by integrating volatility-adjusted bands and Fibonacci theory into traditional VWAP analysis.
It dynamically responds to market environment changes through volume weighting and volatility adaptation mechanisms, and can be flexibly applied to various trading styles through timeframe-optimized lookback period settings.
Through appropriate input parameter configuration, the indicator can be optimized to match each trader's style and objectives, and through combination with other technical indicators, it strengthens confidence in trading decisions, ultimately enabling more precise and systematic market approaches.
─────────────────────────────────────
※ Disclaimer: Past performance does not guarantee future results. Always use appropriate risk management strategies.
═══52SIGNAL RECIPE VWAP Quantum Matrix Pro ═══
◆ 개요
52SIGNAL RECIPE VWAP Quantum Matrix Pro는 거래량 가중 평균 가격(VWAP)을 기반으로 하는 고급 기술적 지표로, 변동성 조정 밴드와 피보나치 레벨을 통합하여 가격 움직임을 다차원적으로 분석합니다.
타임프레임별로 최적화된 룩백 기간을 자동 적용하여 다양한 거래 스타일에 맞춤화된 분석을 제공하며, 정밀한 가격 레벨 식별을 통해 트레이더가 중요한 지지/저항 구간을 효과적으로 파악할 수 있도록 돕습니다.
─────────────────────────────────────
◆ 주요 특징
• **적응형 VWAP 밴드**: 시장 변동성에 따라 자동으로 조정되는 상하단 밴드 제공
• **피보나치 통합**: VWAP 중심으로 피보나치 레벨(23.6%, 38.2%, 50%, 61.8%, 78.6%) 확장
• **타임프레임 최적화**: 각 차트 주기에 맞춰 자동으로 룩백 기간 조정
• **피봇 포인트 분석**: 거래량 가중 고저가 기반의 핵심 지지/저항 레벨 표시
• **정밀 레이블링**: 모든 주요 가격 레벨에 정확한 수치 표시
• **시각적 그라데이션**: 피보나치 레벨별 컬러 그라데이션으로 직관적인 시각화
─────────────────────────────────────
◆ 기술적 기반
■ VWAP 계산 원리
• **거래량 가중치**: 단순 가격 평균이 아닌 거래량을 고려한 실질적 균형 가격 계산
• **표준편차 밴드**: VWAP 중심으로 통계적 변동 범위 설정
• **변동성 조정 메커니즘**: 현재 ATR과 과거 ATR 비율을 활용한 동적 밴드폭 조정
• **정밀 가격 범위**: 지정된 룩백 기간 내 최고/최저 가격 범위 식별
■ 피보나치 밴드 구현
• **VWAP 중심 확장**: 중심선(VWAP)에서 표준편차 밴드까지의 거리를 피보나치 비율로 분할
• **상하단 대칭 구조**: 상승과 하락 방향으로 동일한 피보나치 비율 적용
• **색상 그라데이션**: 피보나치 레벨별 점진적 색상 변화로 시각적 깊이감 제공
─────────────────────────────────────
◆ 실용적 응용
■ 가격 움직임 해석
• **중심 기준점**:
▶ VWAP은 일중/기간 내 균형가격으로 매수/매도 압력의 균형점 제공
▶ VWAP 위/아래 움직임은 단기 강세/약세 신호로 해석 가능
• **밴드 반응 패턴**:
▶ 외부 밴드(100%)에 도달 시 과매수/과매도 상태 시그널
▶ 피보나치 레벨 간 반응 패턴은 추세 강도와 지속성 판단 근거
■ 트레이딩 전략 활용
• **범위 내 거래**:
▶ 피보나치 레벨 간 바운스 패턴 활용한 단기 매매
▶ 중심선(VWAP)과 피보나치 레벨 간 오실레이션 거래
• **추세 추종 전략**:
▶ VWAP 위/아래 정렬된 피보나치 레벨 돌파는 추세 강화 신호
▶ 외부 밴드 돌파 후 다시 진입 시 강한 모멘텀 확인
─────────────────────────────────────
◆ 고급 설정 옵션
■ 인풋 파라미터 가이드
• **기본 표준 편차 (Base Standard Deviation)** (기본값: 2.0)
▶ 1.0-1.5: 좁은 밴드, 단기 거래에 적합
▶ 1.8-2.2: 균형 잡힌 밴드, 일반적 시장 환경에 최적
▶ 2.5-3.0: 넓은 밴드, 장기 포지션에 적합
• **최대/최소 표준 편차 (Maximum/Minimum Standard Deviation)** (기본값: 3.0/1.0)
▶ 최대: 암호화폐(4.0), 주식/외환(3.0), 저변동성(2.5)
▶ 최소: 일중 거래(0.8), 일반(1.0), 장기(1.5)
• **변동성 측정 기간 (Volatility Measurement Period)** (기본값: 20)
▶ 단기(10-14): 빠른 반응, 일중 거래
▶ 중기(15-25): 균형 잡힌 반응, 스윙 트레이딩
▶ 장기(30-50): 노이즈 필터링, 장기 투자
• **변동성 조정 사용 (Use Volatility Adjustment)** (기본값: 켜짐)
▶ 켜짐: 현재 시장 변동성에 따라 밴드 폭 자동 조정 (권장)
▶ 꺼짐: 고정된 표준편차 밴드 사용
■ 타임프레임별 최적 설정
• **일중 거래** (15분-1시간): 기본 표준편차 1.8, 변동성 기간 14
• **스윙 트레이딩** (4시간-일봉): 기본 표준편차 2.0, 변동성 기간 20
• **포지션 트레이딩** (일봉-주봉): 기본 표준편차 2.5, 변동성 기간 30
■ 시장별 최적 설정
• **주식 시장**: 기본 표준편차 2.0, 변동성 기간 20
• **외환 시장**: 기본 표준편차 1.8, 변동성 기간 25
• **암호화폐 시장**: 기본 표준편차 2.5, 변동성 기간 14, 최대 표준편차 4.0
─────────────────────────────────────
◆ 다른 지표와의 시너지
• **이동평균선**: VWAP과 주요 이동평균선 교차는 추세 전환 신호 강화
• **RSI/스토캐스틱**: 과매수/과매도 구간에서 VWAP 밴드 반응과 결합 시 반전 신호 정확도 향상
• **볼린저 밴드**: VWAP Quantum Matrix와 볼린저 밴드 수렴/발산 패턴은 변동성 변화 예측에 유용
• **피보나치 리트레이스먼트**: 추세 방향 피보나치 리트레이스먼트와 VWAP 피보나치 레벨 일치 시 강력한 지지/저항 형성
• **수평 지지/저항**: 과거 중요 가격대와 VWAP 피보나치 레벨 일치 시 반응 확률 대폭 증가
─────────────────────────────────────
◆ 결론
VWAP Quantum Matrix Pro는 전통적인 VWAP 분석에 변동성 조정 밴드와 피보나치 이론을 통합하여 가격 행동에 대한 깊이 있는 통찰력을 제공합니다.
거래량 가중치와 변동성 적응 메커니즘을 통해 시장 환경 변화에 동적으로 대응하며, 타임프레임별 최적화된 룩백 기간 설정으로 다양한 거래 스타일에 유연하게 적용할 수 있습니다.
적절한 인풋 파라미터 설정을 통해 각 트레이더의 스타일과 목표에 맞게 지표를 최적화할 수 있으며, 다른 기술적 지표들과의 조합을 통해 트레이딩 결정에 대한 확신을 강화하고, 궁극적으로 더 정밀하고 체계적인 시장 접근을 가능하게 합니다.
─────────────────────────────────────
※ 면책 조항: 과거 성과가 미래 결과를 보장하지 않습니다. 항상 적절한 리스크 관리 전략을 사용하세요.
"moving average crossover" için komut dosyalarını ara

Lyapunov Market Instability (LMI)Lyapunov Market Instability (LMI)
What is Lyapunov Market Instability?
Lyapunov Market Instability (LMI) is a revolutionary indicator that brings chaos theory from theoretical physics into practical trading. By calculating Lyapunov exponents—a measure of how rapidly nearby trajectories diverge in phase space—LMI quantifies market sensitivity to initial conditions. This isn't another oscillator or trend indicator; it's a mathematical lens that reveals whether markets are in chaotic (trending) or stable (ranging) regimes.
Inspired by the meditative color field paintings of Mark Rothko, this indicator transforms complex chaos mathematics into an intuitive visual experience. The elegant simplicity of the visualization belies the sophisticated theory underneath—just as Rothko's seemingly simple color blocks contain profound depth.
Theoretical Foundation (Chaos Theory & Lyapunov Exponents)
In dynamical systems, the Lyapunov exponent (λ) measures the rate of separation of infinitesimally close trajectories:
λ > 0: System is chaotic—small changes lead to dramatically different outcomes (butterfly effect)
λ < 0: System is stable—trajectories converge, perturbations die out
λ ≈ 0: Edge of chaos—transition between regimes
Phase Space Reconstruction
Using Takens' embedding theorem , we reconstruct market dynamics in higher dimensions:
Time-delay embedding: Create vectors from price at different lags
Nearest neighbor search: Find historically similar market states
Trajectory evolution: Track how these similar states diverged over time
Divergence rate: Calculate average exponential separation
Market Application
Chaotic markets (λ > threshold): Strong trends emerge, momentum dominates, use breakout strategies
Stable markets (λ < threshold): Mean reversion dominates, fade extremes, range-bound strategies work
Transition zones: Market regime about to change, reduce position size, wait for confirmation
How LMI Works
1. Phase Space Construction
Each point in time is embedded as a vector using historical prices at specific delays (τ). This reveals the market's hidden attractor structure.
2. Lyapunov Calculation
For each current state, we:
- Find similar historical states within epsilon (ε) distance
- Track how these initially similar states evolved
- Measure exponential divergence rate
- Average across multiple trajectories for robustness
3. Signal Generation
Chaos signals: When λ crosses above threshold, market enters trending regime
Stability signals: When λ crosses below threshold, market enters ranging regime
Divergence detection: Price/Lyapunov divergences signal potential reversals
4. Rothko Visualization
Color fields: Background zones represent market states with Rothko-inspired palettes
Glowing line: Lyapunov exponent with intensity reflecting market state
Minimalist design: Focus on essential information without clutter
Inputs:
📐 Lyapunov Parameters
Embedding Dimension (default: 3)
Dimensions for phase space reconstruction
2-3: Simple dynamics (crypto/forex) - captures basic momentum patterns
4-5: Complex dynamics (stocks/indices) - captures intricate market structures
Higher dimensions need exponentially more data but reveal deeper patterns
Time Delay τ (default: 1)
Lag between phase space coordinates
1: High-frequency (1m-15m charts) - captures rapid market shifts
2-3: Medium frequency (1H-4H) - balances noise and signal
4-5: Low frequency (Daily+) - focuses on major regime changes
Match to your timeframe's natural cycle
Initial Separation ε (default: 0.001)
Neighborhood size for finding similar states
0.0001-0.0005: Highly liquid markets (major forex pairs)
0.0005-0.002: Normal markets (large-cap stocks)
0.002-0.01: Volatile markets (crypto, small-caps)
Smaller = more sensitive to chaos onset
Evolution Steps (default: 10)
How far to track trajectory divergence
5-10: Fast signals for scalping - quick regime detection
10-20: Balanced for day trading - reliable signals
20-30: Slow signals for swing trading - major regime shifts only
Nearest Neighbors (default: 5)
Phase space points for averaging
3-4: Noisy/fast markets - adapts quickly
5-6: Balanced (recommended) - smooth yet responsive
7-10: Smooth/slow markets - very stable signals
📊 Signal Parameters
Chaos Threshold (default: 0.05)
Lyapunov value above which market is chaotic
0.01-0.03: Sensitive - more chaos signals, earlier detection
0.05: Balanced - optimal for most markets
0.1-0.2: Conservative - only strong trends trigger
Stability Threshold (default: -0.05)
Lyapunov value below which market is stable
-0.01 to -0.03: Sensitive - quick stability detection
-0.05: Balanced - reliable ranging signals
-0.1 to -0.2: Conservative - only deep stability
Signal Smoothing (default: 3)
EMA period for noise reduction
1-2: Raw signals for experienced traders
3-5: Balanced - recommended for most
6-10: Very smooth for position traders
🎨 Rothko Visualization
Rothko Classic: Deep reds for chaos, midnight blues for stability
Orange/Red: Warm sunset tones throughout
Blue/Black: Cool, meditative ocean depths
Purple/Grey: Subtle, sophisticated palette
Visual Options:
Market Zones : Background fields showing regime areas
Transitions: Arrows marking regime changes
Divergences: Labels for price/Lyapunov divergences
Dashboard: Real-time state and trading signals
Guide: Educational panel explaining the theory
Visual Logic & Interpretation
Main Elements
Lyapunov Line: The heart of the indicator
Above chaos threshold: Market is trending, follow momentum
Below stability threshold: Market is ranging, fade extremes
Between thresholds: Transition zone, reduce risk
Background Zones: Rothko-inspired color fields
Red zone: Chaotic regime (trending)
Gray zone: Transition (uncertain)
Blue zone: Stable regime (ranging)
Transition Markers:
Up triangle: Entering chaos - start trend following
Down triangle: Entering stability - start mean reversion
Divergence Signals:
Bullish: Price makes low but Lyapunov rising (stability breaking down)
Bearish: Price makes high but Lyapunov falling (chaos dissipating)
Dashboard Information
Market State: Current regime (Chaotic/Stable/Transitioning)
Trading Bias: Specific strategy recommendation
Lyapunov λ: Raw value for precision
Signal Strength: Confidence in current regime
Last Change: Bars since last regime shift
Action: Clear trading directive
Trading Strategies
In Chaotic Regime (λ > threshold)
Follow trends aggressively: Breakouts have high success rate
Use momentum strategies: Moving average crossovers work well
Wider stops: Expect larger swings
Pyramid into winners: Trends tend to persist
In Stable Regime (λ < threshold)
Fade extremes: Mean reversion dominates
Use oscillators: RSI, Stochastic work well
Tighter stops: Smaller expected moves
Scale out at targets: Trends don't persist
In Transition Zone
Reduce position size: Uncertainty is high
Wait for confirmation: Let regime establish
Use options: Volatility strategies may work
Monitor closely: Quick changes possible
Advanced Techniques
- Multi-Timeframe Analysis
- Higher timeframe LMI for regime context
- Lower timeframe for entry timing
- Alignment = highest probability trades
- Divergence Trading
- Most powerful at regime boundaries
- Combine with support/resistance
- Use for early reversal detection
- Volatility Correlation
- Chaos often precedes volatility expansion
- Stability often precedes volatility contraction
- Use for options strategies
Originality & Innovation
LMI represents a genuine breakthrough in applying chaos theory to markets:
True Lyapunov Calculation: Not a simplified proxy but actual phase space reconstruction and divergence measurement
Rothko Aesthetic: Transforms complex math into meditative visual experience
Regime Detection: Identifies market state changes before price makes them obvious
Practical Application: Clear, actionable signals from theoretical physics
This is not a combination of existing indicators or a visual makeover of standard tools. It's a fundamental rethinking of how we measure and visualize market dynamics.
Best Practices
Start with defaults: Parameters are optimized for broad market conditions
Match to your timeframe: Adjust tau and evolution steps
Confirm with price action: LMI shows regime, not direction
Use appropriate strategies: Chaos = trend, Stability = reversion
Respect transitions: Reduce risk during regime changes
Alerts Available
Chaos Entry: Market entering chaotic regime - prepare for trends
Stability Entry: Market entering stable regime - prepare for ranges
Bullish Divergence: Potential bottom forming
Bearish Divergence: Potential top forming
Chart Information
Script Name: Lyapunov Market Instability (LMI) Recommended Use: All markets, all timeframes Best Performance: Liquid markets with clear regimes
Academic References
Takens, F. (1981). "Detecting strange attractors in turbulence"
Wolf, A. et al. (1985). "Determining Lyapunov exponents from a time series"
Rosenstein, M. et al. (1993). "A practical method for calculating largest Lyapunov exponents"
Note: After completing this indicator, I discovered @loxx's 2022 "Lyapunov Hodrick-Prescott Oscillator w/ DSL". While both explore Lyapunov exponents, they represent independent implementations with different methodologies and applications. This indicator uses phase space reconstruction for regime detection, while his combines Lyapunov concepts with HP filtering.
Disclaimer
This indicator is for research and educational purposes only. It does not constitute financial advice or provide direct buy/sell signals. Chaos theory reveals market character, not future prices. Always use proper risk management and combine with your own analysis. Past performance does not guarantee future results.
See markets through the lens of chaos. Trade the regime, not the noise.
Bringing theoretical physics to practical trading through the meditative aesthetics of Mark Rothko
Trade with insight. Trade with anticipation.
— Dskyz , for DAFE Trading Systems

ZenAlgo - Aggregated DeltaZenAlgo - Aggregated Delta is an advanced market analysis tool designed to provide traders with a holistic view of market sentiment by leveraging multi-exchange volume aggregation, cumulative delta analysis, and divergence detection. Unlike traditional indicators that rely on a single data source, this tool aggregates order flow data from multiple exchanges, reducing the impact of exchange-specific anomalies and liquidity disparities.
This indicator is ideal for traders looking to enhance their understanding of market dynamics, trend confirmations, and order flow patterns. By intelligently combining multiple analytical components, it eliminates the need for manually interpreting separate indicators and offers traders a streamlined approach to market analysis.
This indicator was inspired by aggregated volume analysis techniques. Independently developed with a focus on cumulative delta and divergence detection.
Key Features & Their Interaction
Multi-Exchange Volume Aggregation: Aggregates buy and sell volumes from up to nine major exchanges, including Binance, Bybit, Coinbase, and Kraken. Unlike traditional single-source indicators, this ensures a robust, diversified measure of market sentiment and smooths out exchange-specific volume fluctuations.
Cumulative Delta Analysis: Tracks the net difference between buy and sell volumes across all aggregated exchanges, helping traders identify true buying/selling pressure rather than misleading short-term volume spikes.
Advanced Divergence Detection: Unlike basic divergence indicators, this tool detects divergences not only between price and cumulative delta but also across multiple analytical layers, including moving averages and temperature zones, offering deeper confirmation signals.
Dynamic Market Temperature Zones: Unlike fixed overbought/oversold indicators, this feature applies adaptive standard deviation-based filtering to classify market conditions dynamically as "Extreme Hot," "Hot," "Neutral," "Cold," and "Extreme Cold."
Intelligent Market State Classification: Determines whether the market is in a Full Bull, Bearish, or Neutral state by analyzing multi-exchange volume flow, cumulative delta positioning, and market-wide liquidity trends.
Real-Time Alerts & Adaptive Visualization: Provides fully configurable real-time alerts for trend shifts, divergences, and market conditions, allowing traders to act immediately on high-confidence signals.
What Makes ZenAlgo - Aggregated Delta Unique?
Unlike free or open-source alternatives, ZenAlgo - Aggregated Delta applies a multi-layered data processing approach to smooth inconsistencies and improve signal reliability. Instead of using raw exchange feeds, the system incorporates adaptive volume aggregation and standard deviation-based market classification to ensure accuracy and reduce noise. These enhancements lead to more precise trend signals and a clearer representation of market sentiment.
Multi-Exchange Order Flow Validation: Unlike single-source indicators that rely on individual exchange feeds, this tool ensures cross-market consistency by aggregating volume data dynamically.
Fractal-Based Divergence Detection: Detects divergences using fractal logic rather than contextual volume trends, reducing false-positive divergence signals while maintaining accuracy.
Automated Sentiment Analysis: Classifies market sentiment into structured phases (Full Bull, Bearish, etc.), reducing the manual effort needed to interpret order flow trends.
How It Works (Technical Breakdown)
Multi-Exchange Volume Aggregation: The system fetches and validates buy/sell volume data from multiple exchanges, applying volume aggregation techniques to smooth out inconsistencies. It ensures that data from low-liquidity exchanges does not disproportionately influence the analysis.
Cumulative Delta Computation: Cumulative delta is computed as the net difference between buy and sell volumes over a given period. By summing up these values across multiple exchanges, traders can identify real accumulation or distribution zones, reducing false signals from isolated exchange anomalies.
Divergence Detection Methodology: The tool uses a fractal-based logic approach to detect high-confidence divergences across price, volume, and delta trends. This allows for a more structured detection process compared to simple peak/trough analysis, reducing noise in the signals.
Temperature Zones Filtering: Market conditions are dynamically classified using a rolling standard deviation model, ensuring that hot/cold states adjust automatically based on recent volatility levels. This means that instead of using arbitrary fixed thresholds, the tool adapts based on historical data behavior.
Market Sentiment State Calculation: The tool evaluates liquidity conditions, volume trends, and cumulative delta flow, categorizing the market into predefined states (Bullish, Bearish, Neutral). This helps traders assess the broader context of price movements rather than reacting to isolated signals.
Real-Time Adaptive Alerts: The system provides fully configurable alerts that notify traders about key trend shifts, high-confidence divergences, and changes in market conditions as they occur. This ensures that traders can make timely and well-informed decisions.
Why This Approach Works
By aggregating data from multiple exchanges, it reduces the impact of exchange-specific liquidity disparities and anomalies, leading to a more holistic view of order flow.
The cumulative delta analysis ensures that price movements are validated by actual buying/selling pressure, filtering out misleading short-term spikes.
Dynamic market classification adapts to current conditions rather than using outdated fixed thresholds, making it more relevant in different market regimes.
Fractal-based divergence detection avoids common pitfalls of traditional divergence analysis, reducing false signals while maintaining accuracy.
Combining real-time adaptive alerts with well-structured classification improves traders’ ability to respond to market shifts efficiently.
Practical Use Cases
Identifying High-Probability Trend Reversals: If cumulative delta shows bullish divergence while the market is in an Extreme Cold zone, it signals a strong potential for reversal.
Confirming Trend Continuation: When bullish moving average crossovers align with a rising cumulative delta, traders can enter positions with higher confidence.
Detecting Exhaustion in Market Moves: If price enters an "Extreme Hot" zone but cumulative delta starts declining, this suggests trend exhaustion and a possible reversal.
Filtering False Breakouts: If price breaks a resistance level but aggregated buy volume fails to increase, this invalidates the breakout, helping traders avoid bad trades.
Cross-Exchange Sentiment Confirmation: If cumulative delta on aggregated exchanges contradicts price action on an individual exchange, traders can identify localized exchange-based distortions.
Customization & Settings Overview
Exchange Selection: Traders can fine-tune exchange sources for aggregation, allowing for custom market-specific insights.
Adaptive Divergence Settings: Configure detection thresholds, lookback periods, and divergence filtering options to reduce noise and focus on high-confidence signals.
Moving Average Adjustments: Select custom MA types, lengths, and visualization preferences to match different trading styles.
Market Temperature Thresholds: Adjust hot/cold sensitivity to align with preferred risk levels and volatility expectations.
Configurable Alerts & Theme Customization: Full control over notification triggers, color themes, and label formatting to enhance user experience.
Important Considerations
Market Context Dependency: This tool provides order flow analysis, which should be used in conjunction with broader market context and risk management.
Data Source Variability: While multi-exchange aggregation improves reliability, some exchanges may report inaccurate or delayed data.
Extreme Volatility Handling: Large price swings can temporarily distort delta readings, so traders should always validate with additional context.
Liquidity Limitations: In low-liquidity conditions, order flow signals may be less reliable due to fragmented market participation.

Traders Trend DashboardThe Traders Trend Dashboard (TTD) is a comprehensive trend analysis tool designed to assist traders in making informed trading decisions across various markets and timeframes. Unlike conventional trend-following scripts, TTD goes beyond simple trend detection by incorporating a unique combination of moving averages and a visual dashboard, providing traders with a clear and actionable overview of market trends. Here's how TTD stands out from the crowd:
Originality and Uniqueness:
TTD doesn't rely on just one moving average crossover to detect trends. Instead, it employs a dynamic approach by comparing two moving averages of distinct periods across multiple timeframes. This innovative methodology enhances trend detection accuracy and reduces false signals commonly associated with single moving average systems.
Market Applicability:
TTD is versatile and adaptable to various financial markets, including forex, stocks, cryptocurrencies, and commodities. Its flexibility ensures that traders can utilize it across different asset classes and capitalize on market opportunities.
Optimal Timeframe Utilization:
Unlike many trend indicators that work best on specific timeframes, TTD caters to traders with diverse trading preferences. It offers support for intraday trading (1m, 3m, 5m), short-term trading (15m, 30m, 1h), and swing trading (4h, D, W, M), making it suitable for a wide range of trading styles.
Underlying Conditions and Interpretation:
TTD is particularly effective during trending markets, where its multi-timeframe approach helps identify consistent trends across various time horizons. In ranging markets, TTD can indicate potential reversals or areas of uncertainty when moving averages converge or cross frequently.
How to Use TTD:
1. Timeframe Selection: Choose the relevant timeframes based on your trading style and preferences. Enable or disable timeframes in the settings to focus on the most relevant ones for your strategy.
2. Dashboard Interpretation: The TTD dashboard displays green (🟢) and red (🔴) symbols to indicate the relationship between two moving averages. A green symbol suggests that the shorter moving average is above the longer one, indicating a potential bullish trend. A red symbol suggests the opposite, indicating a potential bearish trend.
3. Confirmation and Strategy: Consider TTD signals as confirmation for your trading strategy. For instance, in an uptrend, look for long opportunities when the dashboard displays consistent green symbols. Conversely, in a downtrend, focus on short opportunities when red symbols dominate.
4. Risk Management: As with any indicator, use TTD in conjunction with proper risk management techniques. Avoid trading solely based on indicator signals; instead, integrate them into a comprehensive trading plan.
Conclusion:
The Traders Trend Dashboard (TTD) offers traders a powerful edge in trend analysis, combining innovation, versatility, and clarity. By understanding its unique methodology and integrating its signals with your trading strategy, you can make more informed trading decisions across various markets and timeframes. Elevate your trading with TTD and unlock a new level of trend analysis precision.
Oliver Velez IndicatorOliver Velez is a well-known trader and educator who has developed multiple trading strategies. One of them is the 20-200sma strategy, which is a basic moving average crossover strategy. The strategy involves using two simple moving averages (SMAs) - a short-term SMA with a period of 20 and a long-term SMA with a period of 200 - on a 2-minute timeframe chart.
When the short-term SMA crosses above the long-term SMA, it signals a potential bullish trend and traders may look for opportunities to enter a long position. Conversely, when the short-term SMA crosses below the long-term SMA, it signals a potential bearish trend and traders may look for opportunities to enter a short position.
Traders using this strategy may also look for additional confirmations, such as price action signals or other technical indicators, before entering or exiting a trade. It is important to note that no trading strategy can guarantee profits, and traders should always use risk management techniques to limit potential losses.
This script is an implementation of the 2 SMA's (can also choose other types of MA's), with Elephant Bar Indicator (EBI) and the Tail Bars Indicator in TradingView.
The Elephant Bar Indicator is a technical indicator used in trading to identify potential trend reversals in the market. It is named after the large size of the bullish or bearish candlestick that it represents. The Tail Bars Indicator is a pattern recognition technique that identifies candlestick patterns with long tails or wicks.
The script starts by defining the input parameters for both indicators. For the Elephant Bar Indicator, the user inputs the lookback period and the size multiplier. For the Tail Bars Indicator, the user inputs the tail ratio and opposite wick ratio.
Next, the script calculates the moving averages of the closing price over the defined short and long periods using the Moving Average function. The script then calculates the average candle size and volume over the lookback period.
The script then identifies the Elephant Bars and Tail Bars using the input parameters and additional conditions. For Elephant Bars, the script identifies bullish and bearish bars that meet certain criteria, such as a size greater than the average candle size and volume greater than the average volume.
For Tail Bars, the script identifies bullish and bearish bars that have long tails or wicks and meet certain criteria such as opposite wick size less than or equal to the tail size multiplied by the input opposite wick ratio.
Finally, the script plots the Elephant Bar and Tail Bar signals on the chart using different colors and shapes. The script also plots the moving averages and Keltner Channels to help traders identify potential trend reversals.
It is still under development, so please, if someone has ideas to add, more than welcome
TWAP + MA crossover Study [Dynamic Signal Lab]Dear TV'ers,
Hereby the study for the TWAP/moving average crossover, with taking profit options.
moving averages include: EMA , WMA , DEMA , TEMA , VAR, WWMA, ZLEMA , TSF , HULL, TILL
It is also possible to gradually take profit, using:
* minimum consecutive green/red candles
* minimum amount of green/red candles in the last 2-8 candles
* both of the above criteria
The slightly transparent green fill shows how much you are in profit from your entry point
The current default properties should be modified to make this strategy cost-effective, but typically 15 minutes and higher timeframes (up to 6hr) seem to work well for larger (top10 cap) crypto projects. Don't use this script for small-caps as it will get you rekt, due to wild volatility.
Additionally, you'll also be able to continuously take profit, making sure you lock in all those sweet profits. For backtesting: use the strategy version of this script

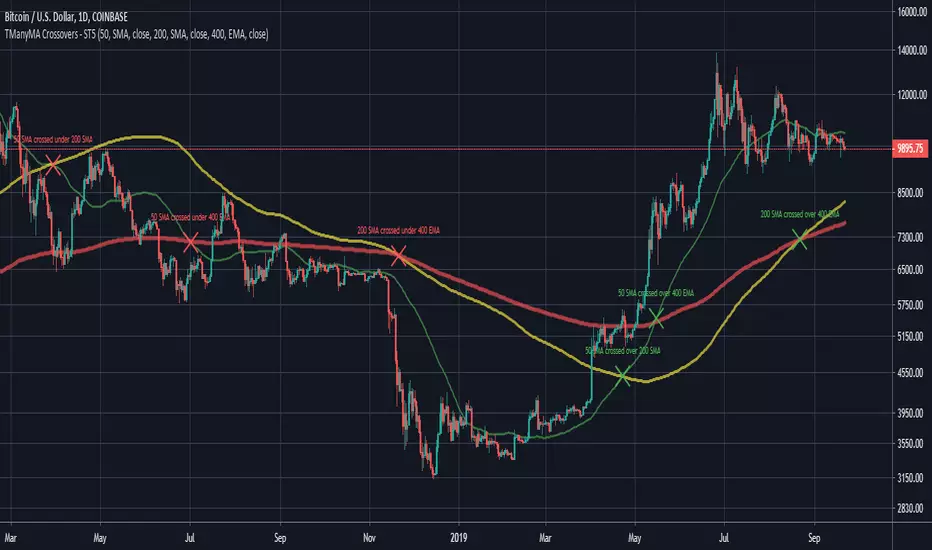
Trend-Quality IndicatorBINANCE:BTCUSDT
Open source version of the Trend-Quality Indicator as described by David Sepiashvili in [ Stocks & Commodities V. 22:4 (14-20) ]
Q-Indicator and B-Indicator are available both separately or together
█ OVERVIEW
The Trend-Quality indicator is a trend detection and estimation tool that is based on a two-step filtering technique. It measures cumulative price changes over term-oriented semicycles and relates them to “noise”. The approach reveals congestion and trending periods of the price movement and focuses on the most important trends, evaluating their strength in the process. The indicator is presented in a centered oscillator (Q-Indicator) and banded oscillator format (B-Indicator).
Semicycles are determined by using a short term and a longer term EMAs. The starting points for the cycles are determined by the moving averages crossover.
Cumulative price change (CPC) indicator measures the amount that the price has changed from a fixed starting point within a given semicycle. The CPC indicator is calculated as a cumulative sum of differences between the current and previous prices over the period from the fixed starting point.
The trend within the given semicycle can be found by calculating the moving average of the cumulative price change.
The noise can be defined as the average deviation of the cumulative price change from the trend. To determine linear noise, we calculate the absolute value of the difference between CPC and trend, and then smooth it over the n-point period. The root mean square noise, similar to the conventional standard deviation, can be derived by summing the squares of the difference between CPC and trend over each of the preceding n-point periods, dividing the sum by n, and calculating the square root of the result.
█ Q-INDICATOR
The Q-Indicator is a centered oscillator that fluctuates around a zero line with no upper or lower limits, is calculated by dividing trend by noise.
The Q-Indicator is intended to measure trend activity. The further the Q is from 0, the less the risk of trading with a trend, and the more reliable the trading opportunity. Values exceeding +2 or -2 can be qualified as promising
Values:
in the -1 to +1 range (GRAY) indicate that the trend is buried beneath noise. It is preferable to stay out of this zone
in the +1 to +2 or -1 to -2 range (YELLOW) indicate weak trending
in the +2 to +5 range (BLUE) or -2 to -5 range (ORANGE) indicate moderate trending
above +5 range (GREEN) or below -5 (RED) indicate strong trending
Readings exceeding strong trending levels can indicate overbought or oversold conditions and signal that price action should be monitored closely.
█ B-INDICATOR
The B-Indicator is a banded oscillator that fluctuates between 0 and 100, is calculated by dividing the absolute value of trend by noise added to absolute value of trend, and scaling the result appropriately.
The B-indicator doesn’t show the direction of price movement, but only the existence of the trend and its strength. It requires additional tools for reversal manifestations.
The indicator’s interpretation is simple. The central line suggests that the trend and noise are in equilibrium (trend is equal to noise).
Values:
below 50 (GRAY) indicate ranging market
in the 50 to 65 range (YELLOW) indicate weak trending
in the 65 to 80 range (BLUE) indicate moderate trending
above 80 (GREEN) indicate strong trending
The 65 level can be thought of as the demarcation line of trending and ranging markets and can help determine which type of technical analysis indicator (lagging or leading) is better suited to current market conditions. Readings exceeding strong trending levels can indicate overbought or oversold conditions.

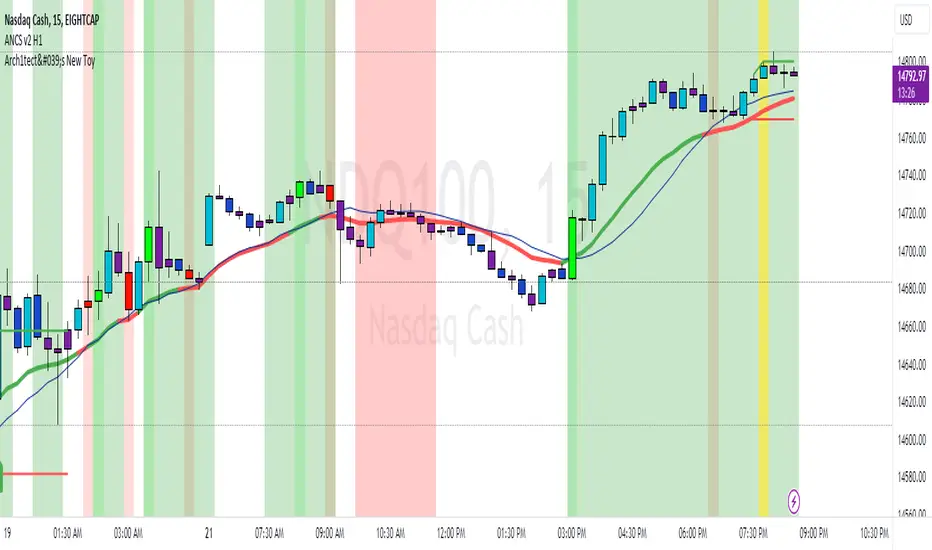
Arch1tect's New ToyDescription:
Arch1tect's New Toy tries to predict market trends by simply utilising 2 moving averages crossovers.
How it works:
Buy signals are triggered when the faster MA crosses over the slower MA from the downside to the upside.
Sell signals are triggered when the faster MA crosses under the slower MA from the upside to the downside.
How to use:
Take buys when buy signal is triggered AND close existing sell position
Take sells when sell signal is triggered AND close existing buy position
Note:
Settings are optimised for XAUUSD on the M1 chart.
Extra:
Alerts are included.
You can toggle between EMA , WMA and SMA to your liking.
Strategy Tester version:
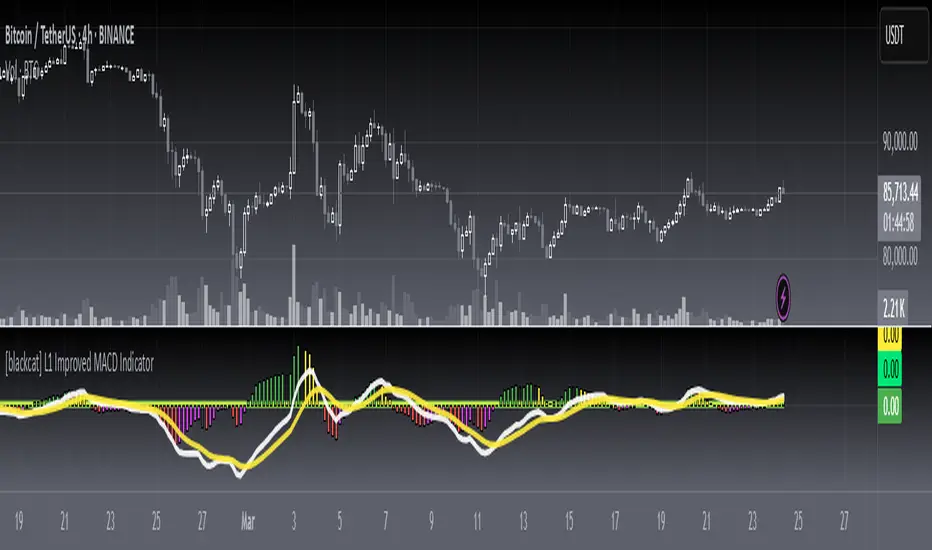
[blackcat] L1 Stick-Line Merged MACDLevel: 1
Background
The MACD is a superior derivative of moving average crossovers and was developed by Gerald Appel in 1979 as a market timing tool. MACD uses two exponential moving averages with different bar periods, which are then subtracted to form what Mr. Appel calls the Fast Line. A 9-period moving average of the fast line creates the slow line.
Function
L1 Stick-Line Merged MACD merges dif and dea lines with macd sticks by the same color candles. The generation of candles help to confirm the trend contiuation. E.g. yellow candles indicate up trend continuation while blue candles indicate down trend continuation
Key Signal
dif --> classic MACD diff fast line in yellow
dea --> classic MACD dea slow line in fuchsia
macd --> classic difference histogram
upslmerge --> up trend continuation yellow candle merge condition
dnslmerge --> down trend continuation blue candle merge condition
Pros and Cons
Pros:
1. merged line and stick with candles help confirm trend reversal
2. long entry signal is indicated.
Cons:
1. need sophisticated knowledge of MACD to use this well
2. this still requires a lot of MACD experience to obtain reliable trading signals
Remarks
Merge lines and sticks of MACD into candles. Better view of the trend
Readme
In real life, I am a prolific inventor. I have successfully applied for more than 60 international and regional patents in the past 12 years. But in the past two years or so, I have tried to transfer my creativity to the development of trading strategies. Tradingview is the ideal platform for me. I am selecting and contributing some of the hundreds of scripts to publish in Tradingview community. Welcome everyone to interact with me to discuss these interesting pine scripts.
The scripts posted are categorized into 5 levels according to my efforts or manhours put into these works.
Level 1 : interesting script snippets or distinctive improvement from classic indicators or strategy. Level 1 scripts can usually appear in more complex indicators as a function module or element.
Level 2 : composite indicator/strategy. By selecting or combining several independent or dependent functions or sub indicators in proper way, the composite script exhibits a resonance phenomenon which can filter out noise or fake trading signal to enhance trading confidence level.
Level 3 : comprehensive indicator/strategy. They are simple trading systems based on my strategies. They are commonly containing several or all of entry signal, close signal, stop loss, take profit, re-entry, risk management, and position sizing techniques. Even some interesting fundamental and mass psychological aspects are incorporated.
Level 4 : script snippets or functions that do not disclose source code. Interesting element that can reveal market laws and work as raw material for indicators and strategies. If you find Level 1~2 scripts are helpful, Level 4 is a private version that took me far more efforts to develop.
Level 5 : indicator/strategy that do not disclose source code. private version of Level 3 script with my accumulated script processing skills or a large number of custom functions. I had a private function library built in past two years. Level 5 scripts use many of them to achieve private trading strategy.

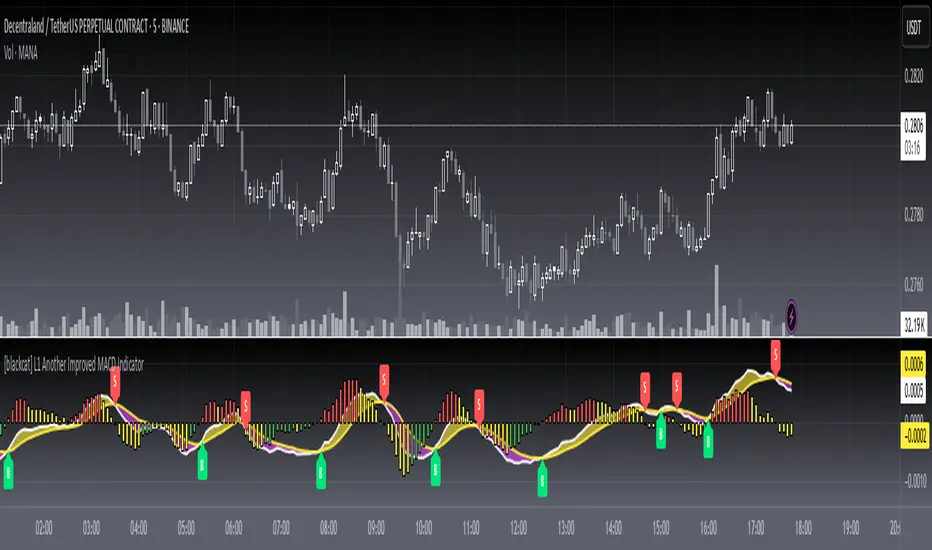
[blackcat] L1 Another Improved MACD IndicatorLevel: 1
Background
The MACD is a superior derivative of moving average crossovers and was developed by Gerald Appel in 1979 as a market timing tool. MACD uses two exponential moving averages with different bar periods, which are then subtracted to form what Mr. Appel calls the Fast Line. A 9-period moving average of the fast line creates the slow line.
Function
L1 Another Improved MACD Indicator improves MACD histogram by customized an algorithm and add three levels of long entry alerts derived from ema ().
Key Signal
diff --> classic MACD diff fast line in white
dea --> classic MACD dea slow line in yellow
macd --> classic difference histogram,but I did not use it directly in the plot.
macd1 --> ema3 of macd
Pros and Cons
Pros:
1. more clear sub level trend change with new histograms
Cons:
1. need sophisticated knowledge of MACD to use this well
2. this still requires a lot of MACD experience to obtain reliable trading signals
Remarks
Another improved MACD on histogram
Readme
In real life, I am a prolific inventor. I have successfully applied for more than 60 international and regional patents in the past 12 years. But in the past two years or so, I have tried to transfer my creativity to the development of trading strategies. Tradingview is the ideal platform for me. I am selecting and contributing some of the hundreds of scripts to publish in Tradingview community. Welcome everyone to interact with me to discuss these interesting pine scripts.
The scripts posted are categorized into 5 levels according to my efforts or manhours put into these works.
Level 1 : interesting script snippets or distinctive improvement from classic indicators or strategy. Level 1 scripts can usually appear in more complex indicators as a function module or element.
Level 2 : composite indicator/strategy. By selecting or combining several independent or dependent functions or sub indicators in proper way, the composite script exhibits a resonance phenomenon which can filter out noise or fake trading signal to enhance trading confidence level.
Level 3 : comprehensive indicator/strategy. They are simple trading systems based on my strategies. They are commonly containing several or all of entry signal, close signal, stop loss, take profit, re-entry, risk management, and position sizing techniques. Even some interesting fundamental and mass psychological aspects are incorporated.
Level 4 : script snippets or functions that do not disclose source code. Interesting element that can reveal market laws and work as raw material for indicators and strategies. If you find Level 1~2 scripts are helpful, Level 4 is a private version that took me far more efforts to develop.
Level 5 : indicator/strategy that do not disclose source code. private version of Level 3 script with my accumulated script processing skills or a large number of custom functions. I had a private function library built in past two years. Level 5 scripts use many of them to achieve private trading strategy.
[blackcat] L1 Improved MACD IndicatorLevel: 1
Background
The MACD is a superior derivative of moving average crossovers and was developed by Gerald Appel in 1979 as a market timing tool. MACD uses two exponential moving averages with different bar periods, which are then subtracted to form what Mr. Appel calls the Fast Line. A 9-period moving average of the fast line creates the slow line.
Function
L1 Improved MACD Indicator mainly improves MACD histogram by customized an algorithm and add three levels of long entry alerts derived from ema().
Key Signal
buy1 --> the 1st level of buy alert in green
buy2 --> the 2nd level of buy alert in lime
buy3 --> the 3rd level of buy alert in yellow
diff --> classic MACD diff fast line in white
dea --> classic MACD dea slow line in yellow
macd --> classic difference histogram,but I did not use it directly in the plot.
Pros and Cons
Pros:
1. more clear sub level trend change with new histograms
2. three levels of buy alerts
Cons:
1. need sophisticated knowledge of MACD to use this well
2. this still requires a lot of MACD experience to obtain reliable trading signals
Remarks
I am a fan of MACD. Even the most classic MACD can have in-depth usage. I think MACD is the king of indicators.
Readme
In real life, I am a prolific inventor. I have successfully applied for more than 60 international and regional patents in the past 12 years. But in the past two years or so, I have tried to transfer my creativity to the development of trading strategies. Tradingview is the ideal platform for me. I am selecting and contributing some of the hundreds of scripts to publish in Tradingview community. Welcome everyone to interact with me to discuss these interesting pine scripts.
The scripts posted are categorized into 5 levels according to my efforts or manhours put into these works.
Level 1 : interesting script snippets or distinctive improvement from classic indicators or strategy. Level 1 scripts can usually appear in more complex indicators as a function module or element.
Level 2 : composite indicator/strategy. By selecting or combining several independent or dependent functions or sub indicators in proper way, the composite script exhibits a resonance phenomenon which can filter out noise or fake trading signal to enhance trading confidence level.
Level 3 : comprehensive indicator/strategy. They are simple trading systems based on my strategies. They are commonly containing several or all of entry signal, close signal, stop loss, take profit, re-entry, risk management, and position sizing techniques. Even some interesting fundamental and mass psychological aspects are incorporated.
Level 4 : script snippets or functions that do not disclose source code. Interesting element that can reveal market laws and work as raw material for indicators and strategies. If you find Level 1~2 scripts are helpful, Level 4 is a private version that took me far more efforts to develop.
Level 5 : indicator/strategy that do not disclose source code. private version of Level 3 script with my accumulated script processing skills or a large number of custom functions. I had a private function library built in past two years. Level 5 scripts use many of them to achieve private trading strategy.
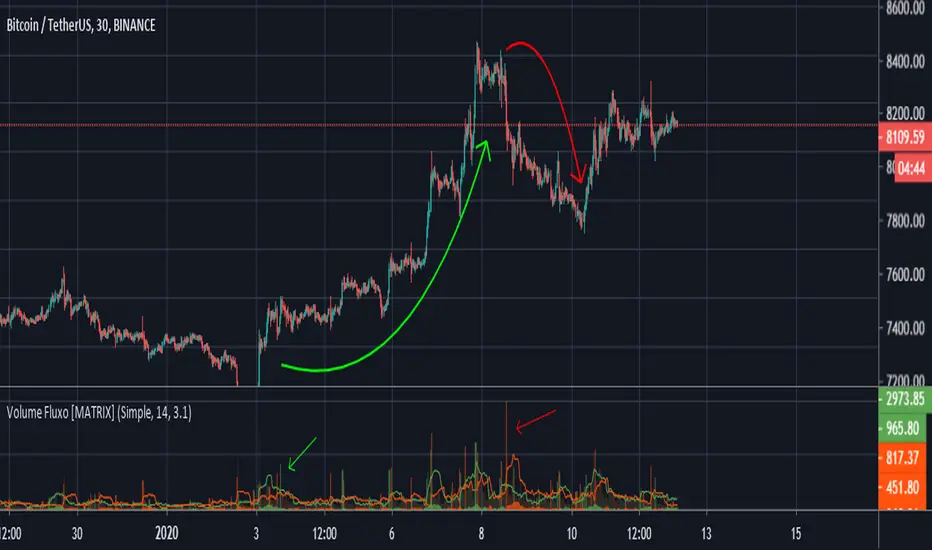
MATRIX Flow Chart V.3DepthHouse Volume Flow indicator is used to help determine trend direction strictly based on Negative and Positive volume data.
How to Read:
- Moving Average crossovers are used to help determine a possible trend change or retracement.
- The area cloud on the bottom is calculated by the difference of the moving averages. This could be used to help determine the trending volume strength.
- Bright colored volume bars are large volume spikes calculated by the x factor in the options.
Other changes:
- DepthHouse is going open source with numerous of its indicators. This is only one of many!
- Volume is now displayed without being altered for calculations.
O indicador de fluxo de volume DepthHouse é usado para ajudar a determinar a direção da tendência estritamente com base nos dados de volume negativo e positivo.
Como ler:
- Média móvel crossovers são usados para ajudar a determinar uma possível mudança ou retração de tendência.
- A nuvem da área na parte inferior é calculada pela diferença das médias móveis. Isso pode ser usado para ajudar a determinar a força do volume de tendências.
- Barras de volume coloridas brilhantes são grandes picos de volume calculados pelo fator x nas opções.
Scripting Tutorial 5 - Triple Many Moving Averages CrossoversThis script is for a triple moving average indicator where the user can select from different types of moving averages and periods. This script improves upon tutorial 3 by adding source selection for MAs and another option for an MA that is not built-in, the HMA . It is meant as an educational script with well formatted styling, and references for specific functions.
4K+ Candlestacks/ColumnCandles Plus PerksFor all candle analysis enthusiasts out there, this is my cutting edge "4K+ Candlestacks/ColumnCandles Plus Perks" that I spontaneously invented long ago. Just when you may have thought it was the end of the evolutionary line for candle technology, it's not! There are candlesticks and now "candlestacks". Your eyes are presently gazing upon a NEW candle type intended for destiny well into the 21st century and onward to support much higher graphics resolutions including 4K, 8K, 16K+ yielding enhanced chart analytics. With extremely high resolution display technologies arriving within the affordable range, having thin 1 pixel wide traditional candle wicks are going to become more and more visually apprehensible. Particularly for folks with a visual acuity that is not par at 20/20 or have some degree of color blindness, the candlestacks have a "large" amount of different color schemes to select from.
"Candlestick charts" are suspected to have been invented by Munehisa Homma well over 200 years ago. We have been using technology that is older than the age of distributed electricity and the modern car combined with billions at stake, hour to hour of each day. While candlesticks are effective, by having an abundance of computing power, the old candlestick wick width is becoming indistinguishably lost in the fog of a plenitude of plots. After a short time of contemplating about it linguistically in Pine Script, I arrived at a eureka moment having an actual working candle that was entirely novel. However, I didn't want to stop there. It required color finesse for diagnosed visual impairments combined with methods such as Heikin Ashi variants. My intention while inventing this was to provide the ultimate experience in candle technology that could potentially exist.
"Candlestacks" are just like the original OHLC candlesticks, however the "wick" portion is more like a column displaying visually increased situational awareness. Immediately at first sight, I originally conceived of the name "ColumnCandles" upon initial inspection of the plot, being it was remarkably similar to overlapping column charts I have been seeing for years with data metrics. In my attempt to formulate a worthier name, I noticed their appearance looks like stacks of blocks. Stacks, sticks, it sounded rhythmically sweet. I decided candlestacks would be a more appropriate name for this candle type distinguishable from candlesticks, but all to similarly sounding. I am hopeful I chose candlestacks as a fitting name that the rest of the world may come to appreciate one day when the planet is powered by nuclear "compact fusion" reactors and everyone has personal aerial transportation availability. "Candlestacks" vs "ColumnCandles", leave your opinion below in the comments if you are compelled to do so, providing a consensus. I respect your opinion either way...
Heikin Ashi, with it's advantages of identifying current short term trends, seemed worthy of inclusion, so I decided to expand on candlestacks with three different formulations to select from, including a fourth OHLC basic type. There are two distinct methods of Hieken Ashi employing pre-smoothing and post-smoothing techniques, each of which having capabilities of using different smoothing filters that are selectable.
Other features include a brightening option for the first descending candle which is best suited while using Heikin Ashi. The candlestacks wick transparency is independently controllable. Descending candlestacks have a darker wick than the ascending kind. With the Heikin Ashi smoothing techniques, I included a selection to see traditional candlestick wicks in a supplementary fashion. Also, there is an option to control the amount of candlestacks that are displayable. This is also a multicator including my "SWIFT Moving Average Crossover", which is complimentary to the candlestacks, especially in one of the Heikin Ashi modes. This moving average crossover(MAC), having multiple color schemes, limits the divergences between the leading and lagging lines. Of notable mention, the crossover dots on the SWIFT MAC you see, are actually one bar late. Lastly, with this flagship indicator, I included a multi-color "neon source" line to view close, hl2, etc... in combination with the candlestacks yielding the best of both worlds selectively. Any one of the individual indicators may actually be enabled/disabled independently. Being this is an overlay chart, I "may" include other overlay indicators in the future where they provide an added benefit to what is already included.
I provided multiple color schemes for those of you who may have color blindness vision impairments. You may contact me in private, if these color schemes are not suitable for your diagnosed visual impairment, and you wish to contribute to seeing the color schemes improved along with other future indicators I shall release.
I.P.O.C.S.: "Initial Public Offering Clean Start" proprietary technology. Firstly, many of my other indicators already possess this capability. It allows suitable plotting from day one, minute one of IPO, remedying visually delayed signal analysis. It's basically accurate plotting from the very first bar (bar_index==0) on Tradingview. If you don't know what this is, most people don't, go back to the VERY beginning of any stock on the "All" chart and compare it to other similar indicators. What's so special about this? It is extremely difficult to get a healthy plot from bar_index==0 on any platform. However, I have become exceedingly talented performing this feat in most cases, but not all depending on the algorithm. This indicator is a successful accomplishment implementing IPOCS. It's inherent value is predominantly for IPO traders who in the past have had to wait 20, 50, and 150 bars before they obtain a precise indicator measurement for the simplest of algorithms in order to make a properly informed decision to potentially invest in an asset. How is this achieved? It's a highly protected secret of mine... but I will say I rarely use Pine built-in functions at all. When I do, I use them scarcely due to currently existing Pine language limitations.
Features List Includes:
I.P.O.C.S.(Initial Public Offering Clean Start) Technology
Enable/disable dark background for enhanced visibility
Color schemes for individual indicators
Controls for Heikin Ashi candlestacks smoothing
Historical bar controls
"Neon Source" options
Many, many more previously described...
This is not a freely available indicator, FYI. To witness my Pine poetry in action, properly negotiated requests for unlimited access, per indicator, may ONLY be obtained by direct contact with me using TV's "Private Chats" or by "Message" hidden in my member name above. The comments section below is solely just for commenting and other remarks, ideas, compliments, etc... regarding only this indicator, not others. When available time provides itself, I will consider your inquiries, thoughts, and concepts presented below in the comments section if you do have any questions or comments regarding this indicator. When my indicators achieve more prevalent use by TV members, I will implement more ideas when they present themselves as worthy additions. As always, "Like" it if you simply just like it with a proper thumbs up, and also return to my scripts list occasionally for additional postings. Have a profitable future everyone!

Simple TrenderOriginates from:
I was reading some Impulse Trading literature by A. Elder.. In it, someone named Kerry Lovvorn proposed "An End of Day Trend Following System" for someone lazy.
Originally it is just price closing above an 8 ema (low) for long. Exit when price closes below an 8 ema (low). The opposite for a short position.
Conditions: Buy when price closed below ema (low) for two bars or more, then closes above. Opposite for a short position. I do not follow this condition. Though it may help with whipsaw.
My condition is when price closes above the 26 ema (low) (works the best for me) I place orders above the initial crossing bars high. Opposite for lows.
I look for stocks that are low in price to go long on. I want the run from 2's to 15's
I look for stocks that are mid-teens/20's in price to go short on. I want the run from 20's to 2's
I look for stock with news and earnings that are already running (up or down) to play the pullback.
These conditions can easily be scanned for on thinkorswim
From first glance, the system looks like CMsling shotsystem. Although, I plagiarized some parts of the codes, because I am inept when it comes to that shit, it differs as it is not a moving average crossover system.
It is a price crossing over concept. A moving average VWAP is used for best entries on pullbacks.
Purpose:
--To catch the majority of a trend/wave/run.
--To identify pullback areas to go long or short while in midst of trend. To catch pullbacks off news and earning runners.
--To catch the initial start of trend with clear rules to enter
--Clear rules to exit
Issues
--possibilities of getting ninja sliced the fuck up. Can be mitigated by entering stocks with decent average volume. And also only going long above 200 ema and short below it. ADX won't work, at the initial start of the trend it will show not trending. Can look at blow off volume at the bottom followed by increase in buying for long and vice versa for short.
--Can give some huge gains away through gap ups or gap downs from news or earnings during trend. However, can get huge gain on gaps from news or earning. Nature of the game.
--Need some brass balls and a supply of pepto to stomach through some of the pullbacks. Gut wrenching seeing big gains dwindle. But they all even out at the end, you hope. (see NBEV and IGC, and CRON and others. shit don't go in straight lines, homie)
Pros
--It's simple and easy. Overall, you profit
--works with any security
Cons
--It can be stressful.
--does not work well on lower time frames. Do not recommend going below 15 minutes
--Possibility of working on 5 minutes with a time frame breakout strategy (15,30 min).
Couple it with LazyBear "Weis Wave Volume" indicator. Works well for pullback entries.
Enjoy. Ride some waves.

Predictive EMAFrom the MQL5 Indicator database, here is what the author said about the script,
"Goal of this indicator:
Given three EMA's of varying lengths, use their values
for a estimator of "where we are now" or will be in the near future.
This is a very simplistic method, better ones are probably found
in the signal processing and target tracking literature.
A Kalman filter has been known since the 1950's 1960's and there
is better still. Nevertheless this is easily programmable in the
typical environments of a retail trading application like Metatrader4.
Method:
An an exponential moving average (EMA) or a simple moving average (SMA), for that
matter, have a bandwidth parameter 'L', the effective length of the window. This
is in units of time or, really, inverse of frequency. Higher L means a lower
frequency effect.
With a parameter L, the weighted time index of the EMA and SMA is (L-1)/2. Example:
take an SMA of the previous 5 values: -5 -4 -3 -2 -1 now. The average "amount of time"
back in the past of the data which go in to the SMA is hence -3, or (L-1)/2. Same applies
for an EMA. The standard parameterization makes this correspondence between EMA
and SMA.
Therefore the idea here is to take two different EMA's, a longer, and
a shorter of lengths L1 and L2 (L2 <L1). Now take the pairs:
which defines a line.
Extrapolate to , solve for y and that is the predictive EMA estimate.
Application:
Traditional moving averages, as simple-minded linear filters, have significant group delay.
In engineering that isn't so important as nobody cares if your sound from your iPod is delayed
a few milliseconds after it is first processed. But in markets, you can't
trade on the smoothed price, only the actual noisy, market price now. Hence you
ought to estimate better.
This statistic (what math/science people call what technical analysts call an 'indicator')
may be useful as the "fast" moving average in a moving average crossover trading system.
It could also be useful for the slow moving average as well.
For instance, on a 5 minute chart:
try for the fast: (will be very wiggly, note)
LongPeriod 25.0
ShortPeriod 8.0
ExtraTimeForward 1.0
and for the slow:
LongPeriod 500.0
ShortPeriod 50.0 to 200.0
ExtraTimeForward 0.0
But often a regular MA for the slow can work as well or better, it appears from visual inspection.
Enjoy.
In chaos there is order, and in that order there is chaos and order inside again.
Then, surrounding everything, pointy haired bosses. "
I may have done it incorrectly, feel free to revise

MultiTradingSystemThis is example to show how you can combine two and more strategies for get
a cumulative signal. Result signal will return 1 if two (or more) strategies
is long, -1 if all strategies is short and 0 if signals of strategies is not equal.
First strategy
Chaikin's Volatility indicator compares the spread between a security's
high and low prices. It quantifies volatility as a widening of the range
between the high and the low price.
You can use in the xPrice1 and xPrice2 any series: Open, High, Low, Close, HL2,
HLC3, OHLC4 and ect...
Secon strategy
The Moving Average Crossover trading strategy is possibly the most popular
trading strategy in the world of trading. First of them were written in the
middle of XX century, when commodities trading strategies became popular.
This strategy is a good example of so-called traditional strategies.
Traditional strategies are always long or short. That means they are never
out of the market. The concept of having a strategy that is always long or
short may be scary, particularly in today’s market where you don’t know what
is going to happen as far as risk on any one market. But a lot of traders
believe that the concept is still valid, especially for those of traders who
do their own research or their own discretionary trading.
This version uses crossover of moving average and its exponential moving average.
Hash Momentum IndicatorHash Momentum Indicator
Overview
The Hash Momentum Indicator provides real-time momentum-based trading signals with visual entry/exit markers and automatic risk management levels. This is the indicator version of the popular Hash Momentum Strategy, designed for traders who want signal alerts without backtesting functionality.
Perfect for: Live trading, automation via alerts, multi-indicator setups, and clean chart visualization.
What Makes This Indicator Special
1. Pure Momentum-Based Signals
Captures price acceleration in real-time - not lagging moving average crossovers. Enters when momentum exceeds a dynamic ATR-based threshold, catching moves as they begin accelerating.
2. Automatic Risk Management Visualization
Every signal automatically displays:
Entry level (white dashed line)
Stop loss level (red line)
Take profit target (green line)
Partial TP levels (dotted green lines)
3. Smart Trade Management
Trade Cooldown: Prevents overtrading by enforcing waiting period between signals
EMA Trend Filter: Only trades with the trend (optional)
Session Filters: Trade only during Tokyo/London/New York sessions (optional)
Weekend Toggle: Avoid low-liquidity weekend periods (optional)
4. Clean Visual Design
🟢 Tiny green dot = Long entry signal
🔴 Tiny red dot = Short entry signal
🔵 Blue X = Long exit
🟠 Orange X = Short exit
No cluttered labels or dashboard - just clean signals
5. Professional Alerts Ready
Set up TradingView alerts for:
Long signals
Short signals
Long exits
Short exits
How It Works
Step 1: Calculate Momentum
Momentum = Current Price - Price
Normalized by standard deviation for consistency
Must exceed ATR × Threshold to trigger
Step 2: Confirm Acceleration
Momentum must be increasing (positive momentum change)
Price must be moving in signal direction
Step 3: Apply Filters
EMA Filter: Long only above EMA, short only below EMA (if enabled)
Session Filter: Check if in allowed trading session (if enabled)
Weekend Filter: Block signals on Sat/Sun (if enabled)
Cooldown: Ensure minimum bars passed since last signal
Step 4: Generate Signal
All conditions met = Entry signal fires
Lines automatically drawn for entry, stop, and targets
Step 5: Exit Detection
Opposite momentum detected = Exit signal
Stop loss or take profit hit = Exit signal
Lines removed from chart
⚙️ Settings Guide
Core Strategy
Momentum Length (Default: 13)
Number of bars for momentum calculation. Higher values = stronger signals but fewer trades.
Aggressive: 10
Balanced: 13
Conservative: 18-24
Momentum Threshold (Default: 2.25)
ATR multiplier for signal generation. Higher values = only trade the biggest momentum moves.
Aggressive: 2.0
Balanced: 2.25
Conservative: 2.5-3.0
Risk:Reward Ratio (Default: 2.5)
Your target profit as a multiple of your risk. With 2.2% stop and 2.5 R:R, your target is 5.5% profit.
Conservative: 3.0+ (need 25% win rate to profit)
Balanced: 2.5 (need 29% win rate to profit)
Aggressive: 2.0 (need 33% win rate to profit)

MAxRSI Signals [KedArc Quant]Description:
MAxRSI Indicator Marks LONG/SHORT signals from a Moving Average crossover and (optionally) confirms them with RSI. Includes repaint-safe confirmation, optional higher-timeframe (HTF) smoothing, bar coloring, and alert conditions.
Why combine MA + RSI
* The MA crossover is the primary trend signal (fast trend vs slow trend).
* RSI is a gate, not a second, separate signal. A crossover only becomes a trade signal if momentum agrees (e.g., RSI ≥ level for LONG, ≤ level for SHORT). This reduces weak crosses in ranging markets.
* The parts are integrated in one rule: *Crossover AND RSI condition (if enabled)* → plot signal/alert. No duplicated outputs or unrelated indicators.
How it works (logic)
* MA types: SMA / EMA / WMA / HMA (HMA is built via WMA of `len/2` and `len`, then WMA with `sqrt(len)`).
* Signals:
* LONG when *Fast MA crosses above Slow MA* and (if enabled) *RSI ≥ Long Min*.
* SHORT when *Fast MA crosses below Slow MA* and (if enabled) *RSI ≤ Short Max*.
* Repaint-safe (optional): confirms crosses on closed bars to avoid intrabar repaint.
* HTF (optional): computes MA/RSI on a higher timeframe to smooth noise on lower charts.
* Alerts: crossover alerts + state-flip (bull↔bear) alerts.
How to use (step-by-step)
1. Add to chart. Set MA Type, Fast and Slow (keep Fast < Slow).
2. Turn Use RSI Filter ON for confirmation (default: RSI 14 with 50/50 levels).
3. (Optional) Turn Repaint-Safe ON for close-confirmed signals.
4. (Optional) Turn HTF ON (e.g., 60 = 1h) for smoother signals on low TFs.
5. Enable alerts: pick “MAxRSI Long/Short” or “Bullish/Bearish State”.
Timeframe guidance
* Intraday (1–15m): EMA 9–20 fast vs EMA 50 slow, RSI filter at 50/50.
* Swing (1h–D): EMA 20 fast vs EMA 200 slow, RSI 50/50 (55/45 for stricter).
What makes it original
* Repaint-safe cross confirmation (previous-bar check) for reliable signals/alerts.
* HTF gating (doesn’t compute both branches) for speed and clarity.
* Warning-free MA helper (precomputes SMA/EMA/WMA/HMA each bar), HMA built from built-ins only.
* State-flip alerts and optional RSI overlay on price pane.
Built-ins used
`ta.sma`, `ta.ema`, `ta.wma`, (HMA built from these), `ta.rsi`, `ta.crossover`, `ta.crossunder`, `request.security`, `plot`, `plotshape`, `barcolor`, `alertcondition`, `input.*`, `math.*`.
Note: Indicator only (no orders). Test settings per symbol. Not financial advice.
⚠️ Disclaimer
This script is provided for educational purposes only.
Past performance does not guarantee future results.
Trading involves risk, and users should exercise caution and use proper risk management when applying this strategy.

Crypto Flows [ETF|On-chain]The surge in Bitcoin and Ethereum spot ETFs has transformed how crypto is held and traded. By mid‑2025, U.S. spot Bitcoin ETFs already controlled roughly 1.28 million BTC, or about 6.5 percent of the circulating supply (Fosque, 2025). This accumulation has coincided with sharp price rallies and signals that regulated vehicles are absorbing a meaningful share of supply (Fosque, 2025; Wright, 2025). At the same time, on‑chain analytics show that exchange flows still influence markets: large inflows to exchanges often precede sell‑offs, whereas withdrawals to private wallets signal accumulation and reduced sell pressure (Singh, 2024; CryptoQuant, 2024). IntoTheBlock’s large‑holder inflow indicator even notes that spikes in whale buying frequently mark major bottoms (IntoTheBlock, 2022). I wanted to weave these pieces together, so I created this indicator.
Essence and logic
The script draws from two data streams: net flows into ETFs and net on‑chain flows from large holders, both scaled by the asset’s circulating market cap. ETF flows are aggregated across the ten largest INDEX:BTCUSD Bitcoin ETFs, the ten largest Ethereum INDEX:ETHUSD ETFs and the first CRYPTOCAP:SOL Solana ETF; each fund has its own checkbox and colour selection. On‑chain data uses IntoTheBlock’s large‑holder inflows and outflows, with dozens of coins available( CRYPTO:XRPUSD CRYPTOCAP:AVAX CRYPTOCAP:ADA CRYPTOCAP:LINK CRYPTO:DOGEUSD CRYPTOCAP:OTHERS ; if your coin isn’t shown in the dropdown you can manually enter its symbol. For each component, daily flows are converted into either a Z‑score or, by default, a percent‑of‑market‑cap series; users choose the weighting between ETF and on‑chain signals. These weighted series are summed into a composite, smoothed, and then two moving averages (a fast and a slow one) are applied to define bullish or bearish regimes. Because ETFs are a recent phenomenon, the early part of the composite is dominated by on‑chain flows; as ETF history lengthens, the fund‑flow component will become more influential. Trade signals are generated via moving‑average crossovers and optional dip triggers, and a trend table summarises current values and directions.
Why these components?
ETF flows reflect institutional adoption and supply absorption. Funds such as IBIT already hold about 744 000 BTC (roughly 3.3 percent of total supply), and cumulative ETF holdings have been growing faster than new coins are mined (Wright, 2025). Net inflows into these vehicles have tended to accompany rising prices and signal long‑horizon capital (Fosque, 2025). On‑chain flows, meanwhile, capture exchange liquidity dynamics. High inflows to exchanges often indicate that investors are preparing to sell, increasing tradable supply (Singh, 2024; CryptoQuant, 2024). Outflows into self‑custody suggest accumulation and reduced sell pressure, providing a bullish signal (Singh, 2024; CryptoQuant, 2024). IntoTheBlock points out that spikes in large‑holder inflows—whales moving coins into cold storage—have historically preceded price bottoms (IntoTheBlock, 2022). By weighting and standardising these flows relative to market cap, the composite aims to offer a more objective lens on risk‑on versus risk‑off regimes than price alone.
Limitations and outlook
ETFs a pretty new, so the data history is short. The list of tracked funds is currently limited to U.S. and European products; adding Asian or Canadian vehicles could provide a fuller picture. On‑chain flows can be noisy and occasionally give conflicting signals, and large‑holder data is not available for every crypto asset. The ETF and on‑chain components are also correlated through market cap, so equal weighting may amplify common trends. As macro conditions evolve and ETF redemption mechanisms change, the usefulness of fund flows could vary. I see this indicator as one tool among many, and I’m considering adding stablecoin flows, derivatives funding rates, or halving‑cycle adjustments. Suggestions are welcome.
Personal note
I’m a student who enjoys exploring the intersection of macro flows, on‑chain analytics and market psychology. This script is free to use. You can enable or disable each component, adjust weights, change the display mode and lookback, and select individual ETF tickers. If it brings you value, feel free to follow my work or reach out with feedback. I appreciate your support. Please remember that this indicator is for educational purposes and not investment advice. I built this indicator in addition to my Liquidity indicator, where I use Global M2, the yield curve, and the high-yield spread to define risk-on/risk-off regimes. If you are interested, you can find it here:
References
CryptoQuant Team. (2024). Exchange in/outflow and netflow user guide.
Fosque, J. (2025). Bitcoin ETFs pull $17.8 billion in 90 days as price surges past $118 K. The Digital Chamber.
IntoTheBlock. (2022). Large holders inflow indicator description.
Singh, O. (2024). Crypto exchange inflows and outflows explained: What they reveal about market trends. CCN.
Wright, L. (2025). Bitcoin ETFs to lock up 1.5 million BTC by New Year as supply squeeze tightens grip. CryptoSlate.
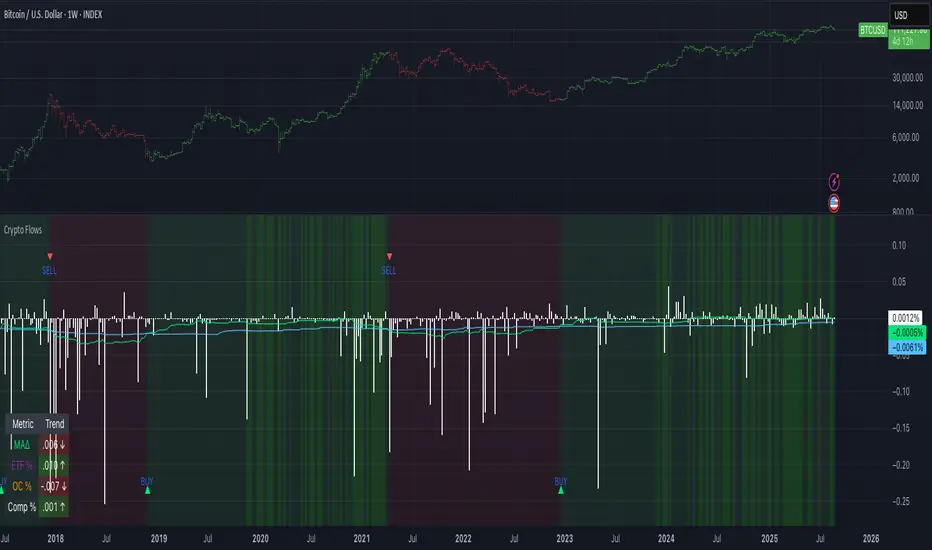
WERTradersThis custom indicator is designed for traders who prefer a clean chart with clear Buy and Sell signals — without any distracting moving average lines.
It uses a simple and effective Moving Average Crossover strategy in the backend:
Buy Signal: When the short-term (fast) moving average crosses above the long-term (slow) moving average.
Sell Signal: When the fast moving average crosses below the slow moving average.
✔️ Ideal for price-action traders
✔️ Clean chart with only actionable signals
✔️ Suitable for intraday and swing trading
✔️ Includes alert support for automation

Price Lag Factor (PLF)📊 Price Lag Factor (PLF) for Crypto Traders: A Comprehensive Breakdown
The Price Lag Factor (PLF) is a momentum indicator designed to identify overextended price movements and gauge market momentum. It is particularly optimized for the crypto market, which is known for its high volatility and rapid trend shifts.
🔎 What is the Price Lag Factor (PLF)?
The PLF measures the difference between long-term and short-term price momentum and scales it dynamically based on recent volatility. This helps traders identify when the market might be overbought or oversold while filtering out noise.
The formula used in the PLF calculation is:
PLF = (Z-Long - Z-Short) / Stdev(PLF)
Where:
Z-long: Z-score of the long-term moving average (50-period by default).
Z-short: Z-score of the short-term moving average (14-period by default).
Stdev(PLF): Standard deviation of the PLF over a longer period (50-period by default).
🧠 How to Interpret the PLF:
1. Trend Direction:
Positive PLF (Green Bars): Indicates bullish momentum. The long-term trend is up, and short-term movements are confirming it.
Negative PLF (Red Bars): Indicates bearish momentum. The long-term trend is down, and short-term movements are consistent with it.
2. Momentum Strength:
PLF near Zero (±0.5): Low momentum; trend direction is not strong.
PLF between ±1 and ±2: Moderate momentum, indicating that the market is moving with strength but not in an overextended state.
PLF beyond ±2: High momentum (overbought/oversold), indicating potential trend exhaustion and a possible reversal.
📈 Trading Strategies:
1. Trend Following:
Bullish Signal:
Enter long when PLF crosses above 0 and remains green.
Confirm with other indicators like RSI or MACD to reduce false signals.
Bearish Signal:
Enter short when PLF crosses below 0 and remains red.
Use trend confirmation (e.g., moving average crossover) for better accuracy.
2. Reversal Trading:
Overbought Signal:
If PLF rises above +2, look for signs of bearish divergence or a reversal pattern to consider a short entry.
Oversold Signal:
If PLF falls below -2, watch for bullish divergence or a support bounce to consider a long entry.
3. Momentum Divergence:
Bullish Divergence:
Price makes a lower low while PLF makes a higher low.
Indicates weakening bearish momentum and a potential bullish reversal.
Bearish Divergence:
Price makes a higher high while PLF makes a lower high.
Signals weakening bullish momentum and a potential bearish reversal.
💡 Best Practices:
Combine with Volume:
Volume spikes during high PLF readings can confirm trend continuation.
Low volume during PLF extremes may hint at false breakouts.
Watch for Extreme Levels:
PLF beyond ±2 suggests overextended price action. Use caution when entering new positions.
Confirm with Other Indicators:
Use with Relative Strength Index (RSI) or Bollinger Bands to get a better sense of overbought/oversold conditions.
Overlay with a moving average to gauge trend consistency.
🚀 Why the PLF Works for Crypto:
Crypto markets are highly volatile and prone to rapid trend changes. The PLF's adaptive scaling ensures it remains relevant regardless of market conditions.
It highlights momentum shifts more accurately than static indicators because it accounts for changing volatility in its calculation.
🚨 Disclaimer for Traders Using the Price Lag Factor (PLF) Indicator:
The Price Lag Factor (PLF) indicator is designed as a technical analysis tool to gauge momentum and identify potential overbought or oversold conditions. However, it should not be relied upon as a sole decision-making factor for trading or investing.
Important Points to Consider:
Market Risk: Trading cryptocurrencies and other financial assets involves significant risk. The PLF may not accurately predict future price movements, especially during unexpected market events.
Indicator Limitations: No technical indicator, including the PLF, is infallible. False signals can occur, particularly in low-volume or highly volatile conditions.
Supplementary Analysis: Always combine PLF insights with other technical indicators, fundamental analysis, and risk management strategies to make informed decisions.
Personal Judgment: Traders should use their own discretion when interpreting PLF signals and never trade based solely on this indicator.
No Guarantees: The PLF is designed for educational and informational purposes only. Past performance is not indicative of future results.
Always perform thorough research and consider consulting with a professional financial advisor before making any trading decisions.
