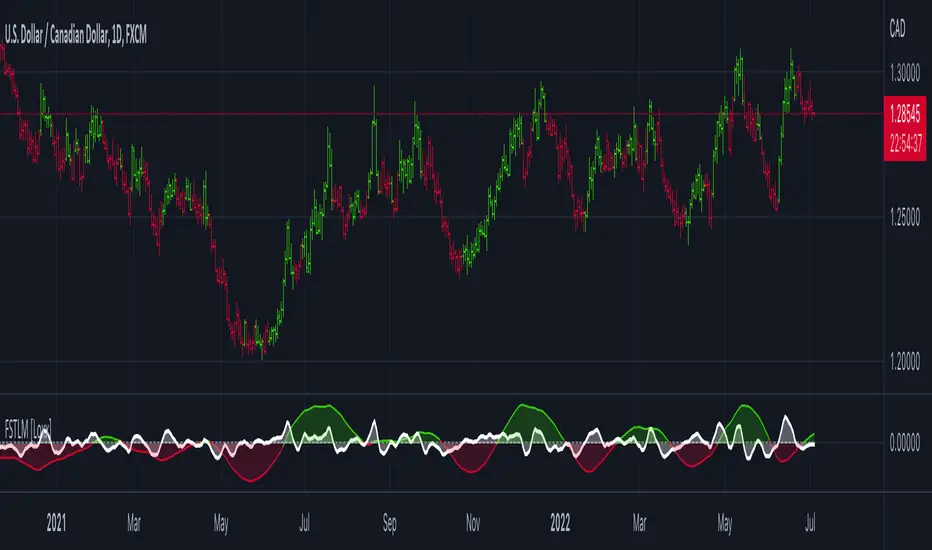
Fast and Slow Trend-Line Momentum [Loxx]Fast and Slow Trend-Line Momentum is a momentum indicator using FATL, SATL, RFTL, & RSTL Digital Filters
What is FTLM-STLM?
Fast Trend Line Momentum (FTLM) and Slow Trend Line Momentum (SLTM) indicators show the rate of price change, FATL and SATL are calculated the similar way as Momentum indicator.
FTLM(bar) = FATL(bar) – RFTL(bar)
STLM(bar) = SATL(bar) – RSTL(bar)
The main difference FTLM from the classic Momentum indicator is the following: it source prices processed by digital filters instead of close prices itself. As a result, FTLM looks smoothed and regular, in contrast with classic Momentum technical indicators.
Included:
-Bar coloring
"momentum" için komut dosyalarını ara
On Balance Volume MomentumA combination of "On Balance Volume (OBV)" and "Volume Oscillator".
"OBV Momentum" is a trend momentum indicator, that can be used to identify strong trends and also trend changes based on volume.
High positive values indicate strong volume on the buy side, high negative values indicate strong volume on the sell side.
An increasing OBV momentum indicates a strengthening buy trend or a weakening sell trend,
decreasing OBV Momentum indicates a strengthening sell trend or weakening buy trend.
OBV Momentum is calculated by comparing a short vs. a long moving average and plotting the difference in volume.
OBV Momentum metric is absolute volume.

RedK Momentum Bars (RedK Mo_Bars)Momentum Bars (Mo_Bars) offers a different way to visualize (relative) momentum - and uses some simple TA concepts to provide a different perspective into how we read momentum changes and incorporate that in our trading.
The idea here (and the script itself) is really super simple, and is (very loosely) inspired by Elder's Impulse System (EIS) - then evolved to leverage some other concepts, and to become less cluttering and "easier to read".
The construction of the Mo_Bars
---------------------------------------------
The base concept utilizes 3 moving average lines :
the first line is a relatively fast MA with a short length - acts as the main price tracking line
the second line is slightly slower than the main line - 2 to 3 bars longer length - and will by default use the open value as source - this works better to identify when the closing price starts to move faster than the open (as in, bars more frequently close higher than they open) - this line acts as the signal line - there's an added setting for an additional delay that utilizes regular WMA smoothing - the delay acts to magnify the relative displacement between the 2 MAs
for both these MA's, i choose to use the RSS MA (Lazy Line) - other MA types can be used, but the reason i used that MA type specifically is that it moves "gracefully" - and 2 Lazy Lines moving together minimizes whipsaws from small price swings - i tested with other MA types and found that the RSS has an advantage there.
the third line is a much slower MA (length 5 to 6 x the fast line) - and acts as a filter or a baseline. When we're above that line, we should favor long positions - we're in bull territory. When we're below that line we favor short positions, and we're in bear territory. Adjust this line as it suits your trading style and time frame.
(I choose to use WMA as the MA type for the filter line .. and there's a good reason for that - which i'll skip for now - but in future versions, we can add other selectable MA types. )
Using Mo_Bars
----------------------------
at a very broad level, we can use Mo_Bars similar to how we use a MACD - both are centered and unrestricted oscillators - note the difference that Mo_Bars is based on 3 MA's rather than 2.
the Mo_Bar bar length reflects the distance between the main MA and the signal MA - plotted relative to the baseline (filter line) - that means that the length of the bar represents the relative momentum between the 2 MA's - The Mo_Bars are then colored in a way that reflects increase or decrease in the value of that momentum (the visual here may have been inspired by another indicator recently published by one of our esteemed wizards - it worked perfectly - so due credits here :)
-- in simple terms, if the main MA is below the signal MA, the bar is red - and when the main MA is above the signal MA, the bar is green - a white bar usually shows up when there's a detected change of relative momentum direction (note that this is not the same as the trend direction - and that's what helps show and exploit convergence and divergence - similar to a MACD)
* in the chart above, i noted few examples of how visualizing relative momentum in this way exposes areas of chop (Mo_Bars above zero but are in red or moving down, or when Mo_Bars are below zero and green or moving up) - convergence / divergence with price - and how this can act to expose the possibility of potential changes in price action or trend.
* there's so much more to play around with this setup - and maybe if there's enough interest there can be future dedicated posts on how utilize or even to evolve it further - there's a lot of potential here, to add more filters (maybe volume based), alerts, signals...etc - so let's see the interest :)
Here's the detailed (top chart) setup that Mo_Bars is based on -- The settings for the MA's on the price charts have been matched / sync'ed with the Mo_Bars settings on the lower panel to demonstrate how the script works and how it translate the MA action on the price chart to what we see below.
As always, please play around with the indicator to get used to how it works - use it in tandem with other indicators to get proper confirmations and adjust settings to suit your own trading style, time frame, and instruments
Feedback and thoughts are always welcome --- good luck!

Closing MomentumClosing momentum calculates the moving averages of closes and highs vs previous highs plus those of closes and lows vs previous lows to create momentum moving averages. Closes above/below previous highs/lows are weighted more strongly than new high or low wicks above/below a previous highs or lows.
If momentum is up, the background will shade green; brighter is stronger. If momentum is down, likewise with red.
Shifts in momentum are indicated by symbols: triangles indicate a minor shifts, arrows moderate, big arrows major. Likewise, the shade of the symbols indicates strength (darker is stronger).
Using the indicator: long continuous stretches of the same color indicate trend - deeper is stronger. If the shade is lightening or clears and/or if symbols of the other color start appearing, the trend is weakening.

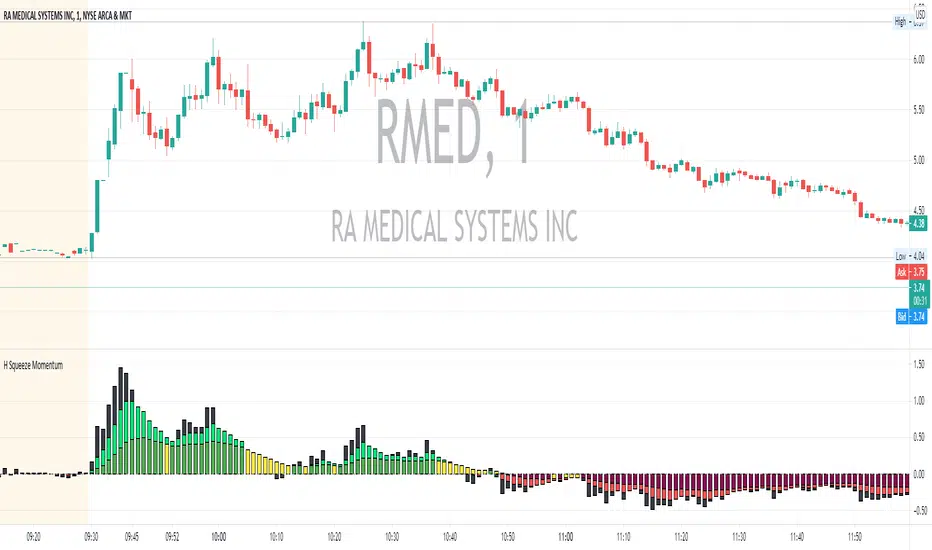
Hamdan Squeeze MomentumHamdan Squeeze Momentum
The script of is show Squeeze bar.
█ FEATURES
Study Is Based In Momentum Indicator :
Green : Uptrend in general
Lime : Spots the current uptrend leg
Black : The maximum profitability of the leg in a long trade
The Squeeze happens when Green+Lime+Black are aligned (the larger the values the better)
Maroon : Downtrend in general
Red : Spots the current downtrend leg
Black: The maximum profitability of the leg in a short trade
The Squeeze happens when Maroon+Red+Black are aligned (the larger the values the better)
Yellow : The trend has come to a pause and it is either a reversal warning or a continuation. These are the entry, re-entry or closing position points.
█ Access To Script Add It To Your Chart For Free.
█ For Script Source Code Contact me
Squeeze Momentum [Plus]The "Momentum" in this indicator is smoothed out using linear regression. The Momentum is what is displayed on the indicator as a histogram, its purpose is obvious (to show momentum).
What is a Squeeze? A squeeze occurs when Bollinger Bands tighten up enough to slip inside of Keltner Channels .
This is interpreted as price is compressing and building up energy before releasing it and making a big move.
Traditionally, John Carter's version uses 20 period SMAs as the basis lines on both the BB and the KC.
In this version, I've given the freedom to change this and try out different types of moving averages.
The original squeeze indicator had only one Squeeze setting, though this new one has three.
The gray dot Squeeze, call it a "low squeeze" or an "early squeeze" - this is the easiest Squeeze to form based on its settings.
The orange dot Squeeze is the original from the first Squeeze indicator.
And finally, the yellow dot squeeze, call it a "high squeeze" or "power squeeze" - is the most difficult to form and suggests price is under extreme levels of compression.
Now to explain the parameters:
Squeeze Input - This is just the source for the Squeeze to use, default value is closing price.
Length - This is the length of time used to calculate the Bollinger Bands and Keltner Channels .
Bollinger Bands Calculation Type - Selects the type of moving average used to create the Bollinger Bands .
Keltner Channel Calculation Type - Selects the type of moving average used to create the Keltner Channel.
Color Format - you to choose one of 5 different color schemes.
Draw Divergence - Self explanatory here, this will auto-draw divergence on the indicator.
Gray Background for Dark Mode - to make them more visually appealing.
Added ADX (Average Directional Index) that measure a trend’s strength. The higher the ADX value, the stronger the trend. The ADX line is white when it has a positive slope, otherwise it is gray. When the ADX has a very large dispersion with respect to the momentum histogram, increase the scale number.
Added "H (Hull Moving Average) Signal". Hull is a extremely responsive and smooth moving average created by Alan Hull in 2005. Have option to chose between 3 Hull variations.
Added "Williams Vix Fix" signal. The Vix is one of the most reliable indicators in history for finding market bottoms. The Williams Vix Fix is simply a code from Larry Williams creating almost identical results for creating the same ability the Vix has to all assets.
The VIX has always been much better at signaling bottoms than tops. Simple reason is when market falls retail traders panic and increase volatility, and professionals come in and capitalize on the situation. At market tops there is no one panicking... just liquidity drying up.
The FE green triangles are "Filtered Entries"
The AE green triangles are "Aggressive Filtered Entries"

Genesis Matrix Momentum IndicatorThe Genesis Matrix (GMMI = Genesis Matrix Momentum Indicator) is primarily a momentum indicator that can be very well combined with other indicators to easily detect possible trend changes.
This is a translation/interpretation for TradingView from the original Metatrader 4 code which is Open-Source and was developed by "realjumper". More information here: www.forexfactory.com
The 5-15 Genesis Strategy and Genesis Summary PDF: www.forexfactory.com
EMA is configured as follows:
Length: 5
Source: hlc3
Offset: 2
Create a buy alert:
- Condition: GMMI and "All blue"
- Options: Once Per Bar
Create a sell alert:
- Condition: GMMI and "All red"
- Options: Once Per Bar
Version 3 changes:
- Bug fixes
- Fixed T3 signal (trend reversal instead of closing above/under trend)
- Input variables added (You could play around with periods of CCI and T3 by setting it to 12 for example.)
- Converted to PineScript v4
- Added alarm conditions
Happy Trading 📈😎
Important : We have neither invented this indicator nor added anything in the logic to it. This is just a script translation.
Note1 : TVI (first line) only works on a ticker with provided volume!
Note2 : The original system uses Heikin Ashi candles, but please be aware that this may alter the alertcondition and probably falsify the actual outcome.
Note3 : We do not recommend using a single indicator as a basis for your trading decisions.
To find out more about how to gain access to this indicator, please use the provided information below or just message me.

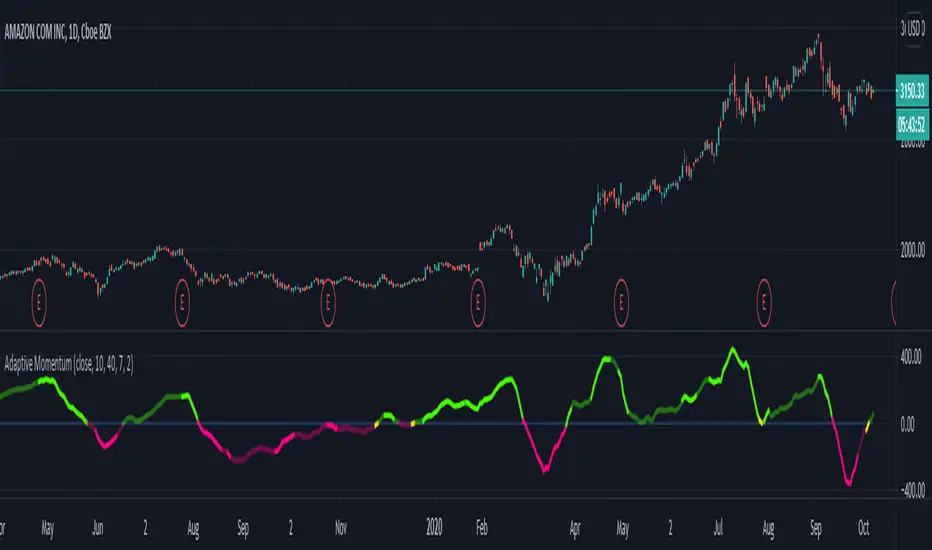
Adaptive MomentumAdaptive momentum indicator that uses the NEW Dynamic Length Arguments! Shows how to use volatility to shorten or lengthen the momentum period.
Based on pinescript blog example but with my own modifications.
Bright Green: Sharp movement above zero line
Bright Red: Sharp movement below zero line
Light Green: Slower movement above zero line
Light Red: Slower movement below zero line.
Yellow: Reversal might occur (near the zero line either side).
Thumb rule: Below zero line - SELL. Above zero line - BUY
VIX MTF MomentumSweet little momentum gadget to track the VIX Index.
What is the VIX?
The CBOE S&P 500 Volatility Index (VIX) is known as the 'Fear Index' which can measure how worried traders are that the S&P 500 might suddenly drop within the next 30 days.
When the VIX starts moving higher, it is telling you that traders are getting nervous. When the VIX starts moving lower, it is telling you that traders are gaining confidence.
VIX calculation?
The Chicago Board of Options Exchange Market Volatility Index (VIX) is a measure of implied volatility (Of the S&P 500 securities options), based on the prices of a basket of S&P 500 Index options with 30 days to expiration.
How to use:
If VIX Momentum is above 0 (RED) traders are getting nervous.
If VIX Momentum is below 0 (GREEN) traders are gaining confidence.
Follow to get updates and new scripts: www.tradingview.com

Volume Weighted MomentumThis momentum indicator uses the vwap.
U can see trend momentum and change and squeeze of momentum which can indicate that a bigger move is in preperation.

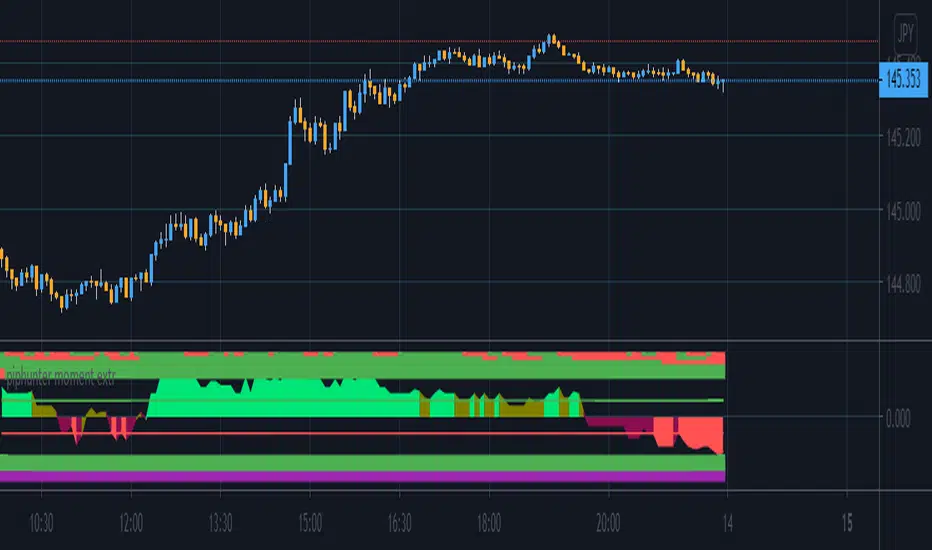
pip hunter momentum extremeThis indicator gives a score to the momentum of a market in a percentage term based on a combination of measurements, this can be used on any time frame, on any instrument to identify if the current trend has enough momentum to see it carry on further this will help eliminate fomo and also help you to identify reversals in the chart at the right time so you can eliminate exposure to a market about to reverse, there is 4 levels to this indicator you have a strong bullish trend denote by green bars the weaker bullish trend denoted by the olive coloured bars, a weak bearish trend which is given in maroon bars and a strong bearish trend which gives red bars you will also note the 2 horizontal boundary lines these are not overbought and oversold bounds like in most indicators but actually indicate whether there is sufficient momentum in the market as the idea is that in strong momentum you want it to be above or below this line to give you confidence there is momentum available to ride.
There are also 7 coloured bars 3 top and 4 on the bottom the 6 green and red ones denote the direction of a heiken ashi candle its attached to reading from top to bottom defaults are 1hr 2hr 4hr 8hr 12hr daily if they are green then the candle is bullish if red the candle is bearish .
The bottom bar is a final momentum confluence when it is white we have a bearish bias and when it is purple we have a bullish bias
if you would like access to this script then please pm me
Swing Trade Pros - Momentum IndicatorThe STP Momentum indicator identifies periods of consolidation in the market and accurately forecasts the direction of the move. It measures the relationship between two studies: Bollinger Bands and Keltner Channels. When the volatility increases, so does the distance between the bands, conversely, when the volatility declines, the distance also decreases. The indicator finds sections of the Bollinger Bands study which fall inside the Keltner Channels. When the market finishes a move, the indicator shows a darker colored bar on the histogram. You can also use it to determine bullish and bearish divergences on momentum plays.

Momentum - Multi Timeframe [WYCKOFF ARSENAL]WYCKOFF ARSENAL is now available on TradingView!
Based on <> (Richard D. Wyckoff)
Noted Indicators:
▪ Optimism Pessimism Index
▪ Force Index
▪ Technometer
▪ Momentum ◄
Main Features:
▪ Multi Timeframe is available
▪ Volume based indicators
▪ Can be used on pairs that have volume data
────────────────────────────
Highlights
> Optimism Pessimism Index or OP
The value of the OP is not important.
The action of the OP is important.
The action of the index must be compared to its previous action or to the price index over the same period of time.
> Technometer or TEC
The purpose of the Technometer is to provide a mathematical indication of the degree to which the market is overbought or oversold.
The value of the Technometer could be as high as 100 or as low as 0.
The other possible values would represent degrees of overbought or oversold.
How to read the Technometer:
| Overbought means vulnerable to a reaction |
100 - completely overbought market.
── 60 - actual overbought extreme.
──── 50 or higher is considered to be clearly over bought.
────── lower than 50 - relatively overbought.
──────── Everything in between clearly overbought and clearly oversold is neutral.
────────── A reading of 44.4 is absolute neutrality.
──────── Everything in between clearly overbought and clearly oversold is neutral.
────── higher than 38 - relatively oversold.
──── 38 or lower is considered to be clearly over sold.
── 28 - actual oversold extreme.
0 - completely oversold market.
| Oversold means vulnerable to a rally |
> Force
The purpose of the Force Index is to provide an indication of the pressure being applied to push the market lower or the pull being applied to the market to pull it higher.
> Momentum
The purpose of the Momentum is to provide a measure of the speculative interest in the market.

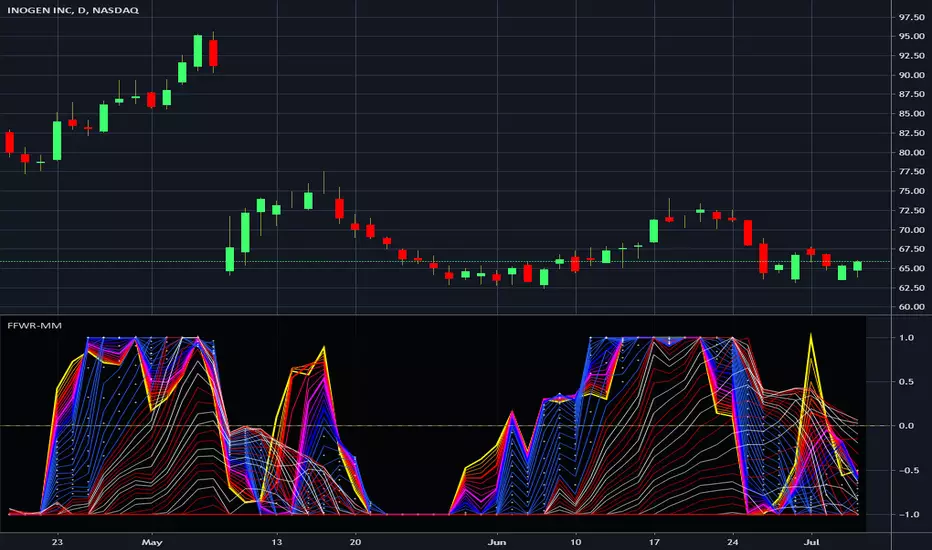
Financial Freedom WaveRipper - Momentum MulticatorIn the Spirit of '76 commemorating this day on July 4th, this is my third indicator released using Pine Script version 4.0, something I contributed to often in a small role, and will continue to do, in my free time. Without revealing my American secret sauce ingenuity excessively, this indicator uses a high performance momentum algorithm that blows most momentum algorithms out the water. It's characteristics display blatantly the swift momentum at which directional high speed wind driven swells create rip tides in an asset. Not being drug out to sea and quickly going "under water" so to speak, is best mitigated by very timely, accurate information. Regarding the use of this script, the bright yellow line has a damping factor of 4 and the longest adjustable damping factor is 66.
My idea initially was... while there is great "one liner indicators" to use, I thought, why not multi-line "multicators" with little to adjust concerning dominant cycle fluctuations in the market. And voila, another radical experiment, turned visually compelling, similar to tumultuous ocean waves and how incredibly fast turning points can wax and wane, yet be anticipated. Living in America, I was once again determined to attain a replica of "Old Glory" in this companion multicator as well. It's embedded artwork makes it an articator too. Which is why I waited to release this sibling appropriately on July 4th too, a day of celebration of freedom, an empowering idea that has reached dessimenation world wide to so many other nations and peoples.
I once again would personally like to thank the talented individuals at TV for providing a platform that embraces an initial free membership, which I first obtained myself, for people like me to freely code in Pine with mathemagical ideas and mental wizardry, creating ultimately, inventions like this eye candy display above.
Features List Includes:
"Source" Selection
Enable/disable dark background for enhanced visibility
Longest period adjustment providing any adjustable period setting
A subtly adjustable multiplier tweak
Minimalized enable/disable adjustment for the theme
This is not a freely available indicator, FYI. To witness my Pine poetry in action, properly negotiated requests for unlimited access, per indicator, may ONLY be obtained by direct contact with me using TV's "Private Chats" or by "Message" in my member name above. The comments section below is solely just for commenting and other remarks, ideas, compliments, etc... If you do have any questions or comments regarding this indicator, I will consider your inquiries, thoughts, and ideas presented below in the comments section, when time provides it. As always, "Like" it if you like it, and also return to my scripts list occasionally for additional postings. Have a profitable future everyone!
Rsi momentum experimentalThis is RSI momentum , I try to make it as experiment so I hope it not bad:)
the up strength is in blue and the down momentum is in red

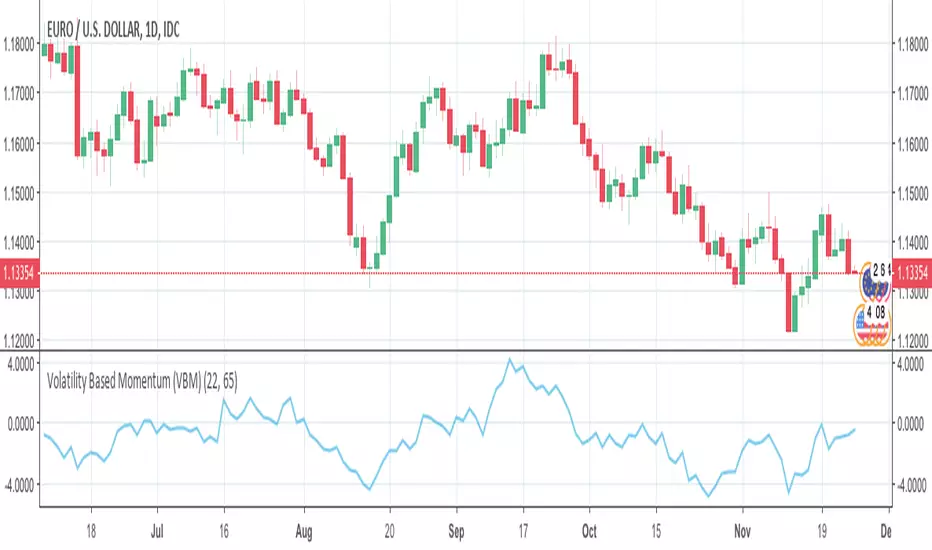
Volatility Based Momentum (VBM)The Volatility Based Momentum (VBM) indicator is a variation on the rate-of-change (ROC) indicator. Instead of expressing momentum in a percentage gain or loss, VBM normalizes momentum using the historical volatility of the underlying security.
The VBM indicator offers numerous benefits to traders who orient their trading around volatility. For these traders, VBM expresses momentum in a normalized, universally applicable ‘multiples of volatility’ (MoV) unit. Given the universal applicability of MoV, VBM is especially suited to traders whose trading incorporates numerous timeframes, different types of securities (e.g., stocks, Forex pairs), or the frequent comparison of momentum between multiple securities.
The calculation for a volatility based momentum (VBM) indicator is very similar to ROC, but divides by the security’s historical volatility instead. The average true range indicator (ATR) is used to compute historical volatility.
VBM(n,v) = (Close - Close n periods ago) / ATR(v periods)
For example, on a daily chart, VBM(22,65) calculates how many MoV price has increased or decreased over the last 22 trading days (approximately one calendar month). The second parameter is the number of periods to use with the ATR indicator to normalize the momentum in terms of volatility.
For more details, there is an article further describing VBM and its applicability versus ROC.
🥢Crypto-Sticks: Momentum 1.0 by Cryptorthyhms🥢 Crypto-Sticks™ Momentum
A new series of indicators brought to you by Cryptorthyhms...giving you an alternate look at your trusted favorites!
🚀 Indicator Specific Info
Momentum can be a tricky indicator sometimes. Since it doesnt go into predictable overbought or oversold zones, it rather just oscillates around zero - making it harder to create a signals strategy. On the default view I tend to look for 2 candle "flat tops" and "flat bottoms" with one or both containing a decent wick.
Heiken Ashi candles adds some more clear entry exit points which can be executed at the second candle going in either direction (applicable only to this chart on 4H - other coins/charts will require their own strategy). For instance, enter on 2nd green, exit on 2nd red.
Volume weighting the HA candles adds a different dimension to the indicator which I have to explore more fully. Please leave me any ideas or feedback you have!
🚫If using HA or VW+HA, the strategy about "flat candles" doesnt apply anymore.
🚀 Crypto-Sticks General Info
💭This series isnt polished 100%, and I have some more options I will add in the future. But for now, I want to just release them, as I am not sure when I will have the time to put more work into them (many other big projects I am working on).
📊Its basically reinterpretations of all your favorite indicators. I calculate the values a little bit differently than normal, but the end result is creating a candlestick chart (for the indicator!). Then I added the option to plot them as Heiken Ashi candles to smooth out noise and make signaling easier. Here's how it looks as Heiken Ashi:
🔊Lastly I implemented a Volume Weighting system for them all which simply integrates volume into the formulas for these indicators. For the most part this feature is experimental and doesn't provide huge utility (yet - I have other ways I want to try it as well - just no time). Though on some of the indicators it already shows great promise. Here is Volume Weighted + Heiken Ashi:
👍Enjoying this indicator or find it useful? Please give me a like and follow! There are many more indicators to be released in this series, not to mention I post crypto analysis and other free indicators regularly.
💬Questions? Comments? Want to get access to an entire suite of proven trading indicators? Come visit us on telegram and chat, or just soak up some knowledge. We make timely posts about the market, news, and strategy everyday. Our community isnt open only to subscribers - everyone is welcome to join.

Momentum Fractal VolatilityThis is another modified macd combined with bollinger bands. The idea is to follow this with the momentum indicator I developed and just like when you look at cycle time frame and higher cycle time frame (Barry Burn), here you can see the higher momentum time frame (fractal energy, Barry Burn).
When the macd line goes above/bellow the bollinger band, it changes the color to green/red for easier identifying possible momentum exhaustion places and times.

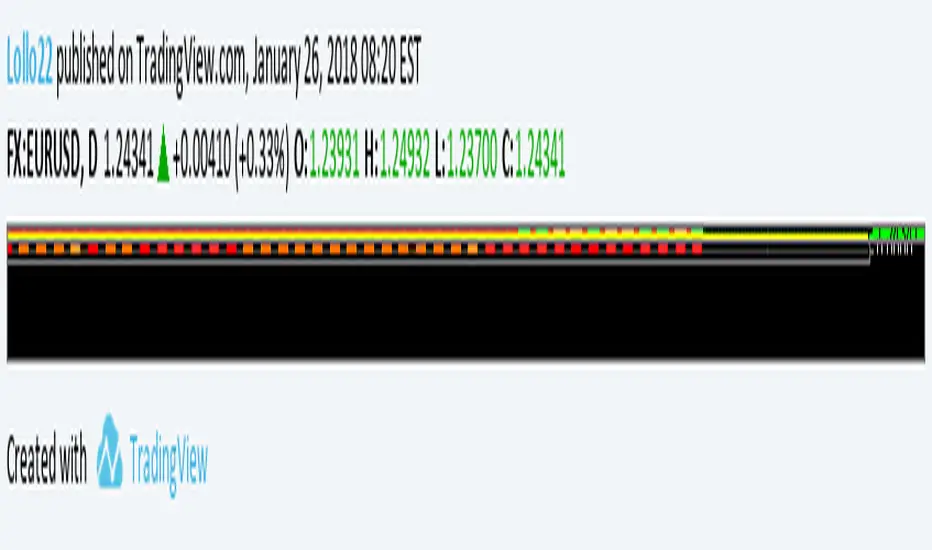
MOMENTUM + strong vs weak momentumThis is a unique custom indicator that shows the real momentum of a currency
With this indicator you can easily trade the strong vs the weak momentum
Each line is a currency pair
aqua= eur
yellow=dollar
purple= pound
green=australian dollar
white=yen
orange=canadian dollar
if the square has one of these colors it means moment UP for this currency
If the square is red it means momentum down for the related currency
The trading signal is at the change of color from previous square against one other currency with opposite color
You can access this indicator for a trial period, just ask for access in comments
Trading is a risky business, i'm not responsible for any profit or loss
rs_Chande's Momentum Oscilator - MMAChande's Momentum Oscilator, with added MA's for momentum strenght.

SuperTrend Momentum OscillatorOverview
The SuperTrend Momentum Oscillator (SMO) is a powerful technical analysis tool designed to identify trend direction and strength in financial markets. It combines short-term and long-term oscillator calculations to provide traders with a comprehensive view of market conditions through an intuitive candle-based visualization system.
Key Features
Dual-period oscillator system (short-term and long-term)
Candle-based visualization showing trend direction and alignment
Color-coded trend direction based on the main (slower) trend line
Candle size reflecting alignment between fast and slow components
High-confidence "Super" signals (green diamonds for buys, purple diamonds for sells)
Market liquidity insights through oscillator readings
Understanding the Candle Visualization
Main Trend vs. Fast Money
The SMO uses two key components that work together:
Main Trend Line (Slower): The longer-period oscillator that acts as the primary trend indicator
Dictates the overall color of the candles (green for uptrend, red for downtrend)
Represents the dominant market direction
Fast Line (Quicker): The shorter-period oscillator that reacts more quickly to price changes
Helps determine the size of candles through its alignment with the main trend
Represents "fast money" or shorter-term price reactions
Candle Components and Their Meaning
1. Candle Color
The color of each candle is determined by the direction of the main trend line:
Green Candles: Main trend line is rising (bullish)
Indicates an overall uptrend regardless of short-term fluctuations
Remains green even when the fast line temporarily moves against the trend
Red Candles: Main trend line is falling (bearish)
Indicates an overall downtrend regardless of short-term fluctuations
Remains red even when the fast line temporarily moves against the trend
2. Candle Body Size
The body size of each candle represents the alignment between fast and main trend lines:
Large Bodies: Both fast and main trend lines are moving in the same direction
Trading Action: Strong confirmation of the trend direction
Confidence Level: High confidence signals
Small Bodies: Fast line is moving against the main trend line
Trading Action: Exercise caution; potential for temporary pullback or consolidation
Confidence Level: Lower confidence in immediate continuation
3. Wick Length
Wicks (shadows) provide additional information about price rejection and volatility:
Long Wicks: Indicate price rejection and potential volatility
Trading Action: Be cautious of trend continuation when long wicks appear
Confidence Level: Reduced confidence in immediate trend continuation
Short Wicks: Indicate strong directional control with minimal rejection
Trading Action: More confidence in trend continuation
Confidence Level: Higher confidence in the current trend direction
Candle Patterns Over Time
The progression of candles provides valuable trend information:
Large Green Candles: Main trend is up and fast line confirms (strong bullish)
Trading Action: Consider entering or adding to long positions
Confidence Level: High confidence in uptrend
Small Green Candles: Main trend is up but fast line is moving down (caution in uptrend)
Trading Action: Hold existing long positions but wait before adding
Confidence Level: Moderate confidence in uptrend, possible short-term pullback
Large Red Candles: Main trend is down and fast line confirms (strong bearish)
Trading Action: Consider entering or adding to short positions
Confidence Level: High confidence in downtrend
Small Red Candles: Main trend is down but fast line is moving up (caution in downtrend)
Trading Action: Hold existing short positions but wait before adding
Confidence Level: Moderate confidence in downtrend, possible short-term bounce
Super Signals - High Confidence Trading Opportunities
The SMO focuses exclusively on high-confidence "Super" signals:
Green Diamond Super Buy Signals
Meaning: Both short-term and long-term oscillators are generating buy signals simultaneously
Visual Indicator: Green diamond markers at the bottom of the indicator (0 level)
Trading Action: Strong entry signal for long positions
Confidence Level: High confidence signal, especially when accompanied by large green candles
Purple Diamond Super Sell Signals
Meaning: Both short-term and long-term oscillators are generating sell signals simultaneously
Visual Indicator: Purple diamond markers at the top of the indicator (100 level)
Trading Action: Strong entry signal for short positions or exit signal for long positions
Confidence Level: High confidence signal, especially when accompanied by large red candles
Market Liquidity Concept
The SMO provides a unique perspective on market conditions that goes beyond traditional oscillator interpretations:
Low Oscillator Readings (Below 20)
When the oscillator shows low readings (below 20), this indicates:
Traditional interpretation: Market is oversold, potential for upward reversal
Liquidity interpretation: Insufficient money in the market
This suggests thin trading conditions where large orders may have outsized impact
Price movements may be more erratic and less predictable
Breakouts may lack follow-through due to insufficient participation
High Oscillator Readings (Above 80)
When the oscillator shows high readings (above 80), this indicates:
Traditional interpretation: Market is overbought, potential for downward reversal
Liquidity interpretation: Abundant money in the market
This suggests deep trading conditions with high participation
Price movements tend to be more orderly and trend-based
Breakouts may have stronger follow-through due to high participation
Trading Strategies with SMO
Strategy 1: Main Trend with Alignment Confirmation
This strategy uses the main trend direction with alignment confirmation:
Entry Criteria:
Main trend direction is established (green or red candles)
Fast line aligns with main trend (large candles)
Super signal confirms (green or purple diamond)
Exit Criteria:
For long positions: When candles turn red or Super Sell signal appears
For short positions: When candles turn green or Super Buy signal appears
Stop Loss Placement:
For long positions: Below recent swing low
For short positions: Above recent swing high
Strategy 2: Counter-Trend Opportunity Detection
This strategy identifies potential counter-trend opportunities:
Entry Criteria:
Small candles appear (indicating disagreement between fast and main trend lines)
Oscillator reaches extreme levels (above 80 or below 20)
Wait for candle color change before entering
Position Sizing:
Use smaller position sizes for counter-trend trades
Increase size only when main trend confirms the new direction
Exit Criteria:
Take profit at the first sign of alignment in the opposite direction
Use tighter stops than with trend-following trades
Strategy 3: Market Liquidity Strategy
This strategy incorporates the market liquidity concept:
For Low Liquidity Conditions (Readings below 20):
Wait for Super Buy signals (green diamond)
Use smaller position sizes
Be prepared for potentially erratic price movements
Look for signs of increasing liquidity (expanding candle bodies) before adding to positions
For High Liquidity Conditions (Readings above 80):
Consider holding positions longer despite "overbought" readings
Use trailing stops to capture extended moves
Be aware that trends may persist longer than expected
Practical Trading Scenarios
Scenario 1: Strong Trend Confirmation
Candle Pattern: Series of large green candles (main trend up, fast line confirms)
Signal: Green diamond Super Buy marker at the bottom (0 level)
Background: Intensifying green gradient
Action: Enter long position with confidence
Stop Loss: Below recent swing low
Take Profit: When candles become small or turn red
Scenario 2: Trend Weakening Detection
Candle Pattern: Green candles becoming smaller (main trend still up, but fast line diverging)
Signal: No new signals
Background: Fading green gradient
Action: Tighten stops on long positions, prepare for potential reversal
Reasoning: Fast money is starting to move against the main trend
Scenario 3: Trend Reversal Identification
Candle Pattern: Transition from small green candles to red candles (main trend changing)
Signal: Appearance of purple diamond Super Sell marker at the top (100 level)
Background: Changing from green to red gradient
Action: Exit long positions and potentially enter short positions
Timing: Most effective when reversal occurs near overbought (80) level

Visual Squeeze MomentumSqueeze Momentum from LazyBear now visible at the chart so you can check when the Squeeze its about to release. All credits for him.

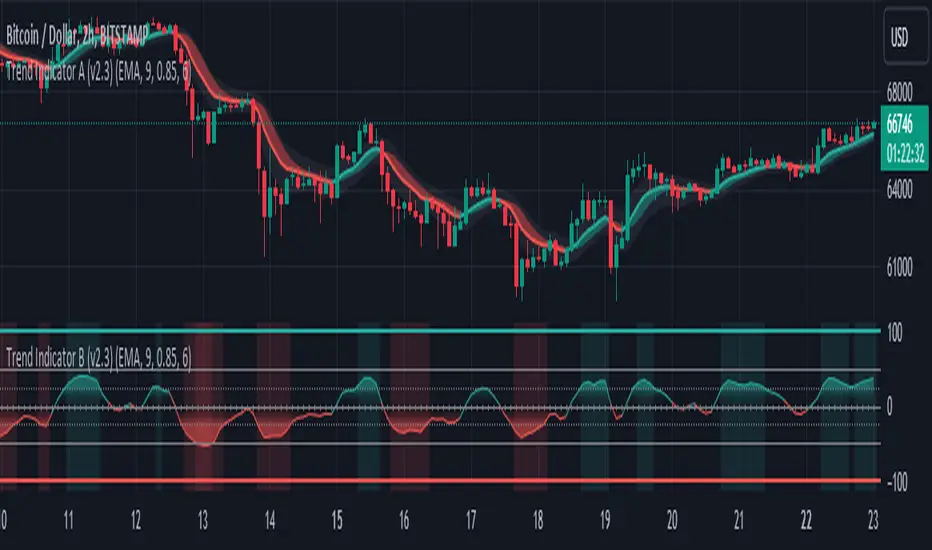
Trend Indicator B-V2 (Momentum measuring)"Trend Indicator A-V2" and "Trend Indicator B-V2" are updated and improved versions of my initial trend indicators. Totally rethinking the code, adding highs and lows in the calculations, including some more customisation through colour schemes.
In practice, this indicator uses EMAs and Heikin Ashi to provide an overall idea of the trend.
The "Trend Indicator A-V2" is an overlay showing “Smoothed Heikin Ashi” .
The "Trend Indicator B-V2" uses the same values in a different way to measure the momentum of the trend and identify potential trend rejections.
Please, take into account that it is a lagging indicator.