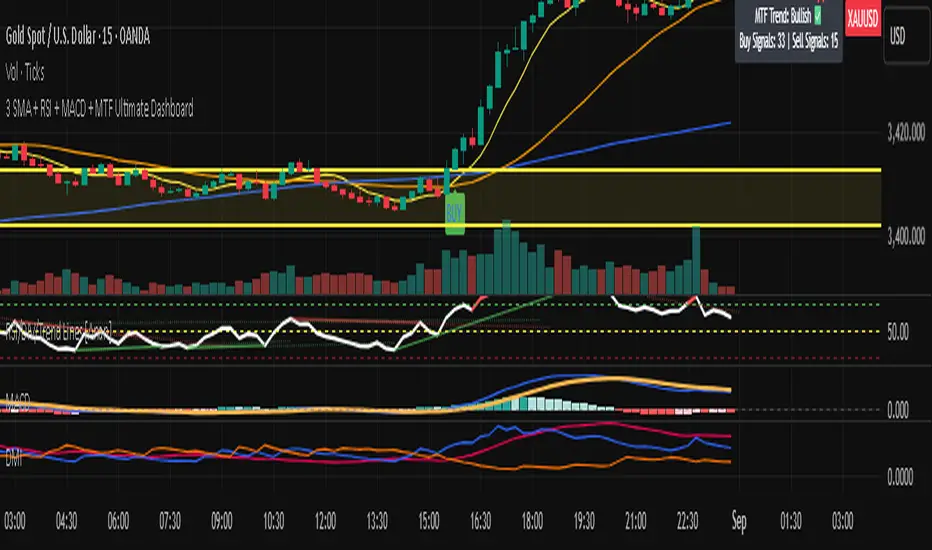
3 SMA + RSI + MACD + MTF Ultimate Dashboard🎯 Overview:
High-precision trading indicator combining trend, momentum, and multi-timeframe confirmation for reliable buy/sell signals in Forex, Crypto, and other markets.
🔹 Core Features:
📈 3 SMAs (7/25/99) – Short, Medium & Long-term trend detection
⚡ RSI Filter – Avoid weak signals (Buy >55 / Sell <45)
💎 MACD with Threshold – Reduce false crossovers
⏱️ Multi-Timeframe Trend (H4) – Confirm overall market direction
✅ Dashboard & Signals:
🟢 Clear Buy & Sell arrows on chart
📊 Live dashboard showing filter status & total signals
🔔 Audio & Push Alerts – Mobile/Desktop/Webhook
💎 Benefits:
⚡ Minimizes false signals
📈 Works on M15, H1, H4, Daily
🎯 Combines trend, momentum, and confirmation filters in one dashboard
⚠️ Note: Signals are generated only after candle close for maximum reliability.
"momentum" için komut dosyalarını ara
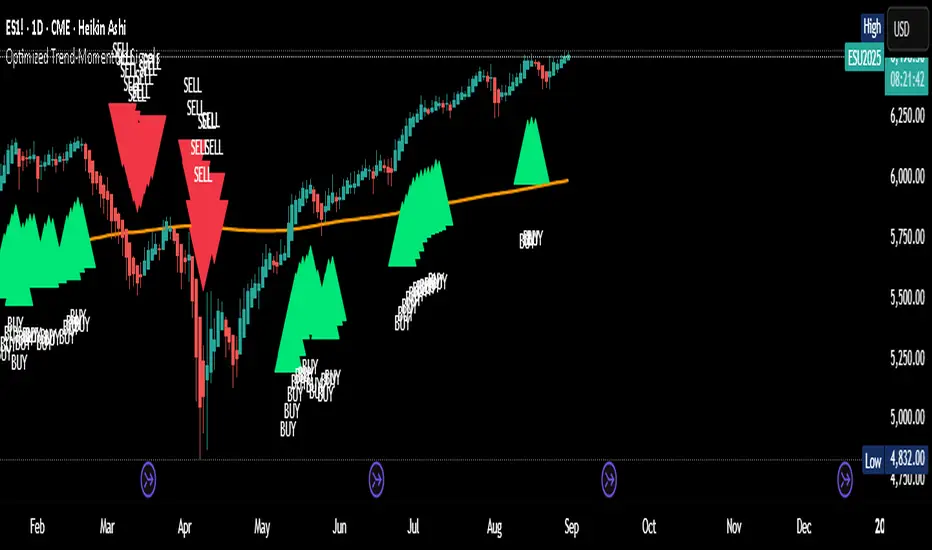
Optimized Trend-Momentum SignalsThis indicator combines trend, momentum, and volume-strength factors into a single buy/sell signal system. It integrates:
SMA 200 → Identifies the long-term trend (price above = bullish bias, below = bearish bias).
MACD (12,26,9) → Confirms momentum direction with line crossovers.
RSI (7) → Filters strength (above 50 = bullish, below 50 = bearish).
ROC (45) → Validates positive or negative rate of change.
Signal Logic:
Buy Signal → Price above SMA 200, MACD bullish, RSI > 50, and ROC > 0.
Sell Signal → Price below SMA 200, MACD bearish, RSI < 50, and ROC < 0.
Features:
Clear arrows for BUY and SELL signals.
Long-term SMA plotted for trend visualization.
Alerts built-in for real-time notifications.
This tool helps traders filter out noise and act only when all major confirmation factors align, reducing false signals and improving decision-making.
MACD Momentum Slowdown Alert (Bullish + Bearish)little arrows showing on chart when MACD histogram has a slowdown (change of color) in momentum

Breakout Volume Momentum [5m]Breakout Volume Momentum Indicator (Pine Script v5)
This TradingView Pine Script v5 indicator plots a green dot below a 5-minute price bar whenever all the breakout and volume conditions are met. It is optimized for live intraday trading (not backtesting) and includes customizable inputs for thresholds and trading session times. Key features and conditions of this indicator:
Gap Up Threshold: Current price is up at least X% (default 20%) from the previous day’s close (uses higher-timeframe daily data) before any signal can trigger.
Relative Volume (RVOL): Current bar’s volume is at least Y× (default 2×) the average volume of the last 20 bars. This ensures unusually high volume is present, indicating strong interest.
Trend Alignment: Price is trading above the VWAP (Volume-Weighted Average Price) and above a fast EMA. In addition, the fast EMA (default 9) is above the slower EMA (default 20) to confirm bullish momentum
tradingview.com
tradingview.com
. These filters ensure the stock is in an intraday uptrend (above the average price and rising EMAs).
Intraday Breakout (optional): Optionally require the price to break above the recent intraday high (default last 30 bars). If enabled, a signal only occurs when the stock exceeds its prior range high, confirming a breakout. This can be toggled on/off in the settings.
Avoid Parabolic Spikes: The script skips any bar with an excessively large range (default >12% from low to high), to avoid triggering on spiky or unsustainable parabolic candles.
Time Window Filter: Signals are restricted to a specific session window (by default 09:30 – 11:00 exchange time, typically the morning session) and will not trigger outside these hours. The session window is adjustable via inputs
stackoverflow.com
.
Alerts: An alert condition is provided so you can set a Trading View alert to send a push notification when a green dot signal fires. The alert message includes the ticker and price at the time of signal.

Multi-Timeframe RSI Momentum StrategyMulti-Timeframe RSI Momentum Strategy
To display two different timeframes of the Relative Strength Index (RSI) on TradingView, you can utilize the "Multi-Timeframe RSI" indicator or a similar custom script. This allows you to visualize the RSI for both your current chart's timeframe and a higher (or lower) timeframe, providing a more comprehensive view of momentum

MACD-V (Volatility-Normalised Momentum) — Spiroglou, 2022Volatility-normalized MACD per Alex Spiroglou (2022):
MACD-V = (EMA12 − EMA26) / ATR26 × 100, so momentum is expressed in ATR units and stays comparable across assets/timeframes.
What you get
• Trend-colored line: green when price ≥ EMA200, red otherwise.
• Guides: ±50 / ±100 / 0; Extremes: ±140 (editable).
• Regime shading: OB ≥ +140 shaded red; OS ≤ −140 shaded green.
• Clean, on-curve markers: small circles on the MACD-V line at the four edge events — OB (enter ≥ +threshold), OBX (cross back down), OS (enter ≤ −threshold), OSX (cross back up).
• Text labels are off by default; optional toggle only for OB/OBX.
• Signal & histogram: EMA(9) of MACD-V and (MACD-V − Signal) columns.
• Alerts: OB/OS entries & exits included.
How to use
• Favor longs when MACD-V > 0 (ideally > +50); respect OB for possible exhaustion.
• Favor shorts when MACD-V < 0 (ideally < −50); respect OS for possible exhaustion.
• Because it’s ATR-normalized, thresholds transfer well across symbols and timeframes.

Clenow Momentum (annualized slope × R²) — v6 (fixed types)Clenow Momentum Indicator calculates the annualised exponential regression slope over a 90 day look back period and multiplies it by the R-squared of that regression

Bullish Divergence SMI Base & Trigger with ATR FilterDescription:
A bullish divergence indicator combining the Stochastic Momentum Index (SMI) and Average True Range (ATR) to pinpoint high-probability entries:
1. Base Arrow (Orange ▲):
• Marks every SMI %K / %D bullish crossover where %K < –70 (deep oversold)—the first half of the divergence setup.
• Each new qualifying crossover replaces the previous base, continuously “arming” the divergence signal.
• Configurable SMI lookbacks, oversold threshold, and a base timeout (default 100 days) to clear stale bases.
2. Trigger Arrow (Green ▲):
• Completes the bullish divergence: fires on the next SMI bullish crossover where %K > –60 and price has dropped below the base arrow’s close by at least N × ATR (default 1 × 14-day ATR).
• A dashed green line links the base and trigger to visually confirm the divergence.
• Resets after triggering, ready for a new divergence cycle.
Inputs:
• SMI %K Length, EMA Smoothing, %D Length
• Oversold Base Level (–70), Trigger Level (–60)
• ATR Length (14), ATR Multiplier (1.0)
• Base Timeout (100 days)
Ideal for any market, this study highlights genuine bullish divergences—oversold momentum crossovers that coincide with significant price reactions—before entering long trades.

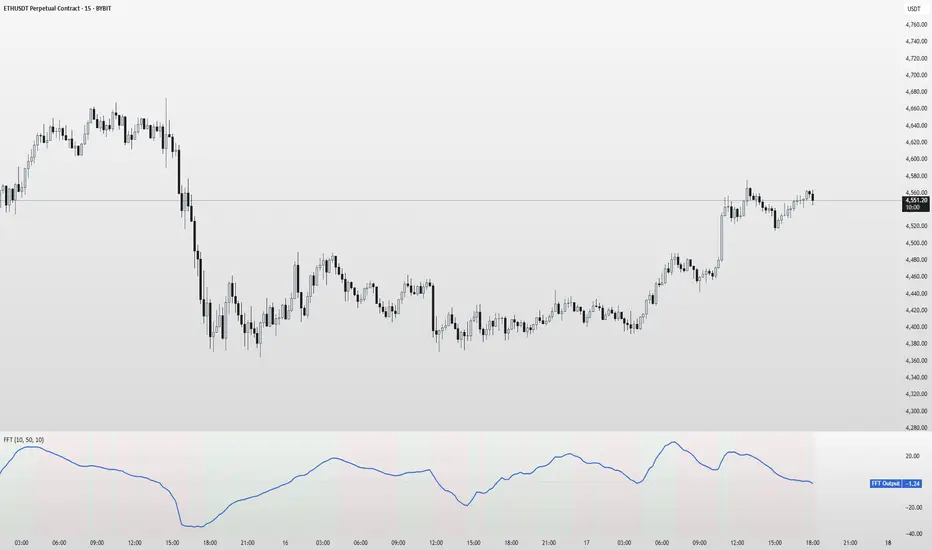
FFT Signal AnalyzerFFT Signal Analyzer
The FFT Signal Analyzer uses a simplified Fast Fourier Transform (FFT) approach to extract dominant cyclical components from price data. By detrending and applying adaptive smoothing, the indicator highlights frequency-driven signals that traditional indicators often miss.
This tool is ideal for traders who want to visualize cyclical market behavior, identify turning points, and confirm entries/exits with frequency-based momentum signals.
How it works:
Removes price trend via detrending (moving average subtraction)
Applies a bandpass filter (EMA) to isolate dominant frequency components
Normalizes the signal using a z-score for consistent visibility
Amplifies the signal for easy interpretation
Highlights slope changes with background coloring (green = rising, red = falling)
Use Cases:
Use zero-line crosses to detect cycle shifts or momentum pivots
Combine with trend filters (e.g., GRJMOM) for high-probability setups
Ideal for detecting underlying rhythm in sideways or oscillating markets
Best for:
Swing traders, scalpers, and cycle analysts looking for frequency-aware confirmation signals
Works on all timeframes and asset classes
RSI-CCI Momentum ScreenerRSI-CCI Momentum Screener;
How to Use:
Apply this script to 1H or 4H timeframe
Works well for NSE stocks, crypto, or forex
Look for a green label “BUY” that shows when the screener conditions are met

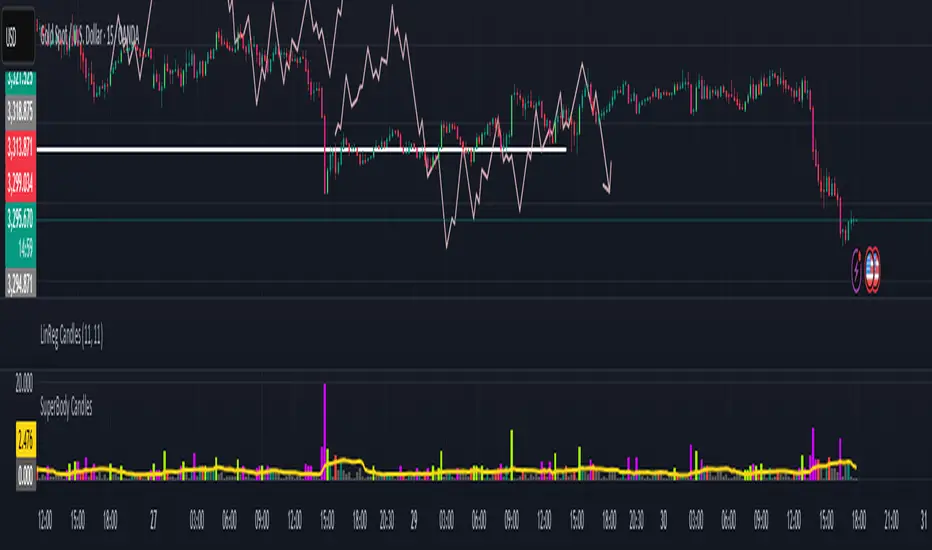
SuperBody CandlesInspired by the original script by Gautam_Dixit.
Updated to the latest Pine Script v6, now featuring fully customizable color settings so users can tailor hues to their preference.
Description:
The Momentum Candle indicator highlights bars whose real body significantly exceeds the 15-period average. 'Super' bullish and bearish candles (body ≥ 1.5× avg) receive standout colors, while above-average and below-average bars are tinted differently to reflect momentum strength.
Market DashboardMarket Dashboard — All-in-One Technical Indicator Panel
The Market Dashboard is a powerful visual tool that consolidates key technical indicators into a single on-chart table, helping traders make faster and more informed decisions. This script includes:
RSI — Detects overbought and oversold market conditions
MACD — Shows trend momentum and crossover signals
CVD (Cumulative Volume Delta) — Highlights buyer vs. seller pressure
Volume Analysis — Flags unusually high volume
ATR (Average True Range) — Displays current market volatility
Session Detector — Automatically identifies ASIAN, LONDON, or NEW YORK sessions based on UTC time
Fully Customizable — Adjust table position and text size to fit your chart layout
Designed for traders who want a clean, real-time snapshot of market dynamics, directly on the chart.

Pivot Squeeze IndicatorThe Pivot Squeeze Indicator is an oscillator that identifies when markets are "squeezed" between recent pivot highs and lows, then signals when they're ready to make their next big move.
How it Works
The indicator calculates the percentage distance between the current price and the most recent pivot high vs. pivot low. When this distance gets compressed (small), the market is "squeezed" and building energy. When it expands rapidly, you get your breakout signal.
The indicator adapts to current market volatility using four different modes:
- ATR-Based
- Bollinger Bands
- Keltner Channels
- Fixed %
What to Look For
🟠 Orange Background = Squeeze Zone
Market is compressed between recent pivots
Low volatility, building pressure
🟢 Green Breakout = Bullish Signal
Price breaking out above recent highs
Momentum shifting upward
Time to look for long opportunities
🔴 Red Breakout = Bearish Signal
Price breaking down below recent lows
Momentum shifting downward
Time to look for short opportunities
Using Histogram Colors:
Green bars = Bullish territory (closer to recent highs)
Red bars = Bearish territory (closer to recent lows)
Orange bars = Squeeze conditions (compressed between pivots)
Using MA Line:
When Histogram bars cross below or above MA Line in opposite direction, it might be good time to exit.
Default Settings: ATR-based thresholds with 14-period lookback - works great out of the box, but feel free to experiment with the different threshold modes to find what works best for your trading style! Recommended to use with other indicators to confirm signals

RSI with 2-Pole FilterA momentum indicator that tells you if a stock is overbought or oversold.
RSI goes between 0 and 100.
70 = overbought (might fall)
<30 = oversold (might rise)
It often looks jagged or choppy on volatile days.
Think of this filter like a momentum smoother:
It still follows RSI closely,
But it doesn’t react to every little jiggle in price,
Which helps avoid false signals.
it keeps track of:
The current RSI,
The last 2 RSI values (inputs), and
The last 2 outputs (filtered RSIs).
It uses feedback to shape the output based on previous values, making it smoother than a simple moving average.

MACD Breakout SuperCandlesMACD Breakout SuperCandles
The MACD Breakout SuperCandles indicator is a candle-coloring tool that monitors trend alignment across multiple timeframes using a combination of MACD behavior and simple price structure. It visually reflects market sentiment directly on price candles, helping traders quickly recognize shifting momentum conditions.
How It Works
The script evaluates trend behavior based on:
- Multi-timeframe MACD Analysis: Uses MACD values and signal line relationships to gauge trend direction and strength.
- Price Relative to SMA Zones: Analyzes whether price is positioned above or below the 20-period high and low SMAs on each timeframe.
For each timeframe, the script assigns one of five possible trend statuses:
- SUPERBULL: Strong bullish MACD signal with price above both SMAs.
- Bullish: Bullish MACD crossover with price showing upward bias.
- Basing: MACD flattening or neutralizing near zero with no directional dominance.
- Bearish: Bearish MACD signal without confirmation of stronger trend.
- SUPERBEAR: Strong bearish MACD signal with price below both SMAs.
-Ghost Candles: Candles with basing attributes that can signal directional change or trend strength.
Signal Scoring System
The script compares conditions across four timeframes:
- TF1 (Short)
- TF2 (Medium)
- TF3 (Long)
- MACD at a fixed 10-minute resolution
Each status type is tracked independently. A colored candle is only applied when a status type (e.g., SUPERBULL) reaches the minimum match threshold, defined by the "Min Status Matches for Candle Color" setting. If no status meets the required threshold, the candle is displayed in a neutral "Ghost" color.
Customizable Visuals
The indicator offers full control over candle appearance via grouped settings:
Body Colors
- SUPERBULL Body
- Bullish Body
- Basing Body
- Bearish Body
- SUPERBEAR Body
- Ghost Candle Body (used when no match)
Border & Wick Colors
- SUPERBULL Border/Wick
- Bullish Border/Wick
- Basing Border/Wick
- Bearish Border/Wick
- SUPERBEAR Border/Wick
- Ghost Border/Wick
Colors are grouped by function and can be adjusted independently to match your chart theme or personal preferences.
Settings Overview
- TF1, TF2, TF3: Select short, medium, and long timeframes to monitor trend structure.
- Min Status Matches: Set how many timeframes must agree before a candle status is applied.
- MACD Settings: Customize MACD fast, slow, and signal lengths, and choose MA type (EMA, SMA, WMA).
This tool helps visualize how aligned various timeframe conditions are by embedding sentiment into the candles themselves. It can assist with trend identification, momentum confirmation, or visual filtering for discretionary strategies.

CDP - Counter-Directional-Pivot🎯 CDP - Counter-Directional-Pivot
📊 Overview
The Counter-Directional-Pivot (CDP) indicator calculates five critical price levels based on the previous day's OHLC data, specifically designed for multi-timeframe analysis. Unlike standard pivot points, CDP levels are calculated using a unique formula that identifies potential reversal zones where price action often changes direction.
⚡ What Makes This Script Original
This implementation solves several technical challenges that existing pivot indicators face:
🔄 Multi-Timeframe Consistency: Values remain identical across all timeframes (1m, 5m, 1h, daily) - a common problem with many pivot implementations
🔒 Intraday Stability: Uses advanced value-locking technology to prevent the "stepping" effect that occurs when pivot lines shift during the trading session
💪 Robust Data Handling: Optimized for both liquid and illiquid stocks with enhanced data synchronization
🧮 CDP Calculation Formula
The indicator calculates five key levels using the previous day's High (H), Low (L), and Close (C):
CDP = (H + L + C) ÷ 3 (Central Decision Point)
AH = 2×CDP + H – 2×L (Anchor High - Strong Resistance)
NH = 2×CDP – L (Near High - Moderate Resistance)
AL = 2×CDP – 2×H + L (Anchor Low - Strong Support)
NL = 2×CDP – H (Near Low - Moderate Support)
✨ Key Features
🎨 Visual Elements
📈 Five Distinct Price Levels: Each with customizable colors and line styles
🏷️ Smart Label System: Shows exact price values for each level
📋 Optional Value Table: Displays all levels in an organized table format
🎯 Clean Chart Display: Minimal visual clutter while maximizing information
⚙️ Technical Advantages
🔐 Session-Locked Values: Prices are locked at market open, preventing intraday shifts
🔄 Multi-Timeframe Sync: Perfect consistency between daily and intraday charts
✅ Data Validation: Built-in checks ensure reliable calculations
🚀 Performance Optimized: Efficient code structure for fast loading
💼 Trading Applications
🔄 Reversal Zones: AH and AL often act as strong turning points
💥 Breakout Confirmation: Price movement beyond these levels signals trend continuation
🛡️ Risk Management: Use levels for stop-loss and take-profit placement
🏗️ Market Structure: Understand daily ranges and potential price targets
📚 How to Use
🚀 Basic Setup
Add the indicator to your chart (works on any timeframe)
Customize colors for easy identification of support/resistance zones
Enable the value table for quick reference of exact price levels
📈 Trading Strategy Examples
🟢 Long Bias: Look for bounces at NL or AL levels
🔴 Short Bias: Watch for rejections at NH or AH levels
💥 Breakout Trading: Enter positions when price decisively breaks through anchor levels
↔️ Range Trading: Use CDP as the central reference point for range-bound markets
🎯 Advanced Strategy Combinations
RSI Integration for Enhanced Signals: 📊
📉 Oversold Bounces: Combine RSI below 30 with price touching AL/NL levels for high-probability long entries
📈 Overbought Rejections: Look for RSI above 70 with price rejecting AH/NH levels for short opportunities
🔍 Divergence Confirmation: When RSI shows bullish divergence at support levels (AL/NL) or bearish divergence at resistance levels (AH/NH), it often signals stronger reversal potential
⚡ Momentum Confluence: RSI crossing 50 while price breaks through CDP can confirm trend direction changes
⚙️ Configuration Options
🎨 Line Customization: Adjust width, style (solid/dashed/dotted), and colors
👁️ Display Preferences: Toggle individual levels, labels, and value table
📍 Table Position: Place the value table anywhere on your chart
🔔 Alert System: Get notifications when price crosses key levels
🔧 Technical Implementation Details
🎯 Data Reliability
The script uses request.security() with lookahead settings to ensure historical accuracy while maintaining real-time functionality. The value-locking mechanism prevents the common issue where pivot levels shift during the trading day.
🔄 Multi-Timeframe Logic
⏰ Intraday Charts: Display previous day's calculated levels as stable horizontal lines
📅 Daily Charts: Show current day's levels based on yesterday's OHLC
🔍 Consistency Check: All timeframes reference the same source data
🤔 Why CDP vs Standard Pivots?
Counter-Directional Pivots often provide more accurate reversal points than traditional pivot calculations because they incorporate the relationship between high/low ranges and closing prices more effectively. The formula creates levels that better reflect market psychology and institutional trading behaviors.
💡 Best Practices
💧 Use on liquid markets for most reliable results
📊 RSI Combination: Add RSI indicator for overbought/oversold confirmation and divergence analysis
📊 Combine with volume analysis for confirmation
🔍 Consider multiple timeframe analysis (daily levels on hourly charts)
📝 Test thoroughly in paper trading before live implementation
💪 Example Market Applications
NASDAQ:AAPL AAPL - Tech stock breakouts through AH levels
$NYSE:SPY SPY - Index trading with CDP range analysis
NASDAQ:TSLA TSLA - Volatile stock reversals at AL/NL levels
⚠️ This indicator is designed for educational and analytical purposes. Always combine with proper risk management and additional technical analysis tools.

Kaufman Trend Strategy# ✅ Kaufman Trend Strategy – Full Description (Script Publishing Version)
**Kaufman Trend Strategy** is a dynamic trend-following strategy based on Kaufman Filter theory.
It detects real-time trend momentum, reduces noise, and aims to enhance entry accuracy while optimizing risk.
⚠️ _For educational and research purposes only. Past performance does not guarantee future results._
---
## 🎯 Strategy Objective
- Smooth price noise using Kaufman Filter smoothing
- Detect the strength and direction of trends with a normalized oscillator
- Manage profits using multi-stage take-profits and adaptive ATR stop-loss logic
---
## ✨ Key Features
- **Kaufman Filter Trend Detection**
Extracts directional signal using a state space model.
- **Multi-Stage Profit-Taking**
Automatically takes partial profits based on color changes and zero-cross events.
- **ATR-Based Volatility Stops**
Stops adjust based on swing highs/lows and current market volatility.
---
## 📊 Entry & Exit Logic
**Long Entry**
- `trend_strength ≥ 60`
- Green trend signal
- Price above the Kaufman average
**Short Entry**
- `trend_strength ≤ -60`
- Red trend signal
- Price below the Kaufman average
**Exit (Long/Short)**
- Blue trend color → TP1 (50%)
- Oscillator crosses 0 → TP2 (25%)
- Trend weakens → Final exit (25%)
- ATR + swing-based stop loss
---
## 💰 Risk Management
- Initial capital: `$3,000`
- Order size: `$100` per trade (realistic, low-risk sizing)
- Commission: `0.002%`
- Slippage: `2 ticks`
- Pyramiding: `1` max position
- Estimated risk/trade: `~0.1–0.5%` of equity
> ⚠️ _No trade risks more than 5% of equity. This strategy follows TradingView script publishing rules._
---
## ⚙️ Default Parameters
- **1st Take Profit**: 50%
- **2nd Take Profit**: 25%
- **Final Exit**: 25%
- **ATR Period**: 14
- **Swing Lookback**: 10
- **Entry Threshold**: ±60
- **Exit Threshold**: ±40
---
## 📅 Backtest Summary
- **Symbol**: USD/JPY
- **Timeframe**: 1H
- **Date Range**: Jan 3, 2022 – Jun 4, 2025
- **Trades**: 924
- **Win Rate**: 41.67%
- **Profit Factor**: 1.108
- **Net Profit**: +$1,659.29 (+54.56%)
- **Max Drawdown**: -$1,419.73 (-31.87%)
---
## ✅ Summary
This strategy uses Kaufman filtering to detect market direction with reduced lag and increased smoothness.
It’s built with visual clarity and strong trade management, making it practical for both beginners and advanced users.
---
## 📌 Disclaimer
This script is for educational and informational purposes only and should not be considered financial advice.
Use with proper risk controls and always test in a demo environment before live trading.

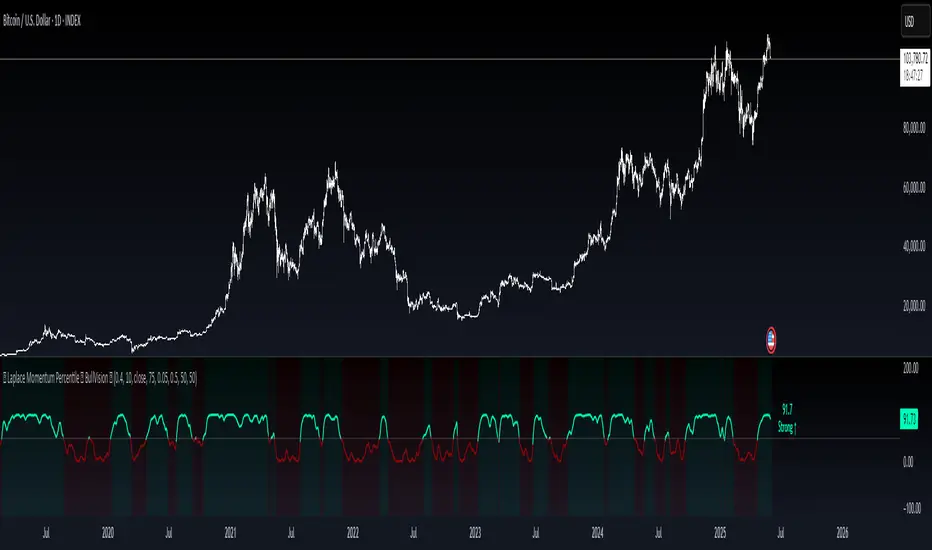
Laplace Momentum Percentile ║ BullVision 🔬 Overview
Laplace Momentum Percentile ║ BullVision is a custom-built trend analysis tool that applies Laplace-inspired smoothing to price action and maps the result to a historical percentile scale. This provides a contextual view of trend intensity, with optional signal refinement using a Kalman filter.
This indicator is designed for traders and analysts seeking a normalized, scale-independent perspective on market behavior. It does not attempt to predict price but instead helps interpret the relative strength or weakness of recent movements.
⚙️ Key Concepts
📉 Laplace-Based Smoothing
The core signal is built using a Laplace-style weighted average, applying an exponential decay to price values over a specified length. This emphasizes recent movements while still accounting for historical context.
🎯 Percentile Mapping
Rather than displaying the raw output, the filtered signal is converted into a percentile rank based on its position within a historical lookback window. This helps normalize interpretation across different assets and timeframes.
🧠 Optional Kalman Filter
For users seeking additional smoothing, a Kalman filter is included. This statistical method updates signal estimates dynamically, helping reduce short-term fluctuations without introducing significant lag.
🔧 User Settings
🔁 Transform Parameters
Transform Parameter (s): Controls the decay rate for Laplace weighting.
Calculation Length: Sets how many candles are used for smoothing.
📊 Percentile Settings
Lookback Period: Defines how far back to calculate the historical percentile ranking.
🧠 Kalman Filter Controls
Enable Kalman Filter: Optional toggle.
Process Noise / Measurement Noise: Adjust the filter’s responsiveness and tolerance to volatility.
🎨 Visual Settings
Show Raw Signal: Optionally display the pre-smoothed percentile value.
Thresholds: Customize upper and lower trend zone boundaries.
📈 Visual Output
Main Line: Smoothed percentile rank, color-coded based on strength.
Raw Line (Optional): The unsmoothed percentile value for comparison.
Trend Zones: Background shading highlights strong upward or downward regimes.
Live Label: Displays current percentile value and trend classification.
🧩 Trend Classification Logic
The indicator segments percentile values into five zones:
Above 80: Strong upward trend
50–80: Mild upward trend
20–50: Neutral zone
0–20: Mild downward trend
Below 0: Strong downward trend
🔍 Use Cases
This tool is intended as a visual and contextual aid for identifying trend regimes, assessing historical momentum strength, or supporting broader confluence-based analysis. It can be used in combination with other tools or frameworks at the discretion of the trader.
⚠️ Important Notes
This script does not provide buy or sell signals.
It is intended for educational and analytical purposes only.
It should be used as part of a broader decision-making process.
Past signal behavior should not be interpreted as indicative of future results.
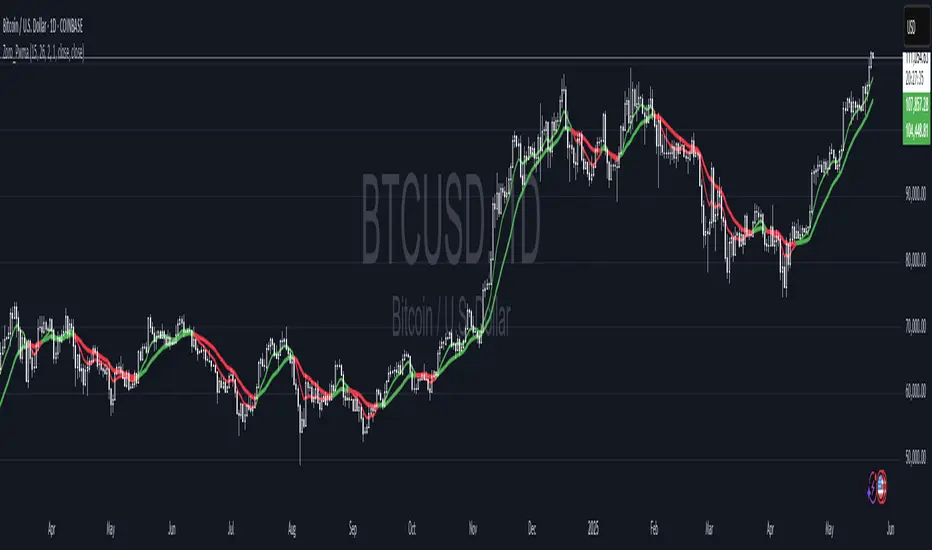
Dual Pwma Trends [ZORO_47]Key Features:
Dual PWMA System: Combines a fast and slow Parabolic Weighted Moving Average to identify momentum shifts and trend changes with precision.
Dynamic Color Coding: The indicator lines change color to reflect market conditions—green for bullish crossovers (potential buy signals) and red for bearish crossunders (potential sell signals), making it easy to interpret at a glance.
Customizable Parameters: Adjust the fast and slow PWMA lengths, power settings, and source data to tailor the indicator to your trading style and timeframe.
Clean Visualization: Plotted with bold, clear lines (3px width) for optimal visibility on any chart, ensuring you never miss a signal.
How It Works:
The indicator calculates two PWMAs using the imported ZOROLIBRARY by ZORO_47. When the fast PWMA crosses above the slow PWMA, both lines turn green, signaling a potential bullish trend. Conversely, when the fast PWMA crosses below the slow PWMA, the lines turn red, indicating a potential bearish trend. The color persists until the next crossover or crossunder, providing a seamless visual cue for trend direction.
Ideal For:
Trend Traders: Identify trend reversals and continuations with clear crossover signals.
Swing Traders: Use on higher timeframes to capture significant price moves.
Day Traders: Fine-tune settings for faster signals on intraday charts.
Settings:
Fast Length/Power: Control the sensitivity of the fast PWMA (default: 12/2).
Slow Length/Power: Adjust the smoother, slower PWMA (default: 21/1).
Source: Choose your preferred data input (default: close price).
Buy/Sell Ei - Premium Edition (Fixed Momentum)**📈 Buy/Sell Ei Indicator - Smart Trading System with Price Pattern Detection 📉**
**🔍 What is it?**
The **Buy/Sell Ei** indicator is a professional tool designed to identify **buy and sell signals** based on a combination of **candlestick patterns** and **moving averages**. With high accuracy, it pinpoints optimal entry and exit points in **both bullish and bearish trends**, making it suitable for forex pairs, stocks, and cryptocurrencies.
---
### **🌟 Key Features:**
✅ **Advanced Candlestick Pattern Detection**
✅ **Momentum Filter (Customizable consecutive candle count)**
✅ **Live Trade Mode (Instant signals for active trading)**
✅ **Dual MA Support (Fast & Slow MA with multiple types: SMA, EMA, WMA, VWMA)**
✅ **Date Filter (Focus on specific trading periods)**
✅ **Win/Loss Tracking (Performance analytics with success rate)**
---
### **🚀 Why Choose Buy/Sell Ei?**
✔ **Precision:** Reduces false signals with strict pattern rules.
✔ **Flexibility:** Works in both live trading and backtesting modes.
✔ **User-Friendly:** Clear labels and alerts for easy decision-making.
✔ **Adaptive:** Compatible with all timeframes (M1 to Monthly).
---
### **🛠 How It Works:**
1. **Trend Confirmation:** Uses MAs to filter trades in the trend’s direction.
2. **Pattern Recognition:** Detects "Ready to Buy/Sell" and confirmed signals.
3. **Momentum Check:** Optional filter for consecutive bullish/bearish candles.
4. **Live Alerts:** Labels appear instantly in Live Trade Mode.
---
### **📊 Ideal For:**
- **Day Traders** (Scalping & Intraday)
- **Swing Traders** (Medium-term setups)
- **Technical Analysts** (Backtesting strategies)
**🔧 Designed by Sahar Chadri | Optimized for TradingView**
**🎯 Trade Smarter, Not Harder!**

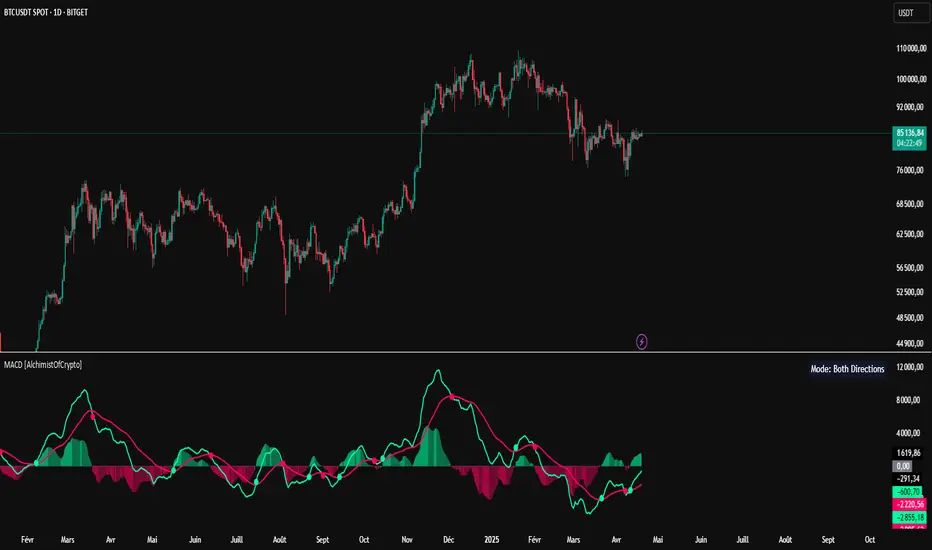
MACD [AlchimistOfCrypto]🌠 MACD Optimized with Python – Decoding the Chaos of Markets 🌠
Category: Trend Analysis 📈
"Like the dynamic systems studied in chaos theory, financial markets appear unpredictable at first glance. Yet, as Edward Lorenz demonstrated, even in apparent chaos reside harmonious mathematical structures. The MACD (Moving Average Convergence Divergence) represents this quest for order within disorder—a mathematical formulation that extracts coherent signals from price noise. By combining moving averages of different periods, this indicator reveals hidden cycles and precise moments when market energy shifts, like a pendulum obeying the immutable laws of physics."
📊 Technical Overview
The MACD Optimized with Python is a revolutionary take on the classic Moving Average Convergence Divergence indicator. Powered by Python-driven optimizations 🐍, it adapts to specific timeframes, delivering razor-sharp signals for traders seeking to navigate the market’s chaos with precision.
⚙️ How It Works
- Python-Optimized Parameters 🔧: Unlike the standard MACD (12,26,9), our version uses mathematically tailored parameters for each timeframe:
- 1H: 11/38/27
- 4H: 9/98/27
- 1D: 45/90/29
- 1W: 9/16/3
- 2W: 5/20/5
- Intuitive Visuals 🎨:
- Crossovers marked by colored dots 🟢🔴 for clear entry/exit signals.
- Histogram with a color gradient 🌈 to show direction and momentum intensity.
- Customizable Signals 🎯: Choose to display long, short, or both signals to match your trading style.
🚀 How to Use This Indicator
1. Select Your Timeframe ⏰: Choose the timeframe aligned with your trading horizon (1H, 4H, 1D, 1W, or 2W).
2. Spot Crossovers 🔍: Watch for the MACD line (green) crossing the signal line (red) to identify potential trend changes.
3. Confirm with Divergence ✅: Combine crossovers with price-MACD divergence for high-probability trend reversal signals.
📅 Release Notes
Unlock the hidden order of markets with this Python-optimized MACD. Stay tuned for future enhancements! ✨
🏷️ Tags
#Trading #TechnicalAnalysis #MACD #TrendAnalysis #Python #MultiTimeframe #Divergence #Momentum #TradingStrategy #RiskManagement #Forex #Stocks #Crypto #ChaosTheory #OptimizedTrading
Highest High Line with Multi-Timeframe Supertrend and RSIOverview:
This powerful indicator combines three essential elements for traders:
Highest High Line – Tracks the highest price over a customizable lookback period across different timeframes.
Multi-Timeframe Supertrend – Displays Supertrend values and trend directions for multiple timeframes simultaneously.
Relative Strength Index (RSI) – Shows RSI values across different timeframes for momentum analysis.
Features:
✅ Customizable Highest High Line:
Selectable timeframes: Daily, Weekly, Monthly, Quarterly, Yearly
Adjustable lookback period
✅ Multi-Timeframe Supertrend:
Supports 1min, 5min, 10min, 15min, 30min, 1H, Daily, Weekly, Monthly, Quarterly, Yearly
ATR-based calculation with configurable ATR period and multiplier
Identifies bullish (green) & bearish (red) trends
✅ Multi-Timeframe RSI:
Calculates RSI for the same timeframes as Supertrend
Overbought (≥70) and Oversold (≤30) signals with color coding
✅ Comprehensive Table Display:
A clean, structured table in the bottom-right corner
Displays Supertrend direction, value, and RSI for all timeframes
Helps traders quickly assess trend and momentum alignment
How to Use:
Use the Highest High Line to identify key resistance zones.
Confirm trend direction with Multi-Timeframe Supertrend.
Check RSI values to avoid overbought/oversold conditions before entering trades.
Align multiple timeframes for stronger confirmation of trend shifts.
Ideal For:
✅ Scalpers (lower timeframes: 1m–30m)
✅ Swing Traders (higher timeframes: 1H–D)
✅ Position Traders (Weekly, Monthly, Quarterly)
💡 Tip: Look for Supertrend & RSI confluence across multiple timeframes for higher probability setups.
