MACD_base_and_reference_TF//====================================================================================================================
The "MACD_with_reference" indicator aims to illustrate the MACD (Moving Average Convergence Divergence) on two distinct timeframes: the base timeframe (typically the chart's timeframe, e.g., 1D) and the reference timeframe (defaulted to 1W). This tool provides a means to determine momentum shifts within the stock, potentially guiding traders in adjusting or trimming positions.
// ================================================== INFO ==================================================
Key Features of the Indicator:
- Dual Timeframe MACD: Displays MACD on both the primary (base) and higher (reference) timeframes - transparent.
- Momentum Analysis: indication of MACD crossdown of the signal line on the refenence TF to indicate momentum loss on the higher timeframe, guiding decisions to manage positions.
- MACD Line Status: Beneath the chart, a red/green bar line signifies the MACD line's position relative to the signal line on the higher timeframe.
- Alert Creation: Allows for alerts on the MACD and signal line crossdown on the higher timeframe, aiding in planning stop-loss settings for owned stocks.
// ================================================== NOTES ==================================================
The "MACD_with_reference" indicator finds optimal usage in several scenarios:
- Chart Analysis: Replacing the MACD indicator during chart reviews.
- Alert Setup: Setting alerts for owned stocks to plan ahead for stop-loss placements or position closures.
// ================================================== TODO ==================================================
//#endregion ========================================================================================================
// Continue the script code...
"momentum" için komut dosyalarını ara
Variety Step RSI w/ Dynamic Zones [Loxx]Variety Step RSI w/ Dynamic Zones is a stepped RSI calculation with Discontinued Signal Lines. This indicator includes 7 types of RSI to choose from. The addition of the Discontinued Signal Lines allows this indicator to better identify momentum shifts in price so traders have better defined long/short signals.
Enhanced Moving Average Calculation with Stepped Moving Average and the Advantages over Regular RSI
Technical analysis plays a crucial role in understanding and predicting market trends. One popular indicator used by traders and analysts is the Relative Strength Index (RSI). However, an enhanced approach called Stepped Moving Average, in combination with the Slow RSI function, offers several advantages over regular RSI calculations.
█ Stepped Moving Average and Moving Averages:
The Stepped Moving Average function serves as a crucial component in the calculation of moving averages. Moving averages smooth out price data over a specific period to identify trends and potential trading signals. By employing the Stepped Moving Average function, traders can enhance the accuracy of moving averages and make more informed decisions.
Stepped Moving Average takes two parameters:
The current RSI value and a size parameter. It computes the next step in the moving average calculation by determining the upper and lower bounds of the moving average range. It accomplishes this by adjusting the values of smax and smin based on the given RSI and size.
Furthermore, Stepped Moving Average introduces the concept of a trend variable. By comparing the previous trend value with the current RSI and the previous upper and lower bounds, it updates the trend accordingly. This feature enables traders to identify potential shifts in market sentiment and make timely adjustments to their trading strategies.
█ Advantages over Regular RSI:
Enhanced Range Boundaries:
The inclusion of size parameters in Stepped Moving Average allows for more precise determination of the upper and lower bounds of the moving average range. This feature provides traders with a clearer understanding of the potential price levels that can influence market behavior. Consequently, it aids in setting more effective entry and exit points for trades.
Improved Trend Identification:
The trend variable in Stepped Moving Average helps traders identify changes in market trends more accurately. By considering the previous trend value and comparing it to the current RSI and previous bounds, Stepped Moving Average captures trend reversals with greater precision. This capability empowers traders to respond swiftly to market shifts and potentially capture more profitable trading opportunities.
Smoother Moving Averages:
Stepped Moving Average's ability to adjust the moving average range bounds based on trend changes and size parameters results in smoother moving averages. Regular RSI calculations may produce jagged or erratic results due to abrupt market movements. Stepped Moving Average mitigates this issue by dynamically adapting the range boundaries, thereby providing traders with more reliable and consistent moving average signals.
Complementary Functionality with Slow RSI:
Stepped Moving Average and Slow RSI function in harmony to provide a comprehensive trading analysis toolkit. While Stepped Moving Average refines the moving average calculation process, Slow RSI offers a more accurate representation of market strength. The combination of these two functions facilitates a deeper understanding of market dynamics and assists traders in making better-informed decisions.
What is a Discontinued Signal Line (DSL)?
Many indicators employ signal lines to more easily identify trends or desired states of the indicator. The concept of a signal line is straightforward: by comparing a value to its smoothed, slightly lagging state, one can determine the current momentum or state.
The Discontinued Signal Line builds on this fundamental idea by extending it: rather than having a single signal line, multiple lines are used based on the indicator's current value.
The "signal" line is calculated as follows:
When a specific level is crossed in the desired direction, the EMA of that value is calculated for the intended signal line.
When that level is crossed in the opposite direction, the previous "signal" line value is "inherited," becoming a sort of level.
This approach combines signal lines and levels, aiming to integrate the advantages of both methods.
In essence, DSL enhances the signal line concept by inheriting the previous signal line's value and converting it into a level.
Extras
-Alerts
-Signals
Related indicators:
Step RSI

RSI Momentum Trend ScreenerIntroducing The RSI Momentum Trend Screener, to have the ability to scan 40 symbols at once
The screener is based on RSI Momentum Trend Indicator
It will show Positive Or Negative based on the symbol condition.
You can change the values on the screener, symbols, activate/disable symbols and change table position and color

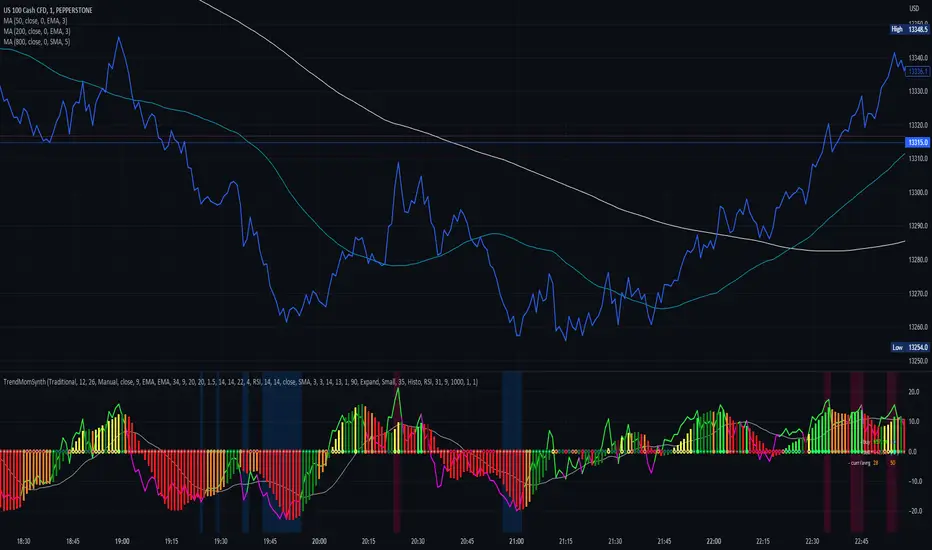
Trend Momentum SynthesizerBy analyzing the MACD (Moving Average Convergence Divergence) and Squeeze Momentum indicators, this indicator helps identify potential bullish, bearish, or undecided market conditions.
The algorithm within considers the positions of the MACD and Squeeze Momentum indicators to determine the overall market sentiment. When the indicators align and indicate a bullish market condition, the indicator's plot color will be either dark green, green, yellow, or lime, indicating a potential bullish trend. Conversely, if the indicators align and indicate a bearish market condition, the plot color will be maroon or red, denoting a potential bearish trend. When the indicators are inconclusive, the plot color will be orange, suggesting an undecided market.
The ADX is an addon component of this indicator, helping to assess the strength of a trend. By analyzing the ADX, the indicator determines whether a trend is strong enough, providing additional confirmation for potential trade signals. The ADX smoothing and DI (Directional Index) length parameters can be customized to suit individual trading preferences.
By combining these indicators, the algorithm provides traders with a comprehensive view of the market, helping them make informed trading decisions. It aims to assist traders in identifying potential market opportunities and aligns with the objective of maximizing trading performance.
How to use the indicator:
Note: I used back-testing for fine tuning do not base your trades on signals from the testing framework.
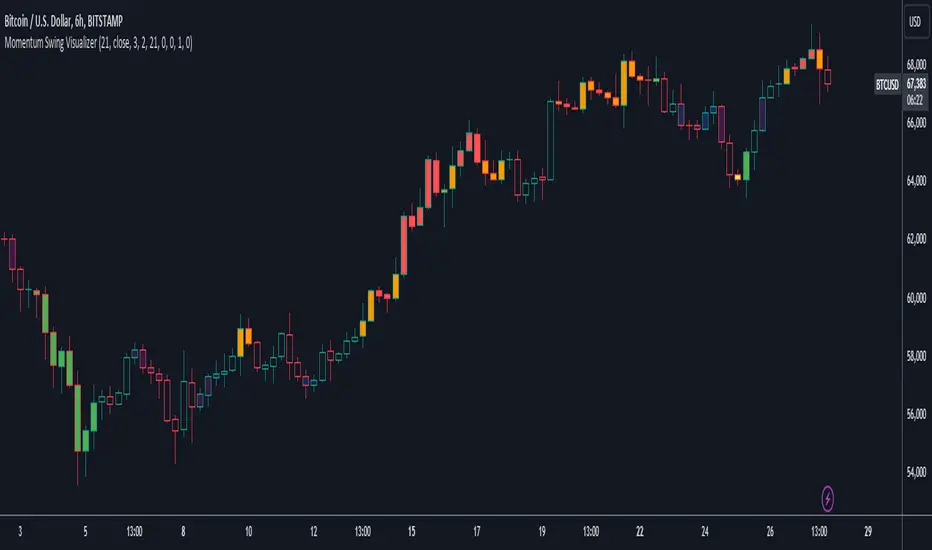
User Defined Momentum Change with Swing VisualsThis script is a groundbreaking, math-centric technical analysis tool that blends two well-established indicators, the Stochastic Oscillator and the Exponential Moving Average (EMA), to deliver a unique and visually engaging way of identifying momentum swings and stochastic indicators. Unlike mashups, this script is tailored to accommodate a wide range of trading strategies, providing traders with a distinctive perspective on market trends.
The innovation in this script lies in its mathematically-driven ability to effectively combine the Stochastic Oscillator and EMA, setting it apart from other available tools that simply offer a rehash of old ideas or slight modifications to popular indicators. The EMA is employed instead of a Simple Moving Average (SMA), enhancing the uniqueness of the calculations. This novel approach creates a new dimension for traders to evaluate potential momentum swings and visualize them on the chart, proving it to be more than just a mere mashup of existing indicators.
Central to the script's utility is its extensive customization options, which allow traders to adjust various inputs to suit their preferences and trading strategies. Users can modify the EMA length, swing range signal offsets, and smoothing factors for both the fast and slow components of the Stochastic Oscillator. Additionally, the script offers the ability to personalize the color thresholds, transparency, and line properties for the Stochastic Oscillator and swing range signal.
This script's visually dynamic representation of momentum swings empowers traders to make more informed trading decisions, particularly on the 6-hour timeframe. The swing range signal, represented by vertical lines on the chart, acts as a valuable visual aid for identifying potential entry or exit points. Furthermore, the Stochastic Oscillator provides insights into the strength and direction of momentum, which is beneficial for confirming potential trade signals.
To conclude, this script is not just another combination of MAs or a slightly modified version of a popular indicator. Instead, it offers traders a comprehensive, visually appealing, and customizable tool for technical analysis, which is both original and useful. By uniquely combining the EMA and the Stochastic Oscillator with a strong mathematical foundation, and allowing traders to adjust a variety of settings, this script adds value to the TradingView community and enhances the body of knowledge available for traders. It is designed to support traders in tailoring their analysis based on their own strategies and preferences, enabling them to make well-informed decisions in the financial markets.
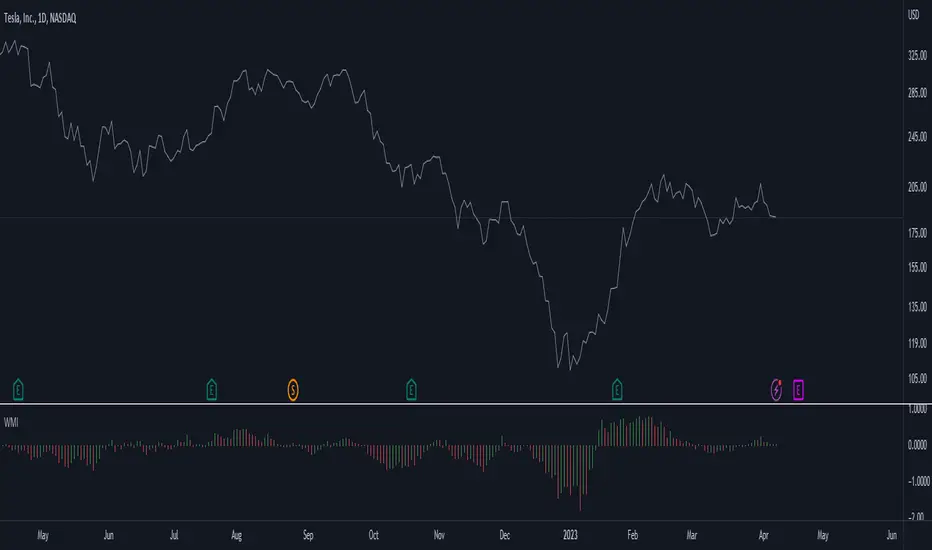
Weighted Momentum and Volatility Indicator (WMI)The Weighted Momentum and Volatility Indicator (WMI) is a composite technical analysis tool that combines momentum and volatility to identify potential trend changes in the underlying asset.
The WMI is displayed as an histogram that oscillates around a zero line, with increasing bars indicating a bullish trend and decreasing bars indicating a bearish trend.
The WMI is calculated by combining the Rate of Change (ROC) and Average True Range (ATR) indicators.
The ROC measures the percentage change in price over a set period of time, while the ATR measures the volatility of the asset over the same period.
The WMI is calculated by multiplying the normalized values of the ROC and ATR indicators, with the normalization process being used to adjust the values to a scale between 0 and 1.
Traders and investors can use the WMI to identify potential trend changes in the underlying asset, with increasing bars indicating a bullish trend and decreasing bars indicating a bearish trend.
The WMI can be used in conjunction with other technical analysis tools to develop a comprehensive trading strategy.
Do not hesitate to let me know your comments if you see any improvements to be made :)
Stochastic Momentum Index (SMI) Refurbished▮Introduction
Stochastic Momentum Index (SMI) Indicator is a technical indicator used in technical analysis of stocks and other financial instruments.
It was developed by William Blau in 1993 and is considered to be a momentum indicator that can help identify trend reversal points.
Basically, it's a combination of the True Strength Index with a signal line to help identify turning points in the market.
SMI uses the stochastic formula to compare the current closing price of an asset with the maximum and minimum price range over a specific period.
He then compares this ratio to a short-term moving average to create an indicator that oscillates between -100 and +100.
When the SMI is above 0, it is considered positive, indicating that the current price is above the short-term moving average.
When it is below 0, it is considered negative, indicating that the current price is below the short-term moving average.
Traders use the SMI to identify potential trend reversal points.
When the indicator reaches an extreme level above +40 or below -40, a trend reversal is possible.
Furthermore, traders also watch for divergences between the SMI and the asset price to identify potential trading opportunities.
It is important to remember that the SMI is a technical indicator and as such should be used in conjunction with other technical analysis tools to get a complete picture of the market situation.
▮ Improvements
The following features were added:
1. 7 color themes, for TSI, Signal and Histogram.
2. Possibility to customize moving average type for TSI/Signal.
3. Dynamic Zones.
4. Crossing Alerts.
5. Alert points on specific ranges.
5. Coloring of bars according to TSI/Signal/Histogram.
▮ Themes
Examples:
▮ About Dynamic Zones
'Most indicators use a fixed zone for buy and sell signals.
Here's a concept based on zones that are responsive to the past levels of the indicator.'
The concept of Dynamic Zones was described by Leo Zamansky ( Ph .D.) and David Stendahl, in the magazine of Stocks & Commodities V15:7 (306-310).
Basically, a statistical calculation is made to define the extreme levels, delimiting a possible overbought/oversold region.
Given user-defined probabilities, the percentile is calculated using the method of Nearest Rank.
It is calculated by taking the difference between the data point and the number of data points below it, then dividing by the total number of data points in the set.
The result is expressed as a percentage.
This provides a measure of how a particular value compares to other values in a data set, identifying outliers or values that are significantly higher or lower than the rest of the data.
▮ What to look for
1. Divergences/weakening of a trend/reversal:
2. Supports, resistances, pullbacks:
3. Overbought/Oversold Points:
▮ Thanks and Credits
- TradingView and PineCoders: for SMI and Moving Averages
- allanster: for Dynamic Zones

Simple Dominance Momentum IndicatorThe Simple Dominance Momentum Indicator is a powerful tool for tracking market trends in the world of cryptocurrency. By analyzing the relationship between dominance and market movement, this indicator helps traders identify when money is flowing into or out of the market.
Using the pane structure on TradingView, the Dominance Momentum Indicator makes it easy to visualize and track data from CryptoCap charts. Whether you're a seasoned investor or starting out, this indicator can help you make more informed trading decisions.
All this indicator does is create the pane with a line chart using the Dominance charts to allow you to see the data with one button instead of doing it all manually. However with the addition to allow it to toggle between crypto and stables, so if you are using a /BTC pair, you don't have to add a new pane on, it automatically converts. If you are looking at USDT pairs for example, it will highlight that one for you.
While it can work under any conditions, the Dominance Momentum Indicator is particularly effective on higher timeframes, providing valuable insight into the overall plot of the market trend. With a 55EMA and a faster-moving average of 21EMA, this indicator is designed to help you stay ahead of the curve and make smarter trading decisions.
Remember the golden rule for stablecoin dominance. Down = good, and up = bad; however, you can just invert the indicator, so it flows with the market.
When it comes to the dominance of individual cryptocurrencies, for example, DOT.D, you might find that it going up = increasing dominance is STRENGTH. If the dominance of that is increasing it means it's growing.
Creator Credit: Jamie Goodland

Deemer Breakaway Momentum ThrustBreakaway momentum is a "breadth thrust" coined by Walter Deemer in the 1970s that occurs when the ten-day total advances on the NYSE are greater than 1.97 times the ten-day total NYSE declines.
This indicator calculates the ratio and plots it as a histogram. The 1.97 threshold is also plotted as a horizontal line. Anytime the histogram gets above the line Breakaway Momentum has occurred.
This is a rare signal that has only happened 25 times since 1945.

Quantum CDV HistogramThis script is an addition to Fixed Quantum Cdv.
It shows vector cdv ratio in columns.
You can select the length as an input to how many bars to look back for the whole calculation.
The green bars represent the bullish values and the red bars the bearish values.
The green line represents an ema of the bullish value and the red line the ema of the bearish value.
The momentum ema (in purple) represent the cdv ratio (bullish - bearish).
When the momentum ema is at 100% or more it’s a good sell opportunity and when the momentum ema is at or under 100% it’s a good buy opportunity. It is not financial advise. Make sure to make your own analysis. This script help to make entries, but do not enter positions only based on this signal.
In the inputs you can select the emas that you want to display on your histogram.
The original script is the Cumulative Delta Volume by LonesomeTheBlue.

DMI Stochastic Momentum IndexConcepts
This is an improved version of the "DMI Stochastic Extreme Refurbished" indicator.
For more information on the main concepts of this indicator, please access this link:
The difference is that here, instead of using the traditional stochastic oscillator, I implemented the use of the Stochastic Momentum Index (SMI).
Stochastic Momentum Index (SMI)
The SMI is considered a refinement of the stochastic oscillator.
It calculates the distance of the current closing price as it relates to the median of the high/low range of price.
William Blau developed the SMI, which attempts to provide a more reliable indicator, less subject to false swings.
The original stochastic is limited to values from 0 to 100, while the SMI varies between the range of -100 to 100.
(Investopedia)
It is worth mentioning that the SMI presented in this script applies to the DMI value, not the screen price.

RSI Momentum Acceleration by TartigradiaPlots the momentum acceleration oscillators from price and RSI, rescaled and with areas above/below highlighted.
Usage: in a nutshell, when the background is yellow, it's bearish (RSI decelerates faster than price), whereas when the background is green, it's bullish (RSI accelerates faster than price). It appears to detect early some reversals that are otherwise difficult to detect.
Note: it supports using any other indicator's output as the second source input, instead of RSI. PineScript does not allow for more than one source to receive input from other indicators, all the others must only use price as an input.
This indicator uses the core routine to calculate Momentum Acceleration Oscillators by DGT:
This indicator is based on the idea of stinkbug : "RSI is a good momentum indicator showing how excited ppl are on a move, this is why divergences on it work so well. I would like to see the change accelerating or slowing on a move up or down.."

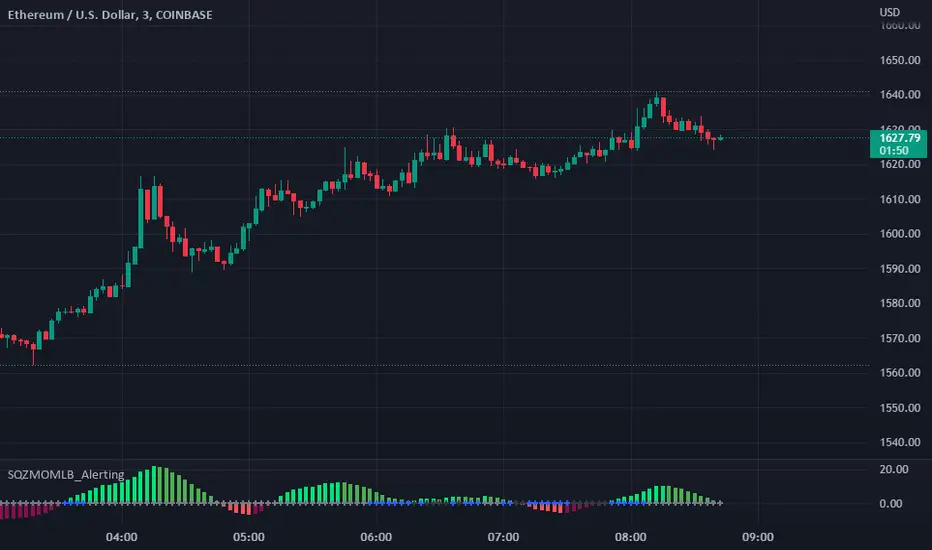
Squeeze Momentum Indicator [LazyBear] added Alerting + webhookA modified version of Squeeze Momentum Indicator visualizing on Price Chart.
author: @LazyBear, modified by @KivancOzbilgic, and by @dgtrd
I took in all of the information as the script below is based on the V2 Script that @LazyBear posted and then added Alerting based on the math and the conditions that @dgtrd added.
Per the description here:
The Squeeze Indicator measures the relationship between Bollinger Bands and Keltner's Channels to help identify consolidations and signal when prices are likely to break out (whether up or down).
The Squeeze Indicator finds sections of the Bollinger Bands which fall inside the Keltner's Channels, and in this case, the market is said to be in a squeeze (indicator turns off, displayed with grey diamond shapes in this study).
When the volatility increases, so does the distance between the bands. Conversely, when the volatility declines, the distance also decreases, and in such cases, the squeeze is said to be released (indicator turns on, displayed with triangle up or triangle down shapes)
Taking the above information and what was in the script was able to base the alert conditions:
So when the condition:
Squeeze On or No Squeeze = In Squeeze
Squeeze Off = Squeeze Release Long or Squeeze Release Long based off conditions.
There are 2 separate alert Types.
1. App, Pop-up, eMail, play sound and Send email to SMS
2. It Is dedicated to Webhook for your various applications.
Alerting Options
i.imgur.com
App Notification
i.imgur.com
i.imgur.com
Webhook test into Discord
i.imgur.com
[blackcat] L1 Vitali Apirine Compare Price Momentum OscillatorLevel 1
Background
Traders’ Tips of August 2020, the focus is Vitali Apirine’s article in the August issue, “The Compare Price Momentum Oscillator (CPMO)”.
Function
In his article in this issue, “The Compare Price Momentum Oscillator (CPMO),” author Vitali Apirine reintroduces us to the DecisionPoint PMO originally developed by Carl Swenlin and presents a new way to use it to compare the relative momentum of two different securities. Trading signals can be derived in a number of ways including momentum, signal line, and zero-line crossovers.
Remarks
This is a Level 1 free and open source indicator.
Feedbacks are appreciated.

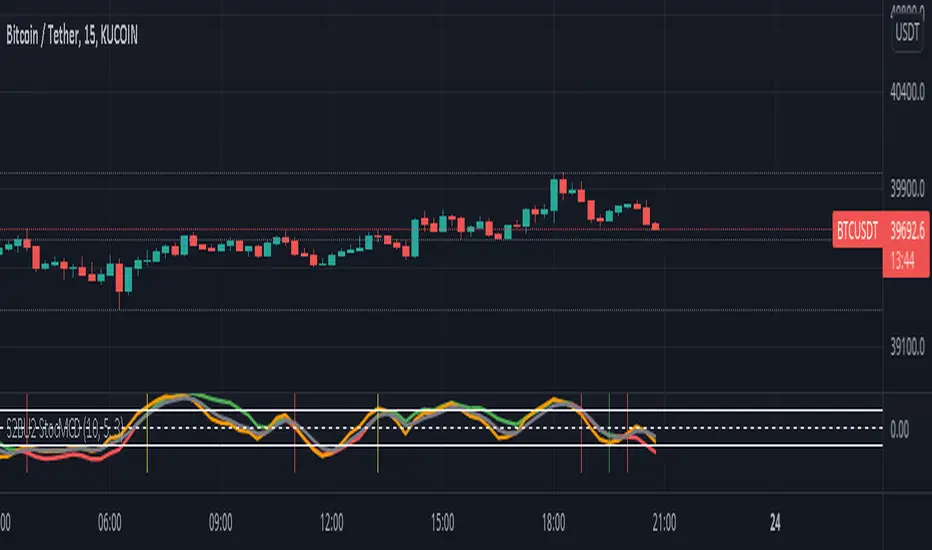
S2BU2 Stochastic Momentum Convergence DivergenceFair Use:
Please do not take my work and sell it under your own name. This was created to benefit everyone - not one person. Feel free however to use it as part of whatever work you wish to sell (of course i would applaud also giving ideas away for free - your choice though ;)
What it is:
This is a twist on the stochastic momentum indicator . It combines the classic stochastic momentum with a slow moving trendline to improve the warning signal for the end of a trend
How it works:
The classic Stochastic Momentum indicates an uptrend when the smi crosses above the signalline and conversely a downtrend when it crosses below.
The improved indicator also shows trend sustainability by displaying a vertical line when the trendline and signal line cross each other. Trendline above signalline indicates a sustained uptrend, trendline below signalline indicates a sustained downtrend.
How to use:
Note this is only a recommendation and not advice. Feel free to experiment and adjust the indicator to fit your tradingstyle. This is only my personal setup. Feel free to share your findings.
Set Alerts for crossovers between smi and signal on 1h and 4h. Also set alerts for crossovers between trend and signal on 4h.
(again, no advice - think for yourself!)
If smi and signal crossdown -> short
If smi and signal crossup -> long
If trend and signal crossdown between top and middle line-> major short
If trend and signal crossup between bottom and middle line -> major long
If trend and signal cross anywhere else -> get out and wait for a new signal
You could also stay in a trend for as long as the trendline does not crossover on the 4h. This works well for major trends and indicates very well the end it.
The end of a major trend is not necessarily the start of a major uptrend - there can and probably will be a consolidation phase.
This does not work well in a choppy market, do not keep a trade going until trend crossover if the market is choppy - you will mostly close with losses!
//chart
Squeeze M + ADX + TTM (Trading Latino & John Carter) by [Rolgui]About this indicator:
This indicator aims to combine two good performing strategies, which can be used separately or together, mainly for investment positions, although it can also be used for intraday trading.
Strategy 1) Squeeze Oscillator and Average Directional Index:
This strategy is taught by Jaime Aibsai, which determines market entries based on reading the direction of the price movement (Directionality of the Oscillator) along with the strength of the Oscillator (Slope of the ADX).
Both tools are configured according to Jaime Abisai's strategy, by default (note that point 23 of the ADX is represented by point 0 on the panel, to make reading easier, its interpretation is not affected). Anyway you can adjust the input data according to your interest.
*You can see this setting in the first panel.
Strategy 2) Squeeze Momentum and Trade The Market Waves:
This strategy can be consulted either in John F. Carter's books or on his website.
This market reading is based on Price Volatility (Bollinger Bands and Keltner Channels interaction) and its Trend (Exponential Moving Averages), showing entries at times when price volatility is low and taking filtering active trend using T.T.M. Waves.
To configure the indicator in the same way that Carter does, it would be enough to turn off the ADX, turn on the Squeeze Momentum signals along with the T.T.M. Waves, and importantly, change the Linear Momentum value to 12 (this configuration can be found in his book).
*You can see this setting in the second panel.
Why this indicator?
I've added and removed the above flags as I needed to query them (which became tedious for me). The main objective of having merged them into one is to make their reading more agile and comfortable and thus improve the decision-making capacity of the trader who wishes to use them.
Credits and Acknowledgments:
I would like to give credits to other authors, for the sections of code that I have used to make this technical indicator. Thanks to @LazyBear, @matetaronna, @jombie and @joren for contributing to the community and keeping their code open. It is priceless!
Feel free to combine and practice your trading with both strategies, personally, they improved my profitability and this is why I recommend researching more about them. I've been using it for crypto investing, let me know if it's worth for you on stock market!
If you have any questions or suggestions you can leave it in the comments!
Greetings!

Measure Volume, Momentum, Trend, VolatilityThis script displays the following indicators in one pane to quickly determine several important factors regarding price action. It allows the user to quickly see all of most important factors surrounding price action in one pane with one quick glance. This should be incredibly helpful and allow things like double divergence and trend confirmation to be spotted much more quickly. I personally use the data in this indicator to replace four separate indicators and it has brought my win rate and profit factor significantly higher. I hadn't seen any place where all of the best J. Welles Wilder indicators such as RSI, Parabolic SAR, and DMI/ADX were brought into one easy to use interface. This is my attempt at fixing that gap. For a much deeper understanding of how to use these indicators, I recommend reading New Concepts in Technical Trading Systems written by J. Welles Wilder.
Momentum via RSI (Relative Strength Index)
Volume via MFI (Money Flow Index)
Volatility via DMI/ADX (Direction Movement Index/Average Directional Index)
Trend via Parabolic SAR (Parabolic Stop and Reverse)
It is worth noting that DMI/ADX and Parabolic SAR can both help determine trend strength and volatility.
The Volatility mechanism is measured by DMI and ADX and displayed at the top of the pane using circles. The top, tiny circles reflect if show if positive DI or negative DI has a higher value. The small circles directly underneath indicate whether or not the ADX is above 20 (configurable, some may choose to increase this to 25 or even 30).
The Momentum mechanism is shown as standard RSI with the default being a white line and default period of 14, which is all configurable.
The Volume mechanism is shown as standard MFI with the default being a fuchsia line and default period of 14, which is also configurable.
The momentum and volume oscillators should be used in conjunction to help spot whether the trend is strong or weak using divergences and the middle, overbought, and oversold levels. These levels are also configurable.
The Trend mechanism is measured by Parabolic SAR and displayed at the bottom of the pane using diamonds. The default is red diamonds when in a bear trend, green when in an uptrend which is configurable. When price is above the Parabolic SAR, it is considered to be an uptrend. When price is below the Parabolic SAR, it is considered to be a downtrend. The way price is measured is also configurable (i.e. open, close, ohlc4, hlc3, etc.). When price crossed above or below the Parabolic SAR, the diamonds will change colors.
All the indicators displayed should be used in a well rounded strategy. For instance, I only trade when ADX is above 20 and rarely trade against the trend shown via PSAR. When trend shifts and divergences helped indicate a trend shift would occur using the RSI and MFI, it can be a great spot to take an entry. RSI/MFI can also confirm the trend is strong when they are not showing divergences and inline with price action. All of this data should be used in conjunction with good fundamental data and technical levels. Divergences with RSI and MFI on double tops or bottoms can also be incredibly powerful. There is no right or wrong way to use all the data displayed in this indicator, however using all four pillars of trading (Momentum, Volume, Trend, Volatility) will help ensure only the best trades are taken.

Honey CypherHoney Cypher Aims to do 4 things
Momentum
Trend Strength
Overbought and oversold zones
Being the most beautiful indicator you ever see
Momentum
The big yellow honey waves primary use is to see the momentum of the market, they can be used in a similar way you would use a MACD or Chaikin Money Flow
On this image you see the honey waves being plotted to the 30 minute timeframe while on the 5 minute chart to have an understanding of longer time momentum in the chart.
Trend Strength
Most tools of the indicator can be used for that but the yellow and purple slope strength lines are made specificaly for this. When you see them curl down you know trend is strengthening towards the downside.
The candle color is based on the amount of Honey waves sloping in one direction. This might be the best tool in the indicator to find Trend Strength. Bright yellow candles mean strong bears while the bright blue candles mean strong bulls.
Overbought and oversold zones
By analysing the waves on a chart you start to learn how big waves can get before a reversal or consolidation period arrives.
You can become profitable with the indicator. But to be honest, my primary focus in making this indicator was find ways to visualise alot of data in a clear and beautiful way.
You should use the indicator with some out of the box ideas instead of just trusting the signals.
examples:
Find a head and shoulders pattern on the top of a huge honey wave.
Find a bottom small wave while the others honey waves are in the opposite direction for entering a pullback.
Use the honey for direction but the yellow and purple slope line crosses for entrys.
Comment your own strategys, I made this open source to be able to get community feedback.
The Honey Cypher waves are calculated in a similar way as the MACD histogram. I've combined MACD formula with some of the lazybear formula. It looks for the distance between 2 moving averages to find trend strength. After that the end results get's smoothed out. It is very satisfying to change that as you can see the honey waves create a melting like motion on each change of smoothing.
Below a preview of the honey cypher moving average lines, all lines have a length that is based on the fibonacci number sequence. Honey cypher measures the distance between for example length 5-8 averages.
I hope this inspires coders to create very beautiful scripts.

Leonidas Squeeze Momentum SystemThis indicator is based on LazyBear SQ Momentum Indicator and SQ Plus Indicator.
This indicator is using ADX and Squeeze Momentum Indicator.
When you see the ADX above 0 line and the slop is positive that means the trend is strong
When the ADX is below 0 line and the trend is weak you will see the slop negative and the color gray
When we see the SQ changing the color from Red to Yellow that means the sell pressure is decreasing this could be a potential buy signal
When we see the color changing from blue to dark blue that means the buy pressure is decreasing this could be a a potential sell signal
Bull/Bear divergences supported
Added SQ signal
this signal is an exponential moving average following the SQ main signal useful for filtering fake signals.
This indicator is very powerful but offers many fake signals it is recommended using this indicator with other indicators to confirm the entries

Strength Momentum IndicatorThis indicator is a fork of . It takes it a step further by including RSI and ADX information, which are represented in this indicator as follows:
MOM: The histogram itself is a linear regression curve, by default for the study period the Fibonacci series and exponential moving average were used. You can adjust the settings to your liking.
RSI: Whenever the RSI is outside the normal ranges (which you can adjust in the settings), the bar in the histogram will turn amber to warn you.
ADX: Crosses are drawn along the 0 line to indicate the ADX . Blue means that the ADX is below the trend level (adjustable in the settings), and orange means that it is above that level. Darker colors indicate that the ADX has risen from the previous bar, while lighter colors indicate that it has fallen.
Almost all of the normally adjustable values can be adjusted in the settings for each of the base indicators. Also adjustable:
The RSI alert levels (30 and 70 by default).
The ADX crossover, i.e. the point at which the ADX value is considered to indicate a strong trend (25 by default).
All colors, naturally.
Squeeze Momentum + Volatility [LeonidasCrypto]Based on Squeeze Momentum indicator by LazyBear
This custom version of SQ is part of my Trading System.
How to use it.
Please read the description of the original author of this indicator here.
Volatility .
When the market is contracting or sideways usually you will see red or blue dots.
Blue dots. the market is in sideways and the volatility is low.
Red dots. the market is in the climax of volatility usually after of a big move this is a potential signal the peak of the move is near.
I added volatility to SQ because I consider volatility is a key factor for trading to anticipate the moves.

Alpha Dynamic Momentum Index Pine@v=4- What Is Dynamic Momentum Index?
- The dynamic momentum index is a technical indicator used to determine if an asset is overbought or oversold. It can be used to generate trade signals in trending and ranging markets.
- The dynamic momentum index was developed by Tushar Chande and Stanley Kroll and is similar to the relative strength index (RSI). The main difference between the two is that the RSI uses a fixed number of time periods (usually 14) in its calculation, while the dynamic momentum index uses different time periods as volatility changes, typically between five and 30.
- The number of time periods used in the dynamic momentum index decreases as volatility in the underlying security increases, making this indicator more responsive to changing prices than the RSI. This is particularly useful when an asset's price moves quickly as it approaches key support or resistance levels. Because the indicator is more sensitive, traders can potentially find earlier entry and exit points than with the RSI, but it could also be more prone to whipsaws and false signals.

Natural Market Slope [CC]The Natural Market Slope was created by Jim Sloman and this is one of his many Ocean Indicators which I'm publishing thanks to receiving source materials from @altcoinz and @tmac87. I did completely rewrite the formula for this indicator but I commented out the original calculation so you can compare or just for study purposes. I like this version better because it is very smooth and the original formula is a bit faster with response but is very choppy in comparison.
This indicator was the basis for his Natural Market Combo which I will be publishing very soon so stay tuned for that. The idea behind all of his Natural indicators was to use the natural log of the current price in different ways. This indicator obviously focuses on the slope and it essentially becomes another momentum indicator which peaks when the upward momentum is gone and vice versa. Buy when the line turns green and sell when it turns red. I have added strong buy and sell signals in addition to the normal ones and strong signals are darker in color in comparison to the original lighter colors.
Let me know if there are any other indicators you would like to see me publish!
