Clenow MomentumClenow Momentum Method
The Clenow Momentum Method, developed by Andreas Clenow, is a systematic, quantitative trading strategy focused on capturing medium- to long-term price trends in financial markets. Popularized through Clenow’s book, Stocks on the Move: Beating the Market with Hedge Fund Momentum Strategies, the method leverages momentum—an empirically observed phenomenon where assets that have performed well in the recent past tend to continue performing well in the near future.
Theoretical Foundation
Momentum investing is grounded in behavioral finance and market inefficiencies. Investors often exhibit herding behavior, underreact to new information, or chase trends, causing prices to trend beyond fundamental values. Clenow’s method builds on academic research, such as Jegadeesh and Titman (1993), which demonstrated that stocks with high returns over 3–12 months outperform those with low returns over similar periods.
Clenow’s approach specifically uses **annualized momentum**, calculated as the rate of return over a lookback period (typically 90 days), annualized to reflect a yearly percentage. The formula is:
Momentum=(((Close N periods agoCurrent Close)^N252)−1)×100
- Current Close: The most recent closing price.
- Close N periods ago: The closing price N periods back (e.g., 90 days).
- N: Lookback period (commonly 90 days).
- 252: Approximate trading days in a year for annualization.
This metric ranks stocks by their momentum, prioritizing those with the strongest upward trends. Clenow’s method also incorporates risk management, diversification, and volatility adjustments to enhance robustness.
Methodology
The Clenow Momentum Method involves the following steps:
1. Universe Selection:
- A broad universe of liquid stocks is chosen, often from major indices (e.g., S&P 500, Nasdaq 100) or global exchanges.
- Filters should exclude illiquid stocks (e.g., low average daily volume) or those with extreme volatility.
2. Momentum Calculation:
- Stocks are ranked based on their annualized momentum over a lookback period (typically 90 days, though 60–120 days can be common tests).
- The top-ranked stocks (e.g., top 10–20%) are selected for the portfolio.
3. Volatility Adjustment (Optional):
- Clenow sometimes adjusts momentum scores by volatility (e.g., dividing by the standard deviation of returns) to favor stocks with smoother trends.
- This reduces exposure to erratic price movements.
4. Portfolio Construction:
- A diversified portfolio of 10–25 stocks is constructed, with equal or volatility-weighted allocations.
- Position sizes are often adjusted based on risk (e.g., 1% of capital per position).
5. Rebalancing:
- The portfolio is rebalanced periodically (e.g., weekly or monthly) to maintain exposure to high-momentum stocks.
- Stocks falling below a momentum threshold are replaced with higher-ranked candidates.
6. Risk Management:
- Stop-losses or trailing stops may be applied to limit downside risk.
- Diversification across sectors reduces concentration risk.
Implementation in TradingView
Key features include:
- Customizable Lookback: Users can adjust the lookback period in pinescript (e.g., 90 days) to align with Clenow’s methodology.
- Visual Cues: Background colors (green for positive, red for negative momentum) and a zero line help identify trend strength.
- Integration with Screeners: TradingView’s stock screener can filter high-momentum stocks, which can then be analyzed with the custom indicator.
Strengths
1. Simplicity: The method is straightforward, relying on a single metric (momentum) that’s easy to calculate and interpret.
2. Empirical Support: Backed by decades of academic research and real-world hedge fund performance.
3. Adaptability: Applicable to stocks, ETFs, or other asset classes, with flexible lookback periods.
4. Risk Management: Diversification and periodic rebalancing reduce idiosyncratic risk.
5. TradingView Integration: Pine Script implementation enables real-time visualization, enhancing decision-making for stocks like NVDA or SPY.
Limitations
1. Mean Reversion Risk: Momentum can reverse sharply in bear markets or during sector rotations, leading to drawdowns.
2. Transaction Costs: Frequent rebalancing increases trading costs, especially for retail traders with high commissions. This is not as prevalent with commission free trading becoming more available.
3. Overfitting Risk: Over-optimizing lookback periods or filters can reduce out-of-sample performance.
4. Market Conditions: Underperforms in low-momentum or highly volatile markets.
Practical Applications
The Clenow Momentum Method is ideal for:
Retail Traders: Use TradingView’s screener to identify high-momentum stocks, then apply the Pine Script indicator to confirm trends.
Portfolio Managers: Build diversified momentum portfolios, rebalancing monthly to capture trends.
Swing Traders: Combine with volume filters to target short-term breakouts in high-momentum stocks.
Cross-Platform Workflow: Integrate with Python scanners to rank stocks, then visualize on TradingView for trade execution.
Comparison to Other Strategies
Vs. Minervini’s VCP: Clenow’s method is purely quantitative, while Minervini’s Volatility Contraction Pattern (your April 11, 2025 query) combines momentum with chart patterns. Clenow is more systematic but less discretionary.
Vs. Mean Reversion: Momentum bets on trend continuation, unlike mean reversion strategies that target oversold conditions.
Vs. Value Investing: Momentum outperforms in bull markets but may lag value strategies in recovery phases.
Conclusion
The Clenow Momentum Method is a robust, evidence-based strategy that capitalizes on price trends while managing risk through diversification and rebalancing. Its simplicity and adaptability make it accessible to retail traders, especially when implemented on platforms like TradingView with custom Pine Script indicators. Traders must be mindful of transaction costs, mean reversion risks, and market conditions. By combining Clenow’s momentum with volume filters and alerts, you can optimize its application for swing or position trading.
"momentum" için komut dosyalarını ara

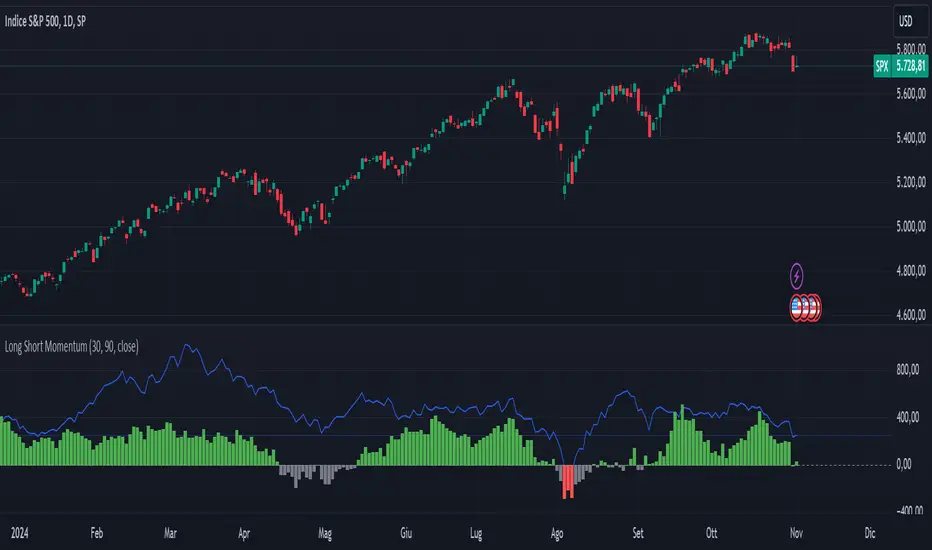
Long Short MomentumThis indicator is designed to visualize short-term and long-term momentum trends.The indicator calculates two momentum lines based on customizable lengths: a short momentum (Short Momentum) over a smaller period and a long momentum (Long Momentum) over a longer period. These lines are plotted relative to the chosen price source, typically the closing price.
The histogram, colored dynamically based on momentum direction, gives visual cues:
Green: Both short and long momentum are positive, indicating an upward trend.
Red: Both are negative, indicating a downward trend.
Gray: Mixed momentum, suggesting potential trend indecision.
Basic Polychromatic Momentum IndicatorBasic Polychromatic Momentum Indicator with alerts
PMI involves taking the difference between the current price and the price n periods ago, and then subtracting from it the difference between the current price and the price n periods ago, divided by n. This gives a smoothed version of the momentum indicator.
The user can also specify a smoothing factor using the "smoothing" input, which applies a simple moving average to the PMI. The resulting smoothed PMI is plotted on the chart in blue, with a dotted gray line at the zero level.

Polychromatic Momentum IndicatorPolychromatic Momentum is a generalized Momentum study considering a number of Momentum values controlled by the length input. The greatest weight is given to the most recent Momentum value, while the precedent values are given lesser weight. Each Momentum value is assigned weight equal to inverse square root of Momentum distance (number of bars prior to the current bar). Then the sum of the weighted Momentum values is divided by the sum of the square roots.

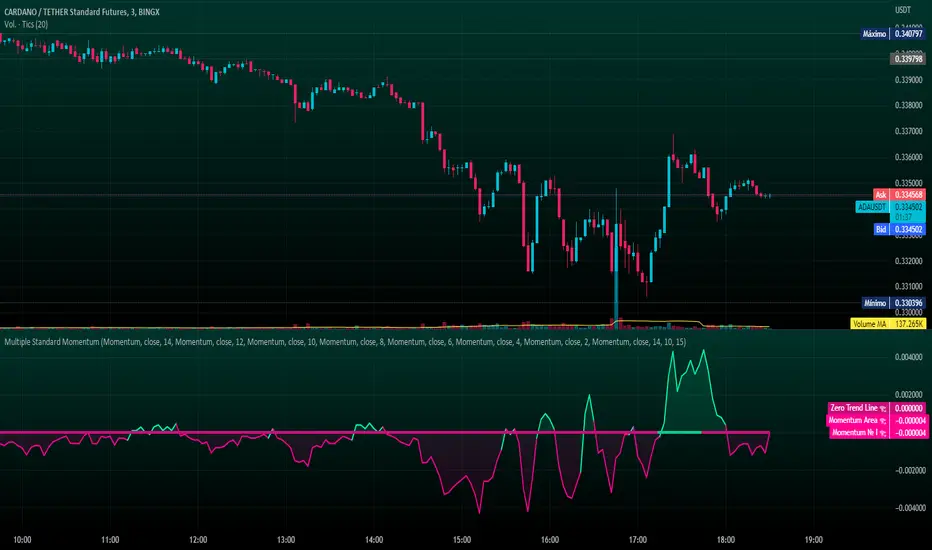
Multiple Standard MomentumMultiple Standard Momentum
The momentum indicator is a technical indicator that measures the speed and strength of the price movement of a financial asset. This indicator is used to identify the underlying strength of a trend and predict potential changes in price direction.
The calculation of the momentum indicator is based on the difference between the current price and the price of a previous period. The result is displayed on a chart, which can be positive or negative, depending on whether the current price is higher or lower than the price of the previous period. The indicator can be used on any time frame, but is generally used on short-term charts.
To use the momentum indicator , you look for two types of signals:
🔹 Crossover Signal – When the indicator crosses the zero line, it can signal a change of direction in the price trend.
🔹 Divergence – When the asset price moves in one direction and the indicator moves in the opposite direction, a divergence can be identified. This divergence may indicate a possible trend reversal.
COMPOSITION AND MODE OF USE OF THE INDICATOR
🔹 This indicator displays multiple Momentum levels on a single chart, allowing you to view multiple Momentum lines. Each level is represented on the chart where it can be hidden or shown as desired for better market analysis.
🔹 In addition, a zero trend line (also known as a horizontal trend line) has been added. The zero trend line is a horizontal line that indicates the point at which the current price equals the opening price, which allows users to draw a custom zero trend line on the chart using different colors and time periods of calculation.
* Highest performing custom setup for the Zero Trend Line. For Operations of:
- One Minute: Trend Line Time Frame = Five Minutes.
- Three Minutes: Trend Line Time Frame = Fifteen Minutes.
- Five Minutes: Trend Line Time Frame = Thirty Minutes.
- Fifteen Minutes: Trend Line Time Frame = Sixty Minutes.
Rules For Trading
🔹 Bullish:
* The Zero Trend Line must be in Green Color.
* When the Momentum Line Crosses the Zero Line from Bottom to Top.
🔹 Bearish:
* The Zero Trend Line must be in Red Color.
* When the Momentum Line Crosses the Zero Line from Top to Bottom.
In addition, parameters were defined to activate or deactivate the graphic signal taking into account the previous requirement (Bullish and Bearish):
🔹 Long or Buy = ▲
🔹 Short or Sell = ▼
This script can be used in different markets such as forex, indices, and cryptocurrencies for analysis and trading. However, it is important to note that no trading strategy is guaranteed to be profitable, and traders should always conduct their own research and risk management.
EMA Ribbon + ADX MomentumHere's a description for your TradingView indicator publication:
The EMA Ribbon + ADX Momentum indicator combines exponential moving averages (EMA) with the Average Directional Index (ADX) to identify strong trends and potential trading opportunities. This powerful tool offers:
🎯 Key Features:
EMA Ribbon (10, 21, 34, 55) for trend direction
ADX integration for trend strength confirmation
Clear visual signals with color-coded backgrounds
Real-time trend status display
Strength metrics with exact percentage values
📊 How It Works:
EMA Ribbon: Four EMAs form a ribbon pattern that shows trend direction through their stacking order
ADX Integration: Confirms trend strength when above the threshold (default 25)
Visual Signals:
Green background: Strong bullish trend
Red background: Strong bearish trend
Gray background: Neutral or weak trend
📈 Trading Signals:
STRONG BULL: EMAs properly stacked bullish + high ADX + DI+ > DI-
STRONG BEAR: EMAs properly stacked bearish + high ADX + DI- > DI+
BULL/BEAR TREND: Shows regular trend conditions without strength confirmation
NEUTRAL: No clear trend structure
🔧 Customizable Parameters:
ADX Length: Adjust trend calculation period
ADX Threshold: Modify strength confirmation level
ADX Panel Toggle: Show/hide the ADX indicator panel
💡 Best Uses:
Trend following strategies
Entry/exit timing
Trade confirmation
Market structure analysis
Risk management tool
This indicator helps traders identify not just trend direction, but also trend strength, making it particularly useful for both position entry timing and risk management. The clear visual signals and real-time metrics make it suitable for traders of all experience levels.
Note: As with all technical indicators, best results are achieved when used in conjunction with other forms of analysis and proper risk management.


Relative Strength and MomentumRelative Strength and Momentum Indicator
Unlock deeper market insights with the Relative Strength and Momentum Indicator—a powerful tool designed to help traders and investors identify the strongest stocks and sectors based on relative performance. This custom indicator displays essential information on relative strength and momentum for up to 15 different symbols, compared against a benchmark index, all within a clear and organized table format.
Key Features:
1. Customizable Inputs: Choose up to 15 symbols to compare, along with a benchmark index, allowing you to tailor the indicator to your trading strategy. The 'Lookback Period' input defines how many weeks of data are analyzed for relative strength and momentum.
2. Relative Strength Calculation: For each selected symbol, the indicator calculates the Relative Strength (RS) against the chosen benchmark. This RS is further refined using an exponential moving average (EMA) to smooth the results, providing a more stable trend overview.
3. Momentum Analysis: Momentum is determined by analyzing the rate of change in relative strength. The indicator calculates a momentum rank for each symbol, based on its relative strength’s improvement or deterioration.
4. Percentile Ranking System: Each symbol is assigned a percentile rank (from 1 to 100) based on its relative strength compared to the others. Similarly, momentum rankings are also assigned from 1 to 100, offering a clear understanding of which assets are outperforming or underperforming.
5. Visual Indicators:
a. Green: Signals improving or stable relative strength and momentum.
b. Red: Indicates declining relative strength or momentum.
c. Aqua: Highlights symbols performing well on both relative strength and momentum—ideal candidates for further analysis.
6. Two Clear Tables:
a. Relative Strength Rank Table: Displays weekly rankings of relative strength for each symbol.
b. Momentum Table: Shows momentum trends, helping you identify which symbols are gaining or losing strength.
7. Color-Coded for Easy Analysis: The tables are color-coded to make analysis quick and straightforward. A green color means the symbol is performing well in terms of relative strength or momentum, while red indicates weaker performance. Aqua marks symbols that are excelling in both areas.
Use Case:
a. Sector Comparison: Identify which sectors or indexes are showing both relative strength and momentum to pick high-potential stocks. This allows you to align with broader market trends for improved trade entries.
b. Stock Selection: Quickly compare symbols within the same sector to find the stronger performers.

Momentum Memory Indicator
The Momentum Memory Indicator (MMI) is a custom tool designed to predict future price movements based on the historical momentum of an asset. By calculating the Rate of Change (ROC) and then averaging it over a specified "memory" period, the MMI provides a prediction that reflects both recent and slightly older momentum data. The prediction is visualized as a histogram, with colors indicating the direction of the momentum.
**Parameters:**
1. **Rate of Change Period (ROC Period):** This parameter sets the period for the Rate of Change calculation, which measures the momentum of the asset. The default value is 14.
2. **Memory Period:** This parameter determines the period over which the average momentum is calculated. By considering momentum over this "memory" period, the indicator aims to provide a more stable and reliable prediction. The default value is 5.
**Logic:**
1. **Rate of Change (Momentum):** The ROC is calculated based on the asset's closing prices over the specified ROC period. It provides a measure of how much the price has changed over that period, indicating momentum.
2. **Average Momentum:** The average momentum is calculated by taking a simple moving average (SMA) of the ROC values over the memory period. This smoothens out the momentum data and provides a more stable value for prediction.
3. **Prediction:** The prediction is calculated by adjusting the current closing price based on the average momentum. This gives an estimate of where the price might be in the next period, assuming the momentum continues.
4. **Prediction Color:** The color of the prediction histogram is determined by the direction of the average momentum. A positive momentum results in a green histogram, while a negative momentum results in a red histogram.
**Plots:**
1. **Prediction (Histogram):** Represents the predicted price movement based on the average momentum. The direction and magnitude of the histogram bars provide insights into the expected price change. The color of the bars (green or red) indicates the direction of the momentum.
Momentum Bias Index [AlgoAlpha]Description:
The Momentum Bias Index by AlgoAlpha is designed to provide traders with a powerful tool for assessing market momentum bias. The indicator calculates the positive and negative bias of momentum to gauge which one is greater to determine the trend.
Key Features:
Comprehensive Momentum Analysis: The script aims to detect momentum-trend bias, typically when in an uptrend, the momentum oscillator will oscillate around the zero line but will have stronger positive values than negative values, similarly for a downtrend the momentum will have stronger negative values. This script aims to quantify this phenomenon.
Overlay Mode: Traders can choose to overlay the indicator on the price chart for a clear visual representation of market momentum.
Take-profit Signals: The indicator includes signals to lock in profits, they appear as labels in overlay mode and as crosses when overlay mode is off.
Impulse Boundary: The script includes an impulse boundary, the impulse boundary is a threshold to visualize significant spikes in momentum.
Standard Deviation Multiplier: Users can adjust the standard deviation multiplier to increase the noise tolerance of the impulse boundary.
Bias Length Control: Traders can customize the length for evaluating bias, enabling them to fine-tune the indicator according to their trading preferences. A higher length will give a longer-term bias in trend.

Momentum Variance OscillatorWhat MVO measures:
-PV (Price-Volume) Oscillator – how far price is from a volatility-scaled basis, then weighted by relative volume.
- > 0 = bullish pressure; < 0 = bearish pressure.
-|PV| larger ⇒ stronger momentum.
-Signal line (EMA of PV) – a smoother track of PV; crossings flag momentum shifts.
-Zero line gradient – instantly shows direction (greenish bull / reddish bear) and strength (paler → stronger).
-Extreme bands (±obLevel) – “hot zone” thresholds; being beyond them = exceptional push.
-Variance histogram – MACD-like view (PV minus slower PV-EMA) to see thrust building vs. fading.
-(Optional) Bar coloring & background tint – paints price bars and/or the panel on key events so you can read the regime at a glance.
-Auto-Tune – searches a grid of (obLevel, weakLvl) pairs and (optionally) auto-applies the best, ranked by CAGR vs. drawdown.
Core signals & how to trade them:
1) Define the regime:
-Bullish regime: PV above 0 and/or PV above Signal; zero line is in bull gradient.
-Bearish regime: PV below 0 and/or PV below Signal; zero line is in bear gradient.
-Action: Prefer trades with the regime (avoid fading strong color/strength unless you have a clear reversal setup).
2) Entries:
Momentum entry:
-Long: PV crosses above Signal while PV > 0.
-Short: PV crosses below Signal while PV < 0.
Breakout/acceleration:
-Long add-on: PV crosses above +obLevel (extreme top) and holds.
-Short add-on: PV crosses below −obLevel (extreme bottom) and holds.
-Histogram confirm: Growing bars in your direction = thrust improving; shrinking/flip = thrust stalling.
3) Exits / risk:
-Soft exit / tighten stops: PV loses the extreme and re-enters inside, or histogram fades/turns against you.
-Hard exit / reverse: Opposite PV↔Signal crossover and PV crosses the zero line.
-Weak zone filter: If |PV| < weakLvl, treat signals as lower quality (smaller size or skip).
4) Practical setup - Suggested defaults (good starting point):
-Signal length: 26
-Volume power: 0.50
-obLevel (extreme): 2.00
-weakLvl: 0.75
-Show histogram & dots: On
-Auto-Tune (recommended)
-Turn Auto-Select Best ON. MVO will scan obLevel 1.50→3.00 (step 0.05) and weakLvl 0.50→1.00 (step 0.05), then use the top-ranked pair (CAGR/(1+MDD)).
-If you want to see the top combos, enable the Optimizer Table (Top-3).
5) Visual options
-Bar Colors: Regime+Strength – bars follow the zero-line gradient (great for quick read).
-Extremes – paint only when beyond ±obLevel.
-Cross Signals – paint only on the bar that crosses an extreme.
-Background on breach: A one-bar tint when PV crosses an extreme.
6) Example playbook:
Long setup:
-Zero line shows bull gradient and PV > 0.
-PV crosses above Signal (entry).
-If PV drives above +obLevel, consider add-on; trail under the last minor swing or use ATR.
-Exit/trim on PV crossing below Signal or histogram turning negative; flatten on a drop through 0.
Short setup mirrors the above on the bear side.
7) Tips to avoid common traps:
-Don’t fade strong extremes without clear confirmation (e.g., PV re-entering inside + histogram flip).
-Respect the weak zone: if |PV| < weakLvl, signals are fragile—size down or wait.
-Align with structure: higher-timeframe trend and SR improve expectancy.
-Instrument personality matters: use Auto-Tune or re-calibrate obLevel/weakLvl across assets/timeframes.
8) Alerts you can set:
-Bull Signal X – PV crossed above Signal
-Bear Signal X – PV crossed below Signal
-Bull Baseline X – PV crossed above 0
-Bear Baseline X – PV crossed below 0

Momentum Index [BigBeluga]The Momentum Index is an innovative indicator designed to measure the momentum of price action by analyzing the distribution of positive and negative momentum values over a defined period. By incorporating delta-based calculations and smoothing techniques, it provides traders with a clear and actionable representation of market momentum dynamics.
🔵 Key Features:
Delta-Based Momentum Analysis:
Calculates the momentum of price by comparing its current state to its value from a defined number of bars back.
Inside a loop, it evaluates whether momentum values are above or below zero, producing a delta value that reflects the net momentum direction and intensity.
Double EMA Smoothing:
Smooths the raw delta-based momentum values with a double EMA filter, reducing noise and providing a clearer trend signal.
tmi(len) =>
sum = 0.0
sum1 = 0.0
above = 0.0
below = 0.0
src_ = src - src
for i = 0 to len
sum := sum + (src_ > nz(src_ ) ? 1 : -1)
sum1 := sum1 + (sum > 0 ? 1 : -1)
sum1 := emaEma(sum1, 10)
for i = 1 to len
above := above + (sum1 > 0 ? 1 : 0)
below := below + (sum1 > 0 ? 0 : 1)
Directional Momentum Signals:
Generates momentum shift signals and displays them on both the oscillator and the main chart:
- △ Aqua Triangles: Represent upward momentum shifts.
- ▽ Red Triangles: Represent downward momentum shifts.
Dynamic Gradient Display:
Highlights momentum zones with gradient fills:
- Aqua shades for positive momentum (above zero).
- Red shades for negative momentum (below zero).
Dashboard Display:
A dashboard summarizing the count of momentum values above and below zero for the defined period (Sentiment Length e.g. 100), helping traders assess market sentiment at a glance.
🔵 How It Works:
The indicator takes price momentum as its source and evaluates the number of momentum values above and below zero within a defined period.
The delta calculation aggregates this information, providing a net representation of the prevailing market momentum.
A double EMA filter is applied to the delta values, smoothing the momentum line and enhancing signal clarity.
Momentum shifts are highlighted with visual signals on the oscillator and price chart, while the gradient display provides a visual representation of intensity.
🔵 Use Cases:
Momentum Tracking: Identify whether market momentum is predominantly bullish or bearish.
Signal Confirmation: Use chart-based signals to confirm potential trend reversals or continuation.
Analyze Market Strength: Leverage the dashboard to quickly assess the distribution of momentum over the chosen period.
Overbought/Oversold Conditions: Utilize gradient zones to detect areas of momentum extremes and possible price exhaustion.
Momentum Index offers a refined approach to analyzing momentum dynamics, combining delta-based calculations with smoothing techniques and intuitive visuals, making it an essential tool for traders looking to anticipate market movements effectively.

Momentum Shift [Bigbeluga]
This indicator identifies momentum shifts using a smoothed momentum calculation. It plots dynamic shift zones consisting of five levels that expand or contract based on price action. When momentum rises, the indicator creates an upward shift zone, and when momentum falls, it generates a downward shift zone. The shift zones dynamically react to price, stopping extension when a level is crossed.
🔵Key Features:
Smoothed Momentum Calculation:
➣ Utilizes a Hull Moving Average (HMA) to smooth momentum and reduce noise.
➣ Identifies momentum shifts with crossovers between the current momentum value and its previous state.
➣ Uses a gradient color scheme to highlight momentum strength.
Dynamic Shift Zones:
➣ When momentum rises, the indicator plots an upper shift zone with five incremental levels.
➣ When momentum falls, a lower shift zone is formed with five descending levels.
➣ Each level within the shift zone represents a progressively stronger momentum shift.
Level Extension Control:
➣ Shift zones stop extending once a level is crossed by price.
➣ Levels closer to price act as key momentum resistance or support zones.
➣ If price retraces after a shift, the remaining levels stay intact for further reference.
Momentum Direction Indications:
➣ Labels (▲ and ▼) appear at momentum shift points to indicate rising or falling momentum.
🔵Usage:
Momentum-Based Entries: Identify momentum shifts early by using shift zones as confirmation for trade entries.
Trend Continuation & Exhaustion: Observe which shift levels price respects—if momentum shift zones hold, the trend may continue; if they break, momentum may reverse.
Dynamic Support & Resistance: Use the five-level shift zones as temporary support and resistance areas that adapt to momentum shifts.
Momentum Strength Analysis: If price moves through multiple shift levels in one direction, it signals strong momentum in that direction.
Momentum Shift is a powerful tool for traders looking to analyze momentum shifts with structured visual zones. By combining smoothed momentum calculations with dynamic shift zones, this indicator provides a clear view of market momentum and helps traders navigate price action effectively.

Momentum Percentage %A Percentage Momentum Indicator (oscillator) is a technical indicator which shows the trend direction and measures the pace of the price fluctuation by comparing current and past values. Normalized to be bounded to oscillate between 0 and 100 percent of recent price variation. As is, it average true range of an instrument can be easily compared to any other because of absolute percentage variation and not prices itselves.
The benefits of Percentage Momentum
It indicates volatility
It ideal to compare fluctuation and volatility between other assets
In assets that changes btw a large range of prices like crypto it's the best way to work with momentum.
It's the right way to work with algotrading.

Multi-timeframe MomentumThe Multi-timeframe momentum indicator is similar in concept to a velocity indicator like rate-of-change, but visualizes smoothed price changes by applying an EMA and linear regression to price difference at every bar. Momentums from 1 minute to 1 quarter are plotted on a single chart using the request.security function. Standard and Fibonacci timeframes are available as well as the ability to hide high-timeframes to keep the chart clean. Like any oscillator, divergence in the momentums can be used to identify price reversals in conjunction with support and resistance. When linear regression is applied, high and low inflection points are used to identify reversals in a manner similar to MACD.
Much love to DumpCap! The script is presented sans secret sauce.

Institutional Quantum Momentum Impulse [BullByte]## Overview
The Institutional Quantum Momentum Impulse (IQMI) is a sophisticated momentum oscillator designed to detect institutional-level trend strength, volatility conditions, and market regime shifts. It combines multiple advanced technical concepts, including:
- Quantum Momentum Engine (Hilbert Transform + MACD Divergence + Stochastic Energy)
- Fractal Volatility Scoring (GARCH + Keltner-based volatility)
- Dynamic Adaptive Bands (Self-adjusting thresholds based on efficiency)
- Market Phase Detection (Volume + Momentum alignment)
- Liquidity & Cumulative Delta Analysis
The indicator provides a Z-score normalized momentum reading, making it ideal for mean-reversion and trend-following strategies.
---
## Key Features
### 1. Quantum Momentum Core
- Combines Hilbert Transform, MACD divergence, and Stochastic Energy into a single composite momentum score.
- Normalized using a Z-score for statistical significance.
- Smoothed with EMA/WMA/HMA for cleaner signals.
### 2. Dynamic Adaptive Bands
- Upper/Lower bands adjust based on volatility and efficiency ratio .
- Acts as overbought/oversold zones when momentum reaches extremes.
### 3. Market Phase Detection
- Identifies bullish , bearish , or neutral phases using:
- Volume-Weighted MA alignment
- Fractal momentum extremes
### 4. Volatility & Liquidity Filters
- Fractal Volatility Score (0-100 scale) shows market instability.
- Liquidity Check ensures trades are taken in favorable spread conditions.
### 5. Dashboard & Visuals
- Real-time dashboard with key metrics:
- Momentum strength, volatility, efficiency, cumulative delta, and market regime.
- Gradient coloring for intuitive momentum visualization .
---
## Best Trade Setups
### 1. Trend-Following Entries
- Signal :
- QM crosses above zero + Market Phase = Bullish + ADX > 25
- Cumulative Delta rising (buying pressure)
- Confirmation :
- Efficiency > 0.5 (strong momentum quality)
- Liquidity = High (tight spreads)
### 2. Mean-Reversion Entries
- Signal :
- QM touches upper band + Volatility expanding
- Market Regime = Ranging (ADX < 25)
- Confirmation :
- Efficiency < 0.3 (weak momentum follow-through)
- Cumulative Delta divergence (price high but delta declining)
### 3. Breakout Confirmation
- Signal :
- QM holds above zero after a pullback
- Market Phase shifts to Bullish/Bearish
- Confirmation :
- Volatility rising (expansion phase)
- Liquidity remains high
---
## Recommended Timeframes
- Intraday (5M - 1H): Works well for scalping & swing trades.
- Swing Trading (4H - Daily): Best for trend-following setups.
- Position Trading (Weekly+): Useful for macro trend confirmation.
---
## Input Customization
- Resonance Factor (1.0 - 3.618 ): Adjusts MACD divergence sensitivity.
- Entropy Filter (0.382/0.50/0.618) : Controls stochastic damping.
- Smoothing Type (EMA/WMA/HMA) : Changes momentum responsiveness.
- Normalization Period : Adjusts Z-score lookback.
---
The IQMI is a professional-grade momentum indicator that combines institutional-level concepts into a single, easy-to-read oscillator. It works across all markets (stocks, forex, crypto) and is ideal for traders who want:
✅ Early trend detection
✅ Volatility-adjusted signals
✅ Institutional liquidity insights
✅ Clear dashboard for quick analysis
Try it on TradingView and enhance your trading edge! 🚀
Happy Trading!
- BullByte

Accelerating Dual Momentum ScoreThis is a score metric used by the Accelerating Dual Momentum strategy.
According to the website you referenced when you created, the strategy is as follows:
Strategy Rules
This strategy allocates 100% of of the portfolio to one asset each month.
1. On the last trading day of each month, calculate the “momentum score” for the S&P 500 ( SPY ) and the international small cap equities (SCZ). The momentum score is the average of the 1, 3, and 6-month total return for each asset.
2. If the momentum score of SCZ > SPY and is greater than 0, invest in SCZ.
3. If the momentum score of SPY > SCZ and is greater than 0, invest in SPY .
4. If neither momentum score is greater than 0, calculate the 1-month total return for long-term US Treasuries ( TLT ) and US TIPS (TIP). Invest in whichever has the higher return.
Source: portfoliodb.co

Momentum Structural AnalysisMomentum Structural Analysis (MSA‑style Oscillator)
This indicator implements a simple, MSA‑style momentum oscillator that measures how far price has moved above or below its own long‑term trend on the active timeframe, expressed in percentage terms. Instead of looking at raw price, it "oscillates" price around a timeframe‑appropriate simple moving average (SMA) and plots the percentage distance from that SMA as an orange line around a zero baseline. Zero means price is exactly at its structural trend; positive values mean price is extended above trend; negative values mean it is trading below trend.
The script automatically selects the SMA length based on the chart timeframe:
On daily charts it uses the configurable Daily SMA Length (default 252 trading days, roughly 1 year).
On weekly charts it uses Weekly SMA Length (default 208 weeks).
On monthly charts it uses Monthly SMA Length (default 120 months).
This approach is inspired by the ideas behind Momentum Structural Analysis (MSA), which studies where a market trades relative to long‑term moving averages and then treats the momentum line (the oscillator) as the primary object of analysis. The goal is to highlight structural overbought/oversold conditions and regime changes that are often clearer on momentum than on the raw price chart.
--------------------------------------------------
What the script computes and how it works
For each bar, the indicator:
Chooses an SMA length based on the current timeframe (daily/weekly/monthly).
Calculates the SMA of the close.
Computes the percentage distance:
\text{Diff %} = \frac{\text{Close} - \text{SMA}}{\text{SMA}} \times 100
Plots this Diff % as an orange line, with a dashed horizontal zero line as the base.
This produces a momentum oscillator that oscillates around zero and reflects the "structural" position of price versus its own long‑term mean.
--------------------------------------------------
How to use it on index charts (e.g., NIFTY50)
On indices like NIFTY50, use the indicator to see how stretched the index is versus its structural trend.
Typical uses:
Identify extremes: a). Historically high positive readings can signal euphoric, late‑stage conditions where risk is elevated. b). Deep negative readings can highlight panic/capitulation zones where downside may be exhausted.
Draw structural levels: a). Mark horizontal bands on the oscillator where past turns have occurred (e.g., +15%, −10%, etc. specific to NIFTY50). b). Watch how price behaves when the oscillator revisits these zones: repeated rejections can validate them as structural bounds; clean breaks can indicate a change of regime.
This is not a buy/sell signal generator by itself; it is a framework to understand where the index sits within its long‑term momentum structure and to support risk‑management decisions.
--------------------------------------------------
How to use it on ratio charts
Apply the same indicator to ratio symbols such as NIFTY50/GOLD, BANKNIFTY/NIFTY50, sector vs index, or any spread you plot as a ratio.
On a ratio chart:
The oscillator now measures relative momentum: how far that ratio is above or below its own long‑term mean.
High positive readings = strong outperformance of the numerator vs the denominator (e.g., equities strongly outperforming gold).
Deep negative readings = strong underperformance (e.g., equities structurally lagging gold).
This is very much in the spirit of MSA’s work on spreads between asset classes: it helps visualize major rotations (equities → gold, financials → commodities, etc.) and whether a relative‑performance trend is stretched, reverting, or breaking into a new phase.
--------------------------------------------------
Using multiple timeframes for better decisions
You can stack information across timeframes to get a more robust view:
Monthly : a). Use monthly charts to see secular/structural phases. b). Long multi‑year stretches above or below zero, and large bases or trendline breaks on the monthly oscillator, can mark major bull or bear cycles and big rotations between asset classes.
Weekly : a). Use weekly charts for the primary trend. b). Weekly structures (multi‑month highs/lows, channels, or trendlines on the oscillator) are useful for medium‑term positioning and for confirming or rejecting signals seen on the monthly view.
Daily : a). Use daily charts mainly for timing entries/exits once the higher‑timeframe direction is clear. b). Short‑term extremes on the daily oscillator that align with the larger weekly/monthly structure can offer better‑timed opportunities, while signals that contradict higher‑timeframe momentum are more likely to be noise.
--------------------------------------------------

ML - Momentum Index (Pivots)Building upon the innovative foundations laid by Zeiierman's Machine Learning Momentum Index (MLMI), this variation introduces a series of refinements and new features aimed at bolstering the model's predictive accuracy and responsiveness. Licensed under the Creative Commons Attribution-NonCommercial-ShareAlike 4.0 International License (CC BY-NC-SA 4.0), my adaptation seeks to enhance the original by offering a more nuanced approach to momentum-based trading.
Key Features :
Pivot-Based Analysis: Shifting focus from trend crosses to pivot points, this version employs pivot bars to offer a distinct perspective on market momentum, aiding in the identification of critical reversal points.
Extended Parameter Set: By integrating additional parameters for making predictions, the model gains improved adaptability, allowing for finer tuning to match market conditions.
Dataset Size Limitation: To ensure efficiency and mitigate the risk of calculation timeouts, a cap on the dataset size has been implemented, balancing between comprehensive historical analysis and computational agility.
Enhanced Price Source Flexibility: Users can select between closing prices or (suggested) OHLC4 as the basis for calculations, tailoring the indicator to different analysis preferences and strategies.
This adaptation not only inherits the robust framework of the original MLMI but also introduces innovations to enhance its utility in diverse trading scenarios. Whether you're looking to refine your short-term trading tactics or seeking stable indicators for long-term strategies, the ML - Momentum Index (Pivots) offers a versatile tool to navigate the complexities of the market.
For a deeper understanding of the modifications and to leverage the full potential of this indicator, users are encouraged to explore the tooltips and documentation provided within the script.
The Momentum Indicator calculations have been transitioned to the MLMomentumIndex library, simplifying the process of integration. Users can now seamlessly incorporate the momentumIndexPivots function into their scripts to conduct detailed momentum analysis with ease.

Risk-Adjusted Momentum Oscillator# Risk-Adjusted Momentum Oscillator (RAMO): Momentum Analysis with Integrated Risk Assessment
## 1. Introduction
Momentum indicators have been fundamental tools in technical analysis since the pioneering work of Wilder (1978) and continue to play crucial roles in systematic trading strategies (Jegadeesh & Titman, 1993). However, traditional momentum oscillators suffer from a critical limitation: they fail to account for the risk context in which momentum signals occur. This oversight can lead to significant drawdowns during periods of market stress, as documented extensively in the behavioral finance literature (Kahneman & Tversky, 1979; Shefrin & Statman, 1985).
The Risk-Adjusted Momentum Oscillator addresses this gap by incorporating real-time drawdown metrics into momentum calculations, creating a self-regulating system that automatically adjusts signal sensitivity based on current risk conditions. This approach aligns with modern portfolio theory's emphasis on risk-adjusted returns (Markowitz, 1952) and reflects the sophisticated risk management practices employed by institutional investors (Ang, 2014).
## 2. Theoretical Foundation
### 2.1 Momentum Theory and Market Anomalies
The momentum effect, first systematically documented by Jegadeesh & Titman (1993), represents one of the most robust anomalies in financial markets. Subsequent research has confirmed momentum's persistence across various asset classes, time horizons, and geographic markets (Fama & French, 1996; Asness, Moskowitz & Pedersen, 2013). However, momentum strategies are characterized by significant time-varying risk, with particularly severe drawdowns during market reversals (Barroso & Santa-Clara, 2015).
### 2.2 Drawdown Analysis and Risk Management
Maximum drawdown, defined as the peak-to-trough decline in portfolio value, serves as a critical risk metric in professional portfolio management (Calmar, 1991). Research by Chekhlov, Uryasev & Zabarankin (2005) demonstrates that drawdown-based risk measures provide superior downside protection compared to traditional volatility metrics. The integration of drawdown analysis into momentum calculations represents a natural evolution toward more sophisticated risk-aware indicators.
### 2.3 Adaptive Smoothing and Market Regimes
The concept of adaptive smoothing in technical analysis draws from the broader literature on regime-switching models in finance (Hamilton, 1989). Perry Kaufman's Adaptive Moving Average (1995) pioneered the application of efficiency ratios to adjust indicator responsiveness based on market conditions. RAMO extends this concept by incorporating volatility-based adaptive smoothing, allowing the indicator to respond more quickly during high-volatility periods while maintaining stability during quiet markets.
## 3. Methodology
### 3.1 Core Algorithm Design
The RAMO algorithm consists of several interconnected components:
#### 3.1.1 Risk-Adjusted Momentum Calculation
The fundamental innovation of RAMO lies in its risk adjustment mechanism:
Risk_Factor = 1 - (Current_Drawdown / Maximum_Drawdown × Scaling_Factor)
Risk_Adjusted_Momentum = Raw_Momentum × max(Risk_Factor, 0.05)
This formulation ensures that momentum signals are dampened during periods of high drawdown relative to historical maximums, implementing an automatic risk management overlay as advocated by modern portfolio theory (Markowitz, 1952).
#### 3.1.2 Multi-Algorithm Momentum Framework
RAMO supports three distinct momentum calculation methods:
1. Rate of Change: Traditional percentage-based momentum (Pring, 2002)
2. Price Momentum: Absolute price differences
3. Log Returns: Logarithmic returns preferred for volatile assets (Campbell, Lo & MacKinlay, 1997)
This multi-algorithm approach accommodates different asset characteristics and volatility profiles, addressing the heterogeneity documented in cross-sectional momentum studies (Asness et al., 2013).
### 3.2 Leading Indicator Components
#### 3.2.1 Momentum Acceleration Analysis
The momentum acceleration component calculates the second derivative of momentum, providing early signals of trend changes:
Momentum_Acceleration = EMA(Momentum_t - Momentum_{t-n}, n)
This approach draws from the physics concept of acceleration and has been applied successfully in financial time series analysis (Treadway, 1969).
#### 3.2.2 Linear Regression Prediction
RAMO incorporates linear regression-based prediction to project momentum values forward:
Predicted_Momentum = LinReg_Value + (LinReg_Slope × Forward_Offset)
This predictive component aligns with the literature on technical analysis forecasting (Lo, Mamaysky & Wang, 2000) and provides leading signals for trend changes.
#### 3.2.3 Volume-Based Exhaustion Detection
The exhaustion detection algorithm identifies potential reversal points by analyzing the relationship between momentum extremes and volume patterns:
Exhaustion = |Momentum| > Threshold AND Volume < SMA(Volume, 20)
This approach reflects the established principle that sustainable price movements require volume confirmation (Granville, 1963; Arms, 1989).
### 3.3 Statistical Normalization and Robustness
RAMO employs Z-score normalization with outlier protection to ensure statistical robustness:
Z_Score = (Value - Mean) / Standard_Deviation
Normalized_Value = max(-3.5, min(3.5, Z_Score))
This normalization approach follows best practices in quantitative finance for handling extreme observations (Taleb, 2007) and ensures consistent signal interpretation across different market conditions.
### 3.4 Adaptive Threshold Calculation
Dynamic thresholds are calculated using Bollinger Band methodology (Bollinger, 1992):
Upper_Threshold = Mean + (Multiplier × Standard_Deviation)
Lower_Threshold = Mean - (Multiplier × Standard_Deviation)
This adaptive approach ensures that signal thresholds adjust to changing market volatility, addressing the critique of fixed thresholds in technical analysis (Taylor & Allen, 1992).
## 4. Implementation Details
### 4.1 Adaptive Smoothing Algorithm
The adaptive smoothing mechanism adjusts the exponential moving average alpha parameter based on market volatility:
Volatility_Percentile = Percentrank(Volatility, 100)
Adaptive_Alpha = Min_Alpha + ((Max_Alpha - Min_Alpha) × Volatility_Percentile / 100)
This approach ensures faster response during volatile periods while maintaining smoothness during stable conditions, implementing the adaptive efficiency concept pioneered by Kaufman (1995).
### 4.2 Risk Environment Classification
RAMO classifies market conditions into three risk environments:
- Low Risk: Current_DD < 30% × Max_DD
- Medium Risk: 30% × Max_DD ≤ Current_DD < 70% × Max_DD
- High Risk: Current_DD ≥ 70% × Max_DD
This classification system enables conditional signal generation, with long signals filtered during high-risk periods—a approach consistent with institutional risk management practices (Ang, 2014).
## 5. Signal Generation and Interpretation
### 5.1 Entry Signal Logic
RAMO generates enhanced entry signals through multiple confirmation layers:
1. Primary Signal: Crossover between indicator and signal line
2. Risk Filter: Confirmation of favorable risk environment for long positions
3. Leading Component: Early warning signals via acceleration analysis
4. Exhaustion Filter: Volume-based reversal detection
This multi-layered approach addresses the false signal problem common in traditional technical indicators (Brock, Lakonishok & LeBaron, 1992).
### 5.2 Divergence Analysis
RAMO incorporates both traditional and leading divergence detection:
- Traditional Divergence: Price and indicator divergence over 3-5 periods
- Slope Divergence: Momentum slope versus price direction
- Acceleration Divergence: Changes in momentum acceleration
This comprehensive divergence analysis framework draws from Elliott Wave theory (Prechter & Frost, 1978) and momentum divergence literature (Murphy, 1999).
## 6. Empirical Advantages and Applications
### 6.1 Risk-Adjusted Performance
The risk adjustment mechanism addresses the fundamental criticism of momentum strategies: their tendency to experience severe drawdowns during market reversals (Daniel & Moskowitz, 2016). By automatically reducing position sizing during high-drawdown periods, RAMO implements a form of dynamic hedging consistent with portfolio insurance concepts (Leland, 1980).
### 6.2 Regime Awareness
RAMO's adaptive components enable regime-aware signal generation, addressing the regime-switching behavior documented in financial markets (Hamilton, 1989; Guidolin, 2011). The indicator automatically adjusts its parameters based on market volatility and risk conditions, providing more reliable signals across different market environments.
### 6.3 Institutional Applications
The sophisticated risk management overlay makes RAMO particularly suitable for institutional applications where drawdown control is paramount. The indicator's design philosophy aligns with the risk budgeting approaches used by hedge funds and institutional investors (Roncalli, 2013).
## 7. Limitations and Future Research
### 7.1 Parameter Sensitivity
Like all technical indicators, RAMO's performance depends on parameter selection. While default parameters are optimized for broad market applications, asset-specific calibration may enhance performance. Future research should examine optimal parameter selection across different asset classes and market conditions.
### 7.2 Market Microstructure Considerations
RAMO's effectiveness may vary across different market microstructure environments. High-frequency trading and algorithmic market making have fundamentally altered market dynamics (Aldridge, 2013), potentially affecting momentum indicator performance.
### 7.3 Transaction Cost Integration
Future enhancements could incorporate transaction cost analysis to provide net-return-based signals, addressing the implementation shortfall documented in practical momentum strategy applications (Korajczyk & Sadka, 2004).
## References
Aldridge, I. (2013). *High-Frequency Trading: A Practical Guide to Algorithmic Strategies and Trading Systems*. 2nd ed. Hoboken, NJ: John Wiley & Sons.
Ang, A. (2014). *Asset Management: A Systematic Approach to Factor Investing*. New York: Oxford University Press.
Arms, R. W. (1989). *The Arms Index (TRIN): An Introduction to the Volume Analysis of Stock and Bond Markets*. Homewood, IL: Dow Jones-Irwin.
Asness, C. S., Moskowitz, T. J., & Pedersen, L. H. (2013). Value and momentum everywhere. *Journal of Finance*, 68(3), 929-985.
Barroso, P., & Santa-Clara, P. (2015). Momentum has its moments. *Journal of Financial Economics*, 116(1), 111-120.
Bollinger, J. (1992). *Bollinger on Bollinger Bands*. New York: McGraw-Hill.
Brock, W., Lakonishok, J., & LeBaron, B. (1992). Simple technical trading rules and the stochastic properties of stock returns. *Journal of Finance*, 47(5), 1731-1764.
Calmar, T. (1991). The Calmar ratio: A smoother tool. *Futures*, 20(1), 40.
Campbell, J. Y., Lo, A. W., & MacKinlay, A. C. (1997). *The Econometrics of Financial Markets*. Princeton, NJ: Princeton University Press.
Chekhlov, A., Uryasev, S., & Zabarankin, M. (2005). Drawdown measure in portfolio optimization. *International Journal of Theoretical and Applied Finance*, 8(1), 13-58.
Daniel, K., & Moskowitz, T. J. (2016). Momentum crashes. *Journal of Financial Economics*, 122(2), 221-247.
Fama, E. F., & French, K. R. (1996). Multifactor explanations of asset pricing anomalies. *Journal of Finance*, 51(1), 55-84.
Granville, J. E. (1963). *Granville's New Key to Stock Market Profits*. Englewood Cliffs, NJ: Prentice-Hall.
Guidolin, M. (2011). Markov switching models in empirical finance. In D. N. Drukker (Ed.), *Missing Data Methods: Time-Series Methods and Applications* (pp. 1-86). Bingley: Emerald Group Publishing.
Hamilton, J. D. (1989). A new approach to the economic analysis of nonstationary time series and the business cycle. *Econometrica*, 57(2), 357-384.
Jegadeesh, N., & Titman, S. (1993). Returns to buying winners and selling losers: Implications for stock market efficiency. *Journal of Finance*, 48(1), 65-91.
Kahneman, D., & Tversky, A. (1979). Prospect theory: An analysis of decision under risk. *Econometrica*, 47(2), 263-291.
Kaufman, P. J. (1995). *Smarter Trading: Improving Performance in Changing Markets*. New York: McGraw-Hill.
Korajczyk, R. A., & Sadka, R. (2004). Are momentum profits robust to trading costs? *Journal of Finance*, 59(3), 1039-1082.
Leland, H. E. (1980). Who should buy portfolio insurance? *Journal of Finance*, 35(2), 581-594.
Lo, A. W., Mamaysky, H., & Wang, J. (2000). Foundations of technical analysis: Computational algorithms, statistical inference, and empirical implementation. *Journal of Finance*, 55(4), 1705-1765.
Markowitz, H. (1952). Portfolio selection. *Journal of Finance*, 7(1), 77-91.
Murphy, J. J. (1999). *Technical Analysis of the Financial Markets: A Comprehensive Guide to Trading Methods and Applications*. New York: New York Institute of Finance.
Prechter, R. R., & Frost, A. J. (1978). *Elliott Wave Principle: Key to Market Behavior*. Gainesville, GA: New Classics Library.
Pring, M. J. (2002). *Technical Analysis Explained: The Successful Investor's Guide to Spotting Investment Trends and Turning Points*. 4th ed. New York: McGraw-Hill.
Roncalli, T. (2013). *Introduction to Risk Parity and Budgeting*. Boca Raton, FL: CRC Press.
Shefrin, H., & Statman, M. (1985). The disposition to sell winners too early and ride losers too long: Theory and evidence. *Journal of Finance*, 40(3), 777-790.
Taleb, N. N. (2007). *The Black Swan: The Impact of the Highly Improbable*. New York: Random House.
Taylor, M. P., & Allen, H. (1992). The use of technical analysis in the foreign exchange market. *Journal of International Money and Finance*, 11(3), 304-314.
Treadway, A. B. (1969). On rational entrepreneurial behavior and the demand for investment. *Review of Economic Studies*, 36(2), 227-239.
Wilder, J. W. (1978). *New Concepts in Technical Trading Systems*. Greensboro, NC: Trend Research.

Momentum ChannelbandsThe "Momentum Channelbands" is indicator that measures and displays an asset's momentum. It includes options to calculate Bollinger Bands and Donchian Channels around the momentum. Users can customize settings for a comprehensive view of momentum-related insights. This tool helps assess trend strength, identify overbought/oversold conditions, and pinpoint highs/lows. It should be used alongside other indicators due to potential lag and false signals.

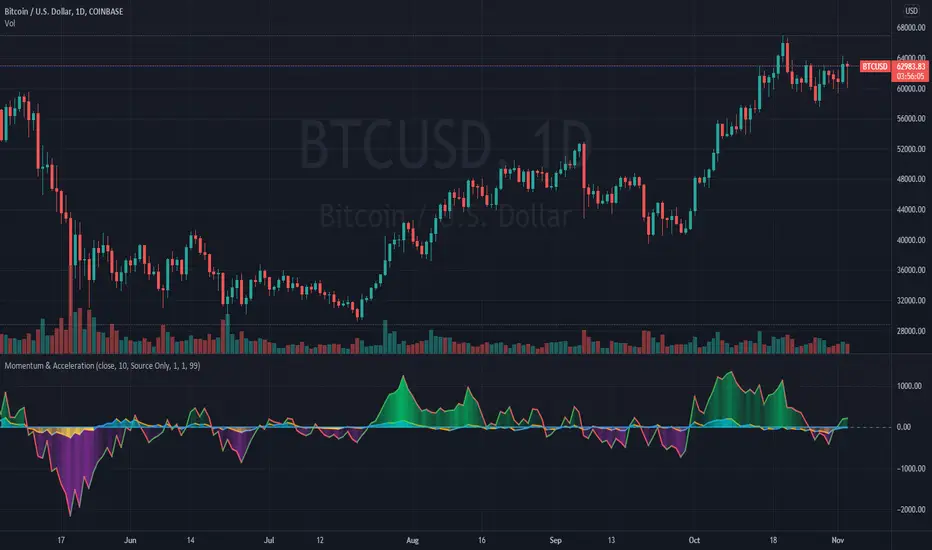
Momentum and AccelerationThe following oscillator is a twist on momentum, incorporating a 2nd derivative "acceleration" to help determine changes in momentum. Both are plotted directly accessing previous series values rather than using a moving average.
The script has an option to divide so the formula is d(Price)/d(Time), like a derivative. The script also provides options for the user to use their price source, volume, or a combination of price and volume.
Credit: This script utilizes the "color gradient framework" tutorial by LucF (PineCoders) to create user-adjustable gradient visuals.
Definitions
"1st Derivative - Momentum" - Momentum is most commonly referred to as a rate and measures the acceleration of the price and/or volume of a security.
"2nd Derivative - Acceleration" - Acceleration is the rate of change of momentum.
Value Added
This script may help the trader to assess directional changes in momentum easier.
This script also plots using previous series values rather than using a moving average function. To my knowledge, I was unable to find one that does this for "2nd derivative", so it had to be created.